reliability r& doe program review. 2008 annual program review … · · 2013-09-20presented...
TRANSCRIPT

Slide 1
Reliability R&D
Austin Airport Marriott South
Austin, TX April 22-24, 2008
DOE Program Reviewfor April 2007-March 2008
M. A. Quintana,
Sandia National Labs
S. R. Kurtz,
National Renewable Energy Lab
NREL/PR520-43214Presented at the Solar Energy Technologies Program (SETP) Annual Program Review Meeting held April 22-24, 2008 in Austin, Texas

Slide 2
Outline
Relevance to the SAI•Key metric: levelized cost of electricity (LCOE)
•Reliability is needed to calculate LCOE
•Collaboration with SAI participants and other industry
Project Specific Information•Past year Activities
•Past year Accomplishments
Plans for coming year•Planned support for SAI
•Other plans for coming year

Slide 3
SAI key metric is LCOE
LCOE = total cost/total electricityFor this calculation we require:
• Predictable performance• Predictable cost

Slide 4
Ideal Expectations vs Real Experience
To predict LCOE we need to understand reliability
Competitive LCOE:• High energy
production• Low degradation
rates• High availability• Low initial costs• Low operational
costs• Low replacement
costs
1.0
0.8
0.6
0.4
0.2
0.0
Rel
ativ
e pe
rform
ance
or c
ost
20151050
Year
Performance
Maintenance cost

Slide 5
Understanding reliability needs1. System owner/operator with a Power Purchase Agreement
• Availability?• Maintainability?• Performance?• Good safety record
2. Integrators• No call backs?
3. Module manufacturers• Zero product returns?• No major recalls?
4. Inverter manufacturers• Zero product returns?• No major recalls?
5. BOS manufacturers• State of denial?
Continue to build consumer confidence with excellent reliability record
Slide 6
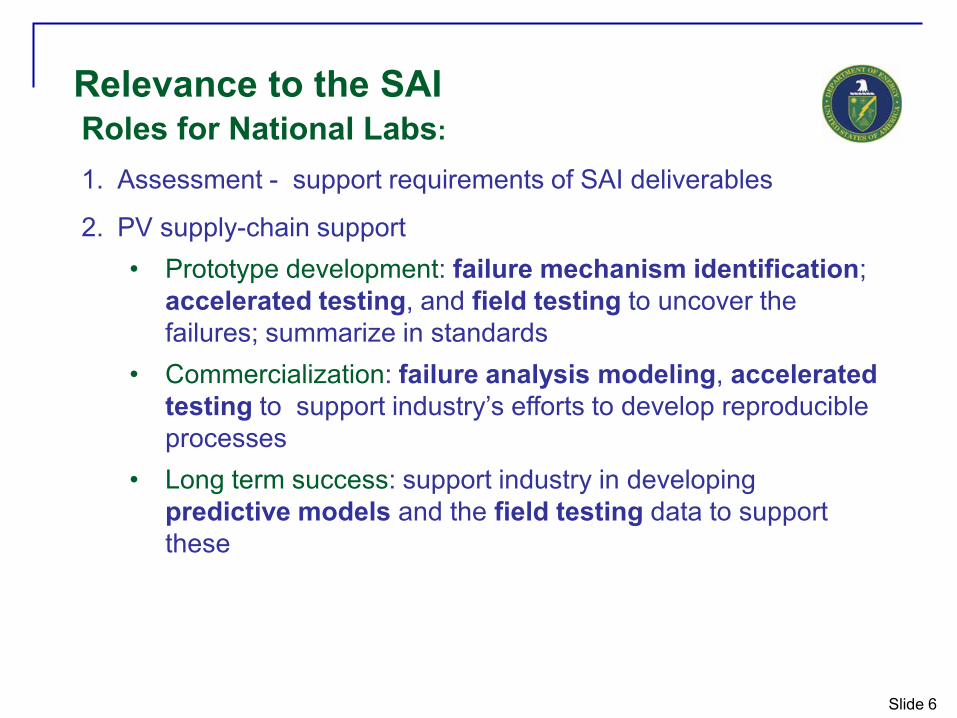
Relevance to the SAIRoles for National Labs:
1. Assessment - support requirements of SAI deliverables
2. PV supply-chain support• Prototype development: failure mechanism identification;
accelerated testing, and field testing to uncover the failures; summarize in standards
• Commercialization: failure analysis modeling, accelerated testing to support industry’s efforts to develop reproducible processes
• Long term success: support industry in developing predictive models and the field testing data to support these

Slide 7
Working with industry:
We propose to balance
need for secrecy with
benefit of sharing information by:
Keep proprietary:• Existence of problem
before solution developed• Solutions to problems
Share: • Possible failure modes• Tests to identify failures
A clear, common understanding of this framework provides a strong foundation for partnerships

Slide 8
Reliability has been expanded and linked across the entire program
PREDICT
DETECT MITIGATE
Quantify Lifetime &ReliabilityParameters
Build, Apply, &Validate SystemReliability Model
Identify & Evaluate Mitigation Techniques Apply Mitigation
Approaches inDesign/Production
Perform Failure Mode Effects Analyses Identify and
Confirm Failure Modes
Three major elements will be applied across materials, components and systems.

Slide 9
NREL corePV ReliabilityExpertise +
Meas & Char + Metrology + Resource
Assessment
SNL core PV ReliabilityExpertise + System and Engineering Resources
Reliability Program Interacts with Other Important Organizations
Test Labs
Field Test Sites
StandardsCommittees
Industry

Slide 10
Project Scope - FY08
FY08 Plans1. Failure Modes and Effects Analysis: Apply to c-Si modules, CIGS, and
inverter to define and/or understand and review potential failure modes
2. Fault Tree Analysis: Define foreseeable/undesirable system events
3. Long-Term Exposure (field tests): Invest in understanding degradation of newer products/technologies
4. Accelerated Tests: Increase development of tests that address new technologies and greater understanding of mature technologies
5. Test-to-failure Protocols: Develop and apply protocols to quantitatively compare performance of different designs
6. Predictive Model: Develop data needs and model architecture
We seek commercial partner(s) for these

Slide 11
Project develops basis for predictive model
Predictive ModelField testing
Failure mechanismidentification
Accelerated testing
Failure analysismodeling

Slide 12
FY08 Research Activities Org. Budget($K)
Accelerated Life Testing & Analysis NRELSNL
1935630
Industry Reliability & Codes NRELSNL
475445
Module Screening & Field Evaluation NRELSNL
1945320
SLP Model & Failure Analysis SNLNREL
645270
FY07/FY08 Budgets
FY07 Research Activities Org. Budget($K)
Cell and Module Stability & Reliability NREL 1219
Module and Array Testing (includes some T&E) NRELSNL
1940530
Module Failure Analysis NREL 460

Slide 13
AccomplishmentsAssessments in support of SAI:1. Discussions/planning with most TPPs and incubators
2. Temperature cycling test completed for SolFocus
3. Module baseline testing and humidity freeze testing of junction boxes for GreenRay
4. Soliant reliability assessment (ongoing)
PV Supply-chain support:1. Accelerated Aging workshop
2. Accelerated testing
3. Test-to-failure protocol
4. Failure mode analyses begun (c-Si, CIGS, inverter)
5. Initiated model as basis for reliability prediction

Slide 14
SAI support - SolFocus (Incubator)
Stress: temperature cycling
Accelerated testing

Slide 15
SAI support - GreenRay (TPP)
Humidity freeze tests at Sandia
SNL screened six junction box configurations.
Accelerated testing

Slide 16
April 1-2, 2008• 115 participants from ∼50 companies• CPV, CIGS, a-Si, CdTe, c-Si, inverter, BOS, materials, and
systems companies• All Technology Pathway Partners and Incubators represented• Participants ranged from start-ups to mature companies• Three universities represented
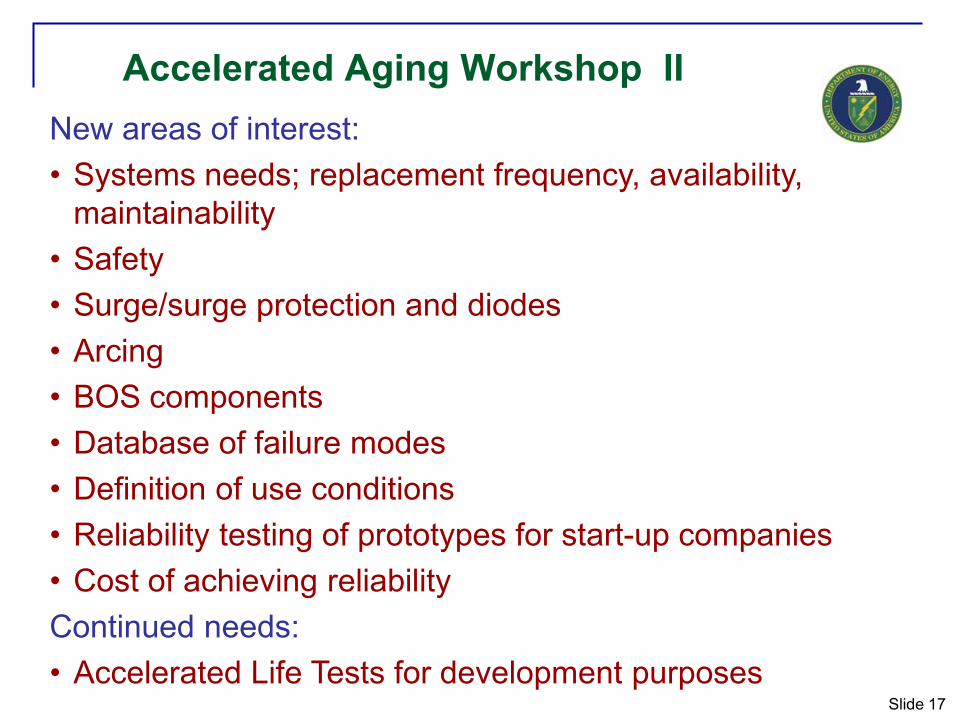
Accelerated Aging Workshop II
Slide 17
Accelerated Aging Workshop IINew areas of interest:• Systems needs; replacement frequency, availability,
maintainability• Safety• Surge/surge protection and diodes• Arcing • BOS components• Database of failure modes• Definition of use conditions• Reliability testing of prototypes for start-up companies• Cost of achieving reliabilityContinued needs:• Accelerated Life Tests for development purposes

Slide 18
Accelerated aging workshop: portfolio
Si Thin films CPV Inverter/BOS
Test component materials
Design for reliability
Accelerated testing of prototypes
Long-term testing of modules
Predict performance of system
Technology
Stage of development
Consumer relies on all of the above to assess LCOE
Slide 19
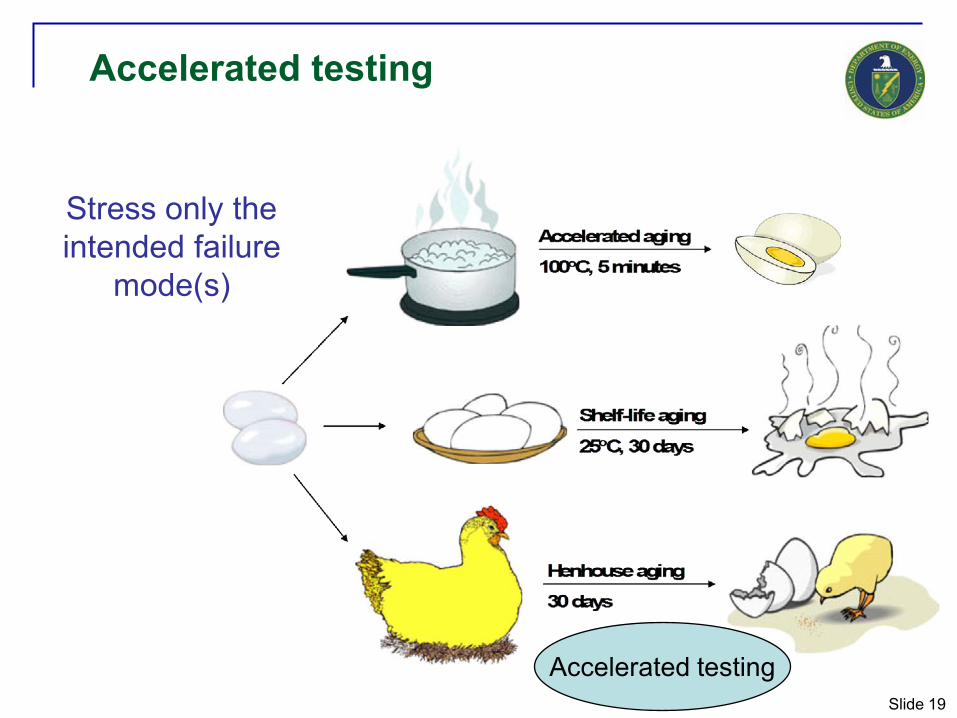
Accelerated testing
Stress only the intended failure
mode(s)
Accelerated testing
Slide 20
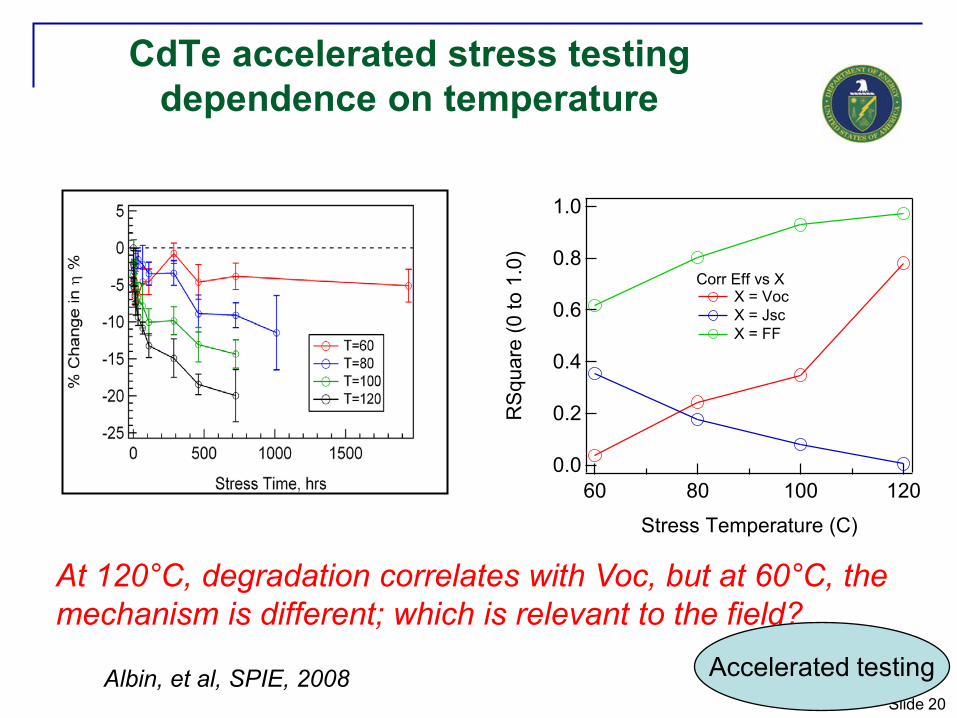
CdTe accelerated stress testing dependence on temperature
Albin, et al, SPIE, 2008
1.0
0.8
0.6
0.4
0.2
0.0
RS
quar
e (0
to 1
.0)
1201008060
Stress Temperature (C)
Corr Eff vs X X = Voc X = Jsc X = FF
At 120°C, degradation correlates with Voc, but at 60°C, the mechanism is different; which is relevant to the field?
Accelerated testing

Slide 21
Stability of 2 Konarka OPV cells
050
100150200250300350400450
0 50 100 150 200 250
#1#8
Hours of 85/85 damp heat
Voc
(mV)
@ L
ow L
ight
QuickTime™ and aTIFF (Uncompressed) decompressor
are needed to see this picture.
QuickTime™ and aTIFF (Uncompressed) decompressor
are needed to see this picture.
McMahon & Konarka, unpublished
1-sun I-V data not yet available
IR images, forward bias
Low light Voc and IR images predict future failure of 1 cell
Accelerated testing

Slide 22
Study of encapsulant adhesion
Adhesion retained longer when glass contains Ce that blocks UV B radiation
Kempe, et al, Solar Energy Materials 91, (2007) p. 315-329
60°C/60% humidity; 2.5 suns UV
Accelerated testing

Slide 23
Study of encapsulant effect on cell efficiency after 8800 hrs @ 85°C/0% humidity
Cells encapsulated with silicone are more stable than those using EVA
Kempe, et al, IEEE PVSC, 2008
delta
Eff
-6
-5
-4
-3
-2
-1
0
EVA/Glass EVA/Tefzel Silicone/Glass Silicone/Tefzel
CIGS cell
Encapsulant
Glass
Accelerated testing
Slide 24
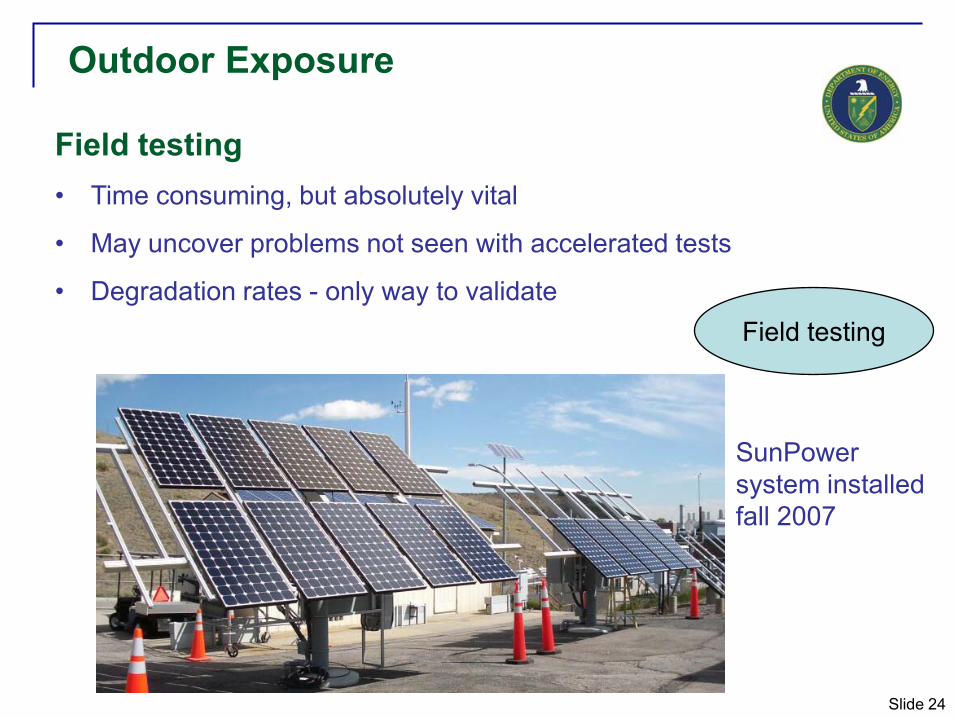
Outdoor Exposure
Field testing• Time consuming, but absolutely vital
• May uncover problems not seen with accelerated tests
• Degradation rates - only way to validate
SunPower system installed fall 2007
Field testing

Slide 25
Module/array degradation rates
Degradation rates calculated from monthly linear regression
• Power rating @ 1000 W/m2, 20°C ambient, 1 m/s wind speed
• For Schott Solar, > four years of data implies -0.4%/yr
• Enables LCOE calculation
Field testing

Slide 26
Objective:– Quantitative testing of failure rates
Approach:– Leverages years of experience with qualitative testing– Repeat stress test multiple times; record time of failure– In-situ monitoring can pinpoint time of failure
Test-to-failure protocol
Osterwald, http://www.nrel.gov/docs/fy08osti/42893.pdf
Characterize Stress
Document point of failureAccelerated testing

Slide 27
Two new environmental chambers
Osterwald, et al.
Will be able to handle up to 6’ X 12’ module
Accelerated testing

Slide 28
FMEA is a bottom-up approach to systematically identify, analyze and document possible failure modes within a design and the effects of such failures on system performance and personnel safety.
Failure Modes and Effects Analysis
Objectives:• Identify dominant failure mechanisms• Develop theoretical models that predict failure• Identify candidate items for accelerated life tests• Identify “costs and actions”—operations/maintenance/replacementsApproach:• Field data will be used to identify potential failure mechanisms• Subject Matter Experts examine and review the materials used to build
components• Potential Failure Mechanisms will be identified and ranked based on
perceived risk
Failure analysismodeling

Slide 29
Applying XFMEA and Lab Expertise

Slide 30
Applying XFMEA and Lab Expertise

Slide 31
Applying XFMEA and Lab Expertise

Slide 32
Applying XFMEA and Lab Expertise
Input:Selected ItemFunctionFailureEffectCause

Slide 33
Database: E:\photovoltaic project\FMEA\c-Si\Crystalline Silicon Device.rx4Project: Crystalline Silicon Device
Selected Items:3 - Cell Strings3.4 - Ribbons3.5 - Busbars3.6 - Insulation (Dielectric Material)3.7 - Solar Cell3.7.17 - Silicon substrate3.7.18 - Dopant3.7.19 - Metallization lines3.7.19.20 - Bus lines3.7.19.21 - Gridlines3.7.22 - Backsurface Field3.7.24 - Silicon Nitride
High Priority Causes:
Medium Priority Causes:electromigration (Item: 3 - Cell Strings) Sev = 5, Occ = 1deterioration of metallization adhesion (corrosion) (Item: 3.7 - Solar Cell) Sev = 4, Occ = 2metallization diffusion or migration (Item: 3.7 - Solar Cell) Sev = 4, Occ = 1Cracked cell (Item: 3.7 - Solar Cell) Sev = 4, Occ = 2Cracked cell (Item: 3.7 - Solar Cell) Sev = 5, Occ = 2Full delamination of metallization lines (Item: 3.7 - Solar Cell) Sev = 5, Occ = 1Partial delamination of metallization lines (Item: 3.7 - Solar Cell) Sev = 4, Occ = 2Broken bus bar (Item: 3 - Cell Strings) Sev = 5, Occ = 1Broken ribbon (Item: 3 - Cell Strings) Sev = 5, Occ = 1Short circuit to ground (fault current) (Item: 3 - Cell Strings) Sev = 5, Occ = 1Solder bond failure (Item: 3 - Cell Strings) Sev = 5, Occ = 2Increased series resistance due to solder joint degradation & or failure at gridline interface (Item: 3 - Cell Strings) Sev = 3, Occ = 4Decreased power in a single cell (Item: 3 - Cell Strings) Sev = 3, Occ = 3Corrosion (Item: 3 - Cell Strings) Sev = 5, Occ = 1Shunting (cell to cell shorting) (Item: 3 - Cell Strings) Sev = 3, Occ = 2One or more cracked cells (Item: 3 - Cell Strings) Sev = 3, Occ = 5Fatigue due to thermal cycling (Item: 3 - Cell Strings) Sev = 3, Occ = 4
Low Priority Causes:encapsulation material leaching (Item: 3.7 - Solar Cell) Sev = 2, Occ = 1contamination from plating or corrosion products (Item: 3.7 - Solar Cell) Sev = 2, Occ = 1
0
5
1
2
3
4
0 51 2 3 4
Occurrence/Severity Matrix (Initial Ratings)
Severity
Occ
urre
nce
Low Priority LinHigh Priority Li
x3
x6x2
x2
x2
Identifying High Risk Elements
Output allows prioritization of
highest level risks based on occurrence
and severity

Slide 34
Objective:– Quantify reliability/availability for a system– Determine life cycle cost of system
Approach:– Reliability Block Diagrams and– Fault Tree Analysis
Tools:– Reliasoft Block Sim 7, Weibull++, and ALTA– Computer-Aided Fault Tree Analysis (CAFTA)
A system reliability model is a diagrammatic representation of all functions, in terms of subsystem or component events, that must occur for a successful system operation.
System Reliability Modeling
Service life prediction--a time period in which the system degrades to a specified unreliability
Predictive Model

Slide 35
GroundFault
Protector
DCFuse
Sw itch
A CFuse
Sw itch
MainServ icePanel
Inv erter UtilitySw itch
PV A rray
[A ] PVModule
[A ] PVModule
[A ] PVModule
[A ] PVModule
[A ] PVModule
[A ] PVModule
[S:1] PVModule
[S:2] PVModule
Reliability Block Diagram (RBD)• RBD: used to quantify System
Level Reliability for a specified period of time.
• Model can be used to predict the number of failures
• Develop maintenance schedules/spares inventory
• Identifies "weak link(s)"
• Identifies designs for maintainability/availability
• Identification of major contributors to the unreliability
• Trade-offs between cost and unreliability
• Predictions for unscheduled maintenance cost
Predictive Model
Slide 36
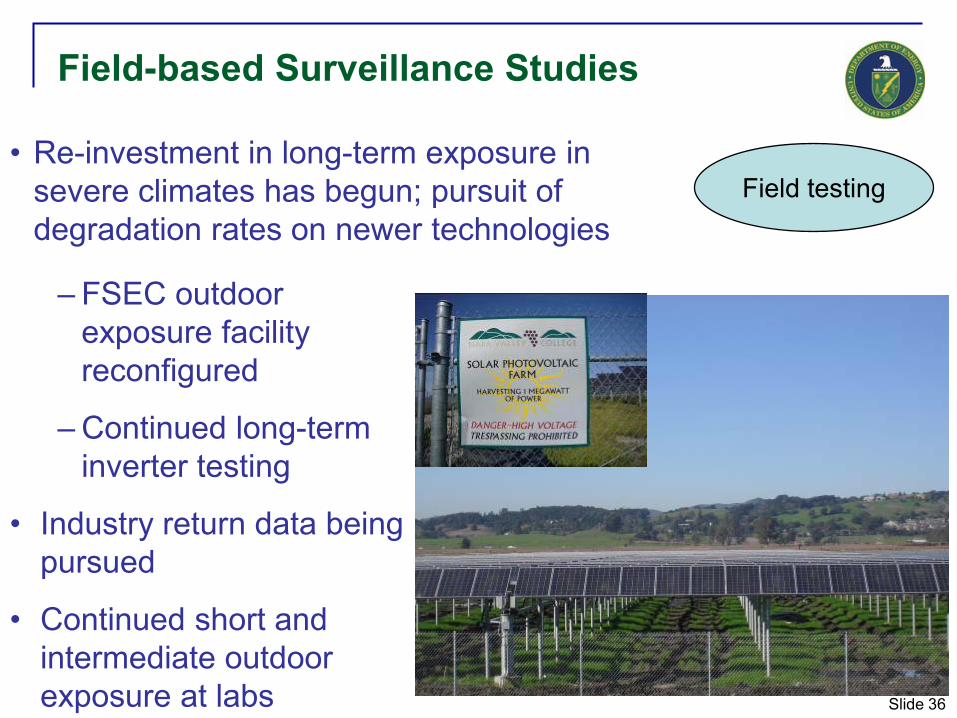
Field-based Surveillance Studies
Field testing
– FSEC outdoor exposure facility reconfigured
– Continued long-term inverter testing
• Industry return data being pursued
• Continued short and intermediate outdoor exposure at labs
• Re-investment in long-term exposure in severe climates has begun; pursuit of degradation rates on newer technologies
Slide 37
• FTA is a system-to-component top down analysis.
– Undesired behavior/event at the system level is hypothesized
– Events at subsequent lower levels are identified that can produce undesired behavior
• Blocks in the RBD that do not have enough data available for quantification will be analyzed with FTA.
– Objective is to identify lower level data that may be available to allow quantification.
• If the fault tree is developed sufficiently FTA may provide insight into those manufacturing processes that influence field reliability.
Fault Tree Analysis (FTA)
Failure analysismodeling

Slide 38
Example of Early Fault Tree Analysis
FTA can be applied to the component or the system level
Failure analysismodeling
Slide 39
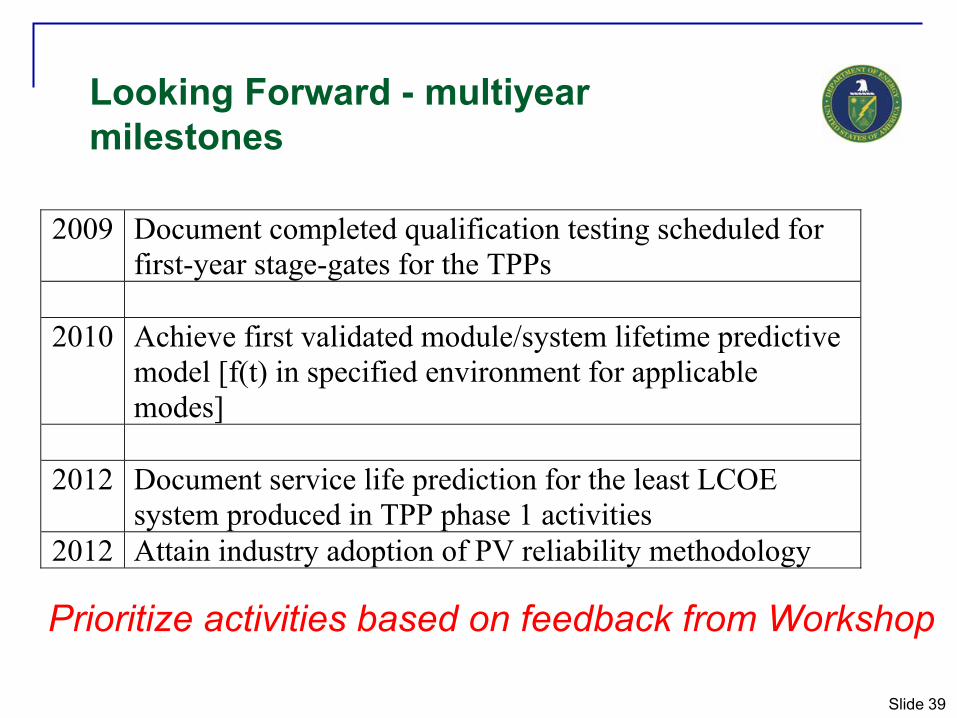
Looking Forward - multiyear milestones
2009 Document completed qualification testing scheduled for first-year stage-gates for the TPPs
2010 Achieve first validated module/system lifetime predictive
model [f(t) in specified environment for applicable modes]
2012 Document service life prediction for the least LCOE
system produced in TPP phase 1 activities 2012 Attain industry adoption of PV reliability methodology
Prioritize activities based on feedback from Workshop
Slide 40
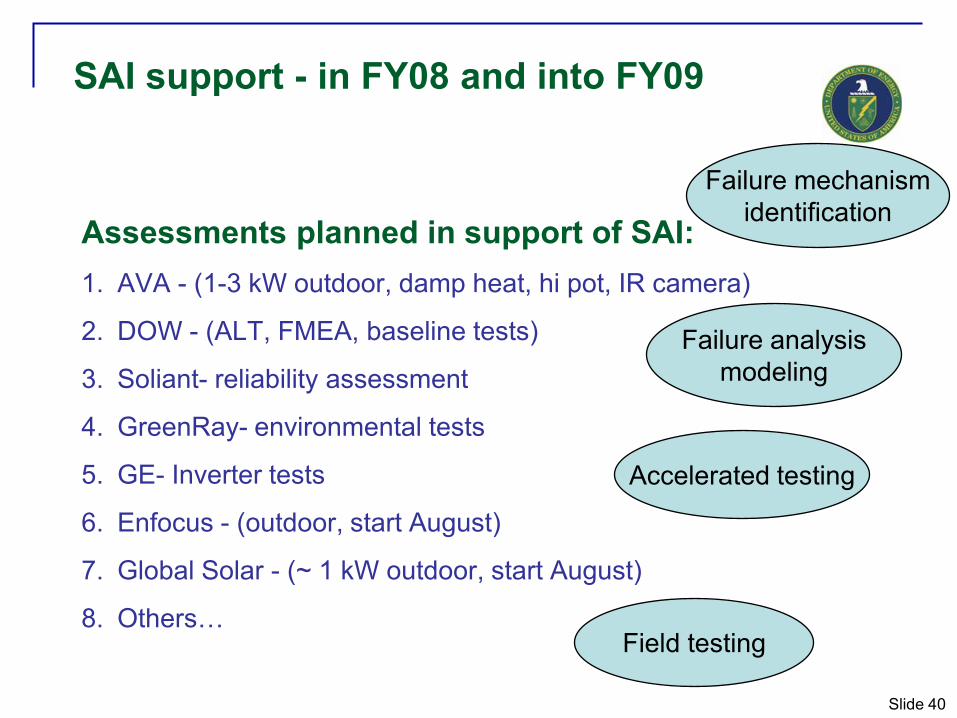
SAI support - in FY08 and into FY09
Assessments planned in support of SAI:1. AVA - (1-3 kW outdoor, damp heat, hi pot, IR camera)
2. DOW - (ALT, FMEA, baseline tests)
3. Soliant- reliability assessment
4. GreenRay- environmental tests
5. GE- Inverter tests
6. Enfocus - (outdoor, start August)
7. Global Solar - (~ 1 kW outdoor, start August)
8. Others…
Accelerated testing
Field testing
Failure mechanismidentification
Failure analysismodeling

Slide 41
Looking ForwardSNL1. Complete generic FMEA’s for Inverters, c-Si, and CIGS and obtain
industry input
2. Develop accelerated tests based on FMEA analyses
3. Continue to work with Tucson Electric on FTA for system model and pursue alternative partner(s) as appropriate
4. Continue development of predictive model architecture developing data needs (field/accelerated test data) and integrating needs into the rest of the reliability effort
5. Capture data/information that provides a better understanding of emerging systems reliability issues with proliferation of PPA business models
6. Increase fielded installation assessments to capture real-world system reliability experience/issues

Slide 42
Looking Forward
NREL1. Identification and analysis of failure mechanisms in collaboration
with industry
2. Accelerated testing to provide understanding of importance of stress factors
3. Accelerated testing to define time-to-failure
4. Field testing to define long-term degradation rates
5. Partnerships to help the community benefit from collective field data

Slide 43
• Adjust programmatic direction to address issues (leveraging investments when possible):
– Partner with companies that have interest/information to provide early responses and long term solutions
– Pursue needs that create market and/or technology growth
– Facilitate solutions that the PV community is best suited to address
• Follow-on activities
– Complete report on FY08’s accelerated aging workshop
– Develop smaller forum(s) to expand technology specific needs in FY09
– Conduct short reliability seminars for Market Transformation, Systems Engineering, and Systems Modeling teams to create synergy, leverage investments, and eliminate any duplication of efforts
Adjust project direction to reflect workshop input

Slide 44
Sharing the wealth of information
Share reliability data to better understand long-term reliability
1. Define data to be collected
2. Define data collection method
3. Identify how to protect proprietary data
4. Implement plan
Industry participation is vital!
Field testing

Slide 45
Expand CPV testing
CPV participation at Accelerated Aging Workshop was new this year and enthusiastic - National Labs will respond to this
1. Cell testing
2. Accelerated testing
3. Outdoor testingAccelerated testing
Field testing

Slide 46
• Reliability needs span the entire breadth of the supply-chain– MaterialsComponents Systems Users/Owners/Purchasers
• Needs are not uniform across technologies or applications
• Finite funding will require prioritization• SAI needs are increasing demands on the
reliability project• Accelerated Aging Workshop has provided a
wealth of input as well as opportunities
Summary