reliability prediction using bayesian updating of on … · - constant failure rate was chosen for...
TRANSCRIPT
Reliability Prediction Using Bayesian Updating of On-Orbit Performance
By: Nancy.L Lindsev .. GSFC Code 322, Nancy Rackley -B-Line Express inc., Aron Brali I eRE/MBA - ARES, and Ali Mosleh; PhD - Prediction Techno!ogies, Inc. (UrvlD)
qrd..d_,..,( SPACE FUGHT CENTER
1 H1NIIXPRISS
....... 1; .. 1.' ...
" !to :: ~ ~,,~~ CORPORAT ION
https://ntrs.nasa.gov/search.jsp?R=20130009069 2018-07-20T18:08:09+00:00Z
qrd.. dA"" SPACE FUGHT CENTER
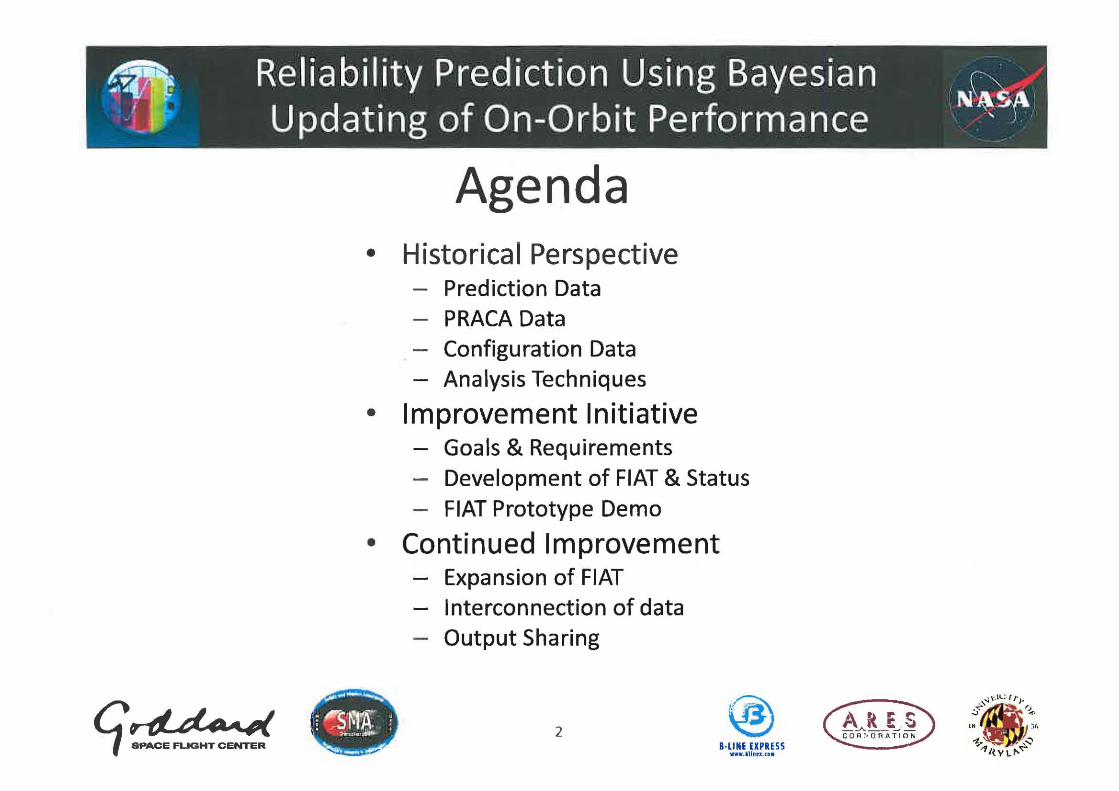
Agenda • Historical Perspective
- Prediction Data - PRACA Data - Configuration Data - Analysis Techniques
• Improvement Initiative Goals & Requirements
- Development of FIAT & Status - FIAT Prototype Demo
• Continued Improvement - Expansion of FIAT
Interconnection of data - Output Sharing
2 a·L1NE EXPRESS
WW • • _U IU,' . "
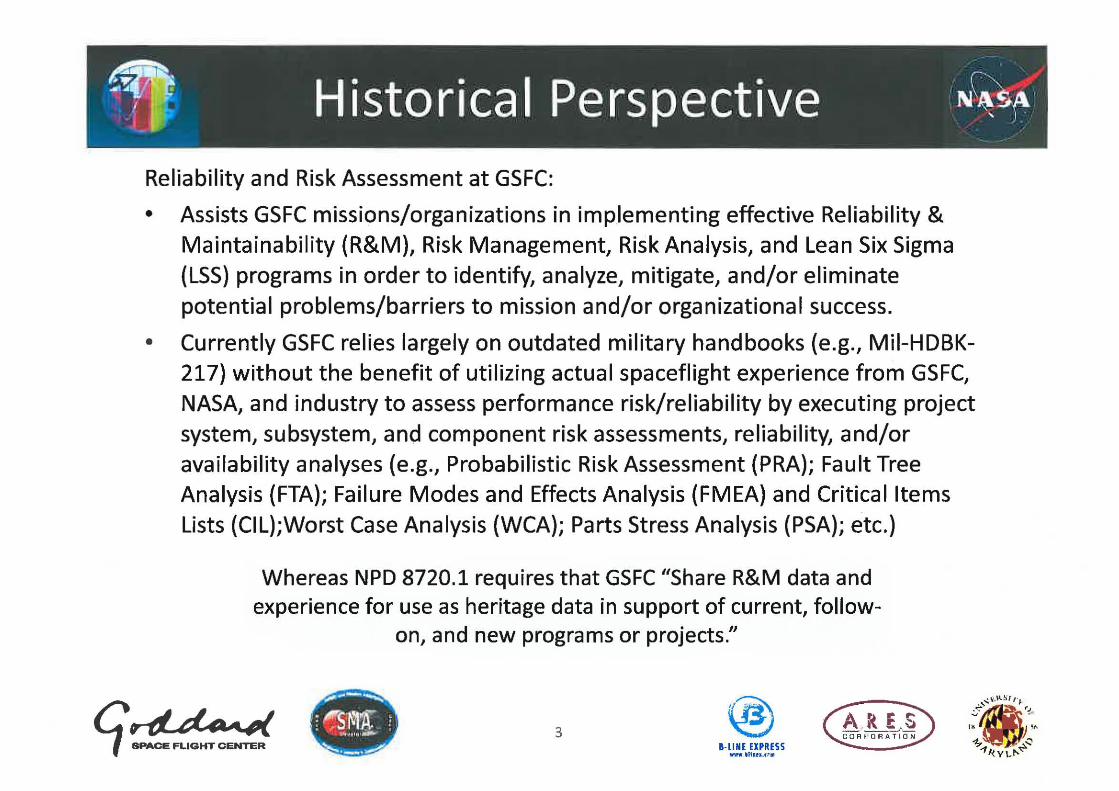
Reliability and Risk Assessment at GSFC:
• Assists GSFC missions/organizations in implementing effective Reliability & Maintainability (R&M), Risk Management, Risk Analysis, and Lean Six Sigma (LSS) programs in order to identify, analyze, mitigate, and/or eliminate potential problems/barriers to mission and/or organizational success.
• Currently GSFC relies largely on outdated military handbooks (e.g., Mil-HDBK-217) without the benefit of utilizing actual spaceflight experience from GSFC, NASA, and industry to assess performance risk/reliability by executing project system, subsystem, and component risk assessments, reliability, and/or availability analyses (e.g., Probabilistic Risk Assessment (PRA); Fault Tree Analysis (FTA); Failure Modes and Effects Analysis (FMEA) and Critical Items Lists (CIL);Worst Case Analysis (WCA); Parts Stress Analysis (PSA); etc.)
Whereas NPD 8720.1 requires that GSFC "Share R&M data and experience for use as heritage data in support of current, follow
on, and new programs or projects."
qrlLd_"" SPACE FLIGHT CENTER
3 B-LlNE EXPRESS
WWW."tl rl.""
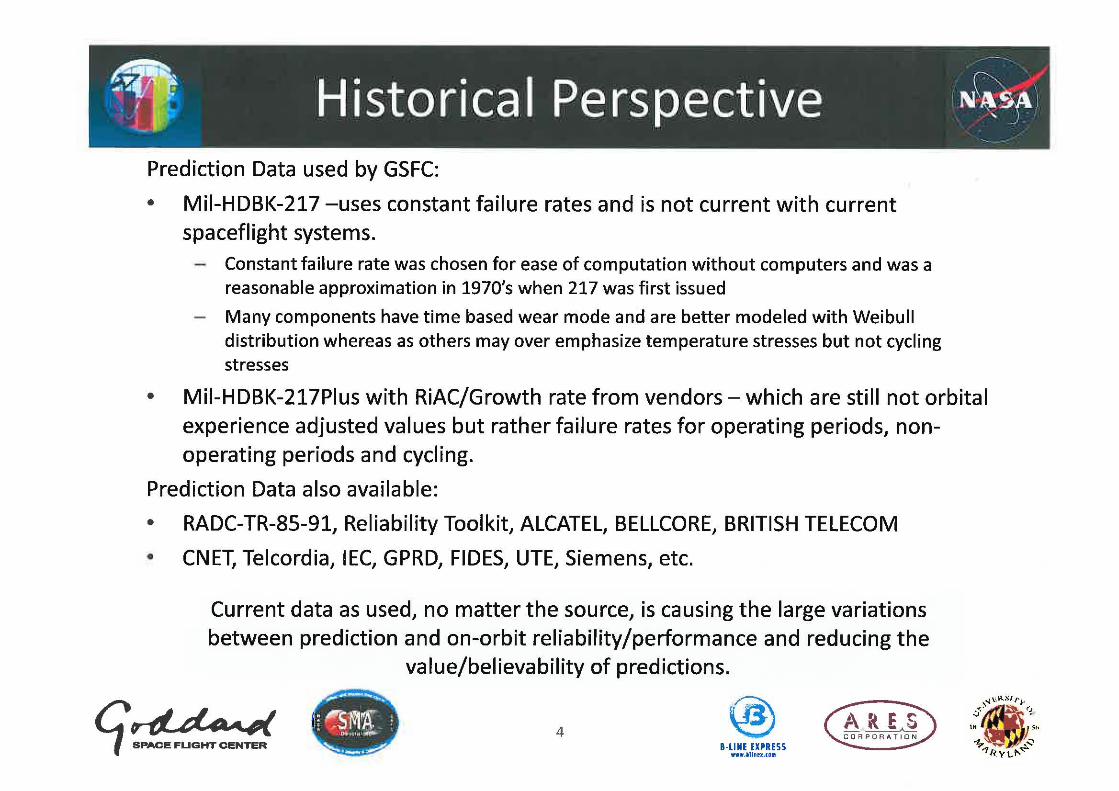
Prediction Data used by GSFC:
• Mil-HDBK-217 -uses constant failure rates and is not current with current spaceflight systems.
- Constant failure rate was chosen for ease of computation without computers and was a reasonable approximation in 1970's when 217 was first issued
- Many components have time based wear mode and are better modeled with Weibull distribution whereas as others may over emphasize temperature stresses but not cycling stresses
• Mil-HDBK-217Plus with RiAC/Growth rate from vendors - which are still not orbital experience adjusted values but rather failure rates for operating periods, nonoperating periods and cycling.
Prediction Data also available:
• RADC-TR-85-91, Reliability Toolkit, ALCATEL, BELLCORE, BRITISH TELECOM
• CNET, Telcordia, IEC, GPRD, FIDES, UTE, Siemens, etc.
Current data as used, no matter the source, is causing the large variations between prediction and on-orbit reliability/performance and reducing the
value/believability of predictions.
qrd.da""( SPACE FUGHT CENTER
4 a-LlNIIXPRISS
www •• nn~x.IGIII
Issues with MIL-HDBK-217:
• Data for latest versions at least 15 years out of date with no valid models for modern integrated circuits, detectors, lasers, etc.
• Per 217F Notice 2: "This Handbook is for Guidance Only - Do not Cite this Document as a Requirement."
• Per memo dated February 15, 1996 by Gilbert F. Decker, Assistant Secretary of the Army (Research, Development and Acquisition)
The best RFP's will directly specify performance-based reliability requirements and avoid citing any specification, standard or handbook.
In particular, MIL HDBK 217, Reliability Prediction of Electronic Equipment, is not to appear in an RFP as it has been shown to be unreliable and its use can lead to erroneous and misleading reliability predictions.
MIL-HDBK-217 provides little accuracy for predicting Reliability of electronic hardware, especially spacecraft hardware
qrd..d."" SPACE FLIGHT CENTER
5 B-LlNE EXPRESS __ ._llu. ,(,,:,
A ~ .. c: ~\. t:.~
~-~-CORPon ATION
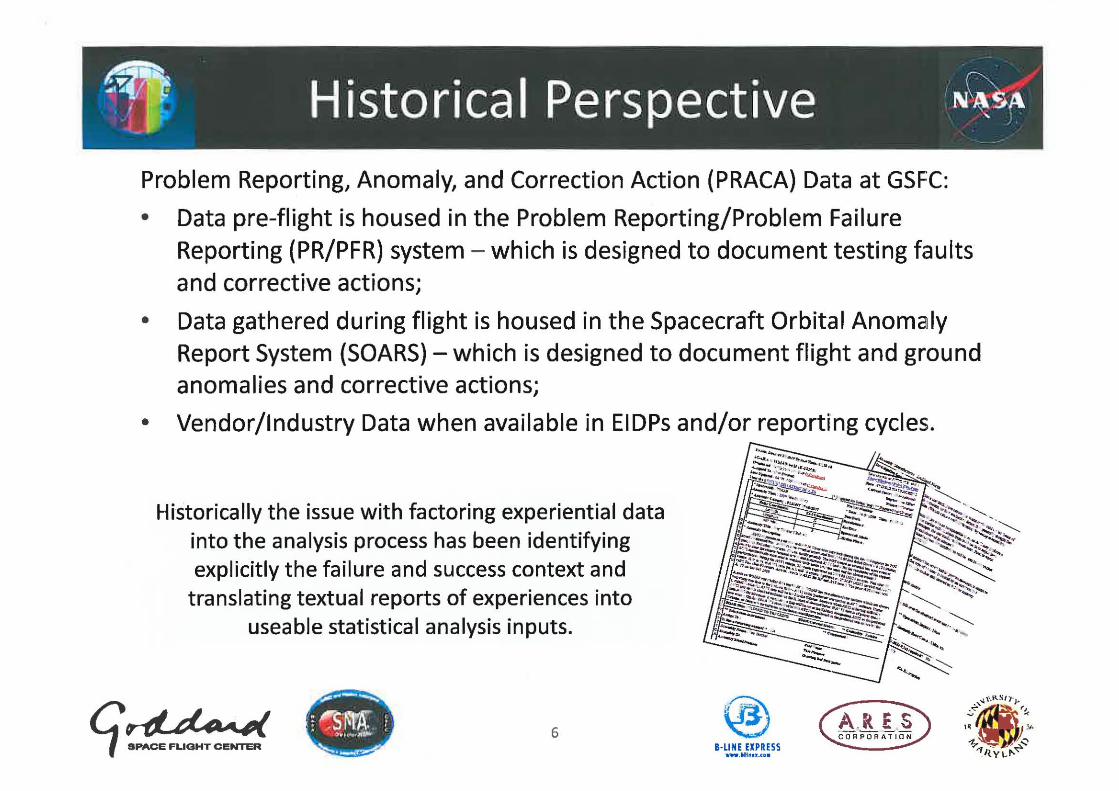
Problem Reporting, Anomaly, and Correction Action (PRACA) Data at GSFC:
• Data pre-flight is housed in the Problem Reporting/Problem Failure Reporting (PR/PFR) system - which is designed to document testing faults and corrective actions;
• Data gathered during flight is housed in the Spacecraft Orbital Anomaly Report System (SOARS) - which is designed to document flight and ground anomalies and corrective actions;
• Vendor/Industry Data when available in EIDPs and/or reporting cycles.
Historically the issue with factoring experiential data into the analysis process has been identifying explicitly the failure and success context and
translating textual reports of experiences into useable statistical analysis inputs.
qriJ..d.'V'l SPACE FLIGHT CENTER
6
{'i.i\ ~
B-LINE EXPRESS www .• lt ftu .U.
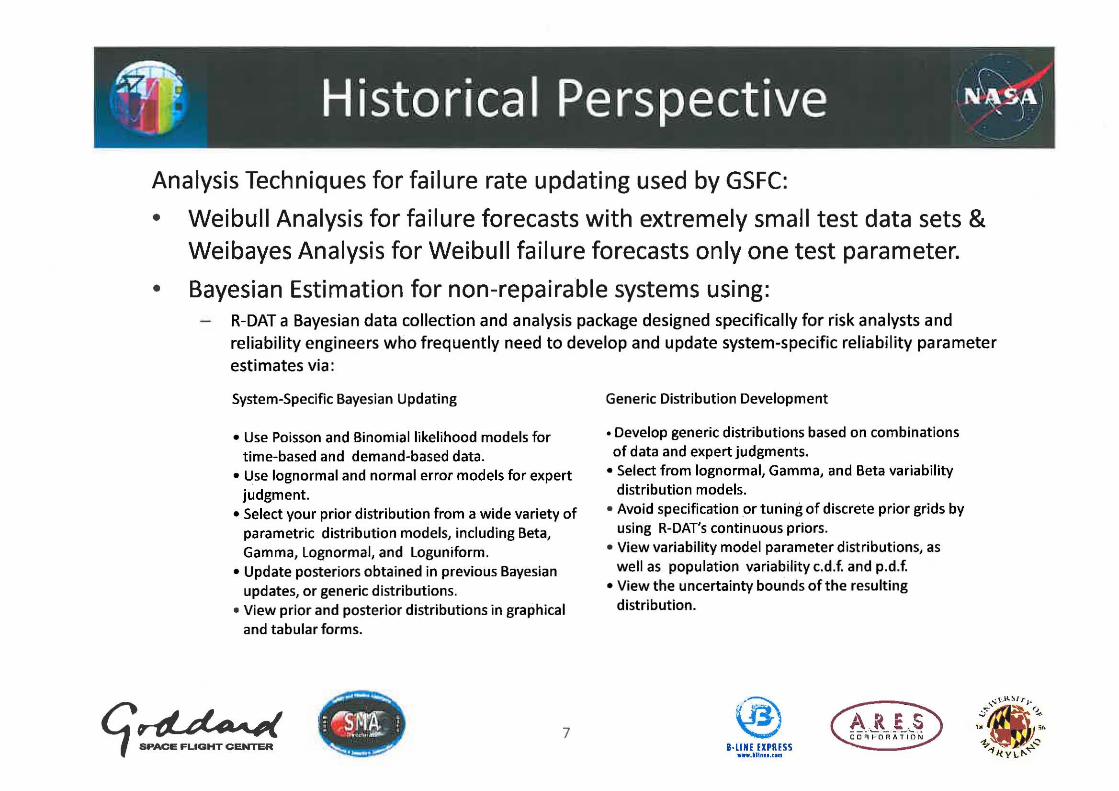
Analysis Techniques for failure rate updating used by GSFC:
•
•
Weibull Analysis for failure forecasts with extremely small test data sets & Weibayes Analysis for Weibull failure forecasts only one test parameter.
Bayesian Estimation for non-repairable systems using: R-DAT a Bayesian data collection and analysis package designed specifically for risk analysts and reliability engineers who frequently need to develop and update system-specific reliability parameter estimates via:
System-Specific Bayesian Updating
• Use Poisson and Binomial likelihood models for time-based and demand-based data.
• Use lognormal and normal error models for expert judgment.
• Select your prior distribution from a wide variety of parametric distribution models, including Beta, Gamma, Lognormal, and Loguniform.
• Update posteriors obtained in previous Bayesian updates, or generic distributions.
• View prior and posterior distributions in graphical and tabularforms.
Generic Distribution Development
• Develop generic distributions based on combinations of data and expert judgments.
• Select from lognormal, Gamma, and Beta variability distribution models.
• Avoid specification or tuning of discrete prior grids by using R-DAT's continuous priors.
• View variability model parameter distributions, as well as population variability c.d.f. and p.d.f.
• View the uncertainty bounds of the resulting distribution.
l! rd.. d~"'" ., SPACE FUGHT CENTER
7 AJ\~ __ ~ CO F'l I-O AATI O N
B·LlNE EXPRESS 111 .... 11" ... , ...
-;y' :. ! . Historical Perspective N\;:s~ ' - I
Can current SOARS/on-orbit anomaly data be used for Bayesian updating to get more NASA -based failure rates? • Multiple feasibility studies were conducted by UMO to explore the benefits of
Bayesian methods in analyzing SOARS data and estimating failures
• These studies involved engineering analysis and aggregation of information form different data sources to gather the necessary "success" and "failure" data
• Applied a number of simple and complex Bayesian methods depending on the nature of the data and type of parameters being estimated. Cases included:
- Constant failures rate estimation with Poisson and Binomial data models
- Weibull time to failure distribution estimation
- Treatment of Uncertain Data, using Weighted Likelihood and Weighed Posterior Methods
- Treatment of Certain Data, using Beta-Binomial distributions
• These analyses were conducted with ROAT Software
qrd.. &i_"" SPACE FUGHT CENTER
8 B-LlNIIXPRISS
.. ww.~u: ~~.(all
, ' ! ,
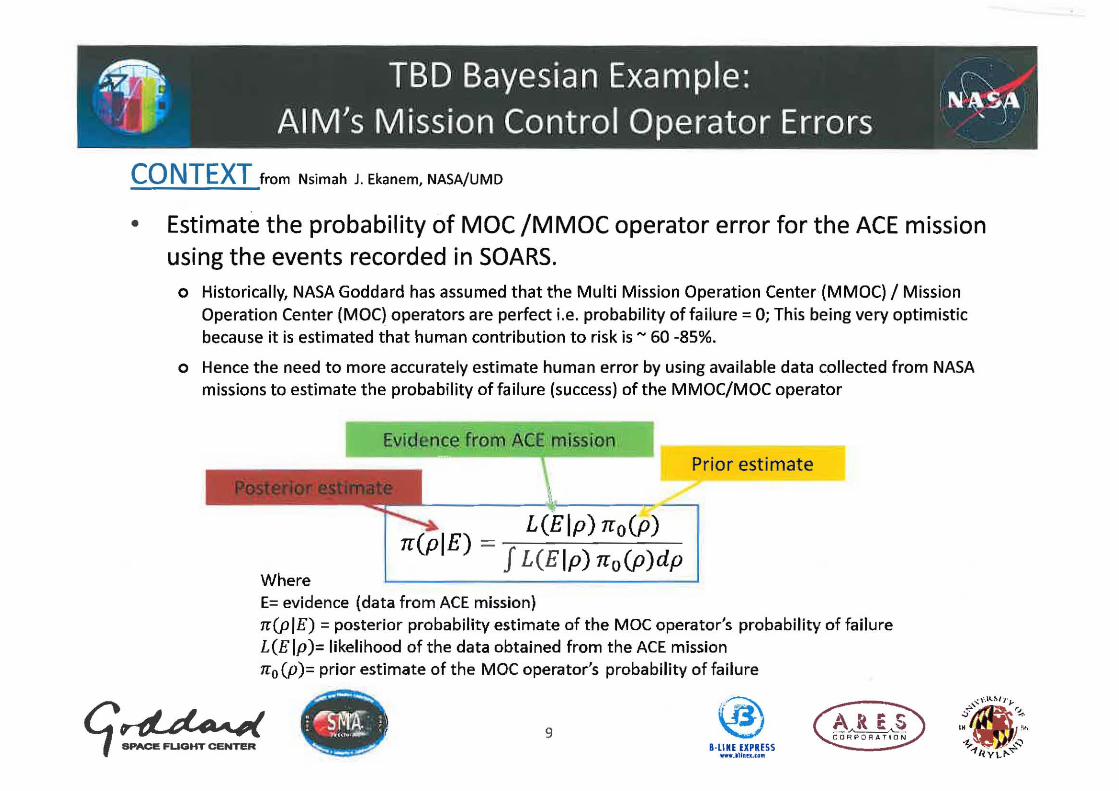
CO NTEXT from Nsimah 1. Ekanem, NASA/UMD
• Estimate the probability of MOC /MMOC operator error for the ACE mission using the events recorded in SOARS.
o Historically, NASA Goddard has assumed that the Multi Mission Operation Center (MMOC) / Mission Operation Center (MOC) operators are perfect i.e. probability of failure = 0; This being very optimistic because it is estimated that human contribution to risk is - 60 -85%.
o Hence the need to more accurately estimate human error by using available data collected from NASA missions to estimate the probability of failure (success) of the MMOC/MOC operator
Where
Evidence frem ACE mission
L(Elp) Tro(p) Tr(pIE) = J L(E lp) Tro(P)dp
E= evidence (data from ACE mission)
Prior estimate
n(pIE) = posterior probability estimate of the MOC operator's probability of failure L(Elp)= likelihood of the data obtained from the ACE mission no (p)= prior estimate of the MOC operator's probability of failure
(! riJ.. &1-"" ., SPACE FUGHT CENTER
.... ---.,;;:
; ~SfI''(' ; • '11 c. ..... """ ,
A ~ ~ S . -~\...; . C ORPO R ATI O N 9
~.--~ B·LlNE EXPRESS __ . ~UItI.I • •
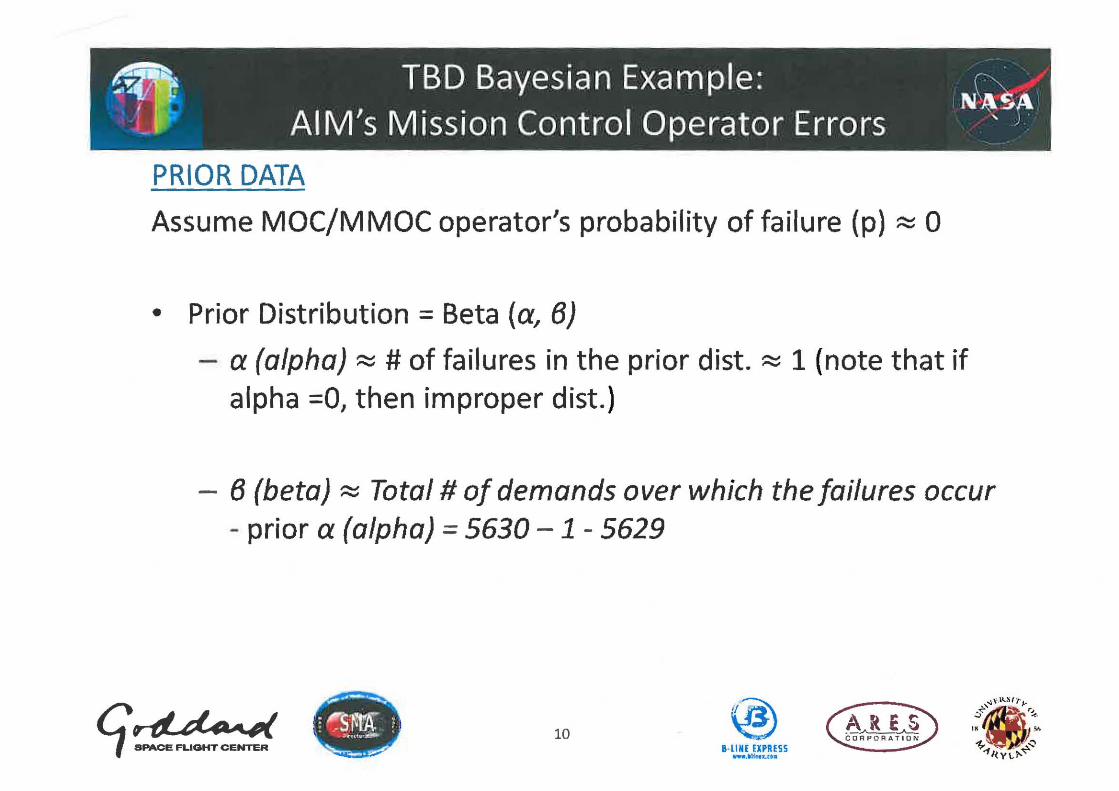
PRIOR DATA
Assume MOC/MMOC operator's probability of failure (p) ~ 0
• Prior Distribution = Beta (a, 6)
- a (alpha) ~ # of failures in the prior dist. ~ 1 (note that if alpha =0, then improper dist. )
- 6 (beta) ~ Total # 0/ demands over which the failures occur - prior a (alpha) = 5630 - 1 - 5629
l!rd.d~'Yl ., SPACE FLIGHT CENTER
10 B-IINE EXPRESS
..... HAt .. II .
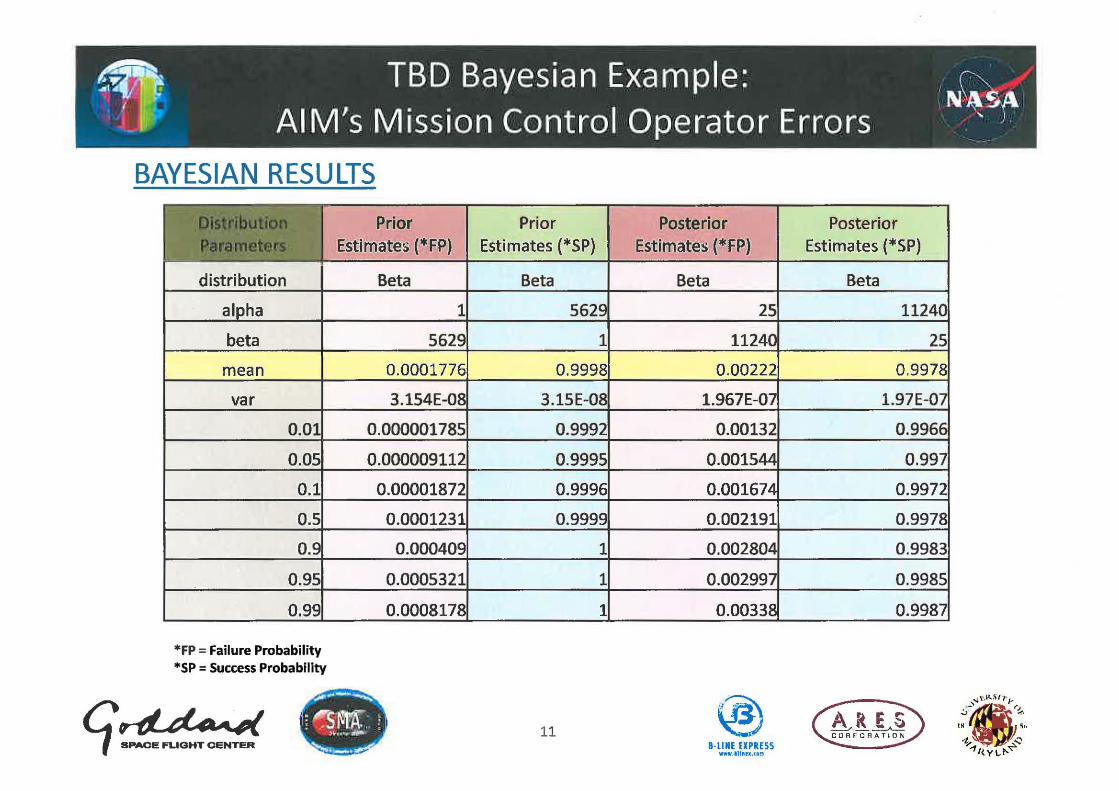
BAYESIAN RESULTS r-- ,-_~_ .. -,)t=".-:=;' ---,
II IJ' : "'1 • I '. ", • • I " I, ]"'j". ~
I .. " . -'.' - I I ", '. -i;:.jl:J1I 1 .{, 1-;-', II
.L I ~',. _.' ;'·!-.:-/.·- ...
d istri bution
al ha
beta
mean
var
0.0
0.05
0.1
0.5
o. 0.95
0.99
*FP = Failure Probability *SP = Success Probability
(!rd..d_...,( ., SPACE FLIGHT CENTER
Prior Estimates (*FP)
Beta
1
5629
0.0001776
3.154E-0
0.000001785
0.000009112
0.00001872
0.0001231
0.000409
0.0005321
0.0008178
Prior Posterior Estimates (*SP) Estimates (*FP)
Beta Beta
562 25
1 11240
0.9998 0.00222
3.15E-08 1.967E-07
0.9992 0.00132
0.9995 0.001544
0.9996 0.00167
0.9999 0.002191
1 0.00280
1 0.00299
1 0.00338
11 B·IINIIXPRISS
www,_ltn •• " ~
Posterior Estimates (*SP)
Beta
1124
25
0 .9978
1.97E-O
0.996
0.997
0.9972
0.997
0.9983
0.9985
0.9987
A D ~ c: ~~~ CORfORATI O N
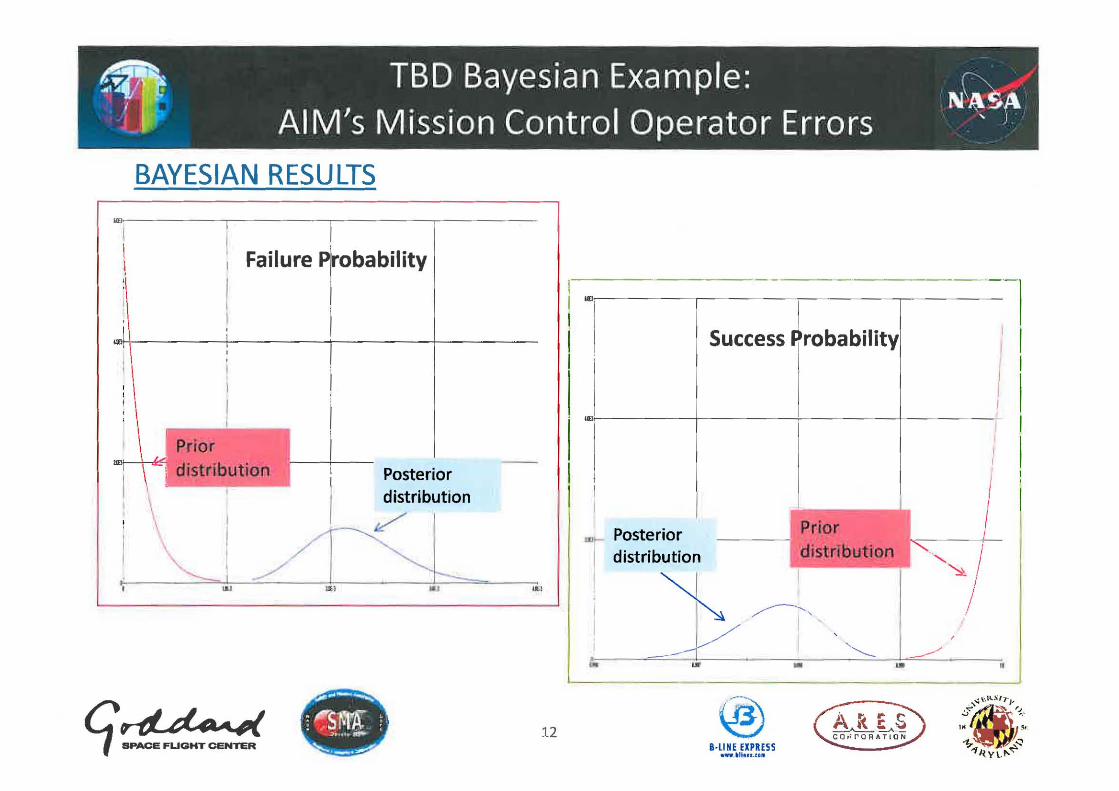
BAYESIAN RESULTS
i I Failure Probability
I I I
,. Prior uor-
j-+--<\ ~\ distribution _
i \~ , I .. ,
qrlld_~ SPACE FUGHT CENTER
Posterior distribution
.. ,
12
I : w,~. ----~------~I ----~------
I Success ~robability i : I
! I &-------+-----~-------+------~j I
I i I I i
Prior w~ Posterior ____ ---I distribution distribution
..
~I I
~ ~' _j // I
... ..
8·LlNE EXPRESS ..... n. ... u.
... "
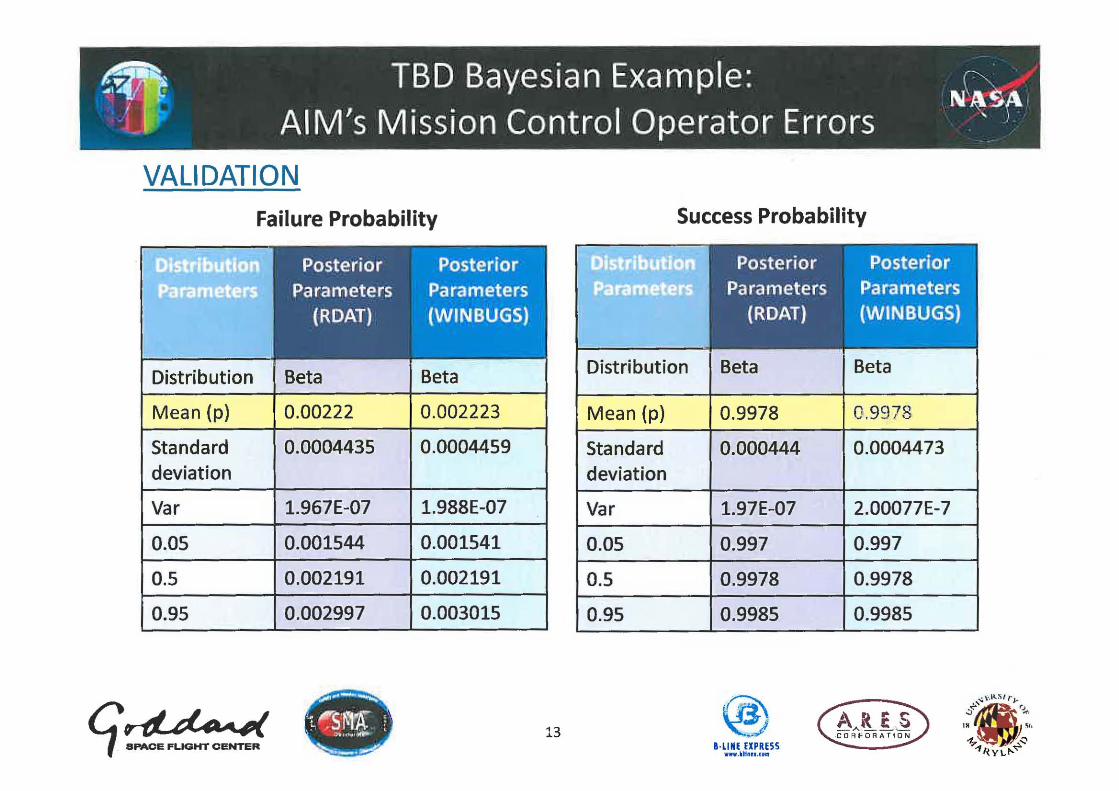
VALIDATION Failure Probability
• •
Distribution
Mean (p)
Standard deviation
Var
0.05
0.5
0.95
qrtld_~ aPACE FLIGHT CENTER
Posterior Parameters
(ROAT)
Beta
0.00222
0.0004435
1.967E-07
0.001544
0.002191
0.002997
Posterior Parameters (WINBUGS)
Beta
0.002223
0.0004459
1.988E-07
0.001541
0.002191
0.003015
13
Success Probability
• •
Distribution
Mean (p)
Standard deviation
Var
0.05
0.5
0.95
Posterior Parameters
(RDAT)
Beta
0.9978
0.000444
1.97E-07
0.997
0.9978
0.9985
I ·LlNIIXPRI55 ...... UI.rJ.f ..
Posterior Parameters (WINBUGS)
Beta
0.9978
0.0004473
2.00077E-7
0.997
0.9978
0.9985
;".""''''' 1')-, ~ {.
UI ~.
-;. .;:--11{ Y LI-'"
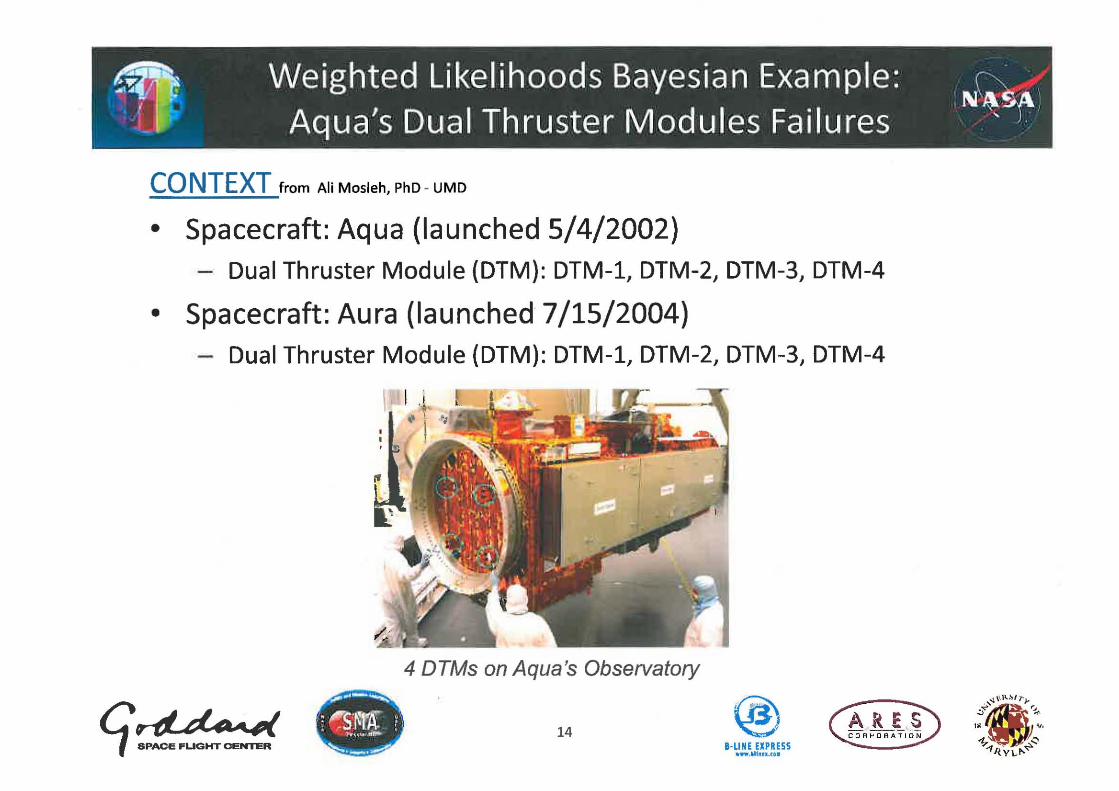
CO NTEXT from Ali Mosleh, PhD - UMD
• Spacecraft: Aqua (launched 5/4/2002) - Dual Thruster Module {DTM}: DTM-l, DTM-2, DTM-3, DTM-4
• Spacecraft: Aura (launched 7/15/2004) - Dual Thruster Module {DTM}: DTM-l, DTM-2, DTM-3, DTM-4
\ I .~ if ! ~~
: I , ,.,
4 DTMs on Aqua's Observatory
qrttd_"" SPACE FUGHT CENTER
14 HINE EXPRESS
1I'ww.'11~n.u.
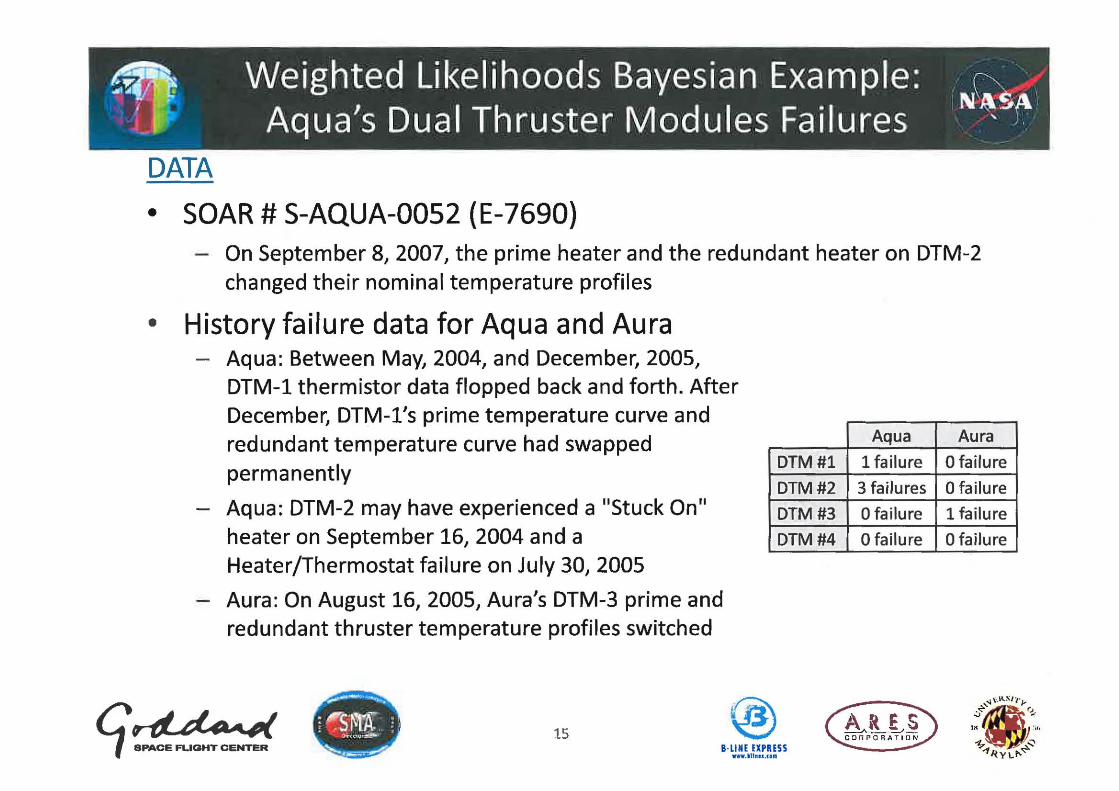
DATA
• SOAR # S-AQUA-OOS2 (E-7690) - On September 8, 2007, the prime heater and the redundant heater on DTM-2
changed their nominal temperature profiles
• History failure data for Aqua and Aura Aqua: Between May, 2004, and December, 2005, DTM-l thermistor data flopped back and forth. After December, DTM-l's prime temperature curve and redundant temperature curve had swapped permanently
Aqua: DTM-2 may have experienced a "Stuck On" heater on September 16, 2004 and a Heater/Thermostat failure on July 30, 2005
Aura: On August 16,2005, Aura's DTM-3 prime and redundant thruster temperature profiles switched
15
DTM#l
DTM#2
DTM#3
DTM#4
B-LlNE !lPRE55 "'.'''''',It.
Aqua Aura
1 failure o failure
3 failures o failure
o failure 1 failure
o failure o failure
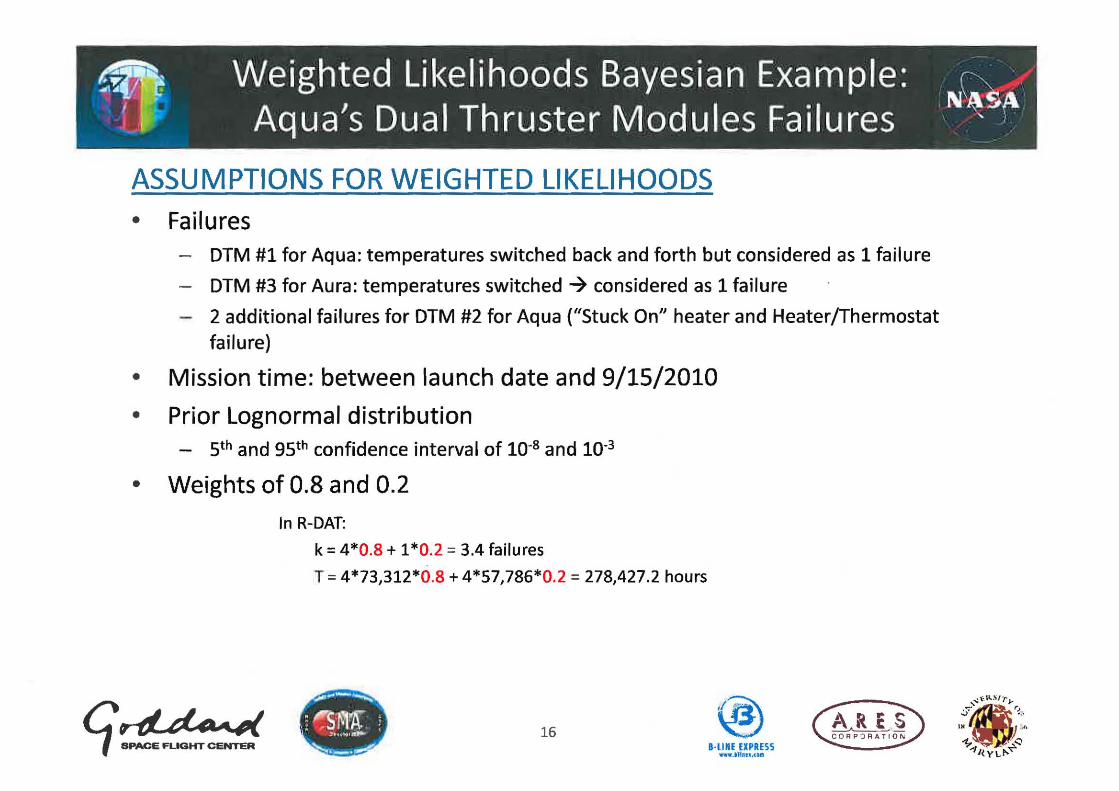
ASSUMPTIONS FOR WEIGHTED LIKELIHOODS
• Failures - DTM #1 for Aqua: temperatures switched back and forth but considered as 1 failure
DTM #3 for Aura: temperatures switched -7 considered as 1 failure
- 2 additional failures for DTM #2 for Aqua ("Stuck On" heater and Heater/Thermostat failure)
• Mission time: between launch date and 9/15/2010
• Prior Lognormal distribution - 5th and 95th confidence interval of 10-8 and 10-3
• Weights of 0.8 and 0.2
In R-DAT:
k = 4*0.8 + 1 *0.2 = 3.4 failures
T = 4*73,312*0.8 + 4*57,786*0.2 = 278,427.2 hours
~ .... -~
l ~.~I{ ! tVUS CORP:;lRATION 16
~.-. a·IINIIXPRISS ...... If.u ....
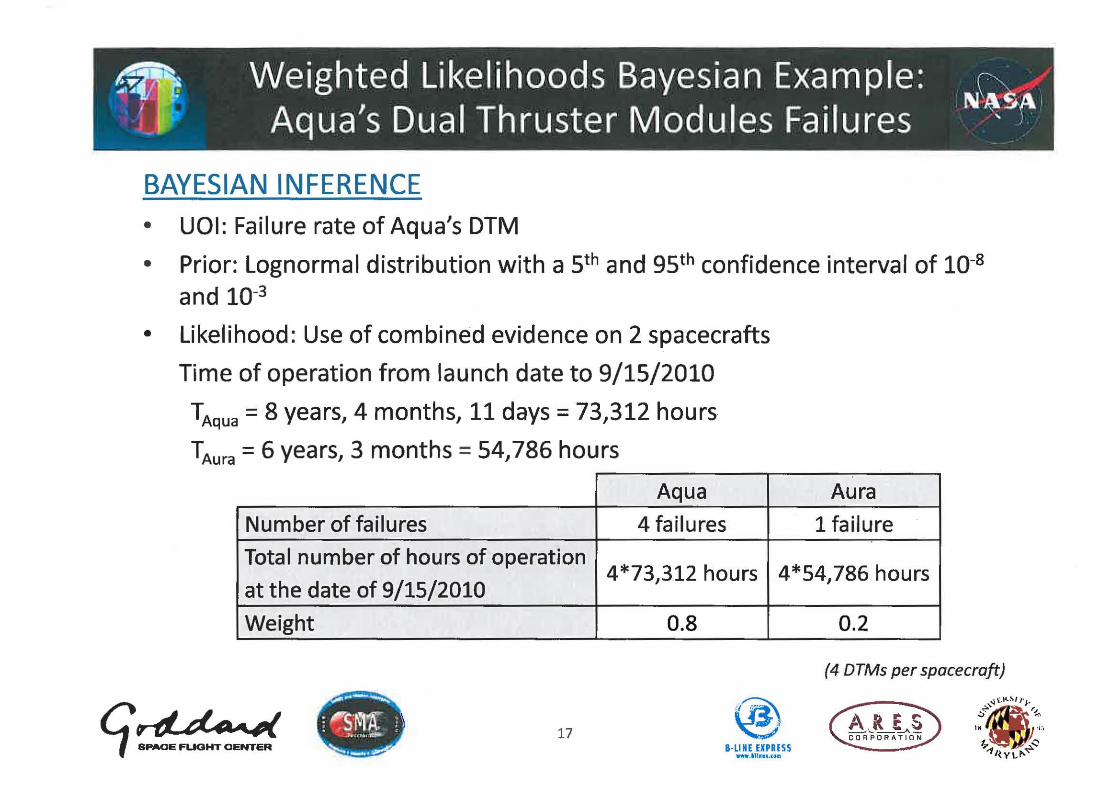
BAYESIAN INFERENCE • UOI: Failure rate of Aqua's DTM
• Prior: Lognormal distribution with a 5th and 95 th confidence interval of 10-8
and 10-3
• Likelihood: Use of combined evidence on 2 spacecrafts
Time of operation from launch date to 9/15/2010
TAqUa = 8 years, 4 months, 11 days = 73,312 hours
TAura = 6 years, 3 months = 54,786 hours
Aqua
Number of failures 4 failures
Aura
1 failure
Total number of hours of operation 4*73,312 hours 4*54,786 hours
at the date of 9/15/2010
Weight
qriJ..d_~ SPACE FUOHT CENTER
:o-''''-~
1 ~S'~J:'~ r .JI~',_~
~.-. ""'" 17
0.8
B-LlNE EXPRESS _ ... llluM ..
0.2
(4 DTMs per spacecraft)
A J> ..... _·JL~~ CORPORATION
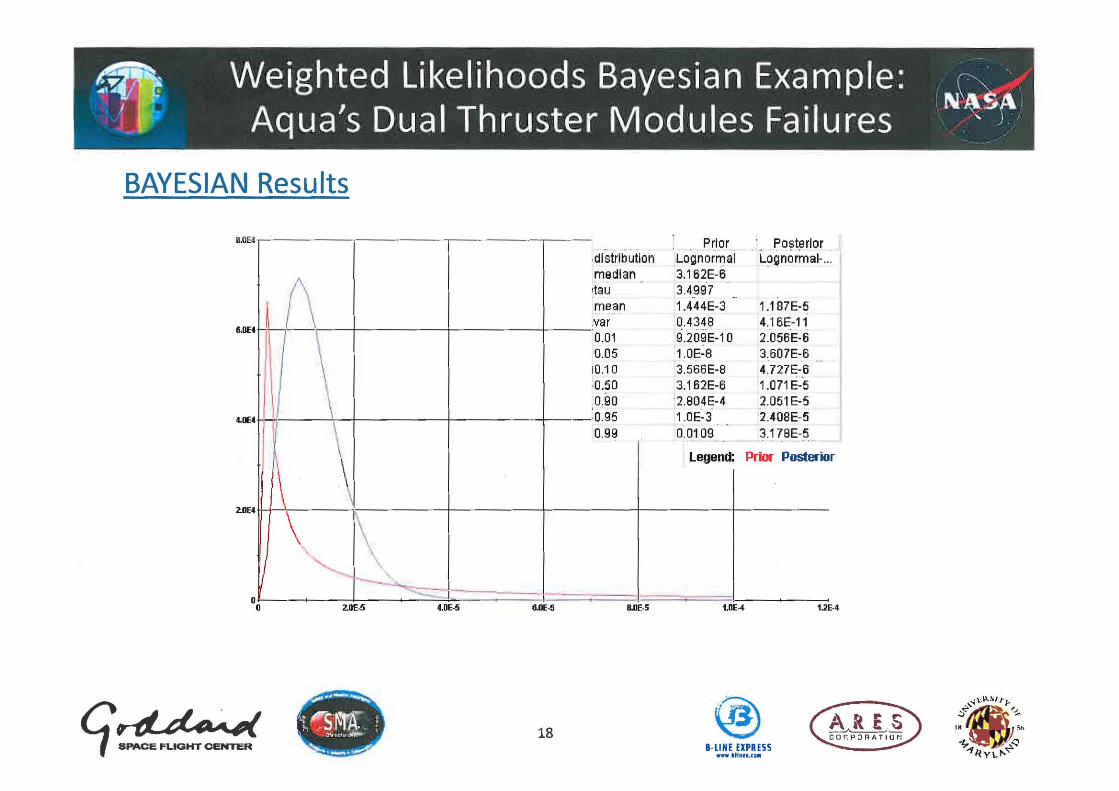
BAYESIAN Results
8.oE4
6.DE4
2JIE.
o o
I
qrlJ.d_~ SPACE FUQHT CENTER
LA
\ \ \ \ \ ~
• ,-
2.0E·5
~."-.......-::::
\~~ ; oo. , .. ,,~
~'-'~
~I-:- ! 4.0E-5 6.oE-5
18
Prior " Po~t~rior ,distribution LognorlTlal LOgnOrma~ " median 3,162E-6
-Itau 3.4997 -mean 1 A44E-3 US7E-5 ,var 0.4348 4,16E-11 0.01 9.209E-10 2.056E-6 0.05 1.0E-8 3.607E-6 ._, 10.10 3,566E-8 4.727E-6 '0.50 3.162E-6 1.071 E-5 0,90 2,804E-4 2.051 E-5 :0.95 1.0E-3 2.40BE-5 ., . 0.99 0.0109 3.17BE-5
Legend: Prior Posterio r
B.OE·5 1.DE-4 i.2E·4
a·IINE EXPRESS ..... " ..... u ..
Can current SOARS/on-orbit anomaly data be used for Bayesian updating to get more NASA -based failure rates?
YES!!
qriJ..d_"" SPACe: FUGHT CENTER
19 8-LlNIIXPRISS
WW'II.'lIUI .(l1I
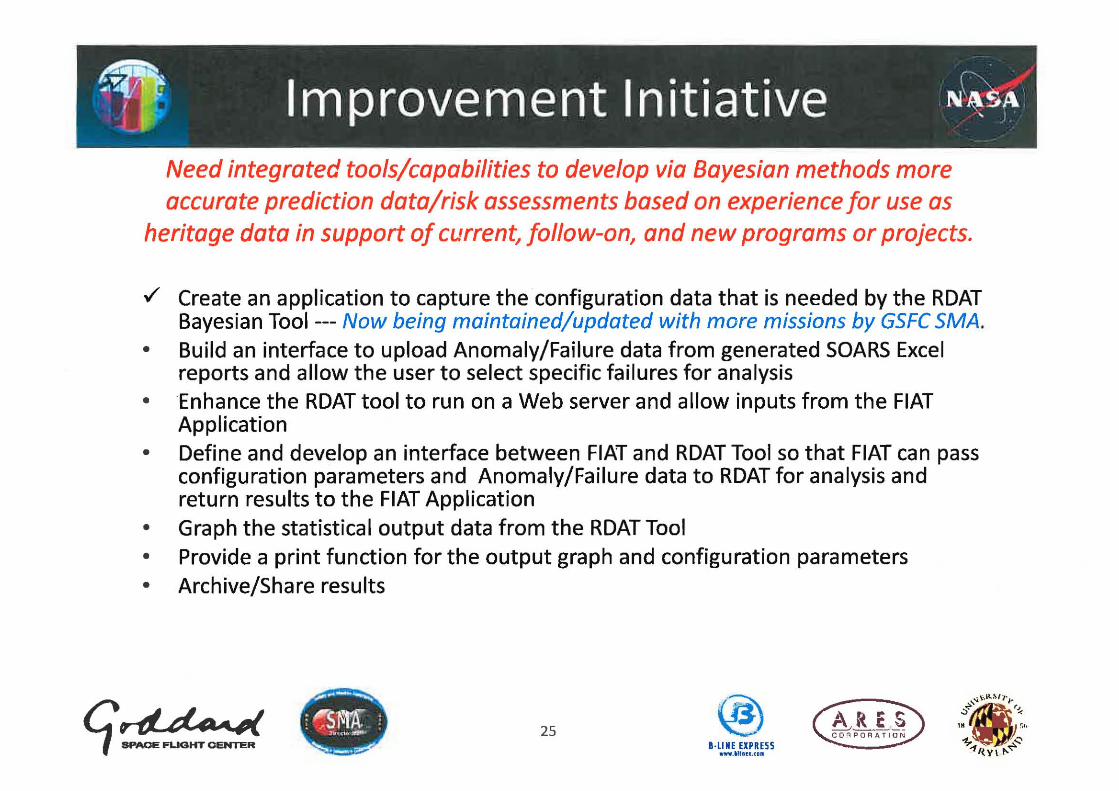
Need integrated tools/capabilities to develop via Bayesian methods more accurate prediction data/risk assessments based on experience for use as
heritage data in support of current~ follow-on~ and new programs or projects.
• Create an application to capture the configuration data that is needed by the ROAT Bayesian Tool
• Build an interface to upload Anomaly/Failure data from generated SOARS Excel reports and allow the user to select specific failures for analysis
• Enhance the ROAT tool to run on a Web server and allow inputs from the FIAT Application
• Define and develop an interface between FIAT and ROAT Tool so that FIAT can pass configuration parameters and Anomaly/Failure data to ROAT for analysis and return results to the FIAT Application
• Graph the statistical output data from the ROAT Tool • Provide a print function for the output graph and configuration parameters • Archive/Share results
qrtJ..d_~ SPACE FUOHT OENTER
!:\,k ES C ORPORA T I O N 20
I -LINE EXPRESS ..... "'h ...... .
Mission Configuration Demo
qrll-d_~ SPACE FUOHT CENTER
a perpetual archive of Mission Configurations to give context to experience data and Bayesian analysis.
Art E~ COr.PO:lATION 21
B-LlNE EXPRESS •••.• ll1u.""
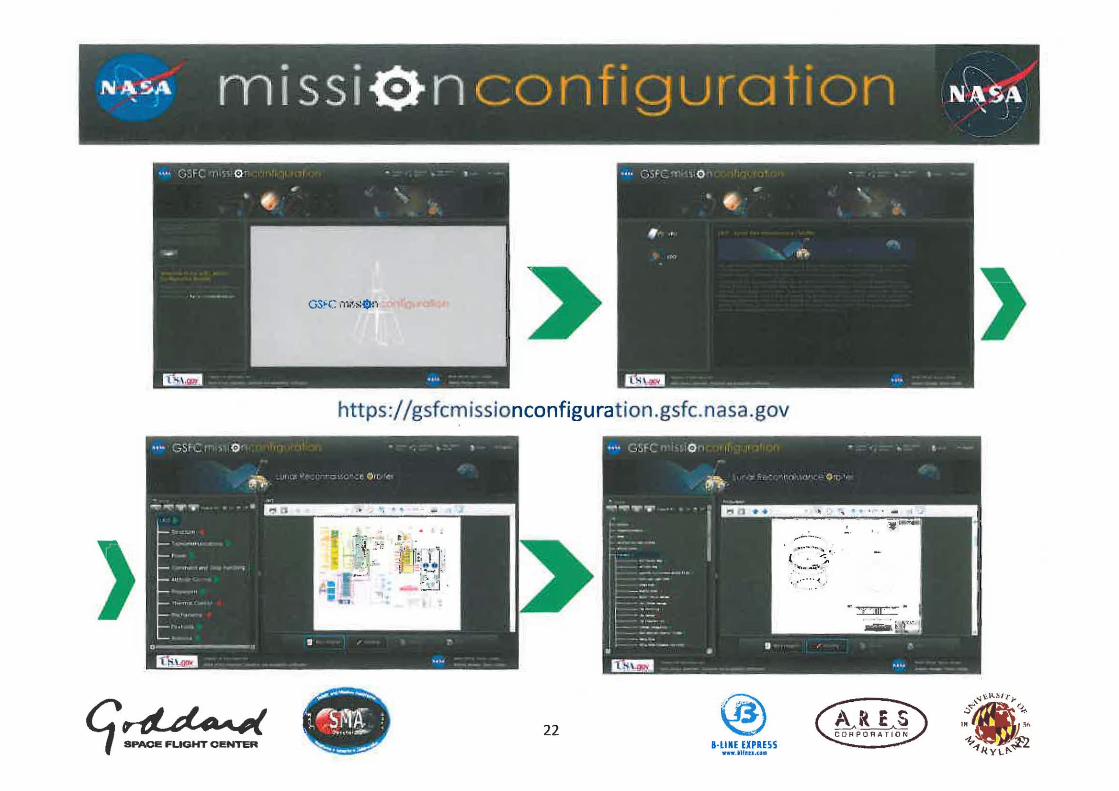
https:!/gsfcmissionconfigurat ion.gsfc.nasa.gov
22 a·LlME EXPRESS
__ .'"u.,e"
qrd.d_~ SPACE PLIGHT CeNTER
23 8-LlNE EXPRESS
.... WlNu ..
tVLL~ COFH-ORATION
qrlld_....,( SPACE FLIGHT CENTER
24 B-L1NE EXPRESS
www .• llnn.flll
Need integrated tools/capabilities to develop via Bayesian methods more accurate prediction data/risk assessments based on experience for use as
heritage data in support of current, follow-on, and new programs or projects .
./ Create an application to capture the configuration data that is needed by the ROAT Bayesian Tool --- Now being maintained/updated with more missions by GSFC SMA.
• Build an interface to upload Anomaly/Failure data from generated SOARS Excel reports and allow the user to select specific failures for analysis
• Enhance the RDAT tool to run on a Web server and allow inputs from the FIAT Application
• Define and develop an interface between FIAT and ROAT Tool so that FIAT can pass configuration parameters and Anomaly/Failure data to RDAT for analysis and return results to the FIAT Application
• Graph the statistical output data from the ROAT Tool • Provide a print function for the output graph and configuration parameters • Archive/Share results
qrd..d4l&....,( SPACE FUGHT CENTER
:;.-r'-"~
f ~~'[' : a U .<1"~
~.-.. 25 B·LlNE EXPRESS
.ww.'lleu.cI .
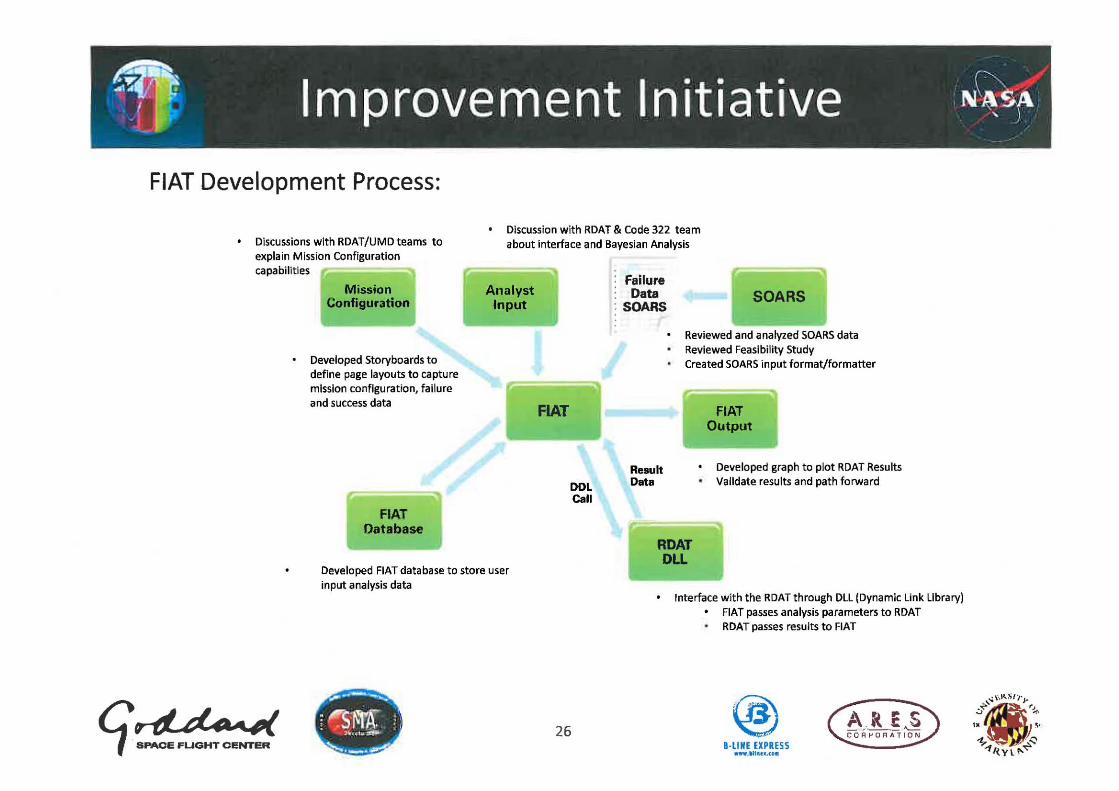
FIAT Development Process:
Discussions with RDAT/UMD teams to explain M ission Configuration capabilities
Discussion with ROAT & Code 322 team
about interface and Bayesian Analysis
qrll-d_~ . SPACE FUGHT CENTER
Mission Configuration
Developed Storyboards to define page layouts to capture mission configuration, failure and success data
FIAT Database
Analyst Input
Developed FIAT database to store user
input analysis data
FIAT
DOL can
26
failure Data
SOARS
Result Oat.
SOARS
Reviewed and analyzed SOARS data Reviewed Feasibility Study Created SOARS input format/formatter
-FIAT
Output
Developed graph to plot RDAT Results Validate results and path forward
RDAT DLL
Interface with the RDAT through Dll (Dynamic link library) FIAT passes analysis parameters to RDAT ROAT passes results to FIAT
HIMI EXPRISS ....... ~u"-" ..
FIAT Prototype Demo a web-based orbital data Bayesian failure analysis tool for NASA missions
qrd.d_--" Yr-SPACE FLIGHT CENTER
----=:
'I; 'S'~~' ; • J' [)'o ,,~,~ -
~.-. 27
I -LINE EXPRESS ...... lIIllIu ••
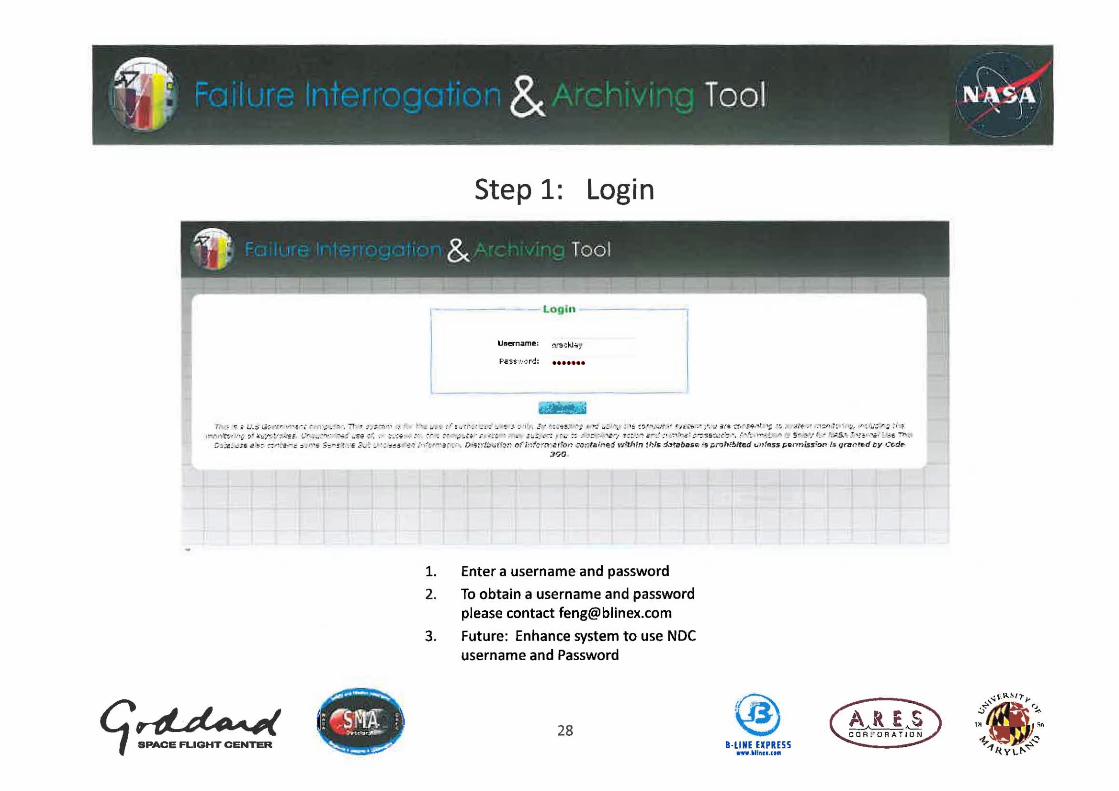
Step 1: Login
~ , , & Tool
- Loghl
l .......
' ,'
711 .,; 'C i - L.'.;:O; ;';;,. '" l"' .~~« '( .. , ,; ~ ~~",;t. , .'" $.':1,,, , "l~ ~, '. .: ,- i ~ CI· .· _" ; ' ~ ~ ~ ~': I 't , ;:·· -~: ,.i'if. .- r ;; , '': .. ~d ·1; · ; " ~ t:; ~, ;,,,:~_.· t ... o:>.;. - ,·; ' ':_f. (~" ' !9.~~,,; :: •. ~; t,.;, r.I::r :: -; ~, I"' : .;:. r ; : ; .~
r" ." ,',It":.' ,,;- ~. :"~-;-'!:';' .. ,!! ",.~ .:. ~:" . . " ,;:; ~'.! ~ : :; -; ;',-:i ' ' .. : - ·:r· ; :-," -, p .'n - "' . "' .. ~ . ,'n ' ,!' 1':: .• ~~: , ro) ::. ,- J ;.. .•. ,'0: '", , ;:.,"": .~.: :, _~" "i' ::: -= ... ~~ .. '.:':: .-. " "~ '''''':' !.. . " ,,. s- ~ '/ '." I.":.S.I, : . ' t! , .•• . 1. .;;!. -,... .
C :' :4! ' ,,\:~ ,;o l!': :-: .., !"~.- " " .r·-i :i",,! ', ,"' .? .. !: _ . : ~.5~ ,,~;· ,~ar·II' r~, D"::"!:'~! " ~:: e: h:'': :''{1 ~~'':O'~ ccr: l lt.ine.:! l'I:rhin fN~ .7.l'~"'/)lt.se !~ profr,Uted ""(!"ISS f;8rm;ssiO(> fj. Qf"lJf"tEd toy Cc.d. 3/jO
qrdd_~ SPACE FLIGHT CENTER
1. Enter a username and password
2. To obtain a username and password please contact [email protected]
3. Future: Enhance system to use NDC username and Password
28 a-LINE EXPRESS
....... It~n.ftll
Step 2: Configuration Setup
Million: LRO
Still OpQr~onal? Yes No Current Date: ;01, . :.'..;;~
St:Irt O~ (Analysis): 07/01/2009 End Date (Analysis): D9,13O/2005
S41«t an item for which rellolbility data needs to be OIniltyzed :
~:'l -Select!! Compctlm
ration ..
No part ava~lIble... No slbpartavahJb\e .. Pavlolld;-- - -
"- Sa:.tt. Su~ystemS1N"'~ Talecommunications Power "ng time of the' item during the mi5,illn? (i.e. what 'k of the mfsslon timE is theitem/KIWvedON) 50
'Corrvnand and Data Hendling hOUiS for the d.." of components, or VGU want the system to c.;lcufilte the total operatlng hour? I A9ude Con~1 'Pro sion - letttt.!systemCiliwateit
'~A~"'~'~'~' ~~~~~~C~on Ihat itfl! identical to the item 51!4~d7 • Yes 1'(0
How milny? 5
AnI there IIn~ redundancy form~ons1 0 Yes No
HaW mOlny7 2
1. Select a Mission and the following fields will be automatically populated from the Mission Configuration application:
a. Launch Date; b. Still Operational
2. Current Date is automatically populated by the system
3. Enter in a Start and End date for analysis GSFCrl1l!.)I«iIn I 4 t h'
4. Select subsystem, component, part or sub part from the pull down list for the item
that is going to be analyzed . This data is pulled from Mission Configuration Application .
qrd..d_~ SPACE FUGHT CENTER
29 B·LlNE EXPRESS
"-';.'Itlu.c ..
Step 2: Configuration Setup (cant.)
Mi$Sion: LRO
:::;. ~ : .. iu-,':f. :! ·e :: :01 :~"''-il :''''~ ~ =l , r.; r ;~!! :(~5!::of ::rtll:: r!ra,:r j ::' .'flr .; :"l'! tiS:~"1 :: :!I :~ !: ~ :I'~ ;:;~I :;tf!l,ir; h:I."
J "(1': ;', ;;,e :: :M' :~c r. t;~; ~.el.l~~ .e I.e: :!--I ;; ~-i;cm .'11:." ,:a i;
5. Select Failure Mode 6. Enter in the planned total operating time of the item during the mission 7. Select if you know the operating time or want the system to calculate it for you 8. If you want the system to calculate, enter yes or no if there are identical items 9. If there are identical items, enter in the redundancy information
qrtLd_"" SPACE FLIGHT CENTER
30 HINE EXPRE55
..... u . ... , .. '
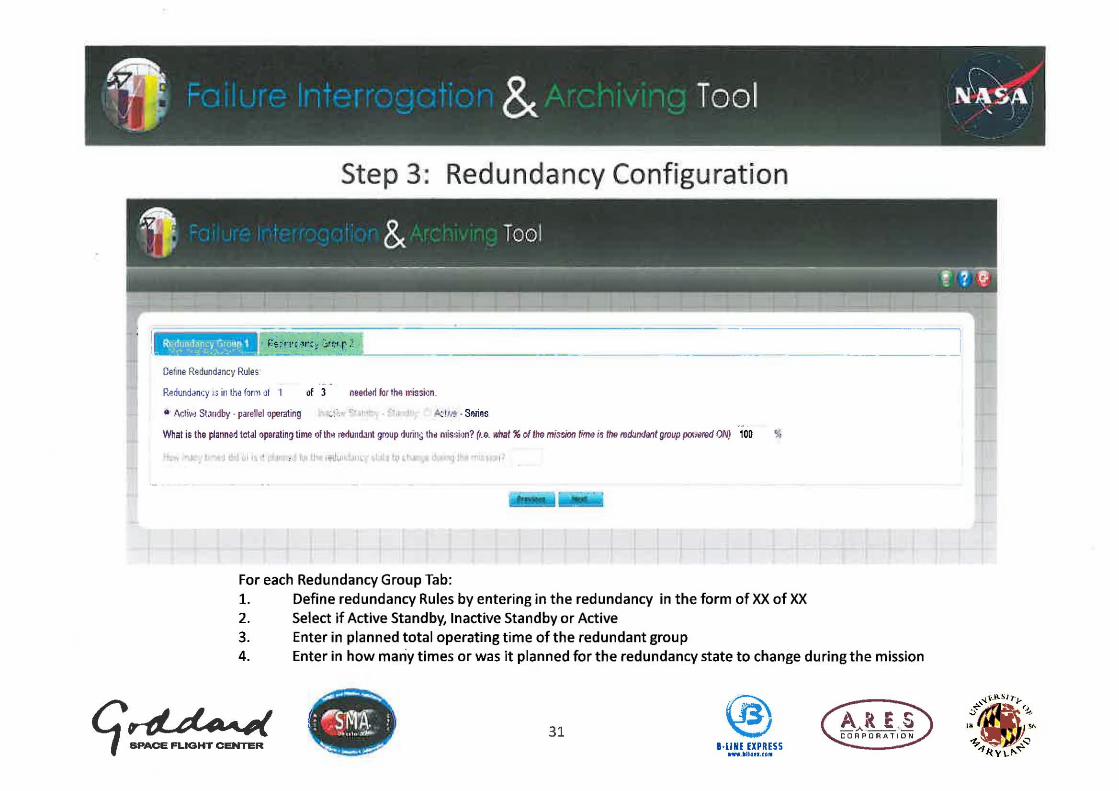
Step 3: Redundancy Configuration
, I--------.u---~--~--------~---------------------F.i:" J'!' , ·'t· ~ ~ .:;'r!:" r.~ ----------------------,
Define Redundancy Rules'
Rf!dund.w:y i:; in tht'! (orm .Jf I
. ' N:ti'ffl St,:lIIdby . pare!!el operat ing
of 1
___ L-__
need~rl fur thl\ rr.issit:n.
. ,' .. ' "
--What is the panned totd! Gperatino time of thlol rettundant group ljuril1!) thlt missirm? (I,e. what" 01 'he mission time ;s the red'.lndant group p€7of8red ON) 100 %
,.
For each Redundancy Group Tab: 1. Define redundancy Rules by entering in the redundancy in the form of XX of XX 2. Select if Active Standby, Inactive Standby or Active 3. Enter in planned total operating time of the redundant group 4. Enter in how many times or was it planned for the redundancy state to change during the mission
qrd..d_"" SPACE FUOHT CENTER B·LlNIIXPRISS
..... lIUI.!DfI
31 ."'."'.'''''.)-'' o.J "'I.
IN SI,
~ ~ ""/{y\..,...~
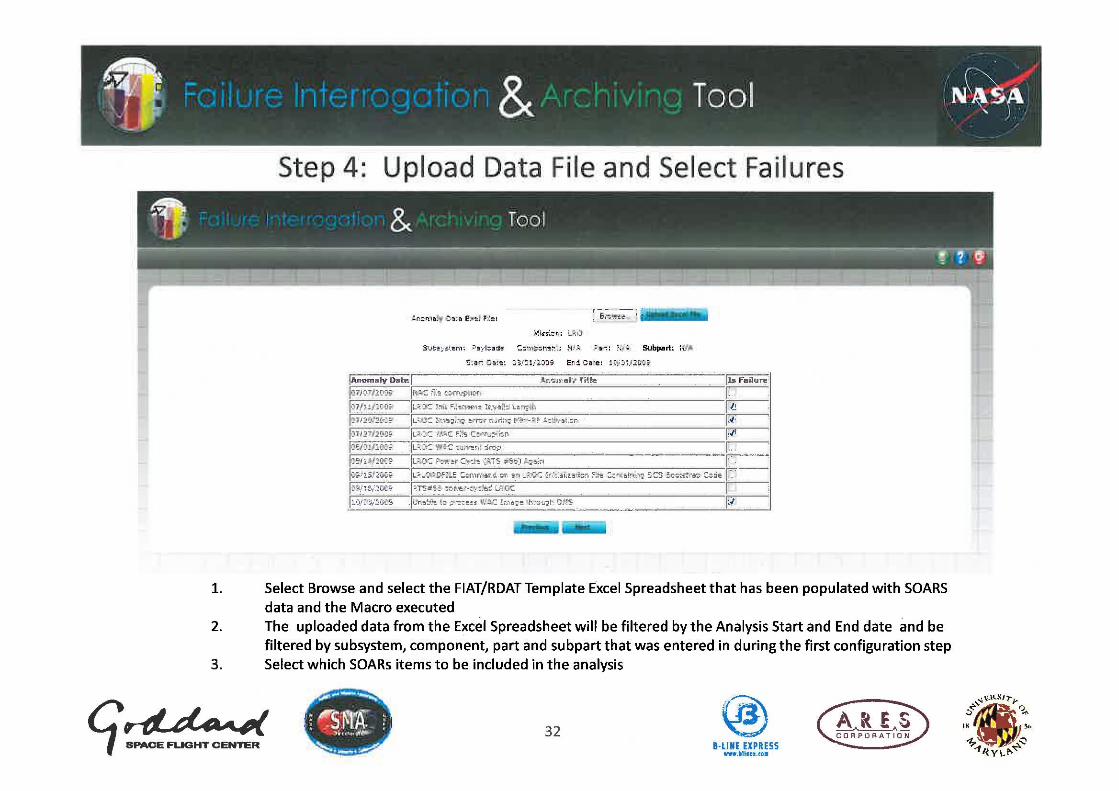
Step 4: Upload Data File and Select Fai lu res
1'1 & Tool
-- -- - _-' CI' . . .
Su~/:>tem: :>5 yl ::ad~ '::; rll ;; :;I\~~;! !~.I ;' :~ r: : 11,;'; subpart: t{ //I
~:ilr C:.le: Q 3i~li2J0; En:! Da:e : : ~" ) : J2tro ~
jAllOmllJy thlte I ,1.,,';rr:lli'o' nUll!: 115 Failure
~""I"'" I~'o ", ""',p''''' I.
r~.I~~/2l*:~' Il ::...,t)': ~~r C"':I~ l':;'iS :;<e~1 ~';?o:l t: : __ 1C'<;_' l SI~"~~ IL~L. ?I)C~:"!;, ':::rnr,urci C~ ~~i !...,:,~(: lr;~:L3IiHlb .. :O;te ;::~n;"i~'!J .. :;:::::3 E.c •• ~~a=- C:;:ie [.'"
ID"' ! ""~' D C'" I~T.s=~~_~:;l'.'e'-: :,: Je;.:! l.'~~'.: I I:;.'-;:::,; oa~ _Ij~'r {o!:<)~ t:: ;:,,-::·:eH W~:::. !,';tti~ \r',":; '>l;rt-, D:/.\,i 11'
1. Select Browse and select the FIAT/RDAT Template Excel Spreadsheet that has been populated with SOARS data and the Macro executed
2. The uploaded data from the Excel Spreadsheet will be filtered by the Analysis Start and End date and be filtered by subsystem, component, part and subpart that was entered in during the first configuration step
3. Select which SOARs items to be included in the analysis
qrd..d_"" SPACE FUGHT CENTER B·L1NE EXPRESS
•••. 'lIen.cn
32
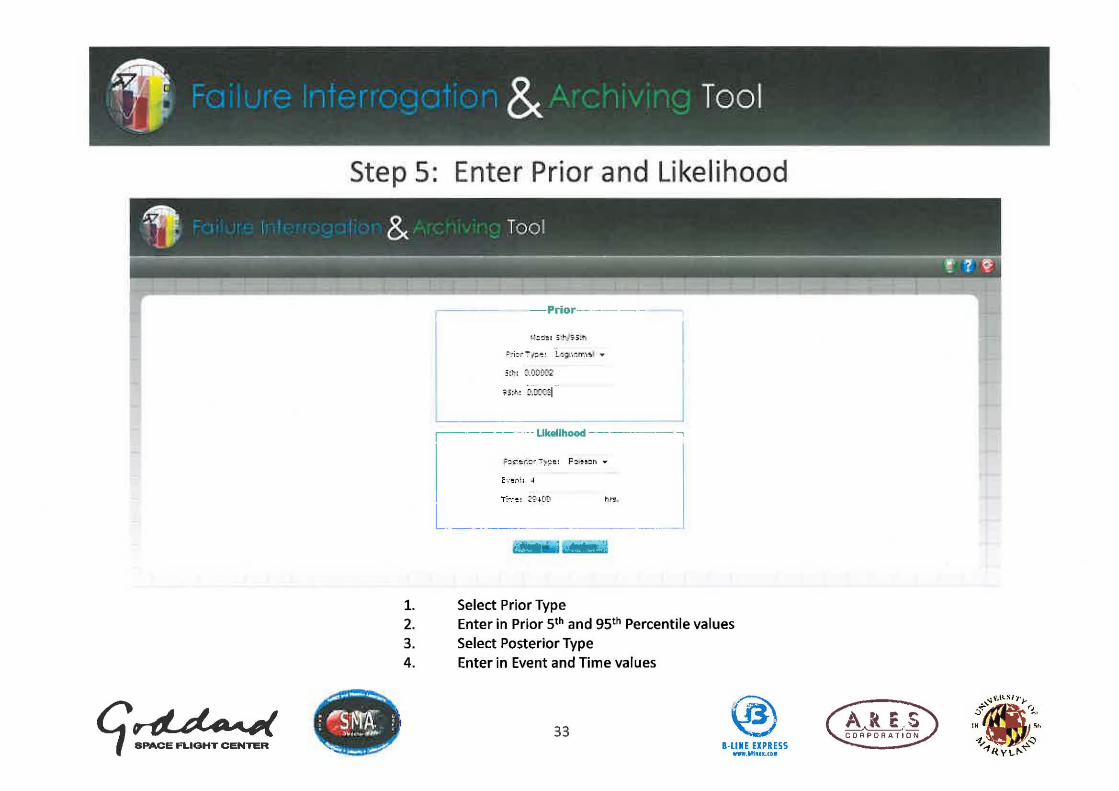
Step 5: Enter Prior and Likelihood
-Prlor- -----
L __ _
1. Select Prior Type 2. Enter in Prior 5th and 95th Percentile values 3. Select Posterior Type 4. Enter in Event and Time values
qrrd..d_~ SPACE FLIGHT CENTER
tVLt·s CORPORATION 33
B-LlNE EXPRESS WII'W."18U.01I
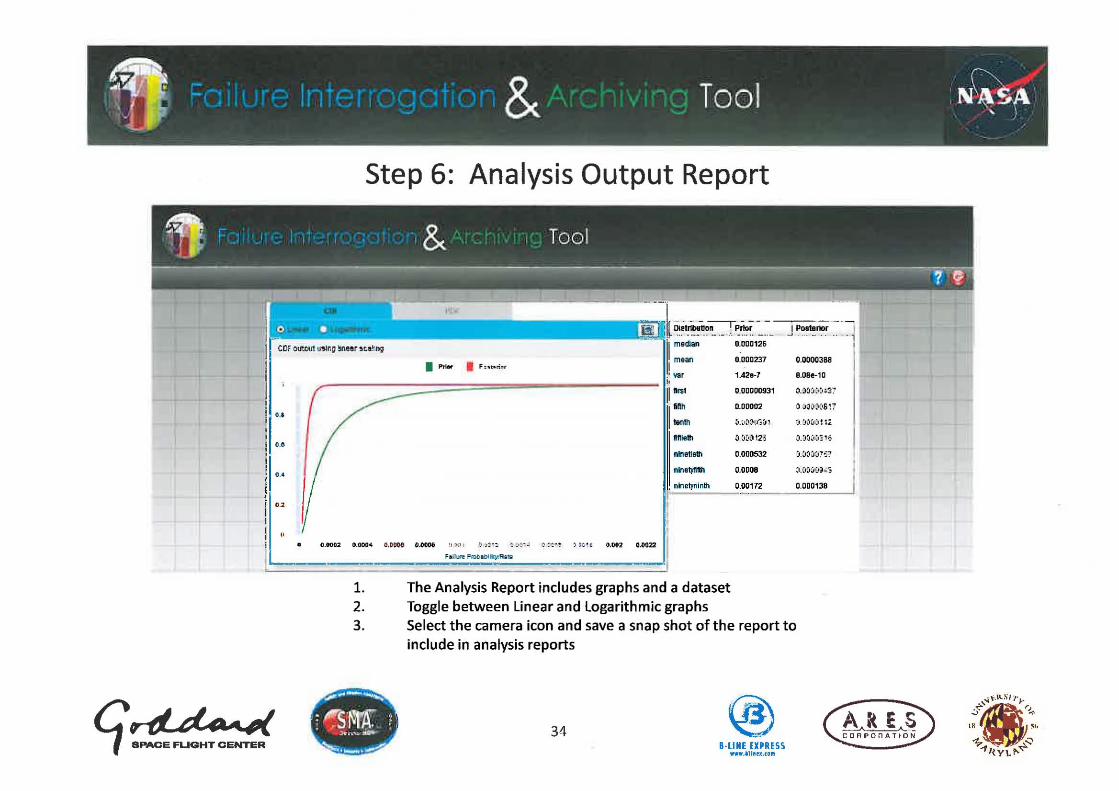
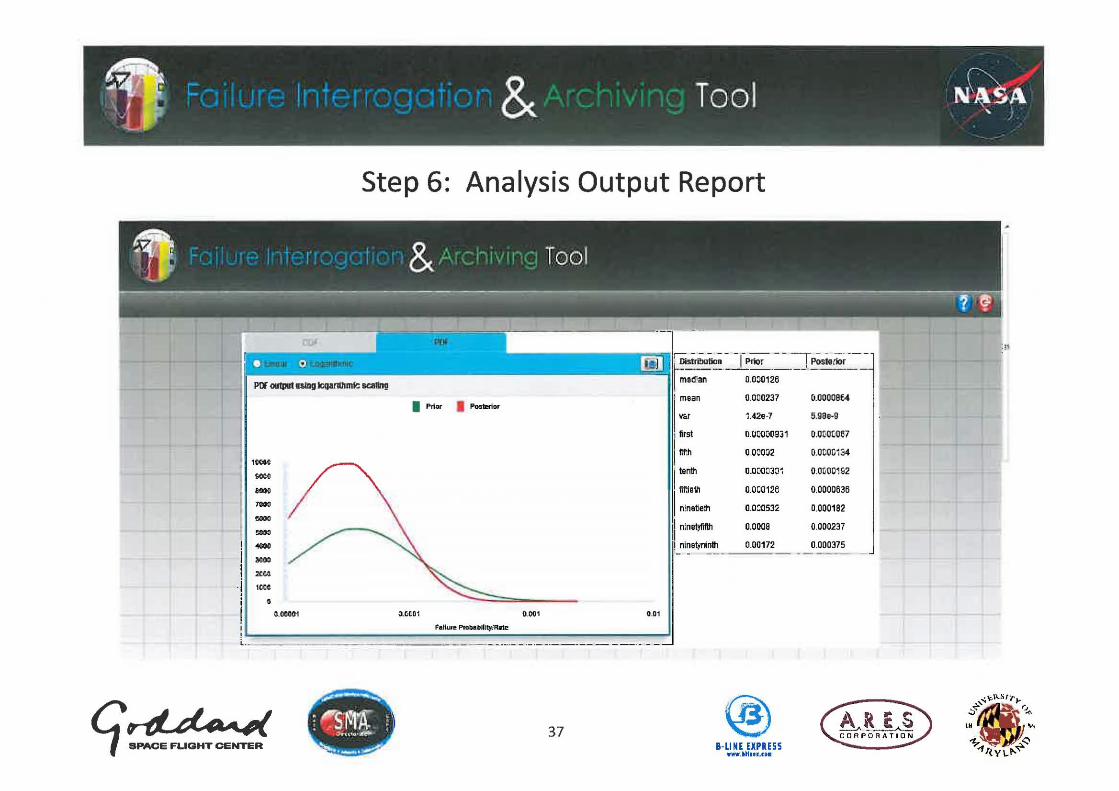
Step 6: Analysis Output Report
~,jI 1 ,..-.- · - : Ir - -- -~--- -, -I ~ II f. ~~t~n_ ._ .'. ~~ ___ ._ J ~on.l1or I
- II m..... 0.000126
'"
i j I I I
I
qrd.. d_,..,( SPACE FLIGHT CENTER
em O\f'J:!U1 U~Ii!1 '!inellr su!:1'I9
,,'
'" , .. 02
" ,
• • I mean 0.(1(10237 0.0000388 - "o ~ .. ri~r .' vat 1.420-7 8.08e-tO I.
f II'ffi' 0.00000931 o.<')~:' :·(o ~2?
I :~ 0.0D002 o ;j) Ci ~ C'S ! '7
:;.N';'IIl, IJ l 1.t . r.o ,,(,jll~
IIftieth CI~to:)m O.'))~'~I:: 1;}
ninetieth 0.000532 CI.:',j'J!:::
nlnetyfillh 0.0008 :l.c.j;Jj~ .. ;
~ , ninetyn inlh 0.00172 0.000138
I r
0 . .0112 0.000'" II.GOGO 0.000II " :',' i ~ - . ~ . - ~~.: - ~ l;o ~ ;"~ ) O ~ ' C 0.012 ,,- I Fal l.-I"«>babl liopl'lflll
I
1. The Analysis Report includes graphs and a dataset 2. Toggle between linear and logarithmic graphs 3. Select the camera icon and save a snap shot of the report to
include in analysis reports
~.,,-.........-;:::
; ''"S~ 1 . " . . .... n.~~ 34
~.-. .-:;; B·L1NE EXPRESS w.w._U.eX,IGIl
I i
~.''''." s"." , .:; ~.
1M Sf>
i- " ...., /{ Y \. f" :~
Step 6: Analysis Output Report
r- --- -T--- --r--I OistJ'ibinilll_.;_~~.:: _ __ . __ ._~ .~~
O.OOO12€
• Prior • POliteri_ 0.000237 O.OCooc.se4
I var 1.42e-7 5,9Se-£'
I first O.OOOJOe31 O.DC{lvOe7
I fifth (l.O{JO:J2 O . D C'O~134
I t&n1h 0.000;)3::;1 O.O~OJ192
flftleth O.{lOO12f:· 0.000:3636 c.,
n:net!eth 0.000532 0.000182 0.'
n!ne1yfHlh 0.0009 0.000231
0.' nwrt,nIPlIII Il 00172 o 'OO0J7:-
02
o C.O!Y.)OI IU I1
(! riJ.. &1_"" ., SPACE FUGHT CENTER •. """' .• , " "-
IN ,\ ,.
~ G ""/{YL""~
35 a-LIME EXPRESS
__ .,UnU.CDIl
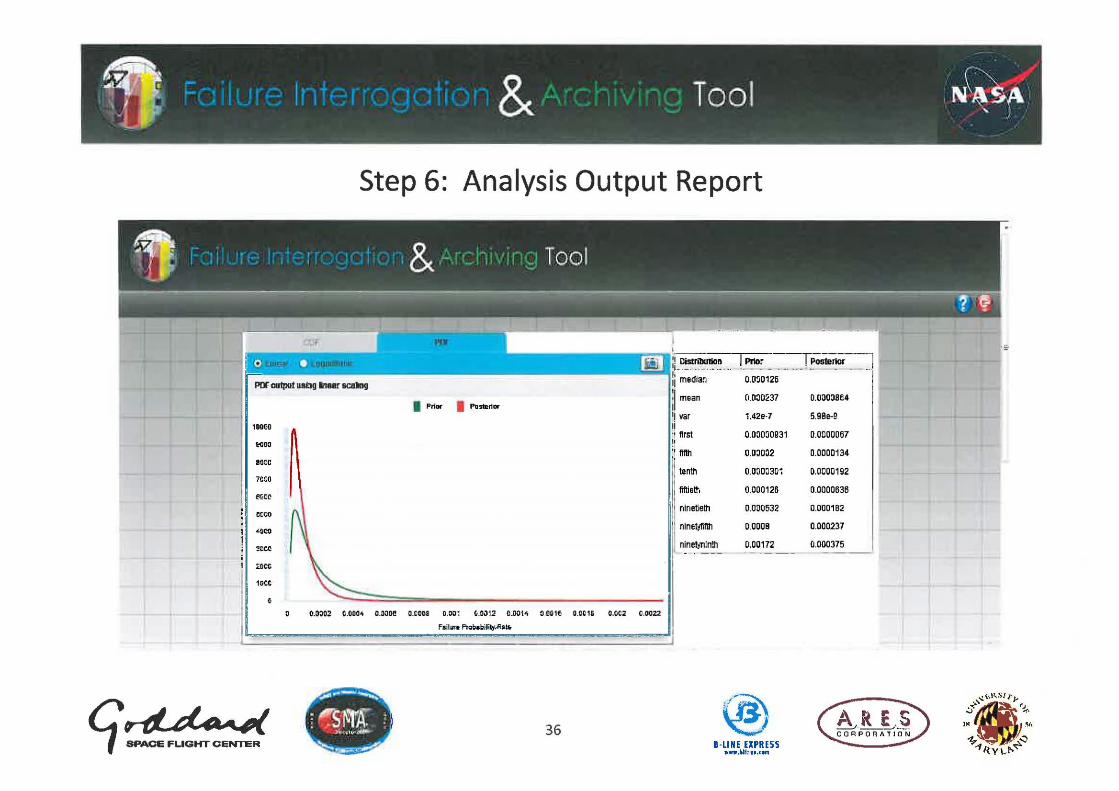
Step 6: Analysis Output Report
PDr_ ..... _scaIng
"000
!!(lOD
lIooe
7000
,,,. '00'
'"co iDtt
qrll.. d_"" SPACE FUGHT CENTER
• Prior • Pastl!rior
:l O.m2 e.0004 O.OOGe O.COOIi 11.00 : ~.O\t12 OJKI14 !lODIE- o.ton 0.0(2 D.1tIn2
Fallin ProW.ltjlil)',fI..~
36
o. f I __ . I. (f ·'
O.lr.i0126 II me !a~
.[ mean O.~~37
I. 'I Vir 1.42e·7 Ii ii nrst 0.0:lO:10931 ·0 " nfth 0.0:1002
ten'" (l.O:lO:J30~
Miett, 0.000126
ninetieth 0.000532
ninet,fil'lh 0.0008
ninetyn:nt.h 0.00172 ~----
B·LlNE EXPRESS ...... '11: U."'"
o.ooo:Jse ..
5.gSe·g
0.0000067
0.0000134
0.0000192
0.0000636
0.000182
0.000237
0.000375
1CCOC ... , 80" 700' 000' ... ,
I <00,
i .... I ,ct. i 10'" ; • ! 0.00001
, , i..
qrd.d_~ SPACE FLIGHT CENTER
Step 6: Analysis Output Report
• PriIJl" • Pos2fior
3.(:to1 0 .001 0.01
37
~; - -f Prior - - I ~sleri; ._Im-;~~an -~--0.OOO1;6--' - .-----
I mean 0.000231 D.OOooat4
V"..t ~.42e-1 5.9ae·g
I
list 0.UOO00931 O.0I:>OOOe7
IltJl 0.00002 0.0000134
I tenth O.OOOD30~ O.00001E2
lit:ieth 0.000126 0.0000636
I n!netieth 0.0:1053:£ 0.000192
I n:netyllfth 0.0009 {i.000237
! nlnetininll 0.00172 0.000375
B-LlNE EXPRESS II'ww .• ltnu.n.
Need integrated tools/capabilities to develop via Bayesian methods more accurate prediction data/risk assessments based on experience for use as
heritage data in support of currentl follow-on and new programs or projects .
./ Create an application to capture the configuration data that is needed by the RDAT Bayesian Tool
./ Build an interface to upload Anomaly/Failure data from generated SOARS Excel reports and allow the user to select specific failures for analysis
./ Enhance the RDAT tool to run on a Web server and allow inputs from the FIAT Application
./ Define and develop an interface between FIAT and RDAT Tool so that FIAT can pass configuration parameters and Anomaly/Failure data to RDAT for analysis and return results to the FIAT Application
./ Graph the statistical output data from the RDAT Tool
./ Provide a print function for the output graph and configuration parameters • Archive/Share results
{!riJ..d_~ ., SPACE FUGHT CENTER
38 B-LINIIXPRISS
www.'lIQf~.c,,"
Future Analysis Enhancements • Add additional Bayesian analysis capabilities from
RDAT including (beyond Lognormal)
• Additional options for prior and likelihood distributions
• Homogenous and non-homogenous data analysis or Beta} Gamma} Normal} Truncated Lognormal} Uniform} & Log-Uniform distributions.
• Add additional capability to calculate success data (for example for cycled equipment or mix use)
• Add common cause failure parameter estimation module
(!rlLd_~ , SPACE FUGHT CENTER
~ .... -~
'; ~.~'nf. i', '~"" ""'""
~.-. 39
B·LlNE EXPRESS ..... . UI .... fI.
.-1-.' , .... ",.,' ~ ~
III :0\"
-t.... Q ....,/{ y\.. .... ~
Future Application Enhancements • Add a function to export the output dataset to Excel
• Manage and store Prior values from:
o FIAT Analysis
o Predictions Databases
o MIL Standard Documents
• Add a function to allow users to select Prior Values that are stored
• Automate the interconnection to SOARS data and its formatting
• Add a function to allow users to save and share data analysis
• Add Weibull Analysis capability (not in RDAT)
• Go Live
qriJ..d_~ SPACE FUOHT CENTER
~ ... -....,.;;;;:
'r ~S~f\. : " .... ~, .... ~
:.-... _ • -.::iii 40
B-LlNE UPRESS w ..... 'l1ftu,ctll
Feedback? & Questions?
qriJ..d_~ SPACE FUGHT CENTER
DTMs on Aqua's Observatory B-lINE EXPRESS
...... lI~tI . ! 1 1I