reliability math and the exponential distribution
DESCRIPTION
A short review of reliability functions commonly used for life data analysis. Plus a detailed review of the exponential distribution.TRANSCRIPT

Chet Haibel ©2013 Hobbs Engineering Corporation
Reliability
Math and the
Exponential
Distribution
0 0

Chet Haibel ©2013 Hobbs Engineering Corporation
General Reliability Function, R(t)
Fraction of a group surviving until a certain time.
Probability of one unit surviving until a certain time.
Monotonic downward, assuming failed things stay failed.
0
0.2
0.4
0.6
0.8
1
0 10 20 30 40 50
1

Chet Haibel ©2013 Hobbs Engineering Corporation
General Cumulative Distribution Function, F(t)
Fraction of a group failing before a certain time.
Probability of one unit failing before a certain time.
Monotonic upward, assuming failed things stay failed.
What fraction fails at 20 (arbitrary time units)?
0
0.2
0.4
0.6
0.8
1
0 10 20 30 40 50
2

Chet Haibel ©2013 Hobbs Engineering Corporation
The probability of one unit failing between two times is found by
subtracting the CDF for the two times, in this case perhaps 0.49
minus 0.41 equals 0.08 or 8%.
0
0.2
0.4
0.6
0.8
1
0 10 20 30 40 50
General Cumulative Distribution Function, F(t)
3
Chet Haibel ©2013 Hobbs Engineering Corporation
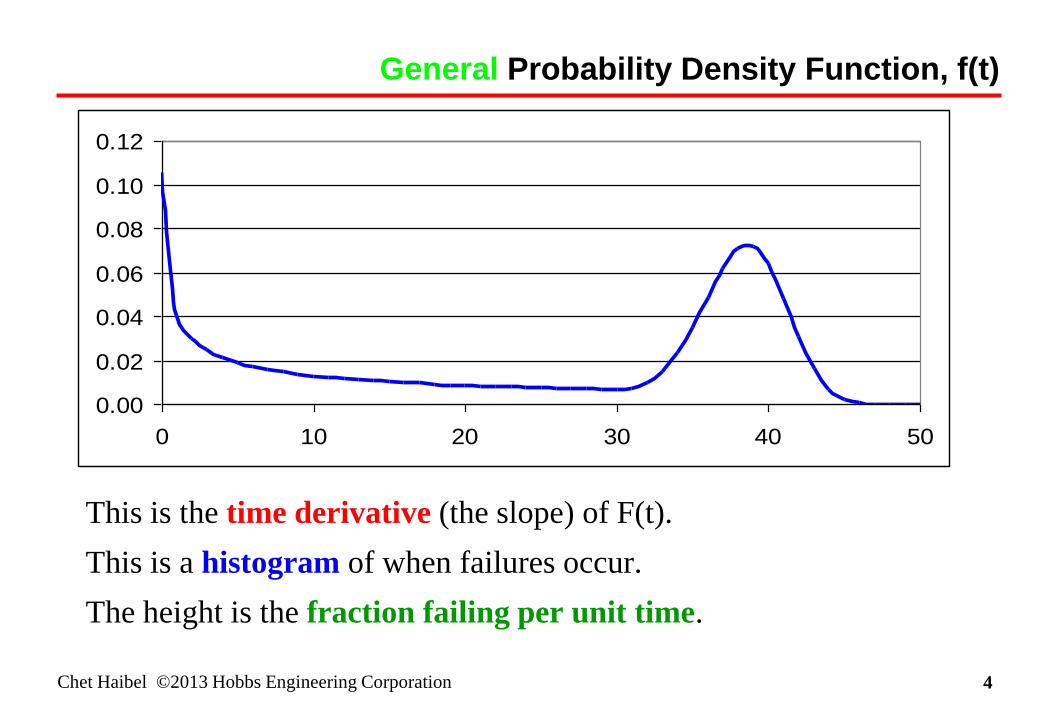
This is the time derivative (the slope) of F(t).
This is a histogram of when failures occur.
The height is the fraction failing per unit time.
0.00
0.02
0.04
0.06
0.08
0.10
0.12
0 10 20 30 40 50
General Probability Density Function, f(t)
4

Chet Haibel ©2013 Hobbs Engineering Corporation
The height is the fraction failing per unit time.
The area under the pdf between two times gives the probability
of failure during this time interval, in this case perhaps 0.008
high by 10 units long for an area of 8%.
0.00
0.02
0.04
0.06
0.08
0.10
0.12
0 10 20 30 40 50
General Probability Density Function, f(t)
5
Chet Haibel ©2013 Hobbs Engineering Corporation
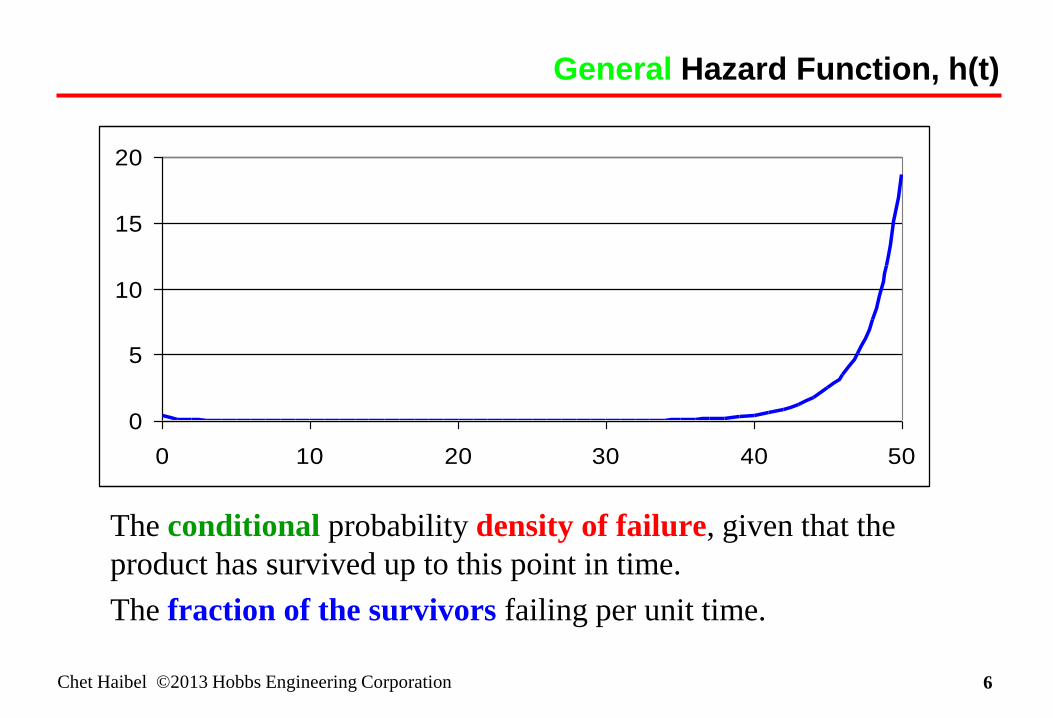
General Hazard Function, h(t)
The conditional probability density of failure, given that the
product has survived up to this point in time.
The fraction of the survivors failing per unit time.
0
5
10
15
20
0 10 20 30 40 50
6
Chet Haibel ©2013 Hobbs Engineering Corporation 7
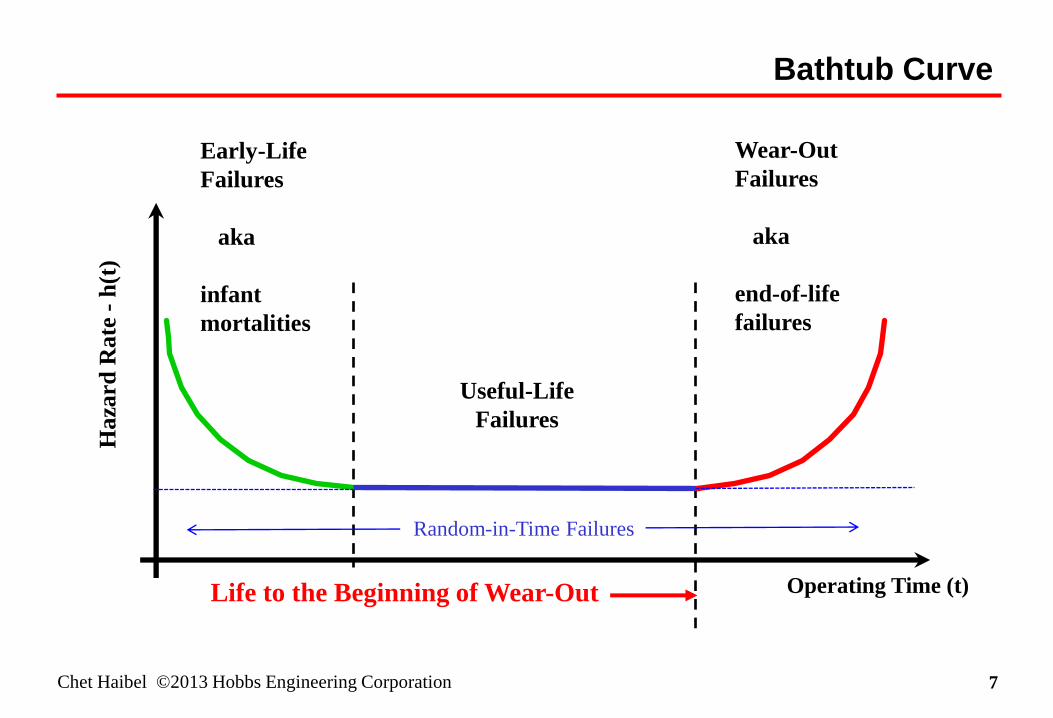
Bathtub Curve
Operating Time (t)
Haza
rd
Rate
- h
(t)
Useful-Life
Failures
Early-Life
Failures
aka
infant
mortalities
Wear-Out
Failures
aka
end-of-life
failures
Life to the Beginning of Wear-Out
Random-in-Time Failures

Chet Haibel ©2013 Hobbs Engineering Corporation
Summary of Functions Always True
R(t) = Reliability function
probability of surviving until some time
F(t) = Cumulative distribution function
probability of failure before some time
R(t) + F(t) = 1
f(t) = Probability density function failure rate
h(t) = Hazard function = f(t) / R(t)
conditional (normalized) failure rate
dt
F(t)d
8
Chet Haibel ©2013 Hobbs Engineering Corporation
Relations Among Functions Always True
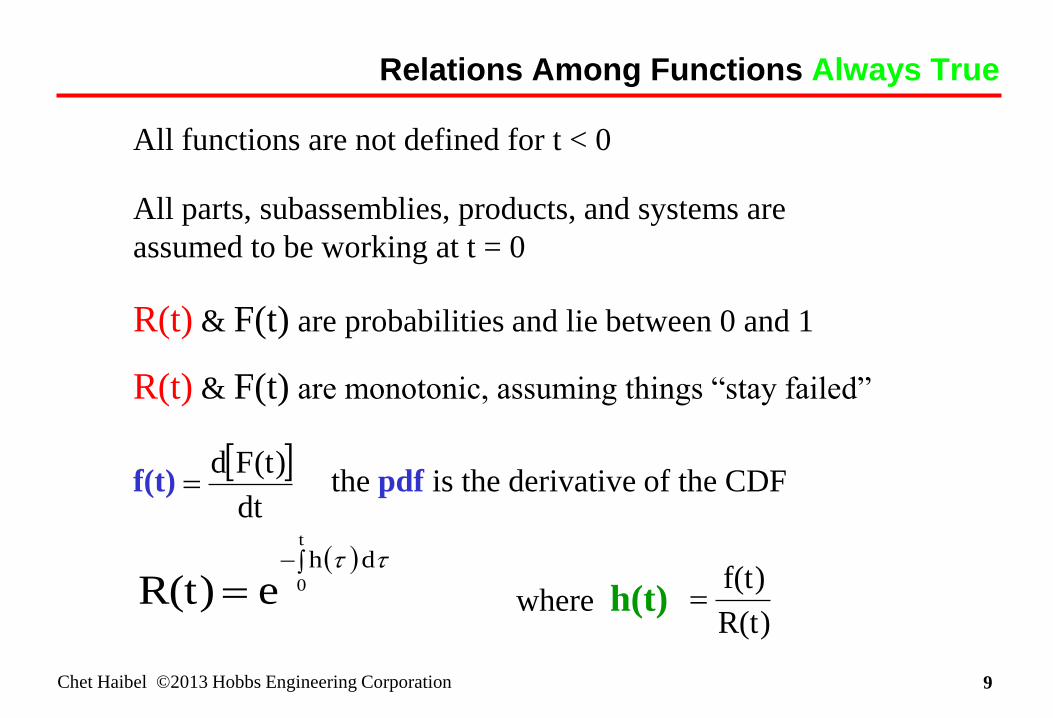
All functions are not defined for t < 0
All parts, subassemblies, products, and systems are
assumed to be working at t = 0
R(t) & F(t) are probabilities and lie between 0 and 1
R(t) & F(t) are monotonic, assuming things “stay failed”
f(t) the pdf is the derivative of the CDF
where h(t)
dt
F(t)d
t
0
d h
eR(t)
R(t)
f(t)
9

Chet Haibel ©2013 Hobbs Engineering Corporation
Is the most widely used (and sometimes misused) failure distribution for
reliability analysis for complex electronic systems.
Is applicable when the hazard rate is constant. The hazard rate is the
surviving fraction failing per unit of time or equivalent; such as percent
per million cycles, or failures per billion (109) hours (FITs).
Requires the knowledge of only one parameter for its application.
Is used to describe steady-state failure rate conditions.
Models device performance after the Early-Life
(infant mortality) period and prior to the Wear-Out
(end-of-life) period of the Bathtub Curve.
The Exponential Failure Distribution
10
Chet Haibel ©2013 Hobbs Engineering Corporation
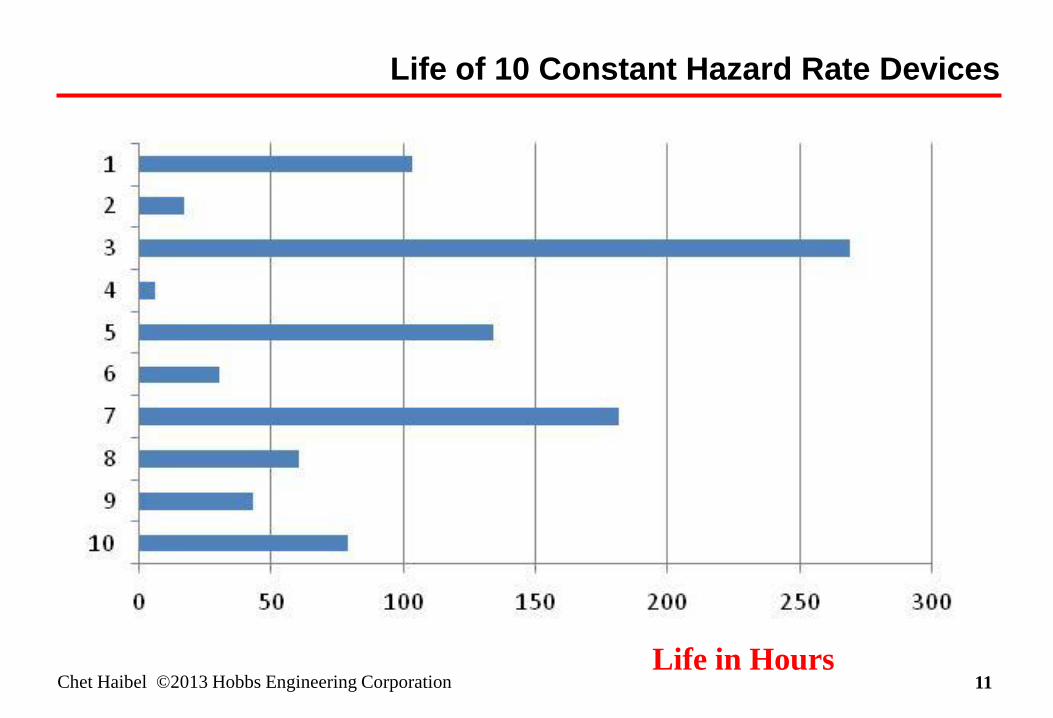
Life of 10 Constant Hazard Rate Devices
Life in Hours 11

Chet Haibel ©2013 Hobbs Engineering Corporation
Sort from First to Last 10 Constant Hazard Rate Devices
Life in Hours 12
How do the
devices know to
fail this way?
Chet Haibel ©2013 Hobbs Engineering Corporation
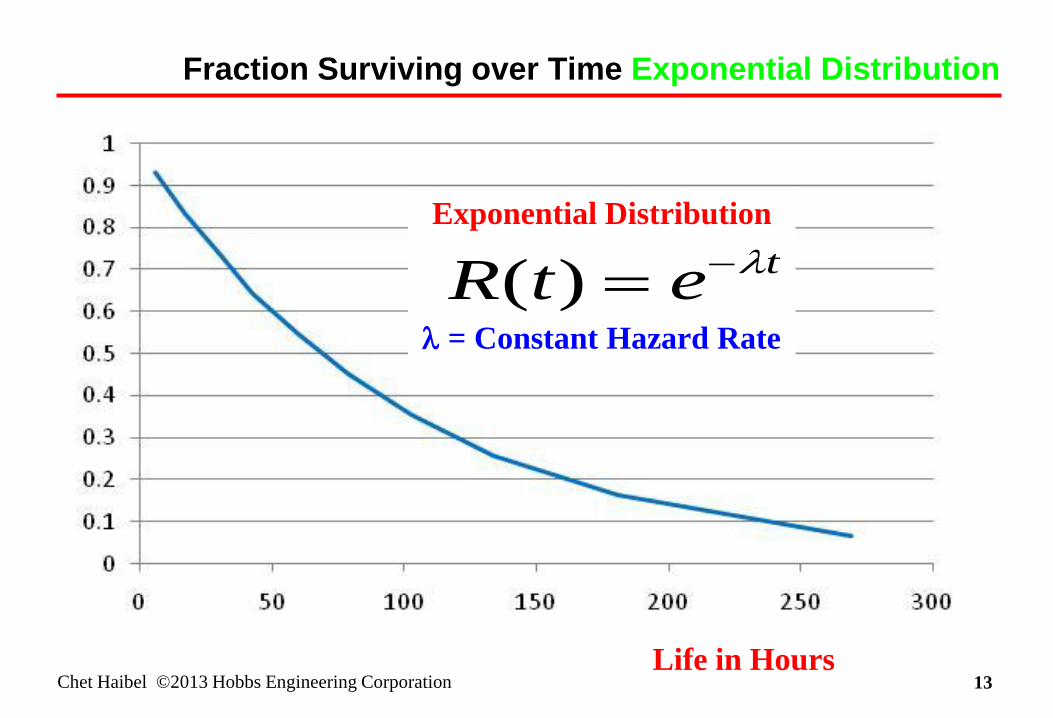
Fraction Surviving over Time Exponential Distribution
Exponential Distribution
= Constant Hazard Rate
tetR )(
13 Life in Hours

Chet Haibel ©2013 Hobbs Engineering Corporation 14
Reliability Function Exponential Distribution
R(t) = e-t Extending the initial
slope intersects the
x-axis at the mean
MTTF = 1/
Life in Hours
Chet Haibel ©2013 Hobbs Engineering Corporation
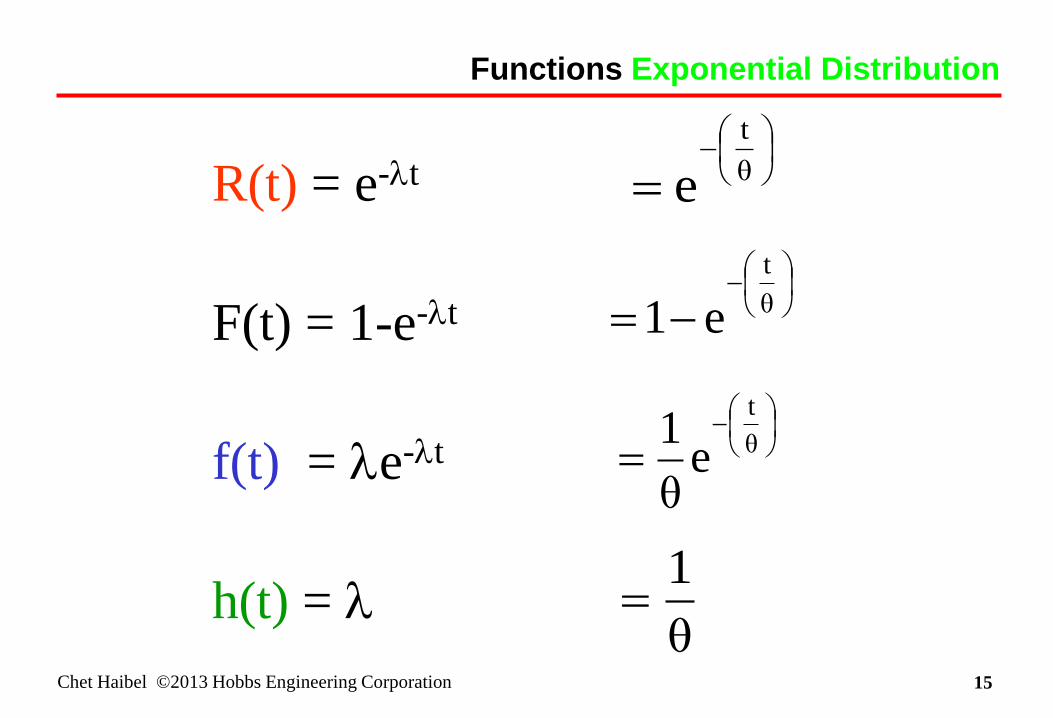
R(t) = e-t
F(t) = 1-e-t
f(t) = e-t
h(t) =
θ
t
e
θ
t
eθ
1
θ
t
e1
θ
1
Functions Exponential Distribution
15

Chet Haibel ©2013 Hobbs Engineering Corporation
Functions Exponential Distribution
Operating
Timet
f t e t( ) CDF
Operating
Timet
PROBABILITY DENSITY FUNCTION CULMULATIVE DISTRIBUTION
FUNCTION
F t e t( ) 1
R(t)
Operating
Timet
THE RELIABILITY FUNCTION
R t e t( ) h(t)
Operating
Timet
THE HAZARD RATE
Operating
Timet
f t e t( ) CDF
Operating
Timet
PROBABILITY DENSITY FUNCTION CULMULATIVE DISTRIBUTION
FUNCTION
F t e t( ) 1
R(t)
Operating
Timet
THE RELIABILITY FUNCTION
R t e t( ) h(t)
Operating
Timet
THE HAZARD RATE
Operating Timet
f t e t( ) CDF
Operating Timet
PROBABILITY DENSITY FUNCTION CULMULATIVE DISTRIBUTION
FUNCTION
F t e t( ) 1
R(t)
Operating Timet
THE RELIABILITY FUNCTION
R t e t( ) h(t)
Operating Timet
THE HAZARD RATE
1 ------
------ h(t) =
1 ------
16

Chet Haibel ©2013 Hobbs Engineering Corporation
For REPAIRABLE products, there is no limit to how many
failures one can have!
Percent of Failures Over Time(shown for 3% per month failure rate)
0%
20%
40%
60%
80%
100%
120%
140%
160%
180%
200%0
12
24
36
48
60
72
84
96
Months in Service
Repairable
Non-Repairable
H(t)
F(t)
Repairable & Non Repairable Systems Exponential Distribution
17
Chet Haibel ©2013 Hobbs Engineering Corporation
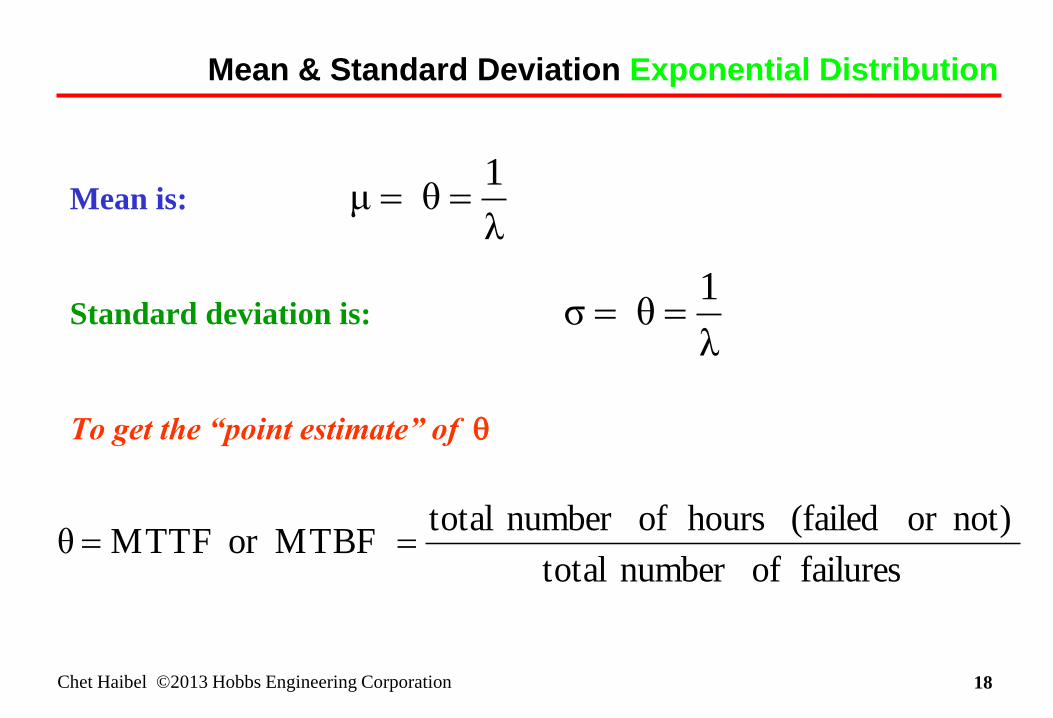
Mean is:
Standard deviation is:
To get the “point estimate” of
λ
1θμ
failures ofnumber total
not)or (failed hours ofnumber totalor MTBF MTTFθ
λ
1θσ
Mean & Standard Deviation Exponential Distribution
18