reliability issues from a management perspective · maintenance engineers ... high reliability...
TRANSCRIPT
© Barringer & Associates, Inc. 2001 1
Reliability Issues FromA Management Perspective
Paul Barringer, P.E.Barringer & Associates, Inc.P.O. Box 3985Humble, TX 77347-3985 USA
Phone: 1-281-852-6810 Website: www.barringer1.comFAX: 1-281-852-3749 E-mail: [email protected]

© Barringer & Associates, Inc. 2001 2
Definitions• Reliability—
The probability that a component, device, system, or process will perform its intended function without failure for a given time when operated correctly under specified environmental conditions.
• Life Cycle Costs—All costs associated with the acquisition and ownership of a system over its full life. The usual figure of merit is net present value.
• Reliability and Life Cycle Cost—Business issues come together as a rational task.
© Barringer & Associates, Inc. 2001 3
Reliability?!—Oh My--More Stuff To Learn!
New reliability tools are based on 60 years of experience —they are not a program of the month fornew, “laser guided”, techniques to solve costly old nagging problems we’ve attacked with “machetes”Reliability tools help reduce and eliminate future failures—plan improvements looking forward using failure data histories which look backward$Risk = (probability of failure)*$Consequence reduce $Risk to meet regulatory goals and cost containment--where pof = (1 – Reliability). Many problems get solved when converted to time and money issues.

© Barringer & Associates, Inc. 2001 4
What’s Your Reliability Policy?Your safety policy says we will have an accident free work place.Your quality policy says we will ship products free from defects.Does your reliability policy say we will have no process failures?Don’t have a reliability policy? Then get one.Managers communicate with policiesPolicies drive procedures which drive detailed rulesPolicies are strategic, procedures and rules are tactics
© Barringer & Associates, Inc. 2001 5
Who Needs A Reliability Policy
If you think “everyone knows what to do” then “few know what to do” (and welcome back to the ’50s)If you think API specs are you survival tool then welcome to an unhappy survival on minimum standardsIndividual professional organizations and their standards are not concerned with you business issuesTie specs and issues together with a reliability policy to
Make sure to do the right thing Make sure things are done rightMake sure the policy is understandable to everyone
© Barringer & Associates, Inc. 2001 6
Reliability Is A Business Issue
• Equipment failures cost money for repairs/claims• System failures halt cash inflows plus incur repair costs• Business needs equipment and processes that are
available ready for duty when needed reliable free from system failures and high costaffordable a life cycle cost issue of tradeoffs
• We speak of technology, safety, and reliability but the main issue is money which addresses life cycle costs!
• Use procedures to convert policy details into time and money so the entire organization can make business decisions

© Barringer & Associates, Inc. 2001 7
Procedures From Policies
• Spell out top level details in procedure• Address
– Cost of spills– Violation costs for errors/events– Cost of accidents– Risk levels allowed and recommended– Applicable industry specifications
• Make top level details clear and specific

© Barringer & Associates, Inc. 2001 8
Rules From Procedures
• The rules from policies are similar to your safety rules• Address failure models
– Stress-strength capacity to repel challenges– Damage-endurance capacity to repel cumulative challenges– Challenge-response failure not known until challenged– Tolerance-requirement performance outside of limits
• Address failure mechanisms– Mechanical and electrical/electronic
• Define what is a failure

© Barringer & Associates, Inc. 2001 9
Reliability vs Maintenance Engineering
• Changing the name of your maintenance organization to include the name reliability can give you style—but what about substance?
• Reliability engineering uses special tools to avoid failures—this means learning new engineering tools
• Maintenance engineering strives for fast repairs• Reliability engineering is to the fire marshal as
maintenance engineering is to fire fighters• You’ll need ~1 Reliability Engineer for every ~10
Maintenance Engineers (staff size is not increased)

© Barringer & Associates, Inc. 2001 10
Reliability Engineering ToolsTable 1
Short List Of Reliability Engineering Principles Tools • Mean time between failures
indices • TPM and reliability principles • Preparing reliability data for
analysis • Decision trees merging reliability
and costs • Weibull, normal, & log-normal
probability plots • Corrective action for Weibull
failure • Models & Monte Carlo
simulations • Pareto distributions for vital
problems • Fault tree analysis • Design review • Load/strength interactions • Software reliability tools • Sudden death and simultaneous
testing • Failure recording, analysis and
corrective action • Failure mode effect analysis
• Bathtub curves for modes of failure
• Availability, maintainability, capability
• Critical items significantly affecting safety/costs
• Quality function deployment • Mechanical components testing
for interactions • Electronic device screening and
de-rating • Quality function deployment • Reliability testing strategies • Accelerated testing • Contracting for reliability • Reliability growth models and
displays • Cost of unreliability • Reliability policies and
specifications • Reliability audits • Management’s role in reliability
improvements
ExamplesFollow

© Barringer & Associates, Inc. 2001 11
Start Your Numbers With Arithmetic
• Start with MTTF/MTBF = (Σ life)/(Σ failures)• What are you mean times between failure for:
Pumps? Heat exchangers? Valves? Etc.• Understand MTTF/MTBF which begins with
arithmetic and grows to statistics• A key long term issue: mean time between
maintenance actions--a durability issue
© Barringer & Associates, Inc. 2001 12
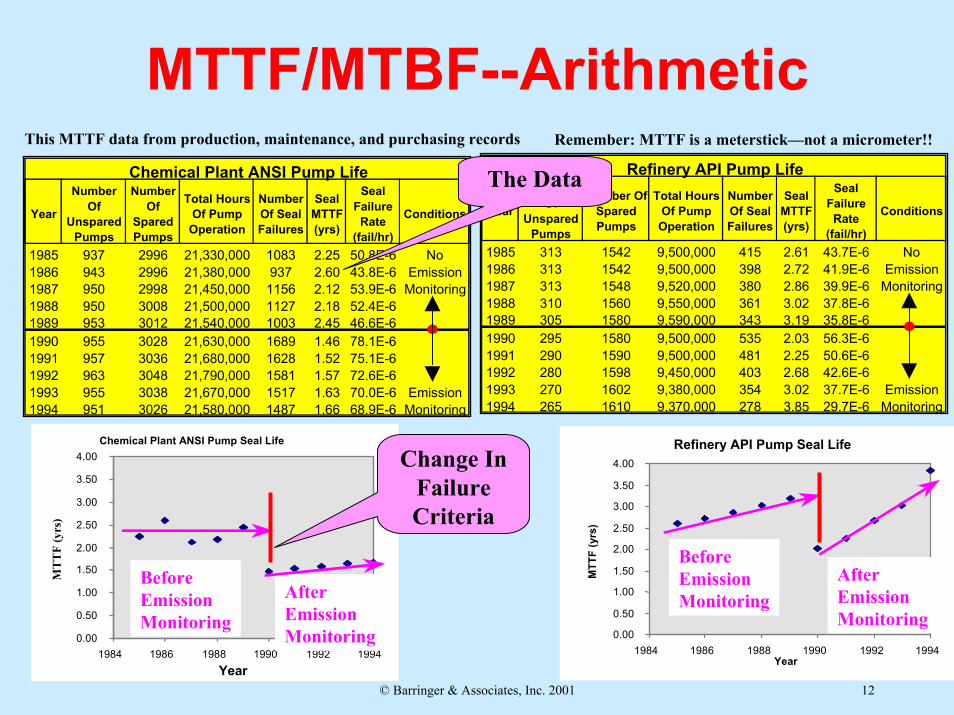
MTTF/MTBF--Arithmetic
Chemical Plant ANSI Pump Seal Life
0.00
0.50
1.00
1.50
2.00
2.50
3.00
3.50
4.00
1984 1986 1988 1990 1992 1994Year
MT
TF
(yrs
)
Chemical Plant ANSI Pump Life
Year
Number Of
Unspared Pumps
Number Of
Spared Pumps
Total Hours Of Pump
Operation
Number Of Seal Failures
Seal MTTF (yrs)
Seal Failure Rate
(fail/hr)
Conditions
1985 937 2996 21,330,000 1083 2.25 50.8E-6 No1986 943 2996 21,380,000 937 2.60 43.8E-6 Emission1987 950 2998 21,450,000 1156 2.12 53.9E-6 Monitoring1988 950 3008 21,500,000 1127 2.18 52.4E-61989 953 3012 21,540,000 1003 2.45 46.6E-61990 955 3028 21,630,000 1689 1.46 78.1E-61991 957 3036 21,680,000 1628 1.52 75.1E-61992 963 3048 21,790,000 1581 1.57 72.6E-61993 955 3038 21,670,000 1517 1.63 70.0E-6 Emission1994 951 3026 21,580,000 1487 1.66 68.9E-6 Monitoring
Refinery API Pump Seal Life
0.00
0.50
1.00
1.50
2.00
2.50
3.00
3.50
4.00
1984 1986 1988 1990 1992 1994Year
MTT
F (y
rs)
AfterEmissionMonitoring
BeforeEmissionMonitoring
Refinery API Pump Life
Year
Number Of
Unspared Pumps
Number Of Spared Pumps
Total Hours Of Pump Operation
Number Of Seal Failures
Seal MTTF (yrs)
Seal Failure Rate
(fail/hr)
Conditions
1985 313 1542 9,500,000 415 2.61 43.7E-6 No1986 313 1542 9,500,000 398 2.72 41.9E-6 Emission1987 313 1548 9,520,000 380 2.86 39.9E-6 Monitoring1988 310 1560 9,550,000 361 3.02 37.8E-61989 305 1580 9,590,000 343 3.19 35.8E-61990 295 1580 9,500,000 535 2.03 56.3E-61991 290 1590 9,500,000 481 2.25 50.6E-61992 280 1598 9,450,000 403 2.68 42.6E-61993 270 1602 9,380,000 354 3.02 37.7E-6 Emission1994 265 1610 9,370,000 278 3.85 29.7E-6 Monitoring
BeforeEmissionMonitoring
Remember: MTTF is a meterstick—not a micrometer!!This MTTF data from production, maintenance, and purchasing records
AfterEmissionMonitoring
Change In Failure Criteria
The Data
© Barringer & Associates, Inc. 2001 13
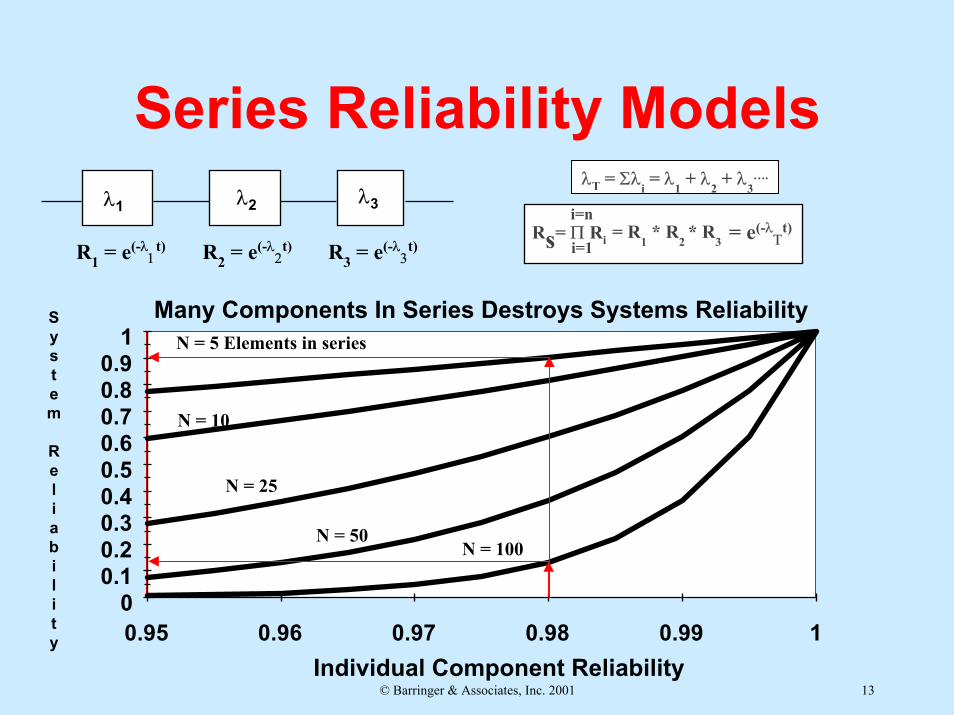
Series Reliability ModelsλT = Σλ
i= λ
1+ λ
2+ λ
3….
λ1 λ2 λ3
Rs= Π Ri
i=n
i=1= R
1* R
2 * R
3 = e(-λΤ
t)
R1 = e(-λ1
t) R2 = e(-λ2
t) R3 = e(-λ3
t)
00.10.20.30.40.50.60.70.80.9
1
0.95
N = 5 Elements in series
N = 10
N = 25
N = 50N = 100
Many Components In Series Destroys Systems ReliabilitySystem
Reliability 0.96 0.97 0.98 0.99 1
Individual Component Reliability

© Barringer & Associates, Inc. 2001 14
Parallel Reliability ModelsR1
Roverall = 1 - (1 - R1)*(1 - R2)*(1 - R3)*(….)
R21
N = 2 Elements In Parallel
N = 3
N = 4
High reliability elementsneed only a few items in parallel for achieving a high reliability system.
Components In Parallel Improve Systems ReliabilitySystem
Reliability
0.9995R3
0.9990
Each elementin parallelmust be ableto carry thefull load
0.9985
0.9980
0.99750.95 0.96 0.97 0.98 0.99 1
Individual Component Reliability

© Barringer & Associates, Inc. 2001 15
Roots Of Reliability FailuresMature Plants Frequency %
• People 38• Procedures + Processes 34• Equipment 28
100
People
Procedures/Processes
Machines
• Human reliability problems are opportunities for improvement by error proofing operations
• Some human failures are also tied to procedures and processes problems

© Barringer & Associates, Inc. 2001 16
Human Models
Time (minutes)
Probability Of Failure (%)
1 ~10010 5020 1030 160 0.1
1500 0.01
Table 2 Time Available For Diagnosis Of An Abnormal Event After Control Room Annuciation
If they don’tforget!Reliability = (1 - pof)

© Barringer & Associates, Inc. 2001 17
Reliability & NPV Models
Number of Instruments
Reliability (%) $Risk/yr Capital
Cost NPV
1 0.95 $1,000,000 $10,000 -$4,639,6362 0.9975 $50,000 $20,000 -$248,7143 0.999875 $2,500 $30,000 -$37,3204 0.99999375 $125 $40,000 -$34,9025 0.999999688 $6 $50,000 -$42,9326 0.999999984 $0.31 $60,000 -$51,485
Table 3 Device Reliability = 0.95 for 1 year mission, Failure Consequence
= $20,000,000, Device Costs = $10,000/each

© Barringer & Associates, Inc. 2001 18
Conflicting LCC Issues--What To Do?
Maintenance Engineers:Minimize repair hours
Project Engineers:Minimize capital expenditures
Production:Maximize uptime hours
Shareholders:Maximize dividends and/or share price
Accounting:Maximize project net present valueBuy right? Or
Buy Cheap?Reliability EngineersAnd Regulators:Maximize equipment reliability to avoid failures

© Barringer & Associates, Inc. 2001 19
Engineers Must Quantify All Life Cycle Costs
Engineers Must Think Like MBA’sAnd
Act Like EngineersTo Get
Lowest Long Term Cost Of OwnershipOver The Entire Life Cycle
Think NPV

© Barringer & Associates, Inc. 2001 20
Life Cycle Costs Are Fixed During Design
• Often sustaining costs (including hidden costs) are 2-20 times acquisition costs (obvious costs)
• About 65% of total LCC are fixed by the time equipment is specified (but only a few percent of funds have been expended)
• Minimizing LCC pushes up NPV• Finding the minimum LCC required details
for both acquisition costs and sustaining costs

© Barringer & Associates, Inc. 2001 21
Top Levels Of LCC CostTreeLCC = Acquisition Costs + Sustaining Costs
Life Cycle Cost Tree
Sustaining CostsAcquisition Costs
Acquisition costs and sustaining costs are not mutually exclusive—find both by gathering the correct inputs and identifying cost drivers

© Barringer & Associates, Inc. 2001 22
Getting LCC Just Right!L
ife C
ycle
Cos
t
The Sweet Spot
The High Cost Of Large Equipment—Too Many Outages And TooFew Run Hours
The High Cost Of Small Equipment With Too Many RedundanciesAnd Long Run Hours
In The Simplest Form, EffectivenessCould Be Availability
Effectiveness

© Barringer & Associates, Inc. 2001 23
LCC Thumbnail• Life cycle costs include cradle to grave costs• Including failures into LCC decisions permits
engineering quantities of manpower, spare parts, and alternatives on a rational basis rather than use of rules of thumb or emotion
• LCC provides numbers for trade-off studies and uses NPV for sound, unemotional decisions
• Monte Carlo models add realism to numbers and help find trade-off values

© Barringer & Associates, Inc. 2001 24
RE Thumbnail• Reliability policies set the organization on a
common course for a failure free environment• Reliability engineering tools predict failures
and risks for certain actions• Show engineering details in terms of time and
money for making correct trade offs• If customers and the general public are
unhappy with system reliability you need to make a change to get a change

© Barringer & Associates, Inc. 2001 25
Summary
• Set a policy for a failure free environment• Use data to predict problems and fix them• Think time, money, and alternativeS• Quantify unreliability and unreliability costs• Plan for organized improvements• Learn new tools for solving old problems• Prevent system failures

© Barringer & Associates, Inc. 2001 26
Internet Downloads
• Copies of the technical paper Reliability Issues From A Management Perspectiveand slides are available as down loadable PDF files
• http://www.barringer1.com/Papers.htm• Or use hyperlinks from
home page to reachRecent Technical Papers
Yes, that’s a capital “P”