reliability distributions
TRANSCRIPT

Reliability Distributions and
Their Use
Fred Schenkelberg


Reliability Distributions?
What is Life Data?
How do you define failure?

Lifetimes Vary
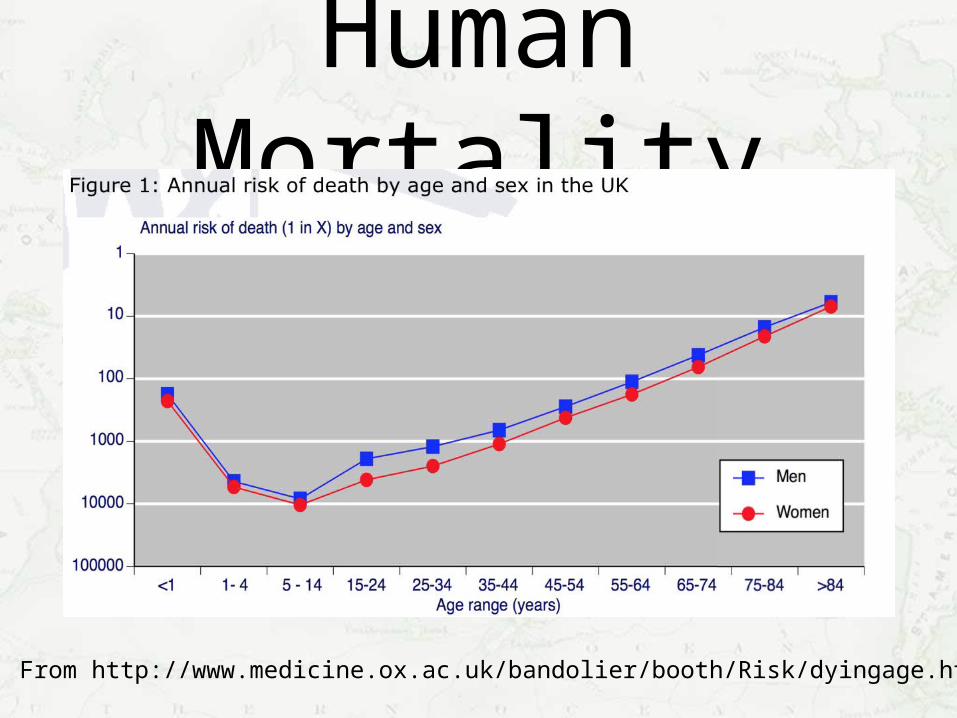
Human Mortality
From http://www.medicine.ox.ac.uk/bandolier/booth/Risk/dyingage.html

Types of data
What is wrong with the data
you have available?
What do we need to know?Common questions asked of
the data.

Good Enough?

Better Than?

Number Spares/Replacements

How can you get the data you need?

Data to HistogramLet’s take our first look at the
data
A Big Pile ofNumbers
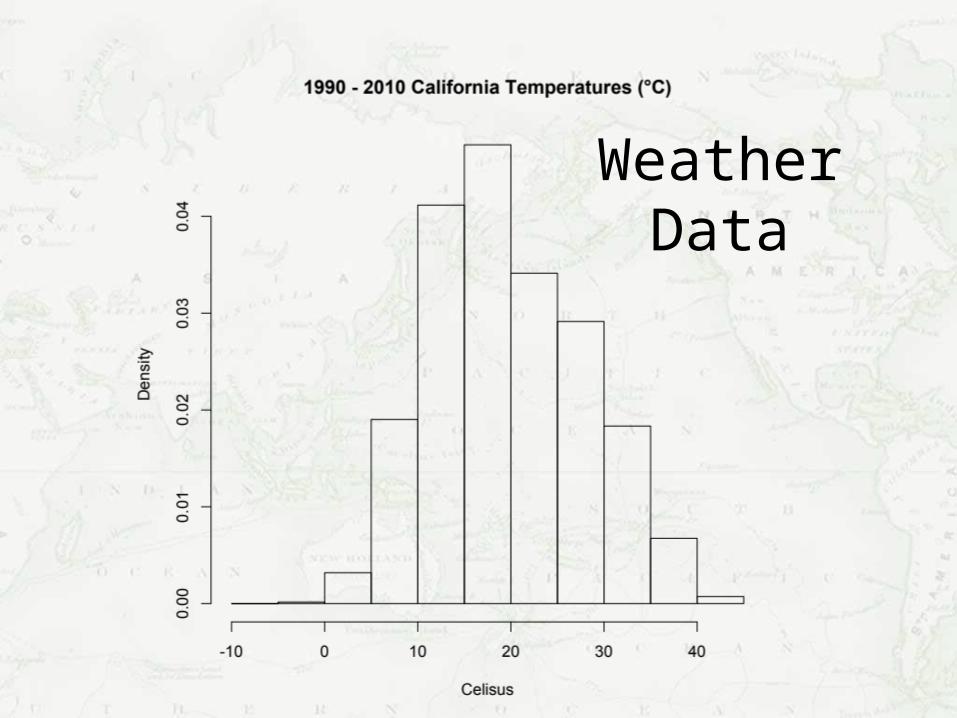
Weather Data

Warranty Returns Data
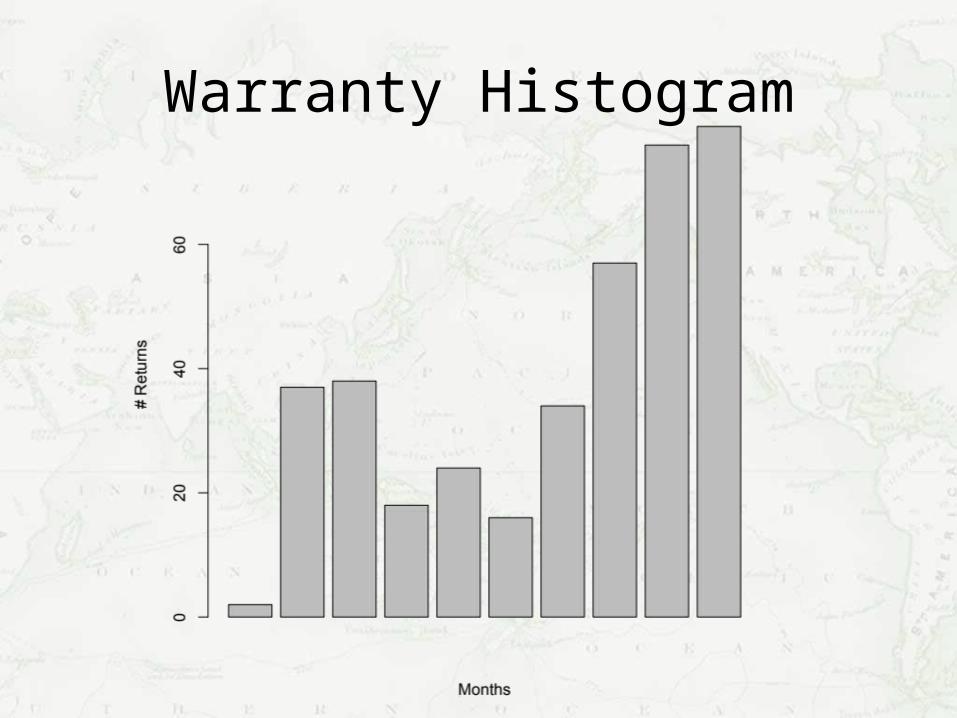
Warranty Histogram

What are your favorite data plots?
Data to Weibull CDF
Cumulative Distribution Function.
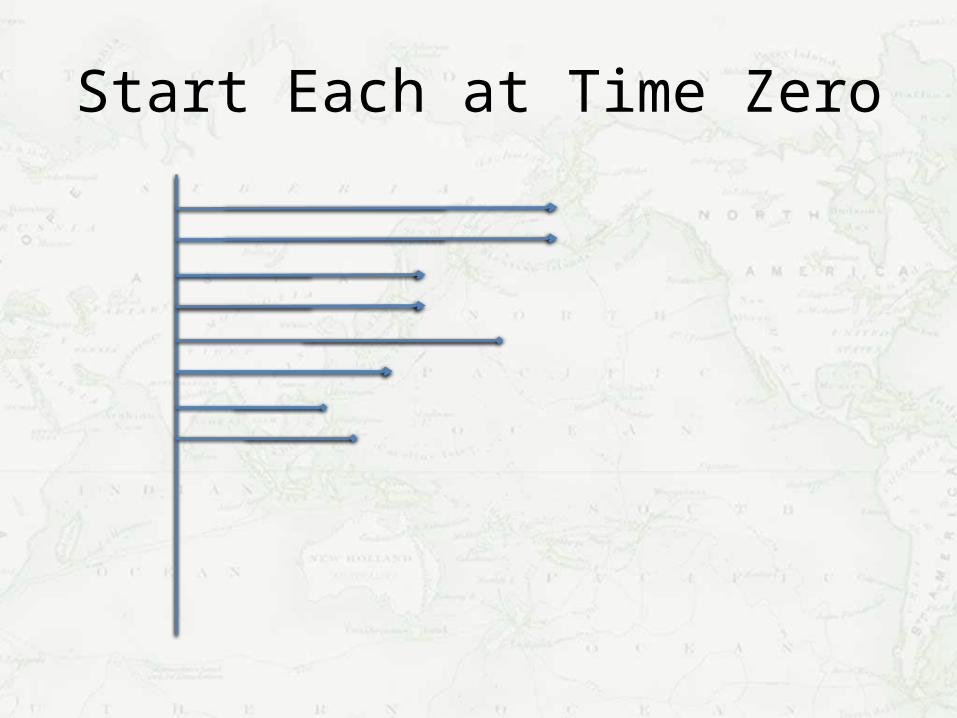
Start Each at Time Zero
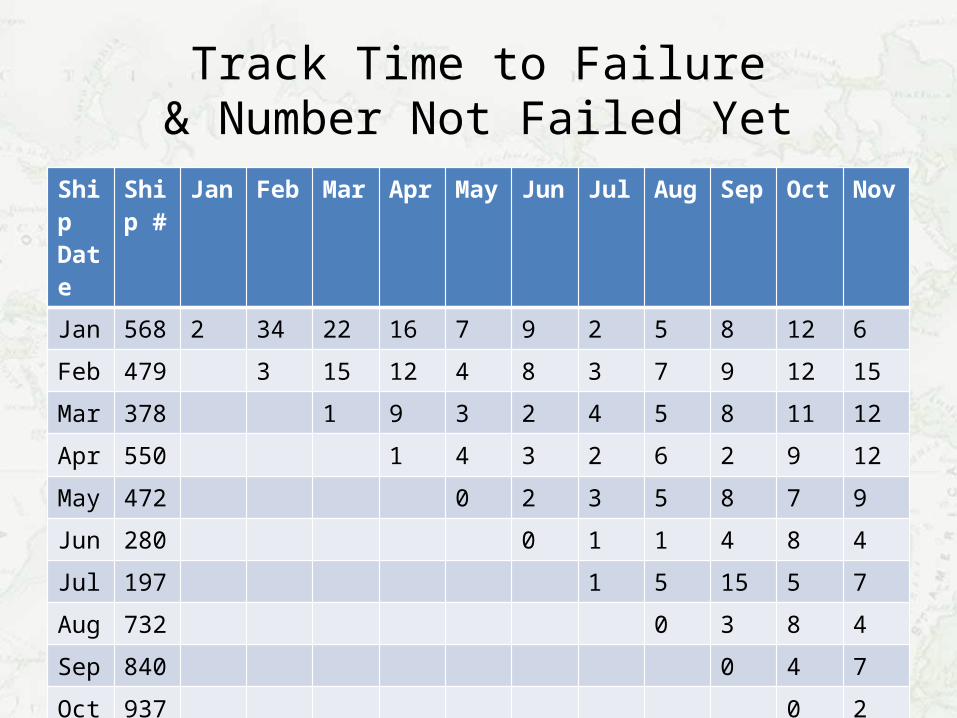
Track Time to Failure& Number Not Failed Yet
Ship Date
Ship #
Jan Feb Mar Apr May Jun Jul Aug Sep Oct Nov
Jan 568 2 34 22 16 7 9 2 5 8 12 6
Feb 479 3 15 12 4 8 3 7 9 12 15
Mar 378 1 9 3 2 4 5 8 11 12
Apr 550 1 4 3 2 6 2 9 12
May 472 0 2 3 5 8 7 9
Jun 280 0 1 1 4 8 4
Jul 197 1 5 15 5 7
Aug 732 0 3 8 4
Sep 840 0 4 7
Oct 937 0 2
Nov 358 1
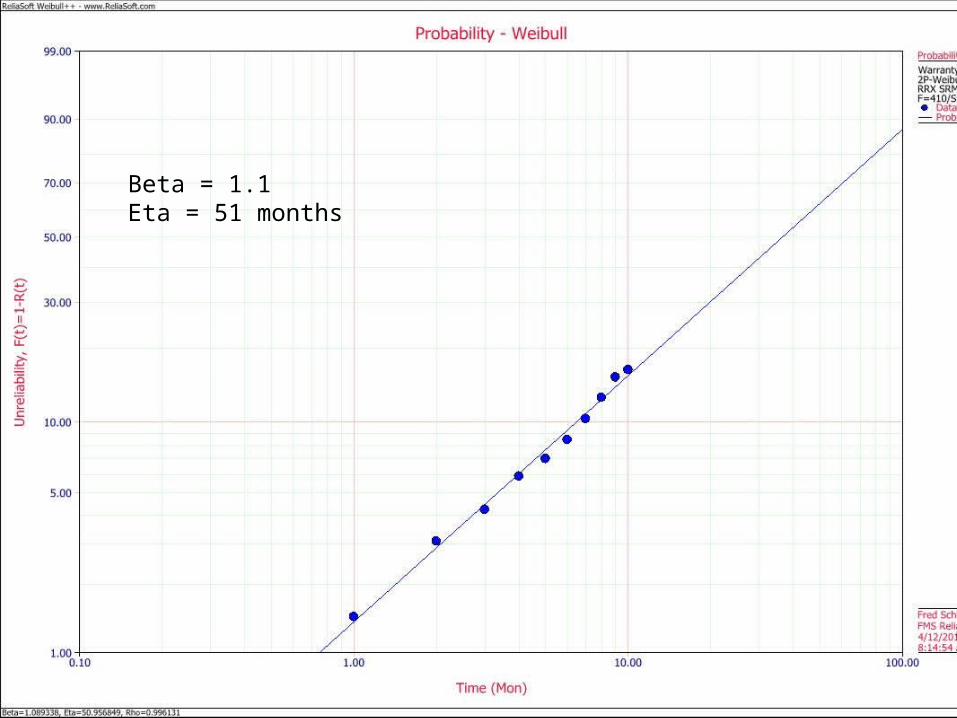
Beta = 1.1Eta = 51 months
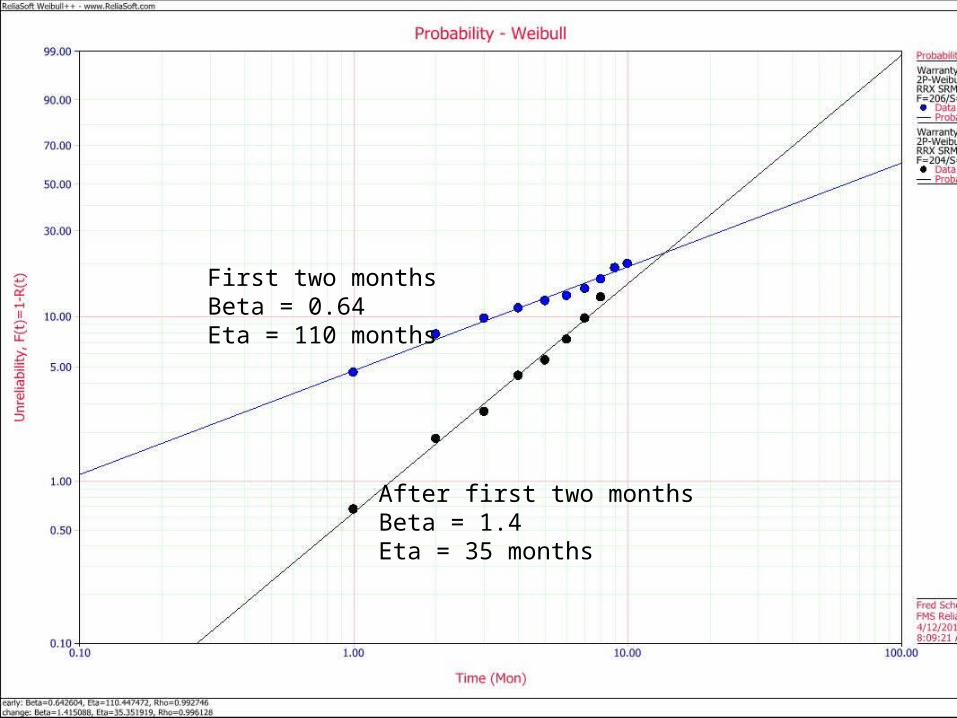
First two monthsBeta = 0.64Eta = 110 months
After first two monthsBeta = 1.4Eta = 35 months

Do you Weibull?

Exponential & Weibull
Calculations
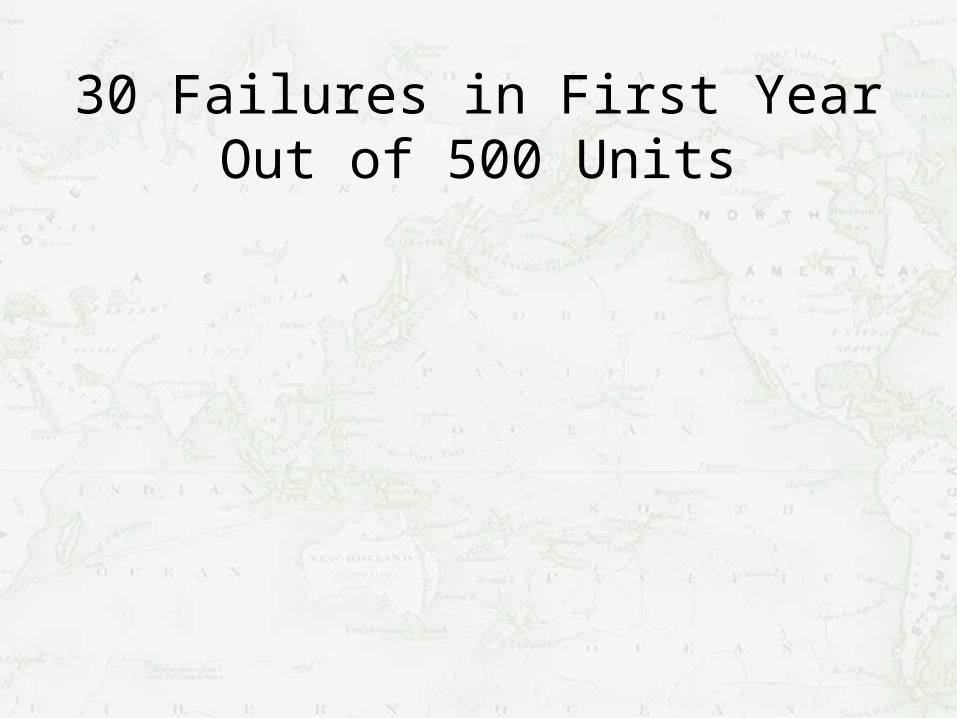
30 Failures in First YearOut of 500 Units
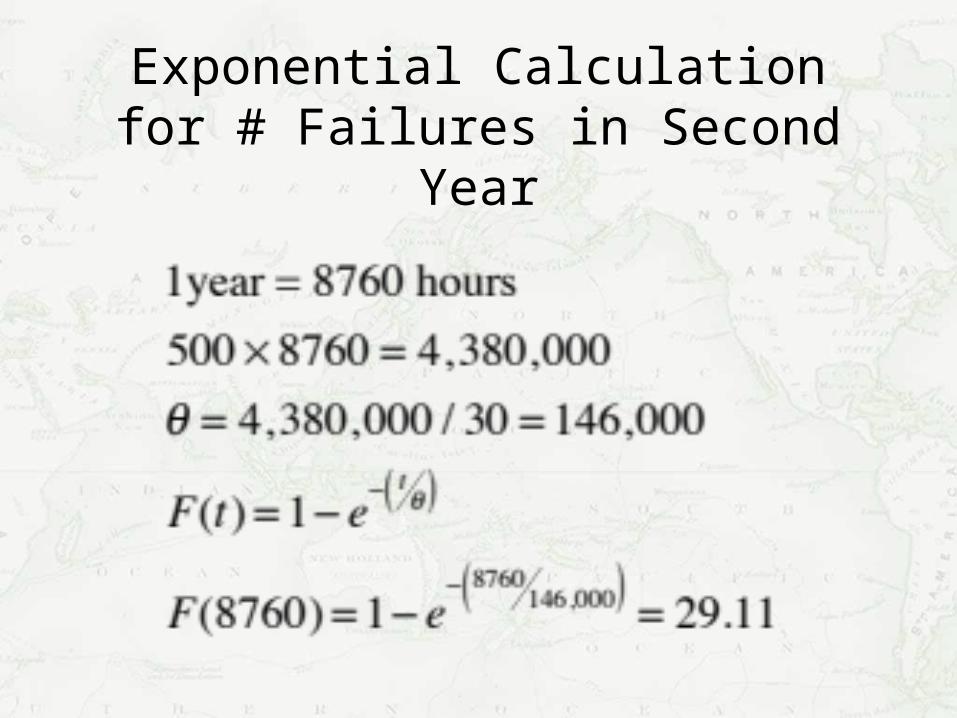
Exponential Calculationfor # Failures in Second Year
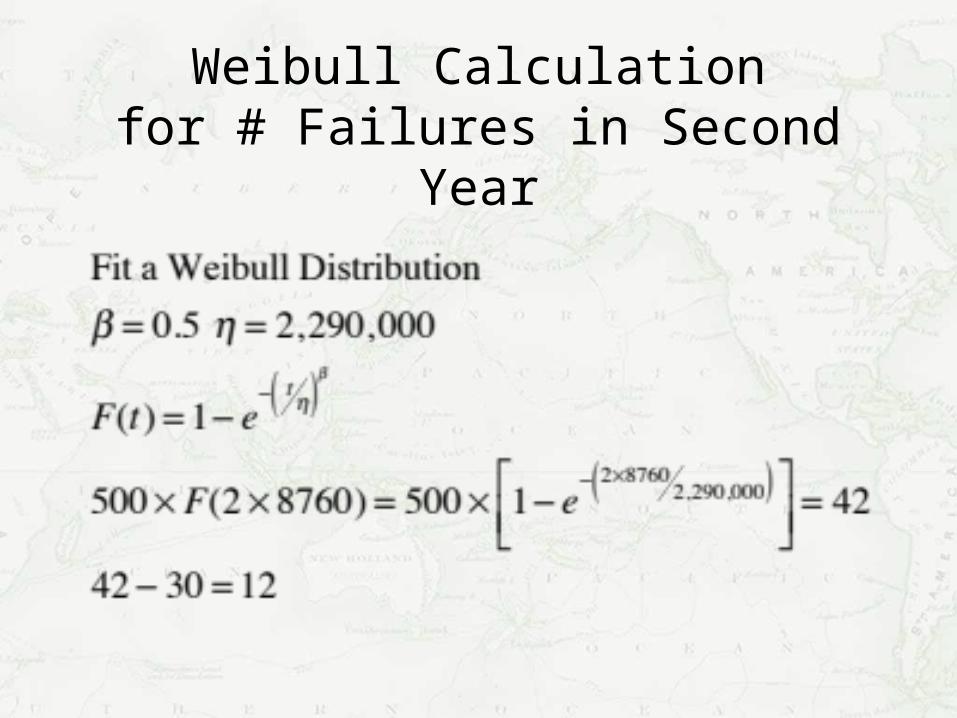
Weibull Calculationfor # Failures in Second Year
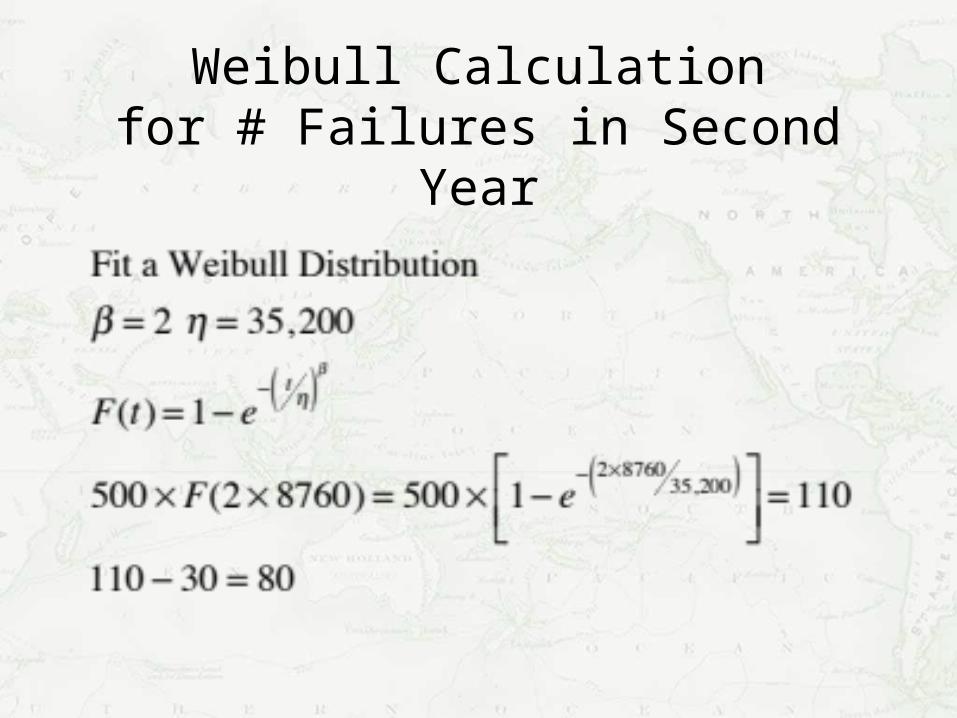
Weibull Calculationfor # Failures in Second Year
Friends don’t let friends use MTBF
Binomial and Sample Size
Success testing basic formula.

The magic of 77
Samples
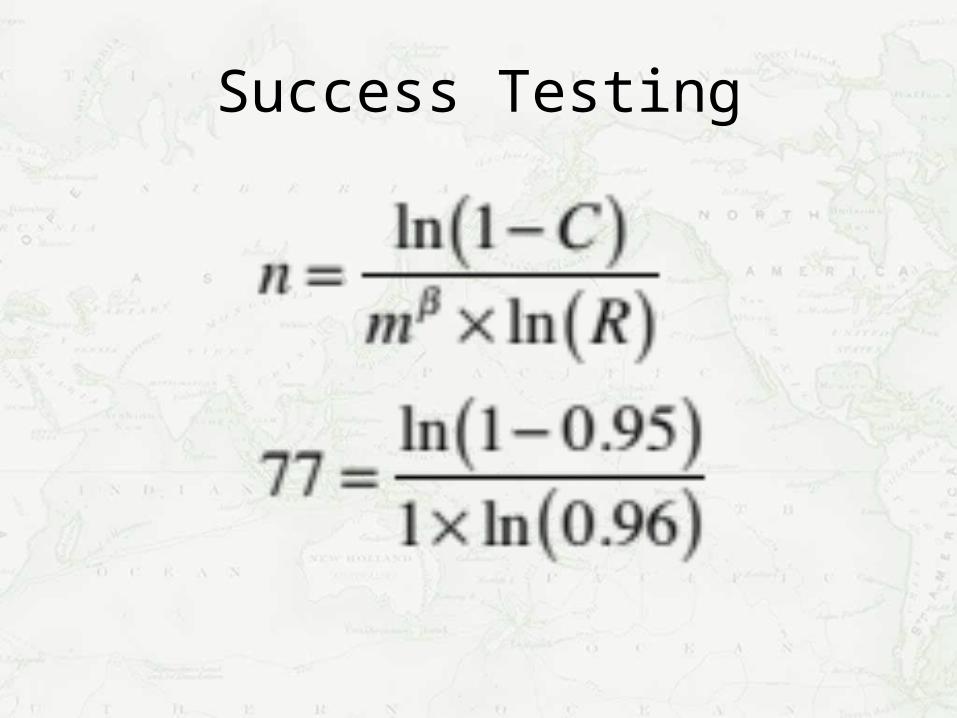
Success Testing

My Favorite - 60% Confidence

Time to check the qual
packages from your vendors

Hypergeometric
A fun use of this distribution.
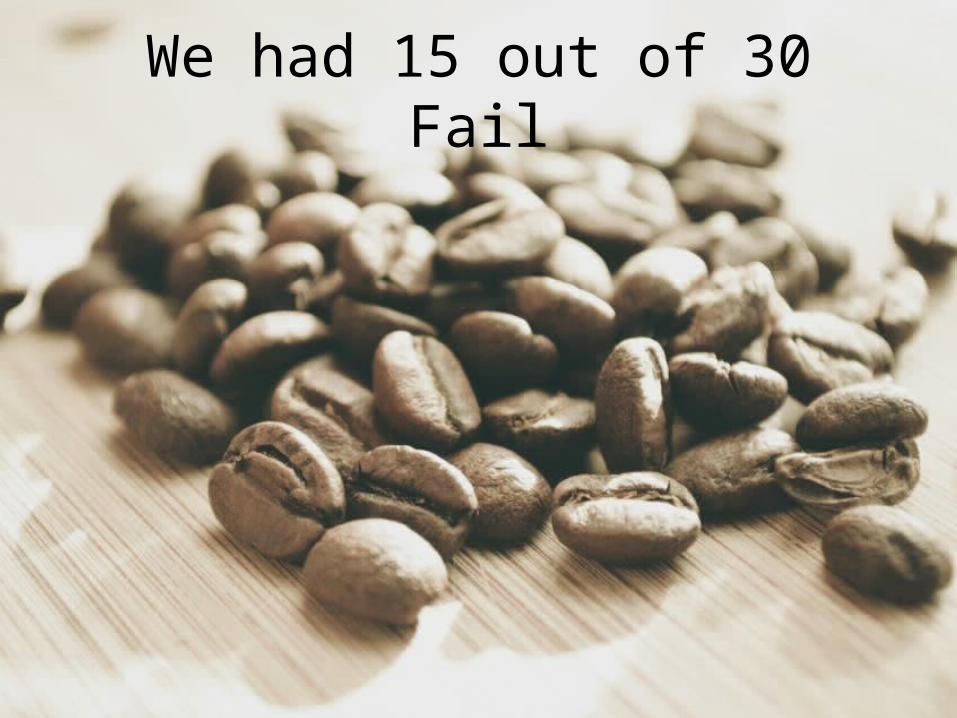
We had 15 out of 30 Fail

They Claim a 100 FIT Rate
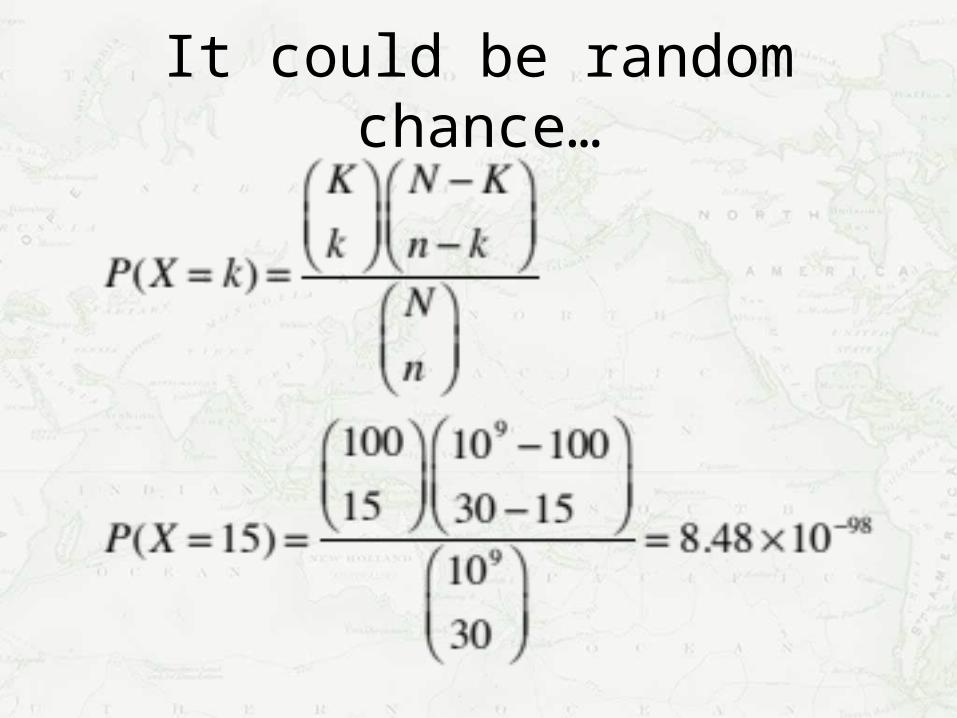
It could be random chance…
What are other uses of
a life distribution?


What are your
Questions?Thanks for participating.