reliability assessment of access point of advanced ... · pdf filei. introduction the...
TRANSCRIPT

+-IEEE Proceedings of the IEEE SoutheastCon 2015, April 9 - 12, 2015 - Fort Lauderdale, Florida
Reliability Assessment of Access Point of Advanced Metering Infrastructure based on
Bellcore Standards (Telecordia) Imtiaz Parvez, Farhan Abdul, Habeeburrahman Mohammed, and Arifl Sarwat
Department of Electrical and Computer Engineering Florida International University
Miami, Florida, USA. iparvOO [email protected],[email protected], hmohaO [email protected], [email protected]
Abstract- Since Access Point (AP) is a vital part of the
Advanced Metering Infrastructure (AMI) for
communication and data collection from smart meters,
its reliability issue has become one of the prominent
issues in the context of the Smart Grid. AP is
responsible for collecting data from humongous meters.
Any defect in or malfunctioning of the device can result
in humungous loss of data, consequently foundering the
revenue. In this paper, we assess the reliability of the
AP based on the Bellcore standards. Calculating the
failure rate is facilitated by applying this reliability
driven method for the AP. The reliability prediction for
electronic products has been used to speculate the
probable reliability level, according to the selection in
the design process, such as circuit structure,
components, and reliability structural model as well as
working environment, work stress and accumulated
statistical data.
Keywords: Access Point, Reliability Prediction, Failure Rate, Smart Grid, AMI etc.
I. INTRODUCTION
The requirement of reliability for electronic devices is becoming stringent both for military and civilian applications. Reliability prediction is an estimation method to forecast the reliability at the component as well as at the system level. Traditional unit component reliability is a manual/standard based prediction and its prophesized results are well recognized by the industry. All methods are empirical manuals based on the test data. A series of parameters including environmental issues may be determined from the manual in order to estimate the failure rate accordingly. Reliability prediction manual includes GJB/Z 299C [1], MIL-HDBK-217F [2], Bell core (Telecordia -SR-332) [3] etc. GJB/Z 299C is designed for components made in China, and MIL-
This work was supported in part through flU Graduate School Presidential
Fellowship, funded by Graduate School, Florida International University, FL 331 74, USA and NSF grant # 1 441 223.
978-1-4673-7300-5/15/$31.00 m015 IEEE
HDBK-217F represents the imported components. Telecordia- SR-332 is appropriate for commercial electronics components. Bellcore standard was developed by the Bell Labs. It was then purchased by the SAIC Company and renamed Bellcore standard as Telecordia in 1997. The latest version of Telecordia is Telecordia -SR-332 [3].
Smart Grid is a modem electric power system utilizing innovative communication and distribution entities with improved monitoring, control and efficiency. A touted feature of Smart Grid is the constitution of bi-directional interaction among its entities. In Smart Grid, AMI is the distribution level building block. In AMI, smart meters record electricity consumption and send the collected data to the utility office, serving as an input for the implementation and control of Demand Response (DR), monitoring etc. In a cluster of smart meters, up to 3000- 4500 meters can report their data through an AP. An AP is connected to the back office of the utility company by reliable wireless/ wired/ optical communication protocols. Since a single AP is accessed by 3000-4000 smart meters, the reliability of AP is very crucial for the cumulative system reliability, as well as from revenue point of view. The failure statistics of a local utility company of Florida are shown in Fig 1.
..... -Fig I. Statistics of AP failure of a local utility company
+-IEEE Proceedings of the IEEE SoutheastCon 2015, April 9 - 12, 2015 - Fort Lauderdale, Florida
§J �
0'\ ,/� � Computer , ,/ , 0) (�
,/ + , #' ' ....
� rt ........ , �
,� I"l � J , ,/ , ,/ , ,/ ,/
// 'It.. �
�- ,;/
HAN NAN AP Control room
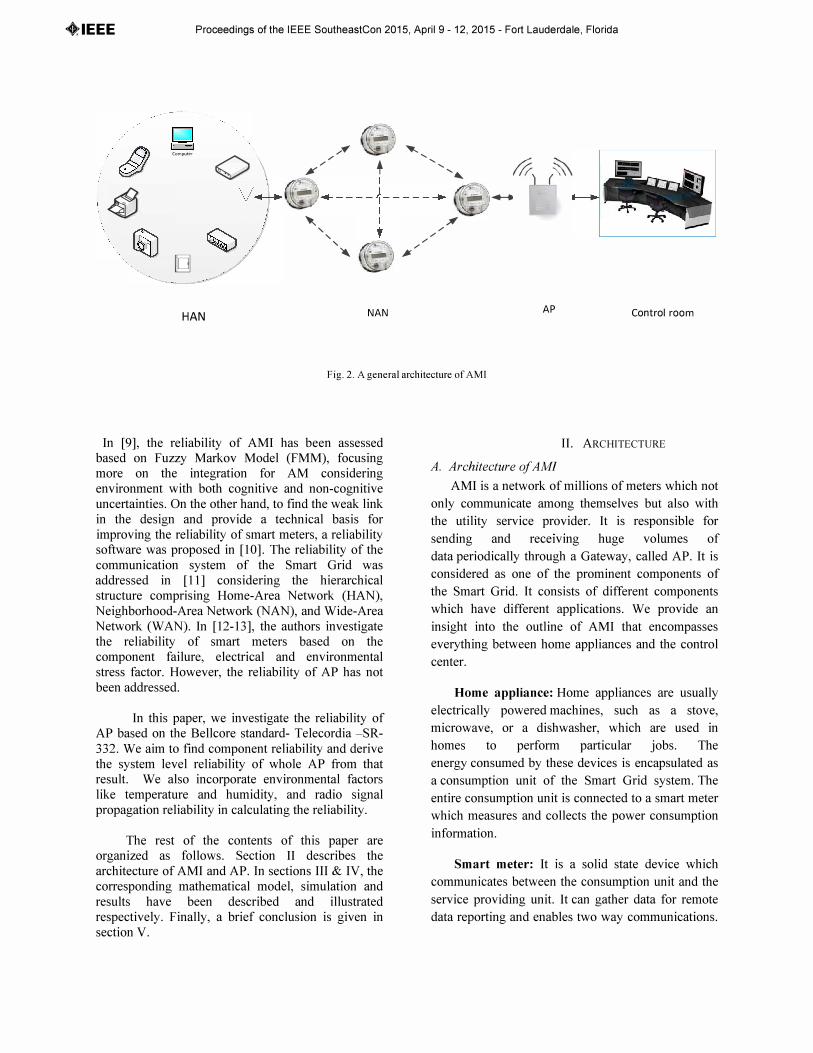
Fig. 2. A general architecture of AMI
In [9], the reliability of AMI has been assessed based on Fuzzy Markov Model (FMM), focusing more on the integration for AM considering environment with both cognitive and non-cognitive uncertainties. On the other hand, to fInd the weak link in the design and provide a technical basis for improving the reliability of smart meters, a reliability software was proposed in [10]. The reliability of the communication system of the Smart Grid was addressed in [11] considering the hierarchical structure comprising Home-Area Network (HAN), Neighborhood-Area Network (NAN), and Wide-Area Network (WAN). In [12-13], the authors investigate the reliability of smart meters based on the component failure, electrical and environmental stress factor. However, the reliability of AP has not been addressed.
In this paper, we investigate the reliability of AP based on the Bellcore standard- Telecordia -SR-332. We aim to fmd component reliability and derive the system level reliability of whole AP from that result. We also incorporate environmental factors like temperature and humidity, and radio signal propagation reliability in calculating the reliability.
The rest of the contents of this paper are organized as follows. Section II describes the architecture of AMI and AP. In sections III & IV, the corresponding mathematical model, simulation and results have been described and illustrated respectively. Finally, a brief conclusion is given in section V.
II. ARCHITECTURE
A. Architecture of AMI AMI is a network of millions of meters which not
only communicate among themselves but also with
the utility service provider. It is responsible for
sending and recelvmg huge volumes of
data periodically through a Gateway, called AP. It is
considered as one of the prominent components of
the Smart Grid. It consists of different components
which have different applications. We provide an
insight into the outline of AMI that encompasses
everything between home appliances and the control
center.
Home appliance: Home appliances are usually
electrically powered machines, such as a stove,
microwave, or a dishwasher, which are used in
homes to perform particular jobs. The
energy consumed by these devices is encapsulated as
a conswnption unit of the Smart Grid system. The
entire conswnption unit is connected to a smart meter
which measures and collects the power conswnption
information.
Smart meter: It is a solid state device which
communicates between the consumption unit and the
service providing unit. It can gather data for remote
data reporting and enables two way communications.
+-IEEE Proceedings of the IEEE SoutheastCon 2015, April 9 - 12, 2015 - Fort Lauderdale, Florida
It is capable of collecting, storing and sending data
periodically using communication networks.
AP/ Data Concentrator/ Gateway: Each smart
meter is connected to a network of smart meters
called NAN. A NAN has a concentrator (i.e.,
AP/Gateway) to collect the data packets (i.e., HEMS
traffic) from smart meters using short-range
communication technologies (e.g., Wi-Fi, ZigBee,
etc.). Different types of data packets with different
Quality of Service (QoS) requirements can be stored
in different buffers. These APs are further connected
to the control center of the utility service provider.
Control center/ Hardware and software
control system/ Utility Back office: The control
center receives data and makes a bill for the
consumer. This data is also used to optimize the
electrical power generation and
distribution. Controlling and monitoring can be done
from remote locations depending on the usage and
load requirement.
B. Architecture of AP AP is a special-purpose communication device in
wireless local area networks which allows smart
meters to connect to the back office (control center)
of the utility service providers using ZigBee, Wi
Fi, or similar standards. An AP might be connected to
a router (via a wired network) as a standalone device,
or as an integral component of the router itself.
Usually the AP (i.e. Router) is connected to the back
office/ Control center with wired/ optical
fiber/wireless medium.
AP acts as a central transmitter and receiver of
wireless radio signals. A typical AP can collect data
from 3000-4000 meters. A mainstream wireless AP
supports Wi-Fi and is most commonly used to
support public internet hotspots and other business
networks where larger buildings and spaces need
wireless coverage.
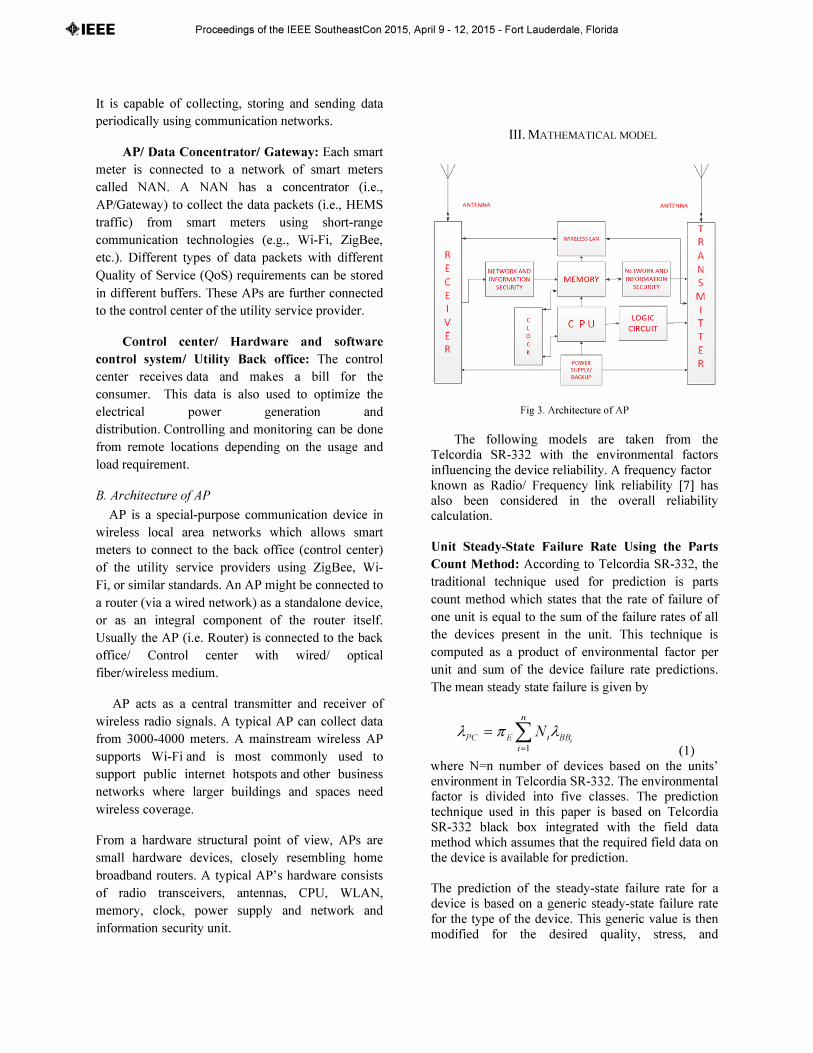
From a hardware structural point of view, APs are
small hardware devices, closely resembling home
broadband routers. A typical AP's hardware consists
of radio transceivers, antennas, CPU, WLAN,
memory, clock, power supply and network and
information security unit.
R E C E I
V E R
ANTENNA.
III. MA THEMA TICAL MODEL
ANTENNA
Fig 3. Architecture of AP
T R A N 5 M I T T E R
The following models are taken from the Telcordia SR-332 with the environmental factors influencing the device reliability. A frequency factor known as Radio/ Frequency link reliability [7] has also been considered in the overall reliability calculation.
Unit Steady-State Failure Rate Using the Parts
Count Method: According to Telcordia SR-332, the
traditional technique used for prediction is parts
count method which states that the rate of failure of
one unit is equal to the sum of the failure rates of all
the devices present in the unit. This technique is
computed as a product of environmental factor per
unit and sum of the device failure rate predictions.
The mean steady state failure is given by
n
Ape = 7[ E L N/Assi i=l (1)
where N=n number of devices based on the units' environment in Telcordia SR-332. The environmental factor is divided into five classes. The prediction technique used in this paper is based on Telcordia SR-332 black box integrated with the field data method which assumes that the required field data on the device is available for prediction.
The prediction of the steady-state failure rate for a device is based on a generic steady-state failure rate for the type of the device. This generic value is then modified for the desired quality, stress, and

+-IEEE Proceedings of the IEEE SoutheastCon 2015, April 9 - 12, 2015 - Fort Lauderdale, Florida
temperature. The black box steady-state failure rate
Ass; for device i is-
(2)
where AG; = mean generic steady state failure rate
7rQ; =quality factor for the device
7r S; =stress factor
7r T; =temperature factor
If we consider the humidity factor and radio frequency link reliability, the equation (2) becomes
(3) where
1r HT is the humidity and temperature factor I
1r F is the reliability for the frequency link I
Electric stress factor 7r s;: The value of electric
stress ranges from 0.1 to 10.6 when the minimum and maximum stress varies from 10% to 90% on most sensitive devices. An unknown stress designates a value of 50% which produces a stress factor value of 1 for all device types.
The electrical stress factor 7r S; can be calculated by
(4)
where, m define the curve obtained from the device failure rate. Po is the reference stress and PI is the stress percentage.
Temperature and Humidity factor 7r HT;: The
temperature factor which is known by the Arrhenius
equation is given as 7r T;
7r, = Exp [Ea (�-�J] T, k T T, o 1
To is the reference temperature in oK. TI is the test temperature oK. k is the Boltzmann constant = 8.62e-5 eV;oK. Ea is the Activation Energy.
(5)
If we incorporate the humidity factor with temperature, equation (5) becomes
(6)
where RHt is the humidity at test RHu is the reference humidity Ea is the Activation energy (.7eV) k is the Boltzmann's constant (8.61 * 1O-5eV/k)
Frequency link reliability 1r F : I
The reliability of radio frequency has been defined as
h ( -dr -lr J 1rr; (ro, rl ... rn) = .lrexp 1 1
1=1 Snrr, -11j ( h" -dr -lr J =exp - L... 1 1
i=1 Snrr, -11j
(7) where h is the distance of a meter from the AP. SNR is the signal to noise ratio. ro, rl ... rn are the different routes of the radio frequency channel.
IV. SIMULATION AND RESULTS
To determine the reliability of the AP, the following
parameters have been considered from Telcordia SR-
332.
Table I. Parameter I
Stress parameter Value Criteria
according
to Telcordia
I. Quality factor (a) Steps must have been taken to ensure that the
.irQ 1.0 components are compatible with the design application and manufacturing process. (b) An effective feedback and corrective action program must be in place to identity and Resolve problems quickly in manufacture and in the field. (c)Purchase specifications must explicitly identity important characteristics

+-IEEE
2.Environment
factor
3.Reference
electrical factor Po
4.Activation
energy Ea
5.Fitting
parameter
m
Reliability
Factor
Temperature
Factor( 7T Tj )
Electric Stress
Factor( 7T S; )
Humidity
Factor( 7T H; )
Frequency
F actor( 7T F; )
Proceedings of the IEEE SoutheastCon 2015, April 9 - 12, 2015 - Fort Lauderdale, Florida
2.0
50%
0.22
0.0024
(electrical, mechanical, thermal, and environmental) and acceptable quality levels (i.e., AQLs, DPMs, etc.) for lot of control. (d)devices and device manufacturers must be qualified and identified on approved parts/manufacturer's lists (device qualification must include appropriate life and endurance tests). (e) lot-to-Iot controls, either by the equipment manufacturer or the device manufacturer, must be in place at adequate AQLs/DPMs to ensure consistent quality. Environmental stress with limited maintenance and usually in the areas subjected to atmospheric variations, vibrations.
temperature,
This percentage reference of electrical stress is assumed when the reference stress is unknown and where the stress can vary from 10% to 90%. This is the amount of activation energy required for the silicon devices used in the Arrhenius �quation. This is the fining parameter for the electrical stress.
Table II. Parameter II
Parametric Values Reliability
Failure rate
45°C 0.7397
50% 1
89% 0.933
4 Hops/SNR = 13dB 0.0815
Black Box AG; 7T Q; 7T S; 7T H; 7T F; 0.2241
steady state Failure rate
(ABB; )
Mean Steady n 0.4499 State Failure Apc = 7T E L NiABB;
Rate 1=1
(Apc ) Mean
generic
steady state
failure rate Obtained from Fig. I 4
(AG; )
By using the above the parameter, we observed that
the reliability depends on different factors. In Figure
4, reliability of a silicon device against different
temperatures is plotted. The plot is a gradually
decaying curve.
Figure. 5 shows the variation of humidity in
percentage with the corresponding temperature. As
the humidity increases, there is a decrement in the
device reliability. Figure 6 shows a similarly
TemJlfrature VS. Reliability 1.5-----,--------,------,-----------,--
TemJlfrature in Degrees Celsius
Figure 4:Reliability dependence on temperature

+-IEEE Proceedings of the IEEE SoutheastCon 2015, April 9 - 12, 2015 - Fort Lauderdale, Florida
Humidity Vs R,liabilil)'
86 87 88 89 90 91 92 93 94 Humidil), in PPIT,nlage
Figure 5: Reliability dependence on humidity
Stress YS, Reliability 2,5,---------,----,------,------,------,---,------,----
• Q .. �
� 1.5 • • � • .. rfJ
25 30 35 40 45 Stress in Percentage
50
Figure 6: Reliability dependence on electrical stress
55
fashioned curve with a slightly less decaying curve of
electrical stress versus temperature.
In Figure 7, it is observed that the reliability
decreases with the increase in the number of Hops
(links). There is a gradual decrement in the reliability
with the increase in paths to the destination from the
source.
Figure 8 plots the reliability against Signal to
Noise Ratio (SNR).There is an increment in the
reliability with an increase in the SNR signal.
60
0.6
0.5 \ ... \ �0.4 \ � \ �0.3 \
" 0.2 \ 0.1
IIop Vs Rdiability
" " " " .............
L-__ L-__ L-__ L-__ �'. -•. -' •• -•• � .. -•• -• • � •• � •• = .. � .
. � .. �.� . . �. � �.�. 01 2 4 5 6 7 8 9 10 No ofIlops
0,8
£0,6 � � 0.4
0,2
Figure 7: Reliability dependence on hops
SNR Vs Reliability " ..
;,,; , I ,
I I ,
I , , I ,
I , I I
: I I
I , I I I I I I I I I I
20 40 SNR
60 80
Figure 8: Reliability dependence on electrical stress
100
The overall system reliability is calculated using the
values of Table.l and Table.2. These values are
substituted in the Equation.l and Equation.3 to get
the following results.
The overall system reliability is given as follows:
Ape = 2 x 4 x 0.7397 x 1 x 0.933 x 0.0815
= 0.4499

+-IEEE Proceedings of the IEEE SoutheastCon 2015, April 9 - 12, 2015 - Fort Lauderdale, Florida
V. CONCLUSION
Reliability analysis of AP shows an overall
Mean Steady State failure rate of 0.4499. This
assessment assumes certain standards from Bellcore,
which have been included in the calculation for the
overall reliability of the component. The system
parameters affecting the reliability of the system such
as temperature, humidity, electrical stress and radio
links can have a higher impact than the software,
procedural errors or unexpected failures. The
prediction of reliability of AP based on Bellcore
standards Telcordia SR-332 version has met the
requirements.
Based on our assumption, the overall system
reliability is 0.4499. This number can be used to
predict the actual life of AP when exposed to above
conditions. This number can be multiplied by the
total life of the AP mentioned by the manufacturer,
the product of which gives the actual life of AP. This
reliability model of AP will help us to predict the life
span of AP. So it will allow the utility service
provider to design the network accordingly and plan
a replacement schedule for AP without any
interruptions.
References
[1] GJB/Z 299C, Reliability Prediction Handbook for Electronic Equipment, Beijing: General Equipment Department of People's Liberation Army, 2006.
[2] MIL-HDBK-217F, Military Handbook Reliability Prediction of Electronic Equipment, Department of Defense, 1995.
[3] "Telcordia SR-332 Documentation Information", Reliability Prediction Procedure for Electronic Equipment, Telcordia, 2006.
[4] Lixia Zhou; Ran Cao; Chunbo Qi; Ran Shi, "Reliability prediction for smart meter based on Bellcore standards," Quality, Reliability, Risk, Maintenance, and Safety Engineering (lCQR2MSE), 2012 International Conference on , vol., no., pp.63 1,634, 15-18 June 2012
[5] R. Y. Li and R. Kang, "Reliability prediction correction method review For electronic product," In Proceedings of The Seventh International Conference on Reliability, Maintainability and Safety, 2007.
[6] W. J. Zhang, G. J. Nie, and L. X. Zheng, "Overview of the latest Reliability prediction method," Electronic Product Reliability and Environmental Testing, vol. 27, no. 2, 2009.
[7] BR-TR-332, Reliability Prediction Procedure for Electronic Equipment, No. 6, 1997.
[8]R. Cao, Y. Chen, and R. Kang, "Electronic product reliability prediction Methods and case studies based on Bellcore standards," Electronic Quality, no. 6, 2006.
[6]Telcordia SR-332, Reliability Prediction Procedure for Electronic Equipment, no. 2, 2006.
[7] Khandani, A.E.; Abounadi, J.; Modiano, E.; Lizhong Zheng, "Reliability and route diversity in wireless networks," Wireless Communications, IEEE Transactions on , vol.7, no.12, pp.4772,4776, December 2008
[9] Zonouz, S.A.; Berthier, R.; Haghani, P., "A Fuzzy Markov Model for scalable reliability analysis of Advanced Metering Infrastructure," Innovative Smart Grid Technologies (lSGT), 2012 IEEE PES , vol., no., pp.I,5, 16-20 Jan. 2012.
[10] Lixia Zhou; Xun Liao; Shunxin Li; Jincan Yuan, "Design and development of the reliability prediction software for smart meters," Quality, Reliability, Risk, Maintenance, and Safety Engineering (ICQR2MSE), 2012 International Conference on , vol., no., pp.612,616, 15-18 June 2012.
[11] Niyato, D.; Ping Wang; Hossain, E., "Reliability analysis and redundancy design of smart grid wireless communications system for demand side management," Wireless Communications, IEEE, vol.19, no.3, pp.38, 46, June 2012
[12] Ji Jing; Hou Xing-zhe; Zheng Ke; Ou Xi-yang, "Analysis on the sensitivity of smart meters failure rate based on SR-332 handbook," Electronics, Computer and Applications, 2014 IEEE Workshop on, vol., no., pp.164,167, 8-9 May 2014.
[13] Z. Yang, y.x. Chen, Y.F. Li, E. Zio, R. Kang, Smart electricity meter reliability prediction based on accelerated degradation testing and modeling, International Journal of
Electrical Power & Energy Systems, Volume 56, March 2014, Pages 209-219, ISSN 0142-0615, http: //dx.doi.org/10.1016/j.ijepes.2013.11.023.