reliability and validity of the star excursion balance
TRANSCRIPT

Western University Western University
Scholarship@Western Scholarship@Western
Electronic Thesis and Dissertation Repository
7-20-2017 12:00 AM
Reliability and Validity of the Star Excursion Balance Test in Reliability and Validity of the Star Excursion Balance Test in
Patients with Knee Osteoarthritis Patients with Knee Osteoarthritis
Lauren Kanko, The University of Western Ontario
Supervisor: Dr. Trevor Birmingham, The University of Western Ontario
A thesis submitted in partial fulfillment of the requirements for the Master of Science degree in
Kinesiology
© Lauren Kanko 2017
Follow this and additional works at: https://ir.lib.uwo.ca/etd
Part of the Rehabilitation and Therapy Commons
Recommended Citation Recommended Citation Kanko, Lauren, "Reliability and Validity of the Star Excursion Balance Test in Patients with Knee Osteoarthritis" (2017). Electronic Thesis and Dissertation Repository. 4661. https://ir.lib.uwo.ca/etd/4661
This Dissertation/Thesis is brought to you for free and open access by Scholarship@Western. It has been accepted for inclusion in Electronic Thesis and Dissertation Repository by an authorized administrator of Scholarship@Western. For more information, please contact [email protected].

i
Abstract
The purpose of this study was to investigate the measurement properties of the star
excursion balance test (SEBT) in patients with knee osteoarthritis (OA). Specific
objectives were to estimate: 1) test-retest reliability, 2) concurrent validity of observer
measurements compared to a 3D motion capture system, and 3) longitudinal validity in
response to 12 weeks of neuromuscular exercises. Thirty-eight patients diagnosed with
knee OA participated. They performed the SEBT on three test occasions. The first two
test sessions were completed within one week and the third was 12 weeks later.
Participants performed exercises at home over the 12-week period. Intraclass correlation
coefficients (ICC) ranging from 0.70-to-0.94 suggested good-to-excellent reliability.
Pearson r ≥0.96 between observer and motion capture measures suggested excellent
concurrent validity. Participants significantly improved (p≤0.05) on six directions and the
composite score of the SEBT, with standardized response means >0.4. Improvements in
the SEBT were low-to-moderately correlated with improvements in 40m walk times and
patient-reported outcomes (r=0.24-0.48) suggesting adequate longitudinal validity. The
present results suggest appropriate measurement properties for the SEBT in patients with
knee OA and support its use in clinical and research settings.
Keywords
Star excursion, standing balance, knee osteoarthritis, test-retest reliability, concurrent
validity, longitudinal validity, neuromuscular control

ii
Co-Authorship Statement
Lauren Kanko was the sole author of all chapters in this thesis. Trevor Birmingham
reviewed each chapter, assisted with revisions and approved the submitted thesis.

iii
Acknowledgments
I would like to thank my supervisor Dr. Trevor Birmingham for all of his support and
guidance over the last two years. I would not be where I am without his leadership,
patience, dedication, and mentorship. I would also like to thank Dr. Rebecca Moyer, Ian
Jones, Ryan Pinto, and Dr. Amanda Lorbergs for sharing their knowledge, providing
daily assistance, and guiding me through research and study recruitment. I would also
like to thank Dr. Dianne Bryant and Dr. Bob Giffin for providing expertise, support, and
guidance over the course of my studies.
I am very grateful for my fellow WOBL and FKSMC grad students who assisted with
data collection, provided support throughout my degree, and made my time here more
enjoyable. I would also like to thank the staff at the Fowler Kennedy Sport Medicine
Clinic, in particular Greg, Tracey, Jackie, Kathy, and Marsha for their assistance and help
with recruiting in clinic.
Thank you to the Western Bone and Joint Institute and Collaborative Training Program in
Musculoskeletal Health Research, which provided me with many invaluable
opportunities to attend informative seminars and learn from and work with students in a
transdisciplinary atmosphere.
I would also like to thank my friends for their ongoing encouragement and support during
my graduate degree. Lastly I would like to thank my family and my parents for their love,
support and guidance throughout my academic studies.

iv
Table of Contents
Abstract ................................................................................................................................ i
Co-Authorship Statement.................................................................................................... ii
Acknowledgments.............................................................................................................. iii
Table of Contents ............................................................................................................... iv
List of Tables ................................................................................................................... viii
List of Figures .................................................................................................................... ix
List of Appendices .............................................................................................................. x
List of Abbreviations ......................................................................................................... xi
Chapter 1 ............................................................................................................................. 1
1 Introduction .................................................................................................................... 1
1.1 Background and Rationale ...................................................................................... 1
1.2 Objectives ............................................................................................................... 4
1.3 Hypotheses .............................................................................................................. 4
Chapter 2 ............................................................................................................................. 5
2 Literature Review ........................................................................................................... 5
2.1 Anatomy of the Knee Joint ..................................................................................... 5
2.2 Knee Osteoarthritis ................................................................................................. 5
2.2.1 Diagnosis..................................................................................................... 6
2.2.2 Epidemiology .............................................................................................. 6
2.2.3 Risk Factors for Knee OA........................................................................... 7
2.3 Management of Knee OA ....................................................................................... 8
2.3.1 Pharmacological Management .................................................................... 8
2.3.2 Non-pharmacological Management ............................................................ 9
2.3.3 Surgical Management ................................................................................. 9

v
2.4 Research Outcomes in Knee OA .......................................................................... 10
2.4.1 Reliability and Validity ............................................................................. 10
2.5 Postural Control .................................................................................................... 11
2.6 Postural Control in Patients with Knee OA .......................................................... 12
2.6.1 Static Balance............................................................................................ 12
2.6.2 Dynamic Balance ...................................................................................... 12
2.6.3 Balance and Neuromuscular Training in Patients with Knee OA ............ 13
2.7 The Star Excursion Balance Test .......................................................................... 14
2.8 Reliability and Validity of the SEBT .................................................................... 14
2.8.1 Reliability .................................................................................................. 15
2.8.2 Construct Validity ..................................................................................... 17
2.8.3 Concurrent and Discriminant Validity ...................................................... 18
2.9 Kinematics and Muscle Activation of the SEBT .................................................. 18
2.10 Simplifying the SEBT to 3 Directions .................................................................. 19
2.11 Ability to Detect Deficits and Improvements ....................................................... 20
2.11.1 Ankle Injuries............................................................................................ 20
2.11.2 Knee Injuries ............................................................................................. 22
2.11.3 Limb Asymmetry ...................................................................................... 22
2.12 Neuromuscular Training Programs ....................................................................... 23
2.13 Summary ............................................................................................................... 25
Chapter 3 ........................................................................................................................... 26
3 Methods ........................................................................................................................ 26
3.1 Study Design ......................................................................................................... 26
3.2 Participants ............................................................................................................ 27
3.2.1 Eligibility Criteria ..................................................................................... 27
vi
3.3 Outcome Measures................................................................................................ 27
3.3.1 SEBT Test Protocol .................................................................................. 27
3.3.2 Motion Capture System ............................................................................ 29
3.3.3 Subject Preparation ................................................................................... 29
3.3.4 Knee Injury and Osteoarthritis Outcome Score (KOOS) ......................... 30
3.3.5 40m Fast Paced Walk Test ........................................................................ 30
3.4 Exercise Program .................................................................................................. 31
3.5 Data Reduction...................................................................................................... 31
3.6 Statistical Analysis ................................................................................................ 32
3.6.1 Test-retest Reliability ................................................................................ 33
3.6.2 Concurrent Validity .................................................................................. 33
3.6.3 Longitudinal Validity ................................................................................ 33
3.6.4 Sample Size Justification .......................................................................... 34
Chapter 4 ........................................................................................................................... 35
4 Results .......................................................................................................................... 35
4.1 Test-Retest Reliability .......................................................................................... 36
4.2 Concurrent Validity .............................................................................................. 38
4.3 Longitudinal Validity ............................................................................................ 39
Chapter 5 ........................................................................................................................... 44
5 Discussion .................................................................................................................... 44
5.1 Test-Retest Reliability .......................................................................................... 44
5.2 Concurrent Validity .............................................................................................. 46
5.3 Longitudinal Validity ............................................................................................ 47
5.4 Limitations ............................................................................................................ 50
Chapter 6 ........................................................................................................................... 51

vii
6 Conclusion ................................................................................................................... 51
6.1 Future Directions .................................................................................................. 51
References ......................................................................................................................... 52
Appendices ........................................................................................................................ 64
Curriculum Vitae .............................................................................................................. 70

viii
List of Tables
Table 1. Participant demographics for the two objectives of test-retest reliability and
longitudinal validity .......................................................................................................... 35
Table 2. ICC point estimates and 95% confidence intervals with the corresponding
standard error of measurement and minimum detectable change (95% level of
confidence) for all reach directions and legs. 𝑆𝐸𝑀 = 𝑀𝑆𝐸, MDC = SEM x 1.96 x 2 ..... 37
Table 3. Pearson correlation coefficients between the raw observed and the motion
capture measures of reach for each leg and direction of the SEBT. ................................. 38
Table 4. Normalized (% of leg length) reach distances, mean change, and standardized
response means for the affected stance leg at test 1 and test 3. ........................................ 40
Table 5. Normalized reach distances, mean change, and standardized response means for
the unaffected stance leg at test 1 and test 3 ..................................................................... 41
Table 6. Correlation coefficients between mean change SEBT scores and change in
functional and questionnaire outcomes to examine longitudinal validity. ....................... 41
Table 7. Correlation coefficients for the change from test 1 to test 3 in reach on the
affected leg and change in the KOOS subscales and 40m walk test. ............................... 42

ix
List of Figures
Figure 1. Study design: testing procedures for assessing reliability and validity of the star
excursion balance test in patients with knee osteoarthritis. .............................................. 26
Figure 2. The star excursion balance test set-up for the left and right stance legs. .......... 29
Figure 3. The motion capture computer software used to calculate the maximum reach for
concurrent validity of each reach measurement. ............................................................... 32
Figure 4. Bland and Altman plot showing the difference between test and retest compared
to the mean of test and retest for the composite normalized reach on the affected leg.
Horizontal lines indicate the mean ±1.96SD. ................................................................... 36
Figure 5. Mean normalized (% of leg length) reach values with standard deviations on the
affected leg for all eight reach directions at the first and last test sessions. ..................... 43
Figure 6. Mean normalized (% of leg length) reach values with standard deviations on the
unaffected leg for all eight reach directions at the first and last test sessions. ................. 43

x
List of Appendices
Appendix A. Letter of Information and Consent .............................................................. 64
Appendix B. Ethics Approval Notice ............................................................................... 69

xi
List of Abbreviations
ACL Anterior Cruciate Ligament
ADL Activities of Daily Living/Function in Daily Living KOOS subscale
AL Anterolateral Direction of the SEBT relative to stance leg
AN Anterior Direction of the SEBT relative to stance leg
AM Anteromedial Direction of the SEBT relative to stance leg
CAI Chronic Ankle Instability
ICC Intraclass Correlation Coefficient
KOOS Knee Injury and Osteoarthritis Outcome Score
LA Lateral Direction of the SEBT relative to stance leg
LAS Lateral Ankle Sprain
LOS Limits of Stability
MDC Minimum Detectable Change
ME Medial Direction of the SEBT relative to stance leg
OA Osteoarthritis
PL Posterolateral Direction of the SEBT relative to stance leg
PM Posteromedial Direction of the SEBT relative to stance leg
PO Posterior Direction of the SEBT relative to stance leg
QOL Quality of Life
ROM Range of Motion
SEBT Star Excursion Balance Test
SEM Standard Error of Measurement
SRM Standardized Response Mean
YLD Years Lived with Disability

1
Chapter 1
1 Introduction
1.1 Background and Rationale
Knee osteoarthritis (OA) is a musculoskeletal disease that affects over 241 million people
worldwide, causing significant pain and disability1. Osteoarthritis is the most common
type of arthritis and results in a significant burden on health care systems2–4. The knee is
one of the most common joints affected by OA2. Although once considered a disease
primarily of the articular cartilage, knee OA is now considered to affect the whole joint4.
Knee OA involves the breakdown and abnormalities of cartilage, bone, muscles, and
ligaments in the joint. In comparison to healthy individuals, those with OA have
decreased quadriceps muscle strength, postural control and joint proprioception5. As a
result, individuals experience pain, decreased muscle strength and function, disability,
and lowered quality of life.
Although there is presently no cure for OA, there are a variety of treatment options.
Initial conservative treatment should include exercise and patient education, with
pharmacological treatment options explored if no improvements are seen. Surgical
treatments for knee OA are considered when improvements are no longer satisfactory
with solely non-operative management options. The main goals of non-operative
treatments are to educate patients, control pain, improve function and potentially slow the
progression of disease4,6,7.
Exercise therapy and weight management are the primary non-operative treatment
options for knee OA and include aerobic and resistance exercises with patient education
regarding diet and managing symptoms. Through exercise, individuals can increase
aerobic fitness, assist weight loss, and increase muscle strength and endurance4. Aerobic
and resistance exercise can help reduce pain and increase function in individuals with
knee OA4. Exercise programs that focus on neuromuscular control of the knee are
suggested to be particularly helpful for patients with OA8,9. Such neuromuscular
exercises typically consist of quadriceps and hamstring strengthening exercises, balance

2
and postural control exercises, and functional movements such as stepping or lunging
with the aim of improving neuromuscular control10,11. Neuromuscular control requires
both the coordinated muscle activity to produce the desired movement and functional
stability to keep the joint stable during that movement10.
Although neuromuscular exercise has become a mainstay in the treatment of knee OA,
there is no widely accepted clinical tool to monitor patient progress in neuromuscular
control of the knee8–10. Many tests used in research and clinical settings are appropriate to
monitor disability and function in individuals with knee OA. Commonly used walking
and sit to stand tests include the 40m fast-paced walking test, 80m fast-paced walking
test, six-minute walk test, timed up and go, and 30-s chair-stand test12. Tests of static
balance, the use of force plates to measure postural sway, the Berg Balance Scale, and the
Community Balance and Mobility Scale are commonly used to assess standing balance13.
However, many of these test static balance, physical function or a combination of
walking and stairs. The Berg Balance Scale has also demonstrated ceiling effects in
ambulatory older adults.13 Therefore, there is no widely used clinical test that can be used
to assess improvements in neuromuscular control, which requires functional stability and
sensorimotor control produced through quality movement9.
We propose that the Star Excursion Balance Test (SEBT), a test of dynamic balance and
postural control, may fill this need. The SEBT requires participants to maintain a single
leg stance and reach with the other leg as far as possible along a line marked on the
ground14,15. The participant makes a light touch at maximal reach, returns to the centre,
and repeats this for all eight directions of the star. The maximal reach for each direction
is normalized to leg length to provide the measure of performance16. The SEBT is a
challenging dynamic task that requires postural control to maintain balance over the base
of support and adequate neuromuscular control of the stance leg to maximize reach
distance15.
The SEBT has good test-retest reliability and inter-rater reliability in healthy participants
with low standard errors of measurement (SEM) and minimum detectable change (MDC)
values17,18. It is sensitive to reach deficits in patients with lateral ankle sprain, chronic

3
ankle instability (CAI) and after anterior cruciate ligament (ACL) reconstruction
compared to healthy individuals19–22. A three-direction version of the test (anteromedial,
medial, posteromedial) has been used to reduce the amount of time necessary to perform
the test and includes the directions most sensitive to reach deficits in individuals with
CAI23,24. In individuals with knee OA, improvements were seen on the anterior and
medial directions of the SEBT following a six week lower extremity exercise program25.
The SEBT is commonly used in young healthy populations and in those with acute lower
extremity injuries, but the measurement properties have yet to be estimated in patients
with knee OA. The aim of this study was to estimate test-retest reliability, concurrent
validity of observer measurements compared to a 3D motion capture system, and
longitudinal validity in response to 12 weeks of neuromuscular exercises.
4
1.2 Objectives
The purpose of this study was to estimate the measurement properties of the Star
Excursion Balance Test (SEBT) in patients with knee osteoarthritis (OA).
The specific objectives of the study were to:
1) Estimate the relative and absolute test-retest reliability; the agreement between
SEBT measurements completed on two separate days within one week
2) Estimate concurrent validity; the association between the observer and motion
capture technology measurements of patient performance during the SEBT
3) Estimate longitudinal validity of SEBT measurements in response to 12 weeks of
neuromuscular exercises
1.3 Hypotheses
We hypothesized:
1) Excellent test-retest reliability, characterized by an intraclass correlation
coefficient (ICC) of at least 0.85. We also hypothesize that there will be relatively
low standard errors of measurement (SEM) and minimum detectable changes
(MDC).
2) Observer and camera measures of performance (distance reached) will be highly
correlated (Pearson r>0.75)
3) Performance of the SEBT will improve significantly (p<0.05) following 12 weeks
of neuromuscular exercise, with a standardized response mean (SRM) of greater
than 0.4 (i.e. a small-to-moderate effect). There will be low-to-moderate
correlations (r=0.2 to 0.5) between improvements in SEBT scores and
improvements in 40-metre shuttle walk times and Knee Injury and Osteoarthritis
Outcome scores (KOOS).

5
Chapter 2
2 Literature Review
2.1 Anatomy of the Knee Joint
The knee joint is the articulation between the tibia, femur, and patella including the
menisci and ligaments26. As a modified hinge joint, the tibiofemoral joint and the
patellofemoral joint allow flexion and rotation of the lower limb and are supported by
ligaments, muscles, and the joint capsule27. The concave medial tibial plateau articulates
with the medial femoral condyle and is supported by the medial meniscus, while the
lateral tibial plateau articulates with the femoral condyle and has a more convex surface
which allows for internal rotation26. The quadriceps muscles, composed of the rectus
femoris, the vastus lateralis, the vastus medialis, and the vastus intermedius, act to extend
the knee, while the hamstrings, composed of the semitendinosus, semimembranosus, and
biceps femoris, act to flex the knee26. The patellofemoral joint articulates with the
trochlea of the anterior femur and acts to increase the lever arm of the quadriceps
extensors26.
2.2 Knee Osteoarthritis
Knee osteoarthritis (OA) is a progressive disease of abnormalities and breakdown of the
tissues, cartilage, muscles, and ligaments in the knee joint, often leading to pain and
disability28. It is the most prevalent kind of arthritis and usually presents as joint pain,
causing decreased function or disability for older adults4. There is currently no cure, but
total knee replacement is the usual treatment for end-stage knee OA. However, knee OA
causes pain, loss of function and disability well before joint replacements are considered.
Knee OA is now known to be a whole joint disease, with changes seen in breakdown of
the articular cartilage, subchondral sclerosis, osteophyte formation, and changes in the
synovium29. Malalignment, muscle weakness, and structural damage can cause further
progression of disease in individuals already at risk4.

6
2.2.1 Diagnosis
Knee OA can be discussed in terms of imaging (x-rays, MRI) and patient-reported
outcomes. The Kellgren-Lawrence (KL) scale used to classify radiographic OA is divided
into five categories: no changes, possible osteophytes, definite osteophytes and possible
joint space narrowing, moderate osteophytes and definite joint space narrowing, and
severe osteophytes with joint space narrowing30. Joint-space narrowing of the
tibiofemoral joint and osteophytes as seen on X-ray evaluation can reflect advanced OA,
but this does not represent the full extent of the disease as soft tissues cannot be seen on
X-rays4,28. Patient-reported pain and limitations are important; a clinical diagnosis would
be made according to a patient’s pain, stiffness, disability, crepitus, reduced movement,
and increased age4,31. Although radiographs are the preferred method for diagnosis, many
patients can be asymptomatic and therefore clinical criteria to classify patients are also
important32. According to the Altman criteria, OA classification by clinical exam requires
the patient to have knee pain as well as at least three of six clinical findings; age greater
than 50 years, morning stiffness less than 30 minutes, crepitus, bony tenderness on the
joint, bony enlargement, and a lack of palpable warmth32. These criteria are 95%
sensitive and 69% specific32. MRI may be used to identify other causes of knee pain, but
many patients may have meniscal damage that does not aggravate symptoms4. MRI can
be used to quantitatively measure articular cartilage and relaxation time measures may
provide further insight into the joint, however these are costly and are not necessary for
general diagnosis33.
2.2.2 Epidemiology
Osteoarthritis is most common in the hand, hip, and knee joints, and incidence usually
increases with age and in females2,33. It is the most common form of arthritis and the
societal burden of the disease is expected to increase with the aging population4.
Estimating the prevalence of OA is difficult because diagnosis includes reading
radiographs, and many patients with radiographic OA may be asymptomatic34.

7
A review in 2011 conducted by Pereira et al.31 analyzed 72 articles to examine the
differences in prevalence and incidence estimates of knee, hip, and hand OA depending
on case definitions. When radiographic definitions were used, prevalence ranged from
7.1% in Croatia to 70.8% in Japan31. Using a symptomatic definition, prevalence ranged
from 5.4% in Italy to 24.2% in Korea. The authors suggest that radiographic definitions
tend to result in over-estimates of prevalence. Knee OA prevalence was higher in women
than in men regardless of the case definition31.
In 2014, Cross et al.3 conducted a systematic review as part of the Global Burden of
Disease study to identify the global disease burden of hip and knee OA. Seventy-two
studies were included for knee OA and 45 studies for hip OA. Of the 291 conditions
investigated in the overall study, hip and knee OA were identified as 11th for diseases
contributing to disability, as measured through years lived with disability (YLD). The
global prevalence of radiographically confirmed symptomatic knee OA was 3.8% with a
peak at age 503.
2.2.3 Risk Factors for Knee OA
There is a genetic component to OA, but the specific genes involved have not yet been
identified4. Other risk factors that are associated with knee OA include increased BMI,
age, lower limb malalignment, being female, previous knee injury, overuse, and high
bone mineral density29,35–37. Overuse from sports participation is a risk factor for knee
osteoarthritis as repetitive joint loading and torque causing knee injuries are associated
with joint degeneration35. Smoking does not have a significant association with knee OA
onset36. In addition to being a risk factor for OA, lower limb malalignment and muscle
weakness is related to disease progression in those already at risk4,37. Alignment is
measured as the angle at the intersection of the axes of the femur and the tibia, with the
load-bearing line drawn through the mid femoral head to mid ankle38. Varus alignment
occurs when the line passes on the medial side of the knee and valgus on the lateral side
of the knee37,38. Varus and valgus alignment may be due to genetic factors but alignment
can also change as a result of cartilage loss, furthering the progression of knee OA and

8
increasing malalignment38. Varus alignment increases risk of medial knee OA
progression in people with knee OA and valgus alignment increases risk of lateral knee
OA progression38. BMI is one of the few risk factors for OA that can be modified through
interventions. Targeting diet, exercise and patient education in the management of knee
OA can have a positive impact on BMI and reduce pain and disability39.
2.3 Management of Knee OA
The overall goal for management of knee OA is to educate patients, manage pain, and
improve function4. With the rising incidence of OA, mainly as a result of an aging and
overweight population, it is becoming increasingly important to diagnose and treat OA
early. Although it is difficult to diagnose early in the disease stage, treatment such as
exercise and weight management should be considered well before the end-stage of the
disease is reached and joint replacement is the primary treatment. Treatment should
emphasize patient education and should be individualized according to risk factors, pain,
and level of structural damage6,40. Treatment is usually classified as non-
pharmacological, pharmacological, and surgical, and often patients will benefit most
from combined treatment6,7,33.
2.3.1 Pharmacological Management
Pharmacological treatment usually includes acetaminophen for management of pain in
mild to moderate knee OA because it is safe, effective, and can be taken as a first line of
treatment4,7,33,39. For individuals who don’t respond to acetaminophen, non-steroidal anti-
inflammatory drugs (NSAIDs) may be used with caution but are not indicated for long
term use because of their possible negative effects on individuals with cardiorespiratory
and gastrointestinal risk factors and their potential toxicity4,7,33,39. Intra-articular (IA)
injection of glucocorticoids or hyaluronic acid (HA) can be used to provide longer lasting
(one week) pain relief for individuals who don’t respond to analgesics4,7,33. IA
corticosteroids are suggested to provide more short term benefit than IA hyaluronic acid,

9
however HA may provide better long lasting relief39. Therefore, with pharmacological
treatment options used mainly for pain relief, conservative treatment usually begins with
non-pharmacological management including exercise and weight loss.
2.3.2 Non-pharmacological Management
Non-pharmacological treatment includes education, exercise, strength training, and
weight management through exercise and diet33,39. Walking aids, braces, and footwear
may also be used as part of conservative treatment. Quadriceps muscle weakness is
thought to occur in individuals with painful knee OA because of atrophy from disuse, but
it has also been seen in individuals without painful OA35. Therefore, as a common
symptom of OA, it is important to target quadriceps strength through exercise programs.
Exercise programs, which are often a combination of aerobic activity and muscle
strengthening, provide a small to moderate treatment benefit for patients with knee OA in
terms of pain, physical function and quality of life41. Mixed programs are recommended
as both aerobic exercise and quadriceps strengthening provide patient improvements on
pain and function40,42,43. Neuromuscular programs are recommended to target not only
muscle strengthening but also muscle activation and proprioception associated with
postural control and functional stability8,10. Biomechanical interventions such as knee
braces and orthoses are also included in the guidelines for non-pharmacological
management4,7,39.
2.3.3 Surgical Management
Surgical interventions are often considered after non-operative management options fail
to provide satisfactory improvements in pain and function. Surgeries include arthroscopy,
osteotomy and joint replacement4. Arthroscopic debridement was thought to help with
pain and function by removing cartilage and debris in the joint44,45. However,
arthroscopic debridement does not provide significant patient improvements for knee
OA45,46. Medial opening wedge high tibial osteotomy provides improvements in dynamic

10
knee joint loading and patient-reported outcomes for patients with medial knee OA47. It is
suggested for younger patients with symptomatic knee OA to delay knee replacement
surgery7,47. Knee replacement surgery is now increasingly common, and is cost-effective
for treatment of end-stage arthritis when other treatments have failed4,48. Preoperative
function is an important indication of function postoperatively, therefore non-surgical
management such as exercise should continue even if total joint replacement may
eventually be necessary4.
2.4 Research Outcomes in Knee OA
In clinical research of knee OA, both performance-based tests of physical function and
self-reported measures are commonly used. The Osteoarthritis Research Society
International has recommended the use of the 30-s chair-stand test, 40m fast-paced walk
test, a stair-climb test, timed up-and-go test, and 6-minute walk test for patients with hip
and knee osteoarthritis12. The Knee Injury and Osteoarthritis Outcome Score (KOOS)
and WOMAC (Western Ontario and McMaster Universities Osteoarthritis Index) are
commonly used self-reported measures for knee OA49,50. It is recommended that both
performance-based tests of physical function and self-reported measures be used in
research, as they measure somewhat different parameters. These types of outcome
measures often show only moderate correlations with one another. For example, many
performance-based tests do not capture the breadth of information covered in a self-
reported measure and vice-versa51–53.
2.4.1 Reliability and Validity
Good measurement properties of rehabilitation outcomes are necessary to ensure that
measurements are free from error and give accurate information about the construct that
the outcome is supposed to measure. Reliability is arguably one of the most important,
fundamental measurement properties suggesting a tool’s usefulness because it represents
the extent to which a measure is free from error54. Test-retest reliability is essential to

11
determine that measures do not change within a specified amount of time when no
change has occurred. Relative reliability gives an estimate of the ratio of subject
variability compared to the total variability, which includes subject variability and
measurement error55. This enables researchers and clinicians to determine the variability
due to error expected beyond the subject variability. Absolute reliability, calculated as the
standard error of measurement (SEM), gives an indication of the error of a measurement
and is expressed in the same units as the original test54,56. The SEM can be used to
indicate the expected range of scores due to error in retesting and is used to calculate the
minimum detectable change (MDC) that would be needed for a true change to occur54.
Validity is also important because it provides an indication of the accuracy of an
instrument and whether the tool measures what it intends to measure54. Longitudinal
validity evaluates the validity of a test over time, which can be related to responsiveness.
However responsiveness includes the ability of the tool to detect a meaningful change
over time, which involves a minimal clinically important difference54,55. This value is
usually determined through clinician expertise, determining whether the change is
significant to the patient, or with the use of an additional health status measure54. Another
facet of validity is concurrent validity, which compares the tool against another tool
measuring the same construct at the same time54,55. Adequate measurement properties are
important to ensure tools being used in rehabilitation and research measure what they
intend to measure with low error.
2.5 Postural Control
Postural control is a complex motor skill that allows us to identify a threat of our line of
gravity falling outside our base of support, and respond with muscle and central nervous
system changes to maintain balance57. Joint proprioception combines the sense of motion
of a joint and the sense of joint position and uses feedback from mechanoreceptors to
activate muscles and modify position58. Sensorimotor or neuromuscular control requires
coordinated muscle activity to make controlled movements8. As sensory deficits and poor
muscle strength or activation may impede neuromuscular control, it is an important
measure to monitor during knee OA management.

12
2.6 Postural Control in Patients with Knee OA
2.6.1 Static Balance
Patients with knee OA performed significantly worse than healthy controls on static
(standing) balance tests13. Patients with knee OA demonstrated impaired balance
compared to healthy controls when tested on dynamic and static balance conditions on a
Biodex Stability System59. Balance tests that have been used to study patients with knee
OA include the Step Test, the Berg Balance Scale, Single Leg Stance Test, and
Functional Reach Test13. However, the Step Test, Single Leg Stance Test, and Functional
Reach Test are all primarily measures of static or standing balance13 and their functional
relevance is questionable. The Berg Balance Scale measures static and dynamic balance
through 14 different tasks, but it has demonstrated ceiling effects in an OA
population13,60.
2.6.2 Dynamic Balance
Individuals with knee OA demonstrate postural control impairments on dynamic balance
tasks compared to healthy controls5,61,62. Dynamic postural control can be negatively
affected in individuals with knee OA through reduced proprioception, muscle weakness,
and joint pain63,64. Individuals with knee OA show greater postural sway compared to
healthy controls in both eyes open and eyes closed static and dynamic sway testing65. In
addition to greater postural sway, individuals with knee OA also demonstrate frontal and
sagittal plane knee instability compared to healthy controls66. Voluntary quadriceps force
production is lower in individuals with knee OA compared to healthy controls and
individuals have decreased joint proprioception5,62. Better single leg balance performance
in individuals with knee OA is associated with less pain and varus alignment, and better
quadriceps torque67. Standing balance and varus alignment are related to degenerative
changes in individuals with knee OA, indicating that standing balance tests are useful in
evaluating neuromuscular performance68. Balance and postural control impairments may

13
decrease functional abilities and increase fall risk in patients with knee OA. Individuals
with knee OA demonstrate static and dynamic balance deficits compared to healthy
individuals as a result of many factors including muscle and proprioception deficits.
However, there are not many challenging dynamic balance tests that require
neuromuscular control for a population with knee OA. Therefore, it is difficult to
evaluate improvements following exercise programs that target lower limb strength and
neuromuscular control.
2.6.3 Balance and Neuromuscular Training in Patients with Knee OA
Exercise is one of the most important non-surgical treatment modalities for knee OA, and
this includes land exercise, water exercise, and strength training39. Low impact exercise
can increase muscle strength, aerobic capacity, and is also important for weight loss and
management69. Patients with knee OA have muscle weakness, particularly in the
quadriceps, and functional deficits in postural control10. Neuromuscular training
programs incorporate weight-bearing exercises that often resemble functional activities to
build strength and emphasize movement control and quality8,10. Training programs are
individualized, with a focus on strength, balance, coordination, and proprioception, while
challenging individuals to maintain movement quality during functional tasks8.
Neuromuscular training can be applied to a spectrum of degenerative knee disease, from
younger individuals after a major injury to older adults with knee OA8. Neuromuscular
training is feasible for patients with knee OA in terms of self-reported pain and shows
promise for improvements in self-reported pain and physical function9,10. Individuals
with knee OA have demonstrated improvements in dynamic balance and strength on the
affected limb following a six-week exercise program focused on lower extremity
muscles25.

14
2.7 The Star Excursion Balance Test
The star excursion balance test is a test of dynamic balance that requires participants to
maintain a single leg stance and reach with the other leg as far as possible along a line
marked on the ground14. The maximum reach is measured for each direction and the
scores are interpreted as a measure of dynamic balance14. Eight lines are taped on the
floor at 45 to each other, and the participant stands at the centre of the eight lines15. The
participant is instructed to reach as far as possible with the non-weightbearing leg in each
direction, tap lightly on the tape, and return to the centre. This is performed for all eight
directions of the star, which are termed anterior (AN), anteromedial (AM), medial (ME),
posteromedial (PM), posterior (PO), posterolateral (PL), lateral (LA), and anterolateral
(AL), all relative to the stance leg15. The test challenges the postural control system as the
leg reaches outside of the centre of mass, and adequate neuromuscular control is required
to increase the excursion distance of the reaching leg15.
Trials are discarded and repeated if the participant lifts or moves the stance foot, loses
equilibrium at any point, places considerable support on the reaching foot, does not tap
lightly on the line, or fails to return to the starting position15,19. The SEBT is performed in
all eight directions for each stance leg. Reach distances are normalized to leg length,
defined as the anterior superior iliac spine to the centre of the ipsilateral medial
malleolus, to control for variation among individuals16. Four practice trials and three test
trials are usually conducted17,24.
2.8 Reliability and Validity of the SEBT
Reliability of rehabilitation tests is essential to determine that the measurement error of a
test is small enough such that the tool can detect actual changes in the value being
measured70,71. Measurement of health status and function over time is an important aspect
of monitoring OA progression, but there is no gold standard test of function72. Well-
conducted studies that investigate measurement properties of physical function tests are

15
important to provide clinicians and researchers with the information to choose
appropriate tests and to interpret when meaningful change has occurred.
2.8.1 Reliability
The first study of the reliability of the SEBT was conducted with 20 healthy young
participants who performed the SEBT on two separate occasions, seven days apart14. Five
trials were performed in each of the four directions; right-anterior, left-anterior, right-
posterior, and left-posterior. An average of the three best trials for each direction was
used in the analyses. The results demonstrated moderate reliability for the four directions,
with estimates of 0.67-0.87. The results from the Spearman Brown prophecy indicated
that in order to achieve a reliability estimate of 0.86-0.95, a minimum of six practice
sessions would be needed, with the best three of five trials used per direction per session.
A later study was conducted to evaluate the intratester and intertester reliability of the
SEBT for two testers, repeated on two days15. Sixteen healthy young participants
performed one practice trial in each direction on each leg and three test trials
consecutively in each direction. They performed the full test for the first examiner, and
repeated the test on both legs for the second examiner. This was repeated for both
examiners one week later. Intratester reliability was estimated from the three trials in
each bout on each day using ICCs and standard errors of measurement and intertester
reliability was estimated using ICCs and SEMs from the six trials on each day. Estimates
of intratester reliability ranged from 0.78 to 0.96 for one tester and 0.82 to 0.96 for the
other tester. Estimates of intertester reliability on day one ranged from 0.35 to 0.84, and
on day two from 0.81 to 0.93. The results from this study illustrate relatively high
intratester and intertester reliability. However, the longest reaches were recorded for trials
seven to nine, leading the authors to suggest six practice trials in each direction should be
used. Subjects were allowed to use any movement strategy they wanted, which may have
led to learning effects and variability in performance.

16
In an effort to simplify the SEBT, Robinson and Gribble conducted a study to determine
how many trials were necessary for the SEBT scores to stabilize24. Twenty healthy young
adults performed six practice trials and three test trials for each direction of the SEBT on
each leg, and the direction of reach was randomized. Reach distances normalized to leg
length were used for analysis. All reach directions except AM demonstrated an increase
in normalized reach scores across trials. However, the authors concluded that most
directions stabilized within the first four practice trials, leading them to conclude that four
practice trials and three test trials may be used.
Further research was done with healthy young adults to examine the intertester and
intratester reliability of the SEBT and the relationship between leg dominance and test
performance73. Participants performed ten trials of all eight directions of the SEBT on
both legs73. No significant differences were found in reach score between the dominant
and non-dominant legs, and interrater reliability (ICC>0.99) and intrarater reliability
(ICC 0.92-0.99) were high. The reliability values were higher than previous studies, but
this was attributed to the placement of the measurement scale on the line rather than
being held by the tester, which may have led to more accurate readings. The authors
suggest that using the AN, ME, PO, and LA directions may shorten the test and have the
same validity as the eight direction test, however it is also suggested that future research
is needed to examine different muscle activation for the various directions.
The early reliability studies for the SEBT varied in number of trials and directions used,
therefore another study was done to investigate between session reliability and the
number of trials needed for measures to stabilize17. The secondary objective was to
determine error scores for the SEBT to be able to indicate when true change occurs.
Twenty-two healthy participants attended three testing sessions, each separated by a
week. Participants performed seven trials in each direction on each leg, with reach
direction order and stance leg order randomized, and results were reported normalized to
leg length. The results showed no significant differences between males and females or
between limbs. Results demonstrated that scores stabilised after 4 trials and ICC values
ranged from 0.84 to 0.92, which the authors interpreted as good reliability. The
normalized SEM values were 2.2 to 2.9%, suggesting that an individual’s true score

17
would fall in this range, and a minimal detectable change would occur if a change of
6.8% or more was demonstrated between tests. However, these results are limited to a
healthy university student population.
To further assess reliability, a study was done at two sites with a group of investigators to
assess interrater reliability18. Participants performed three test trials in each of the AN,
PM, and PL directions for each of the three raters, with a five-minute rest in between.
The average of the three test trials for each direction and a composite score were used as
raw data, and scores normalized to leg length were also reported. ICCs ranged from 0.86
to 0.92 for normalized scores, demonstrating excellent reliability, while ICCs for non-
normalized scores ranged from 0.89 to 0.94. This study demonstrates that the SEBT can
be reliable in the hands of raters of different levels of experience as long as they are
trained by an experienced rater.
2.8.2 Construct Validity
Glave and colleagues74 conducted a study to determine if the SEBT and the limits of
stability test (LOS) both measure similar constructs of dynamic postural stability. Thirty-
one healthy participants performed three trials of the SEBT in all eight directions, as well
as three trials at each level 12 (stable) and level 6 (moderately unstable) of the LOS test
on the Biodex Balance System. Normalized scores for each direction of the SEBT were
reported and non-normalized scores for the LOS were reported because the system
adjusts for height. Results showed that scores on the two tests were not positively
correlated indicating that the tests may measure different aspects of postural stability or
that postural stability may include several sub-types. The LOS is a double-leg stance test
while the SEBT is a single-leg stance test, which may influence the type of postural
stability being measured. Further research is necessary to determine what aspects of
balance each test measures and the situations in which each test might be most useful.

18
2.8.3 Concurrent and Discriminant Validity
Bastien and colleagues75 conducted a study to evaluate the concurrent validity between
the observer’s measurement and the motion capture system measurement of maximal
reach distance of the SEBT in military personnel with and without lateral ankle sprain
(LAS). Secondary objectives were to evaluate discriminant validity of the SEBT maximal
reach measurements for the two groups and to determine whether height or leg length
was more appropriate for normalization. Ten participants with LAS and ten healthy
participants performed a single testing session of three trials in each of the AM, M, and
PM directions. The observer maximal reach distance for all three directions was
compared to the motion capture maximal reach distance to assess concurrent validity.
Significant correlations were found for the motion capture measurements and the
observer measurements (R2=0.98) and there was excellent agreement for both groups and
all three reach directions (ICC=0.99). The SEBT measurements were significantly
different between the healthy and LAS groups for the composite score (6.06%) and for
each direction individually, with the A direction showing the largest differences (7.84%).
The maximal reach distance for limbs within subjects did not differ significantly. As
well, the correlation for height and maximal reach distance was slightly higher than the
correlation with leg length. The authors conclude that the observer estimation of maximal
reach distance is highly valid and accurate, and that the normalization of reach by height
can help increase discriminate validity for LAS participants from healthy participants.
2.9 Kinematics and Muscle Activation of the SEBT
Different movement patterns are seen for each direction of the SEBT and it is suggested
that increasing the reach distance in various directions would require an increase in range
of motion (ROM) and neuromuscular control at the hip, knee, and ankle76.
A number of studies have investigated muscle activity, ROM, and kinematics of the
stance leg during SEBT performance. From a study examining surface EMG on the
vastus medialis obliquus, vastus lateralis, medial hamstrings, biceps femoris, tibialis
anterior, and gastrocnemius, significant differences were reported for all muscles except

19
the gastrocnemius for the different reach directions (p<0.05)76. The AN direction
demonstrates vastus medialis and vastus lateralis activity, the AL direction demonstrates
medial hamstrings, the LA, PL, and PO directions demonstrate biceps femoris and
anterior tibialis, and the PM and ME demonstrate tibialis anterior activation76. The
authors suggest that these reach differences may be important for clinicians choosing
exercises for rehabilitation of specific injuries.
From examining kinematics of the stance leg, results suggest that further reaches are
accomplished through greater stance leg hip or knee flexion, or both77. Hip and knee
flexion in combination accounted for 78% and 88% of the variance in the AN and LA
reach directions77. In patients with CAI, results demonstrated that frontal plane
displacement of the trunk, hip, and ankle explained 81% of the variance in the maximal
AN reach and weightbearing dorsiflexion ROM was significantly correlated with
maximal AN reach78. Investigating kinematic data for different reach directions has led
authors to conclude that future research is needed to determine which directions are most
useful for specific lower extremity injuries. Individuals with lower extremity injuries may
use different movement patterns on specific SEBT directions compared to healthy
individuals76,78.
2.10 Simplifying the SEBT to 3 Directions
Hertel and colleagues23 conducted an exploratory study to perform factor analyses on the
SEBT to attempt to reduce the number of reach directions and to determine which
directions are most affected by CAI. Their results indicated that the PM direction was
most representative of the overall performance in both healthy and CAI participants and
that the AM, ME, and PM directions demonstrated significant reach deficits for those
with CAI compared to the control group. Further research with healthy participants was
conducted to investigate how many trials were necessary for the SEBT to stabilize with a
secondary purpose of examining sagittal plane movement at the knee and frontal, sagittal,
and transverse movement at the hip of the stance leg to determine when movement
stabilizes across trials24. The authors agree with previous research by Hertel et al.23 which

20
suggested that AM, ME, and PM directions could be used to streamline the testing
procedure. A commercially available Y Balance Test (YBT) has been compared to the
SEBT to determine if differences in reach distance exist between the AN, PM, and PL
directions of SEBT79. Participants reached further in the A direction on both legs on the
SEBT than the YBT (p<0.005), while no differences were observed in the PM and PL
directions79. This may be a result of different visual feedback available, but indicates that
reach distance values may not be transferrable from the SEBT to the YBT. The reach
distances and associated kinematic patterns of the SEBT and YBT were also explored,
with participants reaching further on the AN direction of the SEBT (67.05±4.97) than the
YBT (59.74±4.85) but no significant differences seen in the PM and PL directions80. In
the anterior direction, hip joint angular displacement was significantly higher on the YBT
than the SEBT, while no significant differences in knee and ankle sagittal plane
displacements were observed between the YBT and SEBT80. The differences in reach and
hip kinematics on the AN direction of the YBT and SEBT indicate that these tests should
not be used interchangeably.
2.11 Ability to Detect Deficits and Improvements
The SEBT requires ankle, knee and hip mobility and adequate strength to perform
maximal reaches in eight directions. As a dynamic balance task, it has been used to
demonstrate deficits in injured populations compared to healthy controls. It has also been
used to assess function before and after rehabilitation and neuromuscular training
programs.
2.11.1 Ankle Injuries
Several studies have examined the performance of the SEBT with individuals with
chronic ankle instability (CAI)19,20,81,82. Olmsted et al. reported a decreased reach for the
injured side of the CAI group compared to their non-injured side (78.6cm vs. 81.2cm)
and compared to the matched side of the control group (78.6cm vs. 82.8cm)19. De la

21
Motte et al. found no significant differences between groups for any of the reach
directions (AM, ME, PM), and no significant kinematic differences were seen between
groups for the PM direction81. In the AM direction, CAI participants exhibited greater hip
flexion (mean difference=-12.95) and trunk rotation (mean difference=26.59) away from
the reaching leg than the healthy participants. Pionnier et al. examined the normalized
reach as well as the COP, ground reaction forces, and the error of toe touchdown20. They
found that participants with CAI had a shorter normalized reach (79.9±9.9% of leg
length) than control participants (84.7±7.6% of leg length), as well as an increased error
in toe touchdown location compared to control participants. Movement differences
observed in those with CAI compared to healthy participants suggests that the SEBT is
sensitive to CAI reach deficits and may be useful in rehabilitation programs to assess CAI
function and deficits.
Hale et al. examined the effects of a four-week comprehensive rehabilitation program on
functional limitations and postural control for those with CAI82. At baseline there were no
significant differences in SEBT reach scores between participants with and without CAI,
and there were no significant differences between CAI control and intervention groups.
The authors reported that the CAI intervention group had greater improvements than the
CAI control group and the healthy group on the PM, PL, and LA directions of the SEBT.
Doherty et al. conducted a case-control study examining kinematics of the lower
extremity and centre of pressure (COP) during the AN, PM, and PL directions of the
SEBT in 81 participants with LAS compared to 19 healthy controls21. The LAS group
had lower normalized reach distances for both legs compared to the healthy group. The
LAS group also had a lower measure of COP shape than the healthy group for all reach
directions, which may suggest that the LAS group has an impaired ability to use the base
of support. Reduced flexion at the hip, knee, and ankle was also seen for the LAS group.
The authors conclude that the SEBT may be a useful clinical tool for patients with CAI
and LAS as it can detect improvements following rehabilitation and deficits in injured
compared to healthy populations. However, further research is necessary to investigate
sensitivity to change of specific directions and replicate studies with larger sample sizes.

22
2.11.2 Knee Injuries
Knee injuries, in particular anterior cruciate ligament (ACL) injuries are common in
sports. ACL injuries are associated with decreased proprioceptive performance, and
therefore postural stability and neuromuscular control is an important focus for injury
rehabilitation83. The SEBT is a sufficient challenging functional test to assess dynamic
balance in ACL deficient patients (ACLD)83.
Previous research has been done to investigate if SEBT performance deficits can be
detected in ACLD patients and patients who had undergone ACL reconstruction.
Significant differences were seen in movement between the ACLD limb and the control
group for the AN, PM, and M directions (p≤0.005) with no significant differences
between the ACL deficient limb and the uninjured limb of the ACL group for all
directions83. In individuals who have had ACL reconstruction, the reach scores for the
PM and PL directions were lower for the ACLR group than healthy controls and the
ACLR group demonstrated decreased knee flexion on all three directions22. ACLD
affects dynamic postural control but more research is needed in this area to investigate
the relationship between postural control and predisposition to ACL injury.
2.11.3 Limb Asymmetry
Overmoyer and Reiser conducted a study to examine the relationship between lower-
extremity functional asymmetries on various lower-extremity function tasks including the
SEBT84. Twenty healthy, recreationally active participants performed three trials of the
SEBT in the AN, PM and PL directions, and the normalized mean and composite score
were used. Participants also performed bodyweight squats, quiet standing,
countermovement jumps, and single-leg drop landings and the primary outcome was
correlation of asymmetries between tasks. The SEBT limb asymmetry was calculated by
subtracting the dominant leg normalized score from the non-dominant leg normalized
score. No significant differences were observed between non-dominant and dominant leg
in the SEBT mean performance. Mild to moderate correlations were seen between SEBT

23
asymmetry and the lower-extremity functional asymmetries of the other tasks as well as
between reach distances among bilateral differences.
2.12 Neuromuscular Training Programs
Neuromuscular training programs have been used in rehabilitation and injury prevention
contexts to target muscular strength, instability, sensorimotor deficiencies and postural
and neuromuscular control8,85. Although many demonstrate patient improvements, very
few use the SEBT as a measure of dynamic balance.
Ageberg, Nilsdotter, Kosek and Roos conducted a study to examine baseline measures of
a severe knee and hip OA population compared to a reference group and to examine the
effects of a neuromuscular training program on patient-reported and functional
outcomes9. The 38 patients with hip OA, 49 patients with knee OA, and 43 reference
participants completed the KOOS, chair stands, knee bends per 30 seconds, knee extensor
strength, and a 20m walk test at baseline. The OA patients underwent the neuromuscular
training program (mean=12 weeks) and repeated the tests prior to total joint arthroplasty.
Patients were worse on all measures at baseline compared to the reference group.
Improvements were seen on all outcomes except number of knee bends in 30 seconds.
Therefore, neuromuscular training has positive potential for patient important
improvements in function in patients with severe hip and knee OA. However, this before-
and-after study did not randomly allocate exercise and control groups and did not directly
assess neuromuscular control or dynamic balance. Future research should be done with a
larger group of patients with knee OA using measures of dynamic balance.
Filipa, Byrnes, Paterno, Myer, and Hewett conducted a repeated measures study to
investigate SEBT performance changes in young female athletes following an eight-week
neuromuscular training program85. Nine participants in the intervention group and seven
in the control group participated in pre-testing, eight weeks of either bi-weekly
neuromuscular training program or regular activity, and a final post-test session. Six
practice trials and one test trial were performed in the AN, PM, and PL directions on each

24
leg using a normalized score for each direction and a composite score as outcomes. Pre-
test SEBT scores were not significantly different between groups. There was no
significant change in SEBT scores in the control group after eight weeks, while the
training group showed significantly improved composite scores on both limbs (p≤0.04).
The mean composite score of the right limb improved from 96.4 ± 11.7% to 104.6 ±
6.1% of leg length and the left limb improved from 96.9 ± 10.1% to 103.4 ± 8.0%.
However, no differences were observed in the anterior reach directions for the training
group, indicating that different directions may be influenced by different factors. This
study demonstrates the longitudinal validity of the SEBT in detecting performance
improvements, but cannot be generalized beyond young healthy athletes.
Al-Khlaifat et al. conducted a pilot study to determine the effect of a six-week lower
extremity exercise program and patient education on dynamic balance in patients with
knee OA25. Prior to this study, the investigators examined the test-retest reliability of the
SEBT in 10 healthy volunteers (mean age 46 ± 5.23 years). They reported high reliability
(ICC>0.75) and SEM values ranging from 2.34 ± 4.60 %LL to 3.49 ± 6.85 %LL25. The
normalized MDC values ranged from 6.5 to 9.69 %LL for the anterior and medial
directions. Nineteen participants were enrolled in the study and fourteen completed the
study (12 women, 2 men). The main outcomes were balance, pain, and muscle strength,
with balance reported from the normalized mean for each of the A and M directions of
the SEBT. Pain was measured using the KOOS pain and function in daily living activities
subscales, and muscle strength was determined through the average peak torque of the
hip abductors, knee flexors and knee extensors. The results showed good adherence to the
exercise program (mean attendance was 5.36±0.84 out of 6 sessions). Participants
improved significantly in both the AN (mean difference, -5.06±7.27% of leg length) and
ME (mean difference, -6.59±7.77% of leg length) directions on the affected leg, but only
in the AN direction (mean difference -5.58±5.35% of leg length) on the unaffected leg.
Concentric strength at the knee and isometric strength of the hip also improved
significantly (p≤0.001). Pain and function in daily living significantly improved
(p<0.001) at six weeks compared to baseline. Exercise programs that focus on lower
extremity strength and balance may help improve dynamic balance, and the star
excursion balance test may be a useful measure of dynamic balance in this population.

25
2.13 Summary
The SEBT is a performance-based outcome measure that may be particularly useful for
the assessment of patients with knee OA undergoing neuromuscular exercise therapy.
The SEBT has demonstrated good-to-excellent reliability in healthy participants (for four
practice trials and three test trials). It has been shown to detect reach deficits in patients
with lateral ankle sprain, chronic ankle instability, and ACL deficiency. Substantial
evidence suggests the SEBT improves after neuromuscular exercise programs in young
athletes. There is very limited research, however, investigating the SEBT in people with
knee OA.

26
Chapter 3
3 Methods
3.1 Study Design
This study was conducted in the Wolf Orthopaedic Biomechanics Laboratory and the
Fowler Kennedy Sport Medicine Clinic at the University of Western Ontario. The study
design is illustrated in Figure 1. Two test sessions were completed within one week to
assess test-retest reliability. A motion capture system was also used during the initial test
session to assess concurrent validity. A third test session was completed after 12 weeks of
neuromuscular exercise to assess longitudinal validity. Participants provided written
informed consent. The Letter of Information and Ethics Approval Notice are provided in
Appendices A and B respectively.
Figure 1. Study design: testing procedures for assessing reliability and validity of
the star excursion balance test in patients with knee osteoarthritis.

27
3.2 Participants
3.2.1 Eligibility Criteria
We recruited patients with knee OA from the Fowler Kennedy Sport Medicine Clinic and
through poster advertisements. Males and females with clinical knee OA according to the
Altman classification were eligible for the study. The Altman classification requires knee
pain with at least three of six clinical findings including age greater than 50 years,
morning stiffness less than 30 minutes, crepitus, bony tenderness on the joint, bony
enlargement, and lack of palpable warmth32. Participants were recruited after physician
diagnosis of knee OA. Exclusion criteria included previous joint replacement,
inflammatory or infectious arthritis of the knee, major neurological disorder, major
medical illness, inability to read English, psychiatric illness that limits informed consent,
and inability to stand on one limb for five seconds.
3.3 Outcome Measures
The star excursion balance test (SEBT) was performed at all testing sessions using all
eight directions of the star15. Pain was assessed immediately before and after each SEBT.
The Knee Injury and Osteoarthritis Outcome Score (KOOS) and the 40m fast paced walk
test were assessed at the first and last testing sessions. The participant’s age, height,
weight and leg length (anterior superior iliac spine to the ipsilateral medial malleolus)
were measured at the first test session.
3.3.1 SEBT Test Protocol
The SEBT was performed on eight lines taped to the floor, each at 45˚ to each other with
centimeters marked to determine reach distance. All participants performed the test
barefoot. The participant was positioned with their stance leg at the centre of the star,
with the first medial cuneiform and arch of the foot over the centre mark. The participant
reached with the opposite leg as far as possible in the specified direction while

28
maintaining balance on the stance leg. They made a light touch with their toe at the
maximal reach, and returned to the original double leg stance position. The participant
was required to have their hands on their hips for the entire trial, and the stance foot could
not move. A tester monitored the participant’s position and observed and recorded the
maximal reach distance for each trial. Trials were discarded and repeated if the observer
determined that 1) an appropriate position of the stance limb was not maintained with the
knee moving out of line with the toe, 2) the stance foot was lifted or moved from the
centre of the grid, 3) the participant did not touch down, or touched down more than
once, during the trial, 4) considerable support was put in the reaching leg when touching
the ground, or 5) the participant lost balance at any point or failed to return to the starting
position.
All participants received verbal and visual instructions before completing the SEBT. One
practice trial was performed standing on the unaffected leg in each of the eight directions,
and one practice trial was repeated in each direction standing on the affected leg. The
order of test direction was performed as follows, relative to stance leg: anterior,
anteromedial, medial, posteromedial, posterior, posterolateral, lateral, and anterolateral
(Figure 2). Two trials were recorded consecutively for each test direction and the average
was calculated and used in subsequent analyses. All participants performed the SEBT on
their unaffected (less symptomatic) leg first and then on their affected leg. Knee pain
scores ranging from zero (no pain) to ten (maximal pain) were recorded before and after
the SEBT.

29
3.3.2 Motion Capture System
A 12-camera motion capture system and motion capture software (Cortex, Motion
Analysis Corporation, Santa Rosa, CA) were used to provide a gold standard assessment
of the participants’ maximal reach distances during the SEBT. The system was calibrated
each morning with a seed and wand calibration. The seed calibration was done with a
calibration L-frame set on the force plate to indicate the exact positions of the L frame
and the origin of the marker system. The wand calibration was done by waving a wand
with three markers at known lengths in the data collection area. This ensures that the
measurements made by the cameras match the direct measurement of the wand of known
length in the capture area86.
3.3.3 Subject Preparation
Twenty-six markers were placed on anatomical landmarks using adhesive stickers
according to a modified Helen Hayes marker set87. Participants performed two standing
Figure 2. The star excursion balance test set-up for the left and right stance legs.

30
“static trials” standing still on a force plate to collect the participant’s mass and assist
with building the individualized marker set. Four markers from the medial knee joint line
and medial malleolus were removed following the static trial. These markers are used to
help define the joint centres of the knee and ankle. The SEBT was then performed, with
the first of the two trials in each direction being recorded by the motion capture system.
Marker data were captured at a rate of 60 frames per second.
3.3.4 Knee Injury and Osteoarthritis Outcome Score (KOOS)
The Knee Injury and Osteoarthritis Outcome Score (KOOS) is a patient-reported
questionnaire comprised of five subscales: pain, symptoms, function in daily living
(ADL), function in sport and recreation (Sport/Rec), and knee related quality of life
(QOL). Each subscale has a number of questions that are rated with a 5-option Likert
scale from zero to four, which is then transformed to a score from 0 to 100. A score of
zero indicates extreme knee problems while a score of 100 indicates no knee problems49.
The KOOS has been used in male and female populations to assess various knee injuries
and degrees of OA and a change of 10 points or more has been suggested to represent a
clinical difference88. Participants filled out the KOOS at their first and last test sessions.
3.3.5 40m Fast Paced Walk Test
The 40m Fast Paced Walk Test requires patients to walk four sets of 10m distances. It is
the recommended short distance walking test by Osteoarthritis Research Society
International (OARSI) because it is feasible, demonstrates appropriate measurement
properties and a range of abilities across degrees of OA12. Participants began at one cone
with the other cone placed 10m away. They were instructed to walk quickly without
running to the far cone and back twice, ending at the cone at which they began for a total
of 40m.

31
3.4 Exercise Program
Following testing on the first session, all participants were instructed on balance and
strengthening exercises similar to those included in neuromuscular exercise programs for
individuals with knee OA10. Patients were instructed to complete the exercises at home
three times a week for twelve weeks. Good alignment of the stance knee over the stance
foot was emphasized. The exercise program began with range of motion and stretching
exercises for the knee. Knee and hip strengthening exercises such as step ups, forward
lunges, chair stands, and clam shells were included followed by single and two-leg stance
balance exercises. If participants experienced unusual pain or discomfort, we suggested
that they stop the exercises and try again the following day.
3.5 Data Reduction
Test-retest reliability and longitudinal validity were estimated using the mean SEBT
reach distance, normalized to leg length, for each direction and for a composite score for
all eight directions. Concurrent validity was estimated using the raw data (distances) from
the first trial of each direction compared to the motion capture measurement.
Motion capture data were processed (Cortex, Motion Analysis Corporation, Santa Rosa,
CA) to determine maximal reach distance. Marker data were filtered using a Butterworth
filter with a cut-off frequency of 6Hz. Custom post-processing methods used Skeleton
Builder models (Cortex, Motion Analysis Corporation, Santa Rosa, CA) to determine
joint centres and anatomical segments. One fixed virtual marker was created on the centre
of the force plate and both toe virtual markers were created using the participant’s foot
length, the original marker set and the known anatomical offsets. Analysis graphs were
used to calculate the distance between the centre of the force plate and the virtual toe
marker at touchdown to determine the overall distance reached.

32
3.6 Statistical Analysis
The mean of the two maximum reach trials for each direction was calculated for each test
session. A normalized value was then calculated by dividing the mean score by lower
limb length and multiplying by 100%. A composite reach score was calculated by adding
the normalized mean reach for each direction and dividing by 8. The 12-week change
scores for SEBT scores, the five domains of the KOOS and the 40m fast paced walk test
were calculated from test sessions 1 to 3. All statistical analyses were performed using
the Statistical Package for the Social Sciences (SPSS) version 24 (IBM Corp, Armonk,
NY).
Figure 3. The motion capture computer software used to calculate the maximum reach for
concurrent validity of each reach measurement.

33
3.6.1 Test-retest Reliability
We calculated intraclass correlation coefficients (ICC) using a two-way random model
for absolute agreement (ICC 2,1)70. We calculated the standard errors of measurement
(SEMs) to find the error associated with an individual’s score. This was estimated by
using the mean square error term from an ANOVA such that SEM = √MSE56. We then
used the z value for 95% confidence (1.96) to calculate the error associated with an
individual’s SEBT change score (i.e. the minimal detectable change (MDC) at 95%
confidence, where MDC = SEM x 1.96 x √2 )89. We also plotted the difference between
the first and second SEBT measurements against the mean of the first and second
measurements to provide Bland and Altman plots as a visual representation of reliability.
3.6.2 Concurrent Validity
To investigate concurrent validity, we estimated the association between the observer’s
measurement of maximum reach and the motion capture maximum reach measurement
using Pearson r correlations. This was calculated for each of the eight directions of the
star using the raw data for one reach trial and the corresponding measured distance from
the motion capture software.
3.6.3 Longitudinal Validity
To estimate longitudinal validity, we calculated paired t-tests and standardized response
means (SRMs). Paired t-tests were calculated using the normalized mean reach for each
direction at the first and last visits, and the normalized composite score at the first visit
and last visits (significance level set at p<0.05). We calculated SRMs as the mean change
divided by the standard deviation of change. This was calculated from the normalized
mean reach for each direction and the normalized composite score at the first and last
visits. We calculated Pearson Correlation Coefficients (r) to determine the correlation
between the change in composite normalized SEBT and the change in the 40m fast paced
walk test, as well as the change in the five KOOS domains. Correlation coefficients of

34
>0.5 were classified as good, 0.36-0.5 as moderate, 0.2-0.35 as low and r<0.2 as no
evidence90.
3.6.4 Sample Size Justification
The sample size was calculated for test-retest reliability based on an ICC of at least 0.85,
an alpha of 0.05, beta of 0.2, and a confidence interval width of +/- 0.1. It was determined
that 35 participants were necessary91. Our aim was to recruit 38 participants to account
for approximately 10% dropout. Thirty-five participants would also provide 80% power
(two-sided alpha=0.05) to detect an effect size of approximately 0.5 following 12 weeks
of exercise92. With only 21 participants included in the longitudinal analyses thus far, we
can detect an effect size as low as 0.6692.

35
Chapter 4
4 Results
Participant demographic variables are displayed in Table 1. At this time, 38 participants
have completed the first two visits for test-retest reliability and 21 of those participants
have completed the third test session for the longitudinal validity outcomes.
Table 1. Participant demographics for the two objectives of test-retest reliability and
longitudinal validity
Objective
Test-Retest Reliability Longitudinal Validity
(subset of patients)
Number of participants n = 38 n = 21
Sex, male / female 30 / 8 19 / 2
Age, years 58.1 ± 8.3 56.6 ± 1.7
Height, m 1.77 ± 0.08 1.78 ± 0.05
Weight, kg 91.0 ± 17.4 91.0 ± 12.0
BMI, kg/m2 29.0 ± 4.8 28.9 ± 3.5
Leg length, cm 90.3 ± 4.3 90.3 ± 4.1
Days Between Test 1 and 2 6.2 ± 2.5 5.8 ± 6.0
Days Between Test 1 and 3 - 83.7 ± 6.2
Values are mean ± SD

36
4.1 Test-Retest Reliability
The ICC, SEM, and minimal detectable change values for each direction on both stance
legs are reported in Table 2. The test-retest reliability for the normalized reach
measurements for all eight directions on the affected leg was good (ICC 0.70-0.89). On
the unaffected leg, the test-retest reliability for the normalized reach measurements of all
eight directions was good-to-excellent (ICC 0.82-0.94). Figure 4 shows the Bland and
Altman plot for the composite normalized SEBT.
Figure 4. Bland and Altman plot showing the difference between test and retest
compared to the mean of test and retest for the composite normalized reach on the
affected leg. Horizontal lines indicate the mean ±1.96SD.

37
Table 2. ICC point estimates and 95% confidence intervals with the corresponding
standard error of measurement and minimum detectable change (95% level of
confidence) for all reach directions and legs. 𝑺𝑬𝑴 = √𝑴𝑺𝑬, MDC = SEM x 1.96 x √𝟐
Affected Leg ICC (95% CI) ± SEM MDC 95%
AN 0.89 (0.79, 0.94) 3.15 8.72
AM 0.85 (0.73, 0.92) 3.46 9.60
ME 0.77 (0.60, 0.87) 4.48 12.42
PM 0.70 (0.49, 0.83) 6.30 17.47
PO 0.82 (0.68, 0.90) 5.63 15.61
PL 0.79 (0.63, 0.88) 5.99 16.59
LA 0.87 (0.77, 0.93) 4.61 12.77
AL 0.82 (0.68, 0.90) 3.38 9.37
COMPOSITE 0.88 (0.79, 0.94) 3.21 8.90
Unaffected Leg
AN 0.86 (0.73, 0.92) 3.71 10.29
AM 0.90 (0.82, 0.95) 3.07 8.51
ME 0.86 (0.75, 0.93) 4.01 11.11
PM 0.82 (0.68, 0.90) 5.28 14.62
PO 0.88 (0.77, 0.93) 5.11 14.18
PL 0.84 (0.71, 0.91) 5.23 14.49
LA 0.94 (0.89, 0.97) 3.37 9.35
AL 0.89 (0.80, 0.94) 2.90 8.03
COMPOSITE 0.92 (0.86, 0.96) 2.82 7.82
SEM and MDC values are % of leg length

38
4.2 Concurrent Validity
The correlation coefficients between the motion capture measurements and the observer
measurements of the reach for both stance legs are shown in Table 3. The motion capture
and observer measurements had excellent correlations on both stance legs (r≥0.96).
Table 3. Pearson correlation coefficients between the raw observed and the motion
capture measures of reach for each leg and direction of the SEBT.
Reach
Direction
Affected Leg Unaffected Leg
Pearson Correlation
Coefficient
Pearson Correlation
Coefficient
AN 0.99 0.99
AM 0.99 0.99
ME 0.98 0.98
PM 0.96 0.97
PO 0.99 0.99
PL 0.97 0.98
LA 0.96 0.97
AL 0.96 0.99

39
4.3 Longitudinal Validity
A composite normalized reach value and the mean normalized reach values for each
direction on the affected leg are displayed in Table 4 and on the unaffected leg in Table 5.
At test session 3, the composite normalized reach on the affected leg (77.42 ± 8.62 %LL)
had significantly improved (p=0.002) with a mean change of 5.34% of LL (95% CI 2.20,
8.47) and a standardized response mean of 0.78. The composite normalized reach on the
unaffected leg (79.27 ± 9.65 %LL) had also significantly improved (p<0.001) with a
mean change of 5.15% of LL (95% CI 2.81, 7.50) and a standardized response mean of
1.00. Significant improvements (p≤0.03) were seen for the anterior, anteromedial, medial,
posteromedial, posterior, posterolateral, and lateral directions on the affected leg (Figure
5). On the unaffected leg, significant improvements (p≤0.05) were seen for the anterior,
medial, posteromedial, posterior, posterolateral, and lateral directions (Figure 6).
The correlations between the composite normalized change score for each leg and the
change in KOOS subscales and 40m walk times are displayed in Table 6 and the
correlations for the affected leg by direction are displayed in Table 7. Low-to-moderate
correlations (r=0.24-0.48) were seen for the change in the composite normalized score on
the affected leg and the change in all KOOS subscales and 40m walk time. Low-to-
moderate correlations were seen for the change in each direction on the affected leg and
the change in 40m walk time.

40
Table 4. Normalized (% of leg length) reach distances, mean change, and standardized
response means for the affected stance leg at test 1 and test 3.
Affected
Leg
Test 1 Reach
Test 3 Reach
Mean Change
(95% CI)
p-value SRM
AN 70.22 ± 9.47 74.49 ± 9.17 4.26 (0.43, 8.10) 0.03 0.51
AM 74.03 ± 9.39 77.77 ± 10.32 3.75 (0.00, 7.50) 0.05 0.46
ME 74.33 ± 9.23 81.13 ± 10.53 6.80 (3.29, 10.31) 0.001 0.88
PM 79.73 ± 10.46 88.01 ± 10.51 8.27 (4.83, 11.71) <0.001 1.10
PO 82.49 ± 10.23 88.88 ± 10.83 6.38 (2.57, 10.20) <0.005 0.76
PL 73.72 ± 10.15 80.46 ± 12.03 6.75 (2.25, 11.25) 0.005 0.68
LA 55.69 ± 12.15 61.01 ± 11.69 5.32 (1.24, 9.39) 0.01 0.59
AL 66.47 ± 6.88 67.60 ± 9.18 1.13 (-2.18, 4.45) 0.48 0.16
COMP 72.08 ± 8.25 77.42 ± 8.62 5.34 (2.20, 8.47) <0.005 0.78
Reach values are expressed as mean ± SD, % of leg length

41
Table 5. Normalized reach distances, mean change, and standardized response means for
the unaffected stance leg at test 1 and test 3
Unaffected
Leg
Test 1 Reach
Test 3 Reach
Mean Change
(95% CI)
p-value SRM
AN 72.54 ± 11.09 76.11 ± 9.36 3.58 (1.30, 5.85) 0.004 0.72
AM 77.06 ± 10.79 79.57 ± 9.61 2.51 (-0.25, 5.26) 0.07 0.41
ME 78.42 ± 12.96 82.90 ± 11.04 4.48 (1.74, 7.22) 0.003 0.74
PM 82.84 ± 13.48 89.65 ± 12.64 6.81 (3.14, 10.47) 0.001 0.85
PO 82.30 ± 14.37 91.36 ± 12.66 9.06 (4.94, 13.18) <0.001 1.00
PL 74.56 ± 12.44 82.63 ± 14.51 8.06 (3.25, 12.88) 0.002 0.76
LA 57.50 ± 13.55 63.25 ± 12.41 5.75 (2.07, 9.44) 0.004 0.71
AL 67.72 ± 8.86 68.66 ± 8.41 0.95 (-1.48, 3.38) 0.43 0.18
COMP 74.12 ± 10.45 79.27 ± 9.65 5.15 (2.81, 7.50) <0.001 1.00
Reach values are expressed as mean ± SD, % of leg length
Table 6. Correlation coefficients between mean change SEBT scores and change in
functional and questionnaire outcomes to examine longitudinal validity.
40m
Walk
KOOS
Pain
KOOS
Symptoms
KOOS
ADL
KOOS
Sport Rec
KOOS
QOL
Mean Change
Affected Leg
0.48 0.24 0.30 0.26 0.24 0.26
Mean Change
Unaffected Leg
0.41 0.09 0.04 -0.06 -0.03 -0.01

42
Table 7. Correlation coefficients for the change from test 1 to test 3 in reach on the
affected leg and change in the KOOS subscales and 40m walk test.
Reach
Direction
40m
Walk
KOOS
Pain
KOOS
Symptoms
KOOS
ADL
KOOS
Sport Rec
KOOS
QOL
AN 0.56 0.33 0.34 0.31 0.42 0.19
AM 0.66 0.34 0.29 0.25 0.34 0.19
ME 0.58 0.29 0.32 0.29 0.24 0.27
PM 0.39 0.12 0.11 0.11 0.04 0.07
PO 0.24 0.25 0.30 0.22 0.08 0.19
PL 0.21 0.03 0.10 0.09 0.07 0.19
LA 0.33 0.19 0.22 0.20 0.17 0.26
AL 0.29 0.09 0.36 0.31 0.23 0.36

43
35.00
45.00
55.00
65.00
75.00
85.00
95.00
105.00
AN AM ME PM PO PL LA AL
Mea
n R
each
Val
ue
(% o
f L
L)
Reach Direction
Test 1
Test 3
35.00
45.00
55.00
65.00
75.00
85.00
95.00
105.00
AN AM ME PM PO PL LA ALMea
n R
each
Val
ue
(% o
f L
L)
Reach Direction
Test 1
Test 3
Figure 5. Mean normalized (% of leg length) reach values with standard deviations
on the affected leg for all eight reach directions at the first and last test sessions.
Figure 6. Mean normalized (% of leg length) reach values with standard deviations on
the unaffected leg for all eight reach directions at the first and last test sessions.

44
Chapter 5
5 Discussion
5.1 Test-Retest Reliability
The current results indicate that the SEBT has moderate-to-excellent test-retest reliability
in patients with knee OA. The ICCs for all eight directions on both legs range from 0.70
to 0.94. The composite score ICCs were 0.88 (95% CI 0.79, 0.94) and 0.92 (95% CI 0.86,
0.96) for the affected and unaffected legs, respectively. Our results are generally
consistent with our hypothesis. The ICC is an indication of relative reliability, calculated
as a ratio of the variability between patients to the total variability55,56. This represents the
ability of a test to distinguish between patients, with a value closer to one suggesting that
the between patient variability is high while the within patient variability (or
measurement error) is low.
Our results are similar to previous studies investigating the reliability of the SEBT in
different populations. The ICCs of all eight directions in healthy recreational athletes
were reported as ranging from 0.84 to 0.9217. In healthy older adults (mean age 46 ± 5.23
years), ICCs were 0.78 and 0.81 for the anterior direction and 0.86 and 0.88 for the
medial direction, for the right and left side respectively25. A previous study recommended
using only three directions of the SEBT (AM, ME, PM) to streamline the test because all
directions were reliable and those three were most sensitive to chronic ankle instability
deficits23. We have demonstrated adequate reliability for all directions but the
posteromedial, posterior, and posterolateral directions show the lowest reliability of the
eight directions. However, these directions show the highest mean change following
exercise. Therefore at this time, we do not suggest that any directions be removed on the
basis of poor reliability because they may show important changes in patients with OA.
The composite measures were highly reliable and showed significant change following
exercise. This supports the inclusion of all eight directions so that a composite measure
may be used as it may be most relevant in knee OA focused clinical practice and
research.

45
The SEM, a measure of absolute reliability, is expressed in the same units as the original
measurement and can be used to provide an estimate of reliability for individual
scores55,56,89. Values closer to zero indicate better reliability. Our results demonstrate that
the SEM values range from 2.82 to 6.30 % of leg length. These are slightly higher than
the SEM values ranging from 2.21 to 2.94 %LL reported for healthy recreational
athletes17. However, these athletes were tested on three separate occasions with three
trials from each used for analyses, while we selected to mimic clinical practice as much
as possible and only used two trials from two test sessions for reliability analyses.
Additionally, the present SEM values are similar to those found in previous research with
healthy older adults, which reported SEMs ranging from 2.34 to 3.49 %LL for the
anterior and medial directions of the SEBT. The higher SEM values reported presently
may be a result of the inclusion of all eight directions of the SEBT. Higher SEM values
were seen for the posteromedial, posterior, and posterolateral directions, which were not
investigated in the previously mentioned study.
From the SEM, we first considered the error associated with an individual’s score at one
point in time. For example, from the anterior reach direction of the affected stance leg,
the SEM is 3.15%LL. This indicates that an individual’s score on one test session of 70.2
%LL can vary from 64.0 to 76.4 %LL simply due to measurement error (i.e. SEM * 1.96
= ± 6.2). From the SEM, we also calculated the MDC, which is the amount of change
needed to be considered real change, above the variability seen between test sessions89.
From the calculated MDC of 8.72% (i.e. SEM * 1.96 *√2 = 8.72%LL), an individual’s
score would have to change by at least 8.7 %LL between test sessions to be confident a
true change had occurred. In other words, for the individual who scored 70.2 %LL on the
first test, we can be very confident that a true improvement has occurred if that
individual’s second score is 78.9 %LL or higher, as 95% of stable patients would change
by less than 8.72%LL. When expressed in centimeters, the average patient in our study
has a leg length of approximately 90 cm, and the MDC is approximately 8 cm.
From the previous study on healthy older adults, the reported MDCs were 6.94 and 6.5
%LL for the anterior direction, and 9.69 and 8.85 %LL for the medial direction, on the
right and left sides respectively25. Our MDCs were 8.72 %LL for the anterior direction

46
and 12.42 %LL for the medial direction on the affected leg. This agrees with previous
authors’ suggestion that MDC values would be higher in patients with knee OA25. The
study with healthy recreational athletes reported MDC values ranging from 6.13 to 8.15
%LL for all eight directions, compared to our reported MDC ranges from 7.82 to 16.59
%LL for all directions. The MDC calculations include the SEM, and therefore in
comparison to the healthy athlete population, our MDC values will also be higher
because our SEM values are higher. As mentioned earlier, this may be a result of only
using two test trials on two test occasions instead of three trials and three sessions.
The SEBT demonstrates moderate to excellent reliability on all eight directions and on
the composite measure in individuals with knee OA. Combined with the SEM results, we
will be able to assess an individual’s performance on the SEBT and be confident in the
range that their true score falls within. The MDC can also be used to help determine
whether a true change has occurred.
5.2 Concurrent Validity
The current results suggest that the observer measurement of reach for all directions is
highly correlated to the motion capture measurement on both stance legs. Our results
agree with our hypothesis that the observer and motion capture measurement would be
highly correlated (r>0.75). This suggests that the observer measurement of reach is valid
when compared to the gold standard motion capture measurement of reach. Our results
agree with a previous study examining the concurrent validity of motion capture and
observer measurement. This previous study only used the anteromedial, medial, and
posteromedial directions but found large and significant correlations for all directions75. It
is important for the observer measurement to agree with the motion capture system to
validate the use of the SEBT in a clinical setting. By using measured tape on the ground
for all eight directions, the SEBT can be used with confidence in a clinical setting without
the need for costly motion capture equipment and the time needed for motion analysis.

47
5.3 Longitudinal Validity
The current results indicate significant performance improvements of the normalized
SEBT on the anterior, medial, posteromedial, posterior, posterolateral and lateral
directions on both legs plus the anteromedial direction on the affected leg. Significant
improvements were also seen for the composite normalized scores on both legs. This
confirms our hypotheses for almost all directions, as we had anticipated a significant
improvement in all directions on both legs. No differences were seen for the anterolateral
direction on the affected leg and the anteromedial and anterolateral directions on the
unaffected leg. This may indicate that these directions are more difficult to improve upon
and that a greater improvement of neuromuscular control is needed in order to see a small
change in reach. It is also possible that the exercises did not specifically target
neuromuscular control needed for that movement.
We had also hypothesized standardized response means greater than 0.4 (a small to
moderate effect) for the SEBT measurements. We found SRMs greater than 0.4 for the
anterior, anteromedial, medial, posteromedial, posterior, posterolateral, and lateral
directions on both legs. The composite normalized reach demonstrated SRMs of 0.78 and
1.00 on the affected and unaffected legs respectively, indicating a medium to large effect.
The directions that demonstrated a statistically significant change agree with the
hypotheses of SRM greater than 0.4.
When individual patients’ improvements are compared to the calculated MDC, the
importance of measurement error becomes evident. For example, on the affected leg,
depending on the direction, three to seven individuals demonstrated detectable
improvements. Only two participants demonstrated a detectable improvement in all eight
directions, and one participant demonstrated a detectable deterioration on three
directions. On the composite scores, four individuals demonstrated a detectable
improvement on the affected leg and seven on the unaffected leg. These results are
similar to a previous study in which the significant performance improvements on the
anterior and medial directions of the SEBT did not exceed the previously calculated
MDC values25. Therefore although we found significant improvements for the group on

48
several directions and for the composite scores, care is needed to accurately judge
changes in an individual patient’s change.
We also hypothesized that there would be low-to-moderate correlations between the
change in SEBT affected normalized scores and the change in KOOS domains and 40m
walk performance. We made these hypotheses because we expected that an improvement
on the SEBT would have a low correlation with an improvement on other function tests
such as the 40m fast-paced walk. Additionally, we anticipated that these improvements
would also show a relationship with improvements on the KOOS, because improvements
in neuromuscular control may affect pain, symptoms, function and quality of life. The
results indicate support for our hypotheses. There was a moderate relationship between
the composite change and the 40m walk performance. There were low correlations for the
composite change on the affected leg and the change in pain, symptoms, function in daily
living, function in sport and recreation, and knee related quality of life subscales of the
KOOS. However, when examining individual reach directions, the anterior, anteromedial,
and medial directions demonstrated good correlations with the 40m walk. The
anteromedial and medial directions demonstrated low to moderate correlations with all
subscales of the KOOS and the 40m walk.
It may be that an improvement in neuromuscular control may not correlate strongly with
improvements in KOOS subscales and the 40m walk because they measure different
constructs. It is likely that only a moderate relationship exists between the composite
SEBT and the 40m walk test because the 40m walk test is a function test of short
walking distances and this may not show significant improvements in time even if
neuromuscular control improves. Previous research investigating the effects of
neuromuscular exercise on patients with knee OA found a mean improvement of 1.55
seconds (95% CI 0.59, 2.51) on the 20m walk test9. In the present study, no significant
change was seen on the 40m walk test. The anterior, anteromedial, and medial directions
demonstrated the strongest relationships with the 40m walk. It is possible that the muscle
activation necessary for the anterior, anteromedial, and medial directions is most similar
to that necessary for walking.

49
Previous research demonstrated significant improvements in muscle strength, KOOS pain
and KOOS function in daily living following an exercise program that significantly
improved balance on the SEBT25. Although we did not measure muscle strength, our
composite results did not demonstrate significant improvements on the KOOS and
suggest low correlations between changes in SEBT and changes on the KOOS subscales.
However, our baseline KOOS scores for the pain and ADL subscales were higher than
the post-test KOOS scores reported previously, indicating that our patients may have had
a lesser degree of disability than the population of the previous study. Additionally,
previous research has indicated that low correlations are typical between self-report
measure and function tests51,90,93. It was suggested that self-report measures and
performance measures may assess different aspects of physical function but that they are
both important for monitoring patient function51. Therefore low to moderate correlations
(r=0.24-0.48) between the change in SEBT and change in KOOS and 40 fast-paced walk
test are consistent with previous literature and provide support for the longitudinal
validity of the SEBT.
Although significant improvements were only seen in six of the eight directions, at this
time we support the inclusion of all eight directions of the SEBT when testing a knee OA
population. All directions have adequate reliability and we cannot be conclusive about
why changes were not seen in the anteromedial and anterolateral directions. It may be
that the exercise program did specifically target the neuromuscular control required for
those directions, those directions are the most difficult for demonstrating improvements,
or they are the easiest to perform in a knee OA population and therefore are useless for
monitoring progress. The composite score may be less responsive than each direction
individually because of the noise associated with calculating the mean of eight directions.
However, the composite score is reliable and demonstrated a significant improvement
following exercise and should therefore be included as a main measure of interest.

50
5.4 Limitations
A potential limitation in the present study is that test-retest reliability may be affected by
diurnal variation if participants were tested at different times during the day. We made an
effort to have the two test sessions more than 24 hours apart but within one week to
minimize issues with repeated testing, but not all participants attended sessions at the
same time of day. As well, participants expressed variations with OA pain and symptoms
across visits which may have increased the error associated with a subject’s individual
scores. Previous literature supports the use of four practice trials and three test trials for
the SEBT17,24. However, as the first study to investigate all eight directions of the SEBT
in patients with knee OA, we modified the protocol to include one practice trial and two
test trials. We did this to limit the physical burden on participants and to ensure they
would all be able to complete the test. The average of two trials would better represent
the true score than one trial alone.
Data collection is continuing for our longitudinal validity objective. Although the present
SRMs and correlations are likely accurate, they may change as more data are added.
Therefore, these results should be interpreted with caution as only 21 participants were
included in the analyses. Additionally, although knee OA is more common in women,
more than three-quarters of our participants were male, which may limit the
generalizability of our results. We did not monitor adherence to the exercise program
over the course of the twelve weeks and would expect that monitoring adherence may
lead to a greater improvement at the final test.

51
Chapter 6
6 Conclusion
The SEBT has demonstrated suitable measurement properties for use in patients with
knee OA focused clinical and research settings. It has good-to-excellent test-retest
reliability for all eight SEBT directions and the composite score, similar to previous
studies in healthy athletes and adults17,25. The MDC is 8.9 %LL for the composite
measure. Excellent correlations between observer and motion capture system
measurements suggest high concurrent validity. The SEBT also has reasonable
longitudinal validity. Significant improvements were seen in composite scores and most
directions on both legs. Improvements in SEBT scores were low-to-moderately correlated
with improvements in 40m fast paced walk times and KOOS scores.
6.1 Future Directions
Although the present study suggests that all eight directions of the SEBT are reliable and
valid, future research may benefit from investigating the lower limb kinematics and
muscle activation during each direction of the test in patients with knee OA. This would
further our understanding of the neuromuscular control needed for each direction and
may assist with identifying the most important aspects of the tests, and/or eliminating
unnecessary test directions to decrease the time burden of the test. Future investigations
may also benefit from a larger and more diverse sample of individuals with knee OA to
determine if measurement properties differ among different subgroups of patients.

52
References
1. Vos T, Barber RM, Bell B, et al. Global, regional, and national incidence,
prevalence, and years lived with disability for 301 acute and chronic diseases and
injuries in 188 countries, 1990-2013: A systematic analysis for the Global Burden
of Disease Study 2013. Lancet. 2015;386(9995):743-800. doi:10.1016/S0140-
6736(15)60692-4.
2. Felson DT, Naimark A, Anderson J, Kazis L, Castelli W, Meenan RF. The
prevalence of knee osteoarthritis in the elderly. the framingham osteoarthritis
study. Arthritis Rheum. 1987;30(8):914-918. doi:10.1002/art.1780300811.
3. Cross M, Smith E, Hoy D, et al. The global burden of hip and knee osteoarthritis:
estimates from the Global Burden of Disease 2010 study. Ann Rheum Dis.
2014;73(7):1323-1330. doi:10.1136/annrheumdis-2013-204763.
4. Hunter DJ, Felson DT. Osteoarthritis. BMJ. 2006;332(7542):639-642.
doi:10.1136/bmj.332.7542.639.
5. Hurley M V, Scott DL, Rees J, Newham DJ. Sensorimotor changes and functional
performance in patients with knee osteoarthritis. Ann Rheum Dis. 1997;56:641-
648. doi:10.1136/ard.56.11.641.
6. Jordan KM, Arden NK, Doherty M, et al. EULAR Recommendations 2003: an
evidence based approach to the management of knee osteoarthritis: Report of a
Task Force of the Standing Committee for International Clinical Studies Including
Therapeutic Trials (ESCISIT). Ann Rheum Dis. 2003;62(12):1145-1155.
doi:10.1136/ard.2003.011742.
7. Zhang W, Moskowitz RW, Nuki G, et al. OARSI recommendations for the
management of hip and knee osteoarthritis, Part II: OARSI evidence-based, expert
consensus guidelines. Osteoarthr Cartil. 2008;16(2):137-162.
doi:10.1016/j.joca.2007.12.013.

53
8. Ageberg E, Roos EM. Neuromuscular Exercise as Treatment of Degenerative
Knee Disease. Exerc Sport Sci Rev. 2015;43(1):14-22.
doi:10.1249/JES.0000000000000030.
9. Ageberg E, Nilsdotter A, Kosek E, Roos EM. Effects of neuromuscular training
(NEMEX-TJR) on patient-reported outcomes and physical function in severe
primary hip or knee osteoarthritis: a controlled before-and-after study. BMC
Musculoskelet Disord. 2013;14(1):232. doi:10.1186/1471-2474-14-232.
10. Ageberg E, Link A, Roos EM. Feasibility of neuromuscular training in patients
with severe hip or knee OA: the individualized goal-based NEMEX-TJR training
program. BMC Musculoskelet Disord. 2010;11:126. doi:10.1186/1471-2474-11-
126.
11. Bennell KL, Kyriakides M, Metcalf B, et al. Neuromuscular Versus Quadriceps
Strengthening Exercise in Patients With Medial Knee Osteoarthritis and Varus
Malalignment: A Randomized Controlled Trial. Arthritis Rheumatol.
2014;66(4):950-959. doi:10.1002/art.38317.
12. Dobson F, Hinman RS, Roos EM, et al. OARSI recommended performance-based
tests to assess physical function in people diagnosed with hip or knee
osteoarthritis. Osteoarthr Cartil. 2013;21(8):1042-1052.
doi:10.1016/j.joca.2013.05.002.
13. Hatfield GL, Morrison A, Wenman M, Hammond CA, Hunt MA. Clinical Tests of
Standing Balance in the Knee Osteoarthritis Population : Systematic Review and
Meta-analysis. 2015;95(X).
14. Kinzey SJ, Armstrong CW. The reliability of the star-excursion test in assessing
dynamic balance. J Orthop Sports Phys Ther. 1998;27(5):356-360.
doi:10.2519/jospt.1998.27.5.356.
15. Hertel J, Miller SJ, Denegar CR. lntratester and intertester reliability during the
Star Excursion Balance Tests. J Sport Rehabil. 2000;9(2):104-116.

54
16. Gribble PA, Hertel J. Considerations for Normalizing Measures of the Star
Excursion Balance Test. Meas Phys Educ Exerc Sci. 2003;7(2):89-100.
doi:10.1207/S15327841MPEE0702_3.
17. Munro AG, Herrington LC. Between-session reliability of the star excursion
balance test. Phys Ther Sport. 2010;11(4):128-132.
doi:10.1016/j.ptsp.2010.07.002.
18. Gribble PA, Kelly SE, Refshauge KM, Hiller CE. Interrater Reliability of the Star
Excursion Balance Test. J Athl Train. 2013;48(5):621-626. doi:10.4085/1062-
6050-48.3.03.
19. Olmsted LC, Carciat CR, Hertel J, Shultz SJ. Efficacy of the star excursion
balance tests in detecting reach deficits in subjects with chronic ankle instability. J
Athl Train. 2002;37(4):501-506. doi:10.1002/pri.1589.
20. Pionnier R, Découfour N, Barbier F, Popineau C, Buessinger ES-. A new approach
of the Star Excursion Balance Test to assess dynamic postural control in people
complaining from Chronic Ankle Instability. Gait Posture. 2016;45:97-102.
doi:10.1016/j.gaitpost.2016.01.013.
21. Doherty C, Bleakley CM, Hertel J, Caulfield B, Ryan J, Delahunt E. Laboratory
Measures of Postural Control During the Star Excursion Balance Test After Acute
First-Time Lateral Ankle Sprain. J Athl Train. 2015;50(6):651-664.
doi:10.4085/1062-6050-50.1.09.
22. Delahunt E, Chawke M, Kelleher J, et al. Lower limb kinematics and dynamic
postural stability in anterior cruciate ligament-reconstructed female athletes. J Athl
Train. 2013;48(2):172-185. doi:10.4085/1062-6050-48.2.05.
23. Hertel J, Braham RA, Hale SA, Olmsted-Kramer LC. Simplifying the Star
Excursion Balance Test: Analyses of Subjects With and Without Chronic Ankle
Instability. J Orthop Sport Phys Ther. 2006;36(3):131-137.
doi:10.2519/jospt.2006.36.3.131.
55
24. Robinson RH, Gribble P a. Support for a Reduction in the Number of Trials
Needed for the Star Excursion Balance Test. Arch Phys Med Rehabil.
2008;89(2):364-370. doi:10.1016/j.apmr.2007.08.139.
25. Al-Khlaifat L, Herrington LC, Tyson SF, Hammond A, Jones RK. The
effectiveness of an exercise programme on dynamic balance in patients with
medial knee osteoarthritis: A pilot study. Knee. 2016;23(5):849-856.
doi:10.1016/j.knee.2016.05.006.
26. Lephart SM, Fu FH. Proprioception and Neuromuscular Control in Joint Stability.
Champaign, Illinois: Human Kinetics; 2000.
27. Goldblatt JP, Richmond JC. Anatomy and biomechanics of the knee. Oper Tech
Sports Med. 2003;11(3):172-186. doi:10.1053/otsm.2003.35911.
28. Lane NE, Brandt K, Hawker G, et al. OARSI-FDA initiative: Defining the disease
state of osteoarthritis. Osteoarthr Cartil. 2011;19(5):478-482.
doi:10.1016/j.joca.2010.09.013.
29. Krasnokutsky S, Attur M, Palmer G, Samuels J, Abramson SB. Current concepts
in the pathogenesis of osteoarthritis. Osteoarthr Cartil. 2008;16(SUPPL. 3):S1-S3.
doi:10.1016/j.joca.2008.06.025.
30. Kellgren JH, Lawrence JS. Radiological assessment of osteo-arthrosis. Ann Rheum
Dis. 1957;16(4):494.
31. Pereira D, Peleteiro B, Araújo J, Branco J, Santos RA, Ramos E. The effect of
osteoarthritis definition on prevalence and incidence estimates: A systematic
review. Osteoarthr Cartil. 2011;19(11):1270-1285.
doi:10.1016/j.joca.2011.08.009.
32. Altman R, Asch E, Bloch D, et al. Development of criteria for the classification
and reporting of osteoarthritis. Classification of osteoarthritis of the knee.
Diagnostic and Therapeutic Criteria Committee of the American Rheumatism
Association. Arthritis Rheum. 1986;29(8):1039-1049. doi:10.1002/art.1780290816.

56
33. Bijlsma JWJ, Berenbaum F, Lafeber FPJG. Osteoarthritis: An update with
relevance for clinical practice. Lancet. 2011;377(9783):2115-2126.
doi:10.1016/S0140-6736(11)60243-2.
34. Lawrence RC, Helmick CG, Arnett FC, et al. Estimates of the prevalence of
arthritis and selected musculoskeletal disorders in the United States. Arthritis
Rheum. 1998;41(5):778-799. doi:10.1002/1529-0131(199805)41:5<778::AID-
ART4>3.0.CO;2-V.
35. Felson DT. Osteoarthritis: New Insights. Part 1: The Disease and Its Risk Factors.
Ann Intern Med. 2000;133(8):635. doi:10.7326/0003-4819-133-8-200010170-
00016.
36. Silverwood V, Blagojevic-Bucknall M, Jinks C, Jordan JL, Protheroe J, Jordan
KP. Current evidence on risk factors for knee osteoarthritis in older adults: A
systematic review and meta-analysis. Osteoarthr Cartil. 2015;23(4):507-515.
doi:10.1016/j.joca.2014.11.019.
37. Brouwer GM, Tol AW Van, Bergink AP, et al. Association between valgus and
varus alignment and the development and progression of radiographic
osteoarthritis of the knee. Arthritis Rheum. 2007;56(4):1204-1211.
doi:10.1002/art.22515.
38. Sharma L, Song J, Felson DT, Cahue S, Shamiyeh E, Dunlop DD. The role of
knee alignment in disease progression and functional decline in knee osteoarthritis.
JAMA. 2001;286(2):188-195. doi:10.1001/jama.286.2.188.
39. McAlindon TE, Bannuru RR, Sullivan MC, et al. OARSI guidelines for the non-
surgical management of knee osteoarthritis. Osteoarthr Cartil. 2014;22(3):363-
388. doi:10.1016/j.joca.2014.01.003.
40. Fernandes L, Hagen KB, Bijlsma JWJ, et al. EULAR recommendations for the
non-pharmacological core management of hip and knee osteoarthritis. Ann Rheum
Dis. 2013;72(7):1125-1135. doi:10.1136/annrheumdis-2012-202745.

57
41. Fransen M, McConnell S, Harmer AR, Van der Esch M, Simic M, Bennell KL.
Exercise for osteoarthritis of the knee: a Cochrane systematic review. Br J Sports
Med. 2015;49(24):1554-1557. doi:10.1136/bjsports-2015-095424.
42. Roddy E, Zhang W, Doherty M. Aerobic walking or strengthening exercise for
osteoarthritis of the knee? A systematic review. Ann Rheum Dis. 2005;64(4):544-
548. doi:10.1136/ard.2004.028746.
43. Uthman OA, van der Windt DA, Jordan JL, et al. Exercise for lower limb
osteoarthritis: systematic review incorporating trial sequential analysis and
network meta-analysis. Br J Sports Med. 2014;48(21):1579. doi:10.1136/bjsports-
2014-5555rep.
44. Kirkley A, Birmingham TB, Litchfield RB, et al. A Randomized Trial of
Arthroscopic Surgery for Osteoarthritis of the Knee. N Engl J Med.
2008;359(11):1097-1107. doi:10.1056/NEJMoa0708333.
45. Wiroon L, Malinee L, Pisamai L, Chut S. Arthroscopic debridement for knee
osteoarthritis. Cochrane Database Syst Rev. 2008;(1).
doi:10.1002/14651858.CD005118.pub2.
46. Moseley JB, O’Malley K, Petersen NJ, et al. A Controlled Trial of Arthroscopic
Surgery for Osteoarthritis of the Knee. N Engl J Med. 2002;347(2):81-88.
doi:10.1056/NEJMoa013259.
47. Birmingham TB, Giffin JR, Chesworth BM, et al. Medial opening wedge high
tibial osteotomy: A prospective cohort study of gait, radiographic, and patient-
reported outcomes. Arthritis Rheum. 2009;61(5):648-657. doi:10.1002/art.24466.
48. Carr AJ, Robertsson O, Graves S, et al. Knee replacement. Lancet.
2012;379(9823):1331-1340. doi:10.1016/S0140-6736(11)60752-6.
49. Roos EM, Roos HP, Lohmander LS, Ekdahl C, Beynnon BD. Knee Injury and
Osteoarthritis Outcome Score (KOOS)—Development of a Self-Administered
Outcome Measure. J Orthop Sport Phys Ther. 1998;28(2):88-96.

58
doi:10.2519/jospt.1998.28.2.88.
50. Collins NJ, Misra D, Felson DT, Crossley KM, Roos EM. Measures of knee
function: International Knee Documentation Committee (IKDC) Subjective Knee
Evaluation Form, Knee Injury and Osteoarthritis Outcome Score (KOOS), Knee
Injury and Osteoarthritis Outcome Score Physical Function Short Form (KOOS-
PS), Knee Ou. Arthritis Care Res (Hoboken). 2011;63(S11):S208-S228.
doi:10.1002/acr.20632.
51. Stratford PW, Kennedy DM. Performance measures were necessary to obtain a
complete picture of osteoarthritic patients. J Clin Epidemiol. 2006;59(2):160-167.
doi:10.1016/j.jclinepi.2005.07.012.
52. Stratford PW, Kennedy D, Pagura SMC, Gollish JD. The relationship between
self-report and performance-related measures: Questioning the content validity of
timed tests. Arthritis Rheum. 2003;49(4):535-540. doi:10.1002/art.11196.
53. Adegoke BO., Babatunde FO, Oyeyemi AL. Pain, balance, self-reported function
and physical function in individuals with knee osteoarthritis. Physiother Theory
Pract. 2012;28(1):32-40. doi:10.3109/09593985.2011.570858.
54. Portney LG, Watkins MP. Foundations of Clinical Research: Applications to
Practice. 3rd ed. Upper Saddle River, NJ: Pearson/Prentice Hall; 2009.
55. Streiner D, Norman GR, Cairney J. Health Measurement Scales: A Practical
Guide to Their Development and Use. 5th ed. Oxford University Press, USA;
2015.
56. Stratford PW, Goldsmith CH. Use of the standard error as a reliability index of
interest: an applied example using elbow flexor strength data. Phys Ther.
1997;77(7):745-750.
57. Pollock A, Diurward B, Rowe P, Paul J. What is balance? Clin Rehabil.
2000;2155(August 1999):402-406.

59
58. Van Der Esch M, Steultjens M, Harlaar J, Knol D, Lems W, Dekker J. Joint
proprioception, muscle strength, and functional ability in patients with
osteoarthritis of the knee. Arthritis Care Res. 2007;57(5):787-793.
doi:10.1002/art.22779.
59. Khalaj N, Abu Osman NA, Mokhtar AH, Mehdikhani M, Wan Abas WAB.
Balance and Risk of Fall in Individuals with Bilateral Mild and Moderate Knee
Osteoarthritis. PLoS One. 2014;9(3):e92270. doi:10.1371/journal.pone.0092270.
60. Takacs J, Garland SJ, Carpenter MG, Hunt M a. Validity and reliability of the
community balance and mobility scale in individuals with knee osteoarthritis. Phys
Ther. 2014;94(6):866-874. doi:10.2522/ptj.20130385.
61. Hinman RS, Bennell KL, Metcalf BR, Crossley KM. Balance impairments in
individuals with symptomatic knee osteoarthritis: A comparison with matched
controls using clinical tests. Rheumatology. 2002;41(12):1388-1394.
doi:10.1093/rheumatology/41.12.1388.
62. Mohammadi F, Taghizadeh S, Ghaffarinejad F, Khorrami M, Sobhani S.
Proprioception, dynamic balance and maximal quadriceps strength in females with
knee osteoarthritis and normal control subjects. Int J Rheum Dis. 2008;11(1):39-
44. doi:10.1111/j.1756-185X.2008.00328.x.
63. Takacs J, Carpenter MG, Garland SJ, Hunt MA. Factors Associated with Dynamic
Balance in People with Knee Osteoarthritis. Arch Phys Med Rehabil.
2015;96(10):1873-1879. doi:10.1016/j.apmr.2015.06.014.
64. Sanchez-Ramirez DC, Van Der Leeden M, Knol DL, et al. Association of postural
control with muscle strength, proprioception, self-reported knee instability and
activity limitations in patients with knee osteoarthritis. J Rehabil Med.
2013;45(2):192-197. doi:10.2340/16501977-1087.
65. Wegener L, Kisner C, Nichols D. Static and dynamic balance responses in persons
with bilateral knee osteoarthritis. J Orthop Sports Phys Ther. 1997;25(1):13-18.

60
doi:10.2519/jospt.1997.25.1.13.
66. Turcot K, Hagemeister N, de Guise JA, Aissaoui R. Evaluation of unipodal stance
in knee osteoarthritis patients using knee accelerations and center of pressure.
Osteoarthr Cartil. 2011;19(3):281-286. doi:10.1016/j.joca.2010.12.007.
67. Hunt MA, McManus FJ, Hinman RS, Bennell KL. Predictors of single-leg
standing balance in individuals with medial knee osteoarthritis. Arthritis Care Res
(Hoboken). 2010;62(4):496-500. doi:10.1002/acr.20046.
68. Birmingham TB, Kramer JF, Kirkley A, Inglis JT, Spaulding SJ, Vandervoort AA.
Association among neuromuscular and anatomic measures for patients with knee
osteoarthritis. Arch Phys Med Rehabil. 2001;82(8):1115-1118.
doi:10.1053/apmr.2001.24306.
69. Johnson VL, Hunter DJ. The epidemiology of osteoarthritis. Best Pract Res Clin
Rheumatol. 2014;28(1):5-15. doi:10.1016/j.berh.2014.01.004.
70. Shrout PE, Fleiss JL. Intraclass correlations: Uses in assessing rater reliability.
Psychol Bull. 1979;86(2):420-428. doi:10.1037/0033-2909.86.2.420.
71. Rankin G, Stokes M. Reliability of assessment tools in rehabilitation: an
illustration of appropriate statistical analyses. Clin Rehabil. 1998;12(3):187-199.
doi:10.1191/026921598672178340.
72. Dobson F, Hinman RS, Hall M, Terwee CB, Roos EM, Bennell KL. Measurement
properties of performance-based measures to assess physical function in hip and
knee osteoarthritis: a systematic review. Osteoarthr Cartil. 2012;20(12):1548-
1562. doi:10.1016/j.joca.2012.08.015.
73. Demura S, Yamada T. Proposal for a practical star excursion balance test using
three trials with four directions. Sport Sci Health. 2010;6(1):1-8.
doi:10.1007/s11332-010-0089-3.
74. Glave AP, Didier JJ, Weatherwax J, Browning SJ, Fiaud V. Testing Postural

61
Stability: Are the Star Excursion Balance Test and Biodex Balance System Limits
of Stability Tests Consistent? Gait Posture. 2016;43:225-227.
doi:10.1016/j.gaitpost.2015.09.028.
75. Bastien M, Moffet H, Bouyer L, Perron M, Hebert LJ, Leblond J. Concurrent and
discriminant validity of the Star Excursion Balance Test for military personnel
with lateral ankle sprain. J Sport Rehabil. 2014;23(1):44-55. doi:10.1123/jsr.2012-
0132.
76. Earl JE, Hertel J. Lower-Extremity Muscle Activation During the Star Excursion
Balance Tests. J Sport Rehabil. 2001;10:93-105.
77. Robinson R, Gribble P. Kinematic predictors of performance on the Star Excursion
Balance Test. J Sport Rehabil. 2008;17(4):347-357.
78. Hoch MC, Gaven SL, Weinhandl JT. Kinematic predictors of star excursion
balance test performance in individuals with chronic ankle instability. Clin
Biomech. 2016;35:37-41. doi:10.1016/j.clinbiomech.2016.04.008.
79. Coughlan GF, Fullam K, Delahunt E, Gissane C, Caulfield BM. A comparison
between performance on selected directions of the star excursion balance test and
the Y balance test. J Athl Train. 2012;47(4):366-371. doi:10.4085/1062-6050-
47.4.03.
80. Fullam K, Caulfield B, Coughlan GF, Delahunt E. Kinematic analysis of selected
reach directions of the Star Excursion Balance Test compared with the Y-Balance
Test. J Sport Rehabil. 2014;23:27-35. doi:10.1123/jsr.2012-0114.
81. de la Motte S, Arnold BL, Ross SE. Trunk-rotation differences at maximal reach
of the star excursion balance test in participants with chronic ankle instability. J
Athl Train. 2015;50(4):358-365. doi:10.4085/1062-6050-49.3.74.
82. Hale S a, Hertel J, Olmsted-Kramer LC. The effect of a 4-week comprehensive
rehabilitation program on postural control and lower extremity function in
individuals with chronic ankle instability. J Orthop Sports Phys Ther.

62
2007;37(6):303-311. doi:10.2519/jospt.2007.2322.
83. Herrington L, Hatcher J, Hatcher A, McNicholas M. A comparison of Star
Excursion Balance Test reach distances between ACL deficient patients and
asymptomatic controls. Knee. 2009;16(2):149-152.
doi:10.1016/j.knee.2008.10.004.
84. Overmoyer G V., Reiser RF. Relationships Between Asymmetries in Functional
Movements and the Star Excursion Balance Test. J Strength Cond Res.
2013;27(7):2013-2024. doi:10.1519/JSC.0b013e3182779962.
85. Filipa A, Byrnes R, Paterno M V, Myer GD, Hewett TE. Neuromuscular training
improves performance on the star excursion balance test in young female athletes.
J Orthop Sports Phys Ther. 2010;40(9):551-558. doi:10.2519/jospt.2010.3325.
86. CORTEX Version 2.5 Reference Manual. Santa Rosa, CA: Motion Analysis
Corporation; 2011.
87. Kadaba MP, Ramakrishnan HK, Wootten ME, Gainey J, Gorton G, Cochran GVB.
Repeatability of kinematic, kinetic, and electromyographic data in normal adult
gait. J Orthop Res. 1989;7(6):849-860. doi:10.1002/jor.1100070611.
88. Roos EM, Lohmander LS. The Knee injury and Osteoarthritis Outcome Score
(KOOS): from joint injury to osteoarthritis. Health Qual Life Outcomes.
2003;1:64. doi:10.1186/1477-7525-1-64.
89. Weir J. Quantifying test-retest reliability using the intraclass correlation
coefficient. J Strength Cond Res. 2005;19:231-240.
90. Reid A, Birmingham TB, Stratford PW, Alcock GK, Giffin JR. Hop Testing
Provides a Reliable and Valid Outcome Measure During Rehabilitation After
Anterior Cruciate Ligament Reconstruction. Phys Ther. 2007;87(3):337-349.
doi:10.2522/ptj.20060143.
91. Walter SDSD, Eliasziw MM, Donner AA. Sample size and optimal designs for

63
reliability studies. Stat Med. 1998;17(1):101-110.
92. Chow S-C, Shao J, Wang H. Sample Size Calculations in Clinical Research. New
York, USA: Marcel Dekker; 2003.
93. Yeung TSM, Wessel J, Stratford P, MacDermid J. Reliability, Validity, and
Responsiveness of the Lower Extremity Functional Scale for Inpatients of an
Orthopaedic Rehabilitation Ward. J Orthop Sport Phys Ther. 2009;39(6):468-477.
doi:10.2519/jospt.2009.2971.

64
Appendices
Appendix A. Letter of Information and Consent

65

66

67
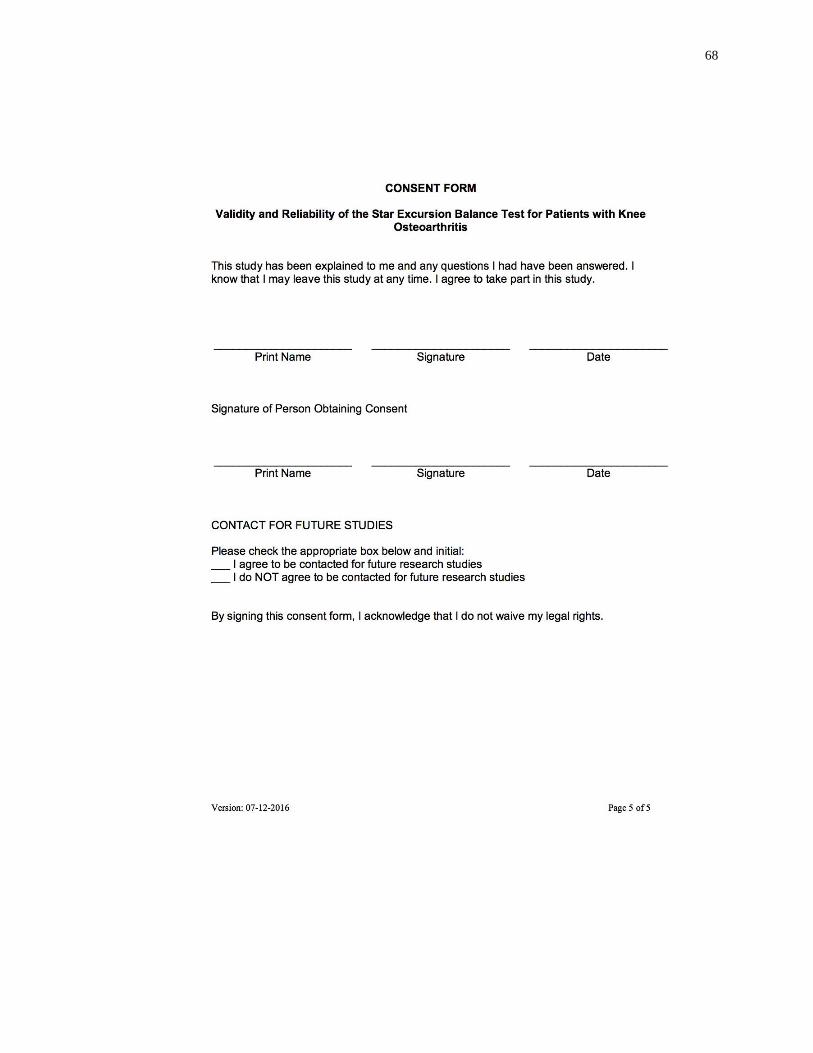
68

69
Appendix B. Ethics Approval Notice

70
Curriculum Vitae
Lauren Kanko MSc Candidate
EDUCATION
2015-2017 Master of Science, Kinesiology, Integrative Biosciences
(In progress) Western University, London ON
Collaborative Program in Musculoskeletal Health Research
Supervisor: Dr. Trevor Birmingham
2011-2015 Bachelor of Science Honours, Specialization Kinesiology
Queen’s University, Kingston ON
HONOURS & AWARDS
2015-2017 Western Graduate Research Scholarship
2015-2017 Collaborative Program for Musculoskeletal Health
Research Trainee Award
2011-2015 Queen’s University Dean’s Honour List
2011 Queen’s University Excellence Scholarship
RELATED EXPERIENCE
2015-2017 Wolf Orthopaedic Biomechanics Laboratory
Western University, London ON
Research Student
2015-2017 Teaching Assistant, Western University
KIN2241 Biomechanics
71
Professor: Dr. Tom Jenkyn
KIN3353 Biomechanical Analysis of Human Locomotion
Professor: Dr. Volker Nolte
KIN1080 Introduction to Psychomotor Behavior
Professor: Dr. Matthew Heath
PRESENTATIONS
Poster Presentation London Health Research Day 2017
Validity and Reliability of the Star Excursion Balance Test
in Patients with Knee Osteoarthritis
Poster Presentation Faculty of Health Sciences Research Day 2016
Validity, Test-Retest Reliability, and Sensitivity to Change
of the Star Excursion Balance Test for Patients with Knee
Osteoarthritis Undergoing Rehabilitation
Oral Presentation Kinesiology Graduate Student Research Symposium 2016
Validity, Test-Retest Reliability and Sensitivity to Change
of the Star Excursion Balance Test for Patients with Knee
Osteoarthritis: A Study Proposal