release 0.4.8.dev0 sebastian bank 0.4.8.dev0 sebastian bank september 14, 2015 contents 1 links 3 2...
TRANSCRIPT

graphviz DocumentationRelease 0.4.8.dev0
Sebastian Bank
September 14, 2015


Contents
1 Links 3
2 Installation 5
3 Quickstart 7
4 See also 9
5 License 11
6 User Guide 136.1 User Guide . . . . . . . . . . . . . . . . . . . . . . . . . . . . . . . . . . . . . . . . . . . . . . . . 13
7 Examples 177.1 Examples . . . . . . . . . . . . . . . . . . . . . . . . . . . . . . . . . . . . . . . . . . . . . . . . . 17
8 API Reference 278.1 API Reference . . . . . . . . . . . . . . . . . . . . . . . . . . . . . . . . . . . . . . . . . . . . . . 27
9 Project Info 339.1 Changelog . . . . . . . . . . . . . . . . . . . . . . . . . . . . . . . . . . . . . . . . . . . . . . . . 339.2 License . . . . . . . . . . . . . . . . . . . . . . . . . . . . . . . . . . . . . . . . . . . . . . . . . . 35
i

ii

graphviz Documentation, Release 0.4.8.dev0
This package facilitates the creation of graph descriptions in the DOT language of the Graphviz graph drawing softwarefrom Python.
Create a graph object, assemble the graph by adding nodes and edges, and retrieve its DOT source code string. Savethe source code to a file and render it with the Graphviz installation of your system.
Use the view option/method to directly inspect the resulting (PDF, PNG, SVG, etc.) file with its default application.Graphs can also be rendered and displayed within IPython notebooks.
Contents 1

graphviz Documentation, Release 0.4.8.dev0
2 Contents
CHAPTER 1
Links
• GitHub: http://github.com/xflr6/graphviz
• PyPI: http://pypi.python.org/pypi/graphviz
• Documentation: http://graphviz.readthedocs.org
• Changelog: http://graphviz.readthedocs.org/en/latest/changelog.html
• Issue Tracker: http://github.com/xflr6/graphviz/issues
• Download: http://pypi.python.org/pypi/graphviz#downloads
3
graphviz Documentation, Release 0.4.8.dev0
4 Chapter 1. Links

CHAPTER 2
Installation
This package runs under Python 2.6, 2.7, and 3.3+, use pip to install:
$ pip install graphviz
To render the generated DOT source code, you also need to install Graphviz (download page).
Make sure that the dot executable is on your systems’ path.
5
graphviz Documentation, Release 0.4.8.dev0
6 Chapter 2. Installation

CHAPTER 3
Quickstart
Create a graph object:
>>> from graphviz import Digraph
>>> dot = Digraph(comment='The Round Table')
>>> dot<graphviz.dot.Digraph object at 0x...>
Add nodes and edges:
>>> dot.node('A', 'King Arthur')>>> dot.node('B', 'Sir Bedevere the Wise')>>> dot.node('L', 'Sir Lancelot the Brave')
>>> dot.edges(['AB', 'AL'])>>> dot.edge('B', 'L', constraint='false')
Check the generated source code:
>>> print(dot.source)// The Round Tabledigraph {
A [label="King Arthur"]B [label="Sir Bedevere the Wise"]L [label="Sir Lancelot the Brave"]
A -> BA -> LB -> L [constraint=false]
}
Save and render the source code, optionally view the result:
>>> dot.render('test-output/round-table.gv', view=True)'test-output/round-table.gv.pdf'
7

graphviz Documentation, Release 0.4.8.dev0
8 Chapter 3. Quickstart

CHAPTER 4
See also
• pygraphviz – full-blown interface wrapping the Graphviz C library with SWIG
• graphviz-python – official Python bindings (documentation)
• pydot – stable pure-Python approach, requires pyparsing
9

graphviz Documentation, Release 0.4.8.dev0
10 Chapter 4. See also
CHAPTER 5
License
This package is distributed under the MIT license.
11

graphviz Documentation, Release 0.4.8.dev0
12 Chapter 5. License

CHAPTER 6
User Guide
6.1 User Guide
6.1.1 Installation
graphviz provides a simple pure-python interface for the Graphviz graph-drawing software. It runs under bothPython 2.7 and 3.3+. To install it with pip run the following:
$ pip install graphviz
For a system-wide install, this typically requires administrator access. For an isolated install, you can run the sameinside a virtualenv.
The only dependency is a working installation of Graphviz (download page).
After installing Graphiz, make sure that its bin/ subdirectory containing the layout commands for rendering graphdescriptions (dot, circo, neato, etc.) is on your systems’ path: On the command-line, dot -V should print theversion of your Graphiz installation.
6.1.2 Basic usage
The graphviz module provides two classes: Graph and Digraph. They create graph descriptions in the DOTlanguage for undirected and directed graphs respectively. They have the same API.
Create a graph by instantiating a new Graph or Digraph object:
>>> from graphviz import Digraph
>>> dot = Digraph(comment='The Round Table')
>>> dot<graphviz.dot.Digraph object at 0x...>
Their constructors allow to set the graph’s name, the filename for the DOT source and the rendered graph, acomment for the first source code line, etc.
Add nodes and edges using the node and edge or edges methods:
>>> dot.node('A', 'King Arthur')>>> dot.node('B', 'Sir Bedevere the Wise')>>> dot.node('L', 'Sir Lancelot the Brave')
13

graphviz Documentation, Release 0.4.8.dev0
>>> dot.edges(['AB', 'AL'])>>> dot.edge('B', 'L', constraint='false')
The node-method take a name identifier as first argument and an optional label. The edge-method takes thenames of start- and end-node, while edges takes iterable of name-pairs. Keyword arguments are turned into (nodeand edge) attributes (see Graphviz docs).
Check the generated source code:
>>> print(dot.source)// The Round Tabledigraph {
A [label="King Arthur"]B [label="Sir Bedevere the Wise"]L [label="Sir Lancelot the Brave"]
A -> BA -> LB -> L [constraint=false]
}
Use the render-method to save the source code and render it with the default layout program.
>>> dot.render('test-output/round-table.gv', view=True)'test-output/round-table.gv.pdf'
Passing view=True will automatically open the resulting (PDF, PNG, SVG, etc.) file with your system’s defaultviewer application for the file type.
6.1.3 Formats
To use a different output file format than the default PDF, set the format argument when creating your Graph orDigraph object:
>>> from graphviz import Graph
>>> g = Graph(format='png')
You can also change the format attribute on an existing graph object:
>>> dot.format = 'svg'
>>> dot.render()'test-output/round-table.gv.svg'
14 Chapter 6. User Guide

graphviz Documentation, Release 0.4.8.dev0
6.1.4 Piped output
To directly access the results from the Graphviz rendering command (e.g. dot) as binary data string from withinPython instead of writing to a file, use the pipe()-method of your Graph or Digraph object:
>>> h = Graph('hello', format='svg')
>>> h.edge('Hello', 'World')
>>> print(h.pipe().decode('utf-8'))<?xml version="1.0" encoding="UTF-8" standalone="no"?><!DOCTYPE svg...</svg>
Note that pipe() returns the raw stdout from the rendering command (str on Python 2, bytes on Python 3):When piping into plain-text formats like svg or plain, you usually want to decode the return value as shown above.
Note: The output for pipe() is buffered in memory, so do not use this method if the data size is large.
6.1.5 IPython notebooks
Graph and Digraph objects have a _repr_svg_-method so they can be rendered and displayed directly inside anIPython notebook. For an example, see the examples/notebook.ipynb in the source repository/distribution.
6.1.6 Styling
Use the graph_attr, node_attr, and edge_attr arguments to change the default appearance of your graph,nodes, and edges.
>>> dot = Digraph(name='pet-shop', node_attr={'shape': 'plaintext'})
>>> dot.node('parrot')>>> dot.node('dead')>>> dot.edge('parrot', 'dead')
After creation, they can be edited on the graph object:
>>> dot.graph_attr['rankdir'] = 'LR'>>> dot.edge_attr.update(arrowhead='vee', arrowsize='2')
>>> print(dot.source)digraph "pet-shop" {
graph [rankdir=LR]node [shape=plaintext]edge [arrowhead=vee arrowsize=2]
parrotdead
parrot -> dead}
6.1. User Guide 15

graphviz Documentation, Release 0.4.8.dev0
6.1.7 Engines
To use a different layout command than the default dot when rendering your graph, set the engine argument ongraph creation.
>>> g = Graph(engine='neato')
You can also change the engine attribute of an existing instance:
>>> dot.engine = 'circo'
6.1.8 Using raw DOT
To render a ready-made DOT source code string (instead of assembling one with the higher-level interface of Graphor Digraph), create a Source object holding your DOT string:
>>> from graphviz import Source
>>> src = Source('digraph "the holy hand grenade" { rankdir=LR; 1 -> 2 -> 3 -> lob }')
>>> src<graphviz.files.Source object at 0x...>
Use the render-method to save and render it:
>>> src.render('test-output/holy-grenade.gv', view=True)'test-output/holy-grenade.gv.pdf'
Apart from the missing editing methods, Source objects are the same as the higher-level graph objects (pipe()-method, formats, engines, IPython notebook repr, etc.), see above.
16 Chapter 6. User Guide
CHAPTER 7
Examples
7.1 Examples
7.1.1 hello.py
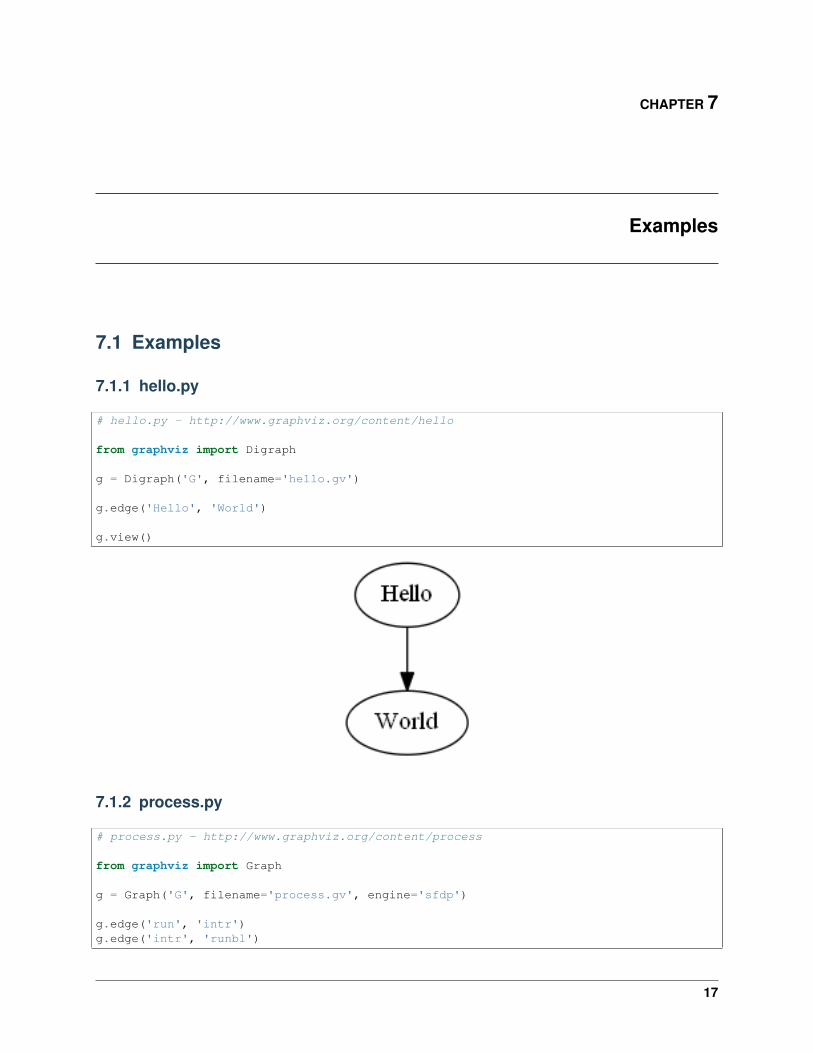
# hello.py - http://www.graphviz.org/content/hello
from graphviz import Digraph
g = Digraph('G', filename='hello.gv')
g.edge('Hello', 'World')
g.view()
7.1.2 process.py
# process.py - http://www.graphviz.org/content/process
from graphviz import Graph
g = Graph('G', filename='process.gv', engine='sfdp')
g.edge('run', 'intr')g.edge('intr', 'runbl')
17

graphviz Documentation, Release 0.4.8.dev0
g.edge('runbl', 'run')g.edge('run', 'kernel')g.edge('kernel', 'zombie')g.edge('kernel', 'sleep')g.edge('kernel', 'runmem')g.edge('sleep', 'swap')g.edge('swap', 'runswap')g.edge('runswap', 'new')g.edge('runswap', 'runmem')g.edge('new', 'runmem')g.edge('sleep', 'runmem')
g.view()
7.1.3 fsm.py
# fsm.py - http://www.graphviz.org/content/fsm
from graphviz import Digraph
f = Digraph('finite_state_machine', filename='fsm.gv')f.body.extend(['rankdir=LR', 'size="8,5"'])
f.attr('node', shape='doublecircle')f.node('LR_0')f.node('LR_3')f.node('LR_4')f.node('LR_8')
f.attr('node', shape='circle')f.edge('LR_0', 'LR_2', label='SS(B)')f.edge('LR_0', 'LR_1', label='SS(S)')f.edge('LR_1', 'LR_3', label='S($end)')f.edge('LR_2', 'LR_6', label='SS(b)')f.edge('LR_2', 'LR_5', label='SS(a)')f.edge('LR_2', 'LR_4', label='S(A)')f.edge('LR_5', 'LR_7', label='S(b)')f.edge('LR_5', 'LR_5', label='S(a)')f.edge('LR_6', 'LR_6', label='S(b)')f.edge('LR_6', 'LR_5', label='S(a)')f.edge('LR_7', 'LR_8', label='S(b)')
18 Chapter 7. Examples

graphviz Documentation, Release 0.4.8.dev0
f.edge('LR_7', 'LR_5', label='S(a)')f.edge('LR_8', 'LR_6', label='S(b)')f.edge('LR_8', 'LR_5', label='S(a)')
f.view()
7.1.4 cluster.py
# cluster.py - http://www.graphviz.org/content/cluster
from graphviz import Digraph
g = Digraph('G', filename='cluster.gv')
c0 = Digraph('cluster_0')c0.body.append('style=filled')c0.body.append('color=lightgrey')c0.node_attr.update(style='filled', color='white')c0.edges([('a0', 'a1'), ('a1', 'a2'), ('a2', 'a3')])c0.body.append('label = "process #1"')
c1 = Digraph('cluster_1')c1.node_attr.update(style='filled')c1.edges([('b0', 'b1'), ('b1', 'b2'), ('b2', 'b3')])c1.body.append('label = "process #2"')c1.body.append('color=blue')
g.subgraph(c0)g.subgraph(c1)
g.edge('start', 'a0')g.edge('start', 'b0')g.edge('a1', 'b3')g.edge('b2', 'a3')g.edge('a3', 'a0')g.edge('a3', 'end')g.edge('b3', 'end')
7.1. Examples 19

graphviz Documentation, Release 0.4.8.dev0
g.node('start', shape='Mdiamond')g.node('end', shape='Msquare')
g.view()
20 Chapter 7. Examples
graphviz Documentation, Release 0.4.8.dev0
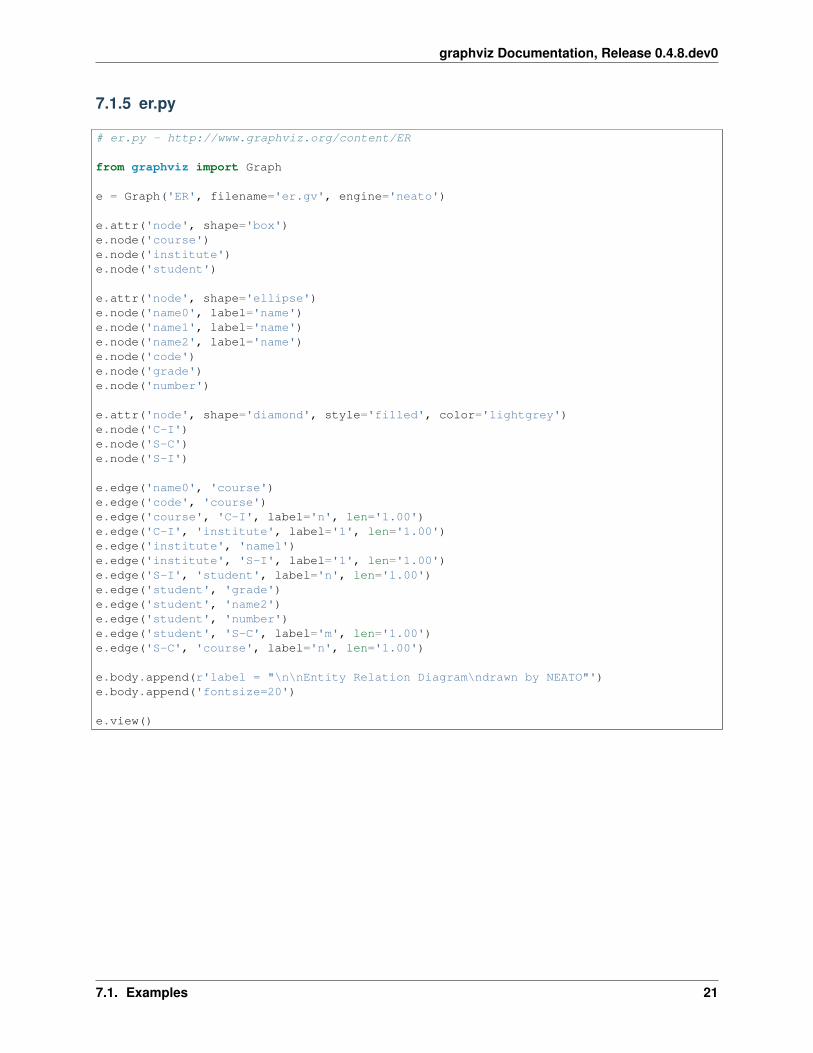
7.1.5 er.py
# er.py - http://www.graphviz.org/content/ER
from graphviz import Graph
e = Graph('ER', filename='er.gv', engine='neato')
e.attr('node', shape='box')e.node('course')e.node('institute')e.node('student')
e.attr('node', shape='ellipse')e.node('name0', label='name')e.node('name1', label='name')e.node('name2', label='name')e.node('code')e.node('grade')e.node('number')
e.attr('node', shape='diamond', style='filled', color='lightgrey')e.node('C-I')e.node('S-C')e.node('S-I')
e.edge('name0', 'course')e.edge('code', 'course')e.edge('course', 'C-I', label='n', len='1.00')e.edge('C-I', 'institute', label='1', len='1.00')e.edge('institute', 'name1')e.edge('institute', 'S-I', label='1', len='1.00')e.edge('S-I', 'student', label='n', len='1.00')e.edge('student', 'grade')e.edge('student', 'name2')e.edge('student', 'number')e.edge('student', 'S-C', label='m', len='1.00')e.edge('S-C', 'course', label='n', len='1.00')
e.body.append(r'label = "\n\nEntity Relation Diagram\ndrawn by NEATO"')e.body.append('fontsize=20')
e.view()
7.1. Examples 21

graphviz Documentation, Release 0.4.8.dev0
22 Chapter 7. Examples
graphviz Documentation, Release 0.4.8.dev0
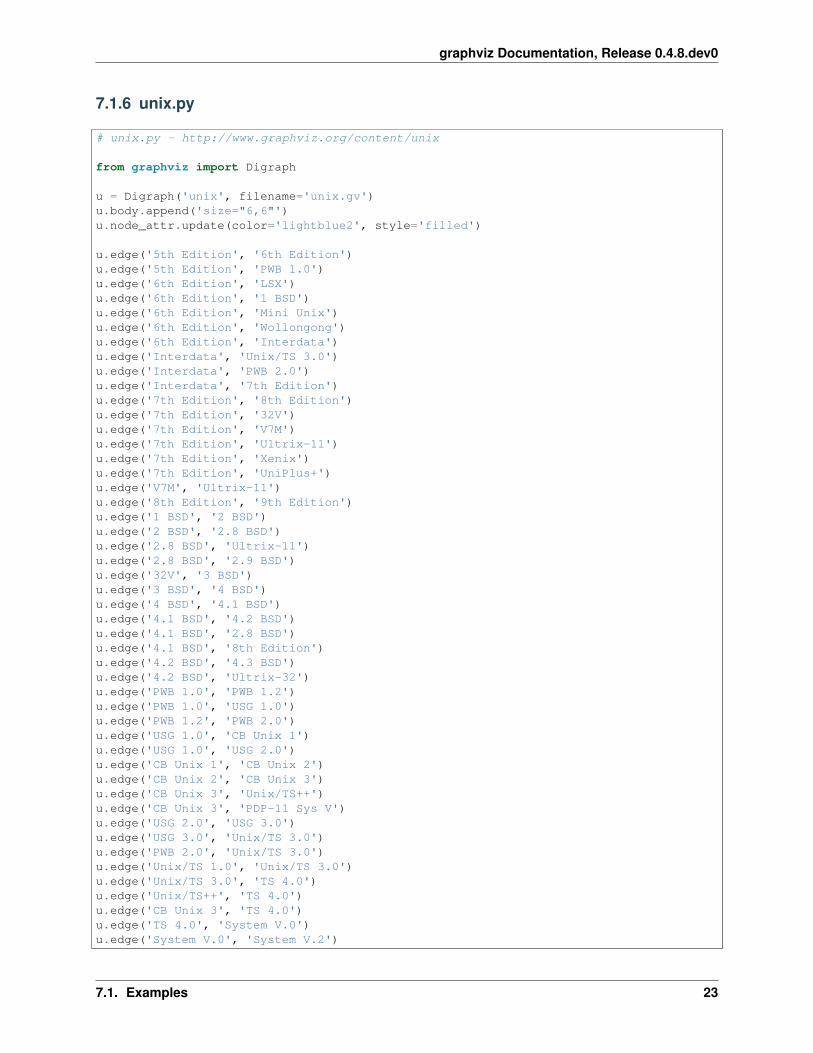
7.1.6 unix.py
# unix.py - http://www.graphviz.org/content/unix
from graphviz import Digraph
u = Digraph('unix', filename='unix.gv')u.body.append('size="6,6"')u.node_attr.update(color='lightblue2', style='filled')
u.edge('5th Edition', '6th Edition')u.edge('5th Edition', 'PWB 1.0')u.edge('6th Edition', 'LSX')u.edge('6th Edition', '1 BSD')u.edge('6th Edition', 'Mini Unix')u.edge('6th Edition', 'Wollongong')u.edge('6th Edition', 'Interdata')u.edge('Interdata', 'Unix/TS 3.0')u.edge('Interdata', 'PWB 2.0')u.edge('Interdata', '7th Edition')u.edge('7th Edition', '8th Edition')u.edge('7th Edition', '32V')u.edge('7th Edition', 'V7M')u.edge('7th Edition', 'Ultrix-11')u.edge('7th Edition', 'Xenix')u.edge('7th Edition', 'UniPlus+')u.edge('V7M', 'Ultrix-11')u.edge('8th Edition', '9th Edition')u.edge('1 BSD', '2 BSD')u.edge('2 BSD', '2.8 BSD')u.edge('2.8 BSD', 'Ultrix-11')u.edge('2.8 BSD', '2.9 BSD')u.edge('32V', '3 BSD')u.edge('3 BSD', '4 BSD')u.edge('4 BSD', '4.1 BSD')u.edge('4.1 BSD', '4.2 BSD')u.edge('4.1 BSD', '2.8 BSD')u.edge('4.1 BSD', '8th Edition')u.edge('4.2 BSD', '4.3 BSD')u.edge('4.2 BSD', 'Ultrix-32')u.edge('PWB 1.0', 'PWB 1.2')u.edge('PWB 1.0', 'USG 1.0')u.edge('PWB 1.2', 'PWB 2.0')u.edge('USG 1.0', 'CB Unix 1')u.edge('USG 1.0', 'USG 2.0')u.edge('CB Unix 1', 'CB Unix 2')u.edge('CB Unix 2', 'CB Unix 3')u.edge('CB Unix 3', 'Unix/TS++')u.edge('CB Unix 3', 'PDP-11 Sys V')u.edge('USG 2.0', 'USG 3.0')u.edge('USG 3.0', 'Unix/TS 3.0')u.edge('PWB 2.0', 'Unix/TS 3.0')u.edge('Unix/TS 1.0', 'Unix/TS 3.0')u.edge('Unix/TS 3.0', 'TS 4.0')u.edge('Unix/TS++', 'TS 4.0')u.edge('CB Unix 3', 'TS 4.0')u.edge('TS 4.0', 'System V.0')u.edge('System V.0', 'System V.2')
7.1. Examples 23

graphviz Documentation, Release 0.4.8.dev0
u.edge('System V.2', 'System V.3')
u.view()
7.1.7 structs.py
# structs.py - http://www.graphviz.org/doc/info/shapes.html#html
from graphviz import Digraph
s = Digraph('structs', node_attr={'shape': 'plaintext'})
s.node('struct1', '''<<TABLE BORDER="0" CELLBORDER="1" CELLSPACING="0">
<TR><TD>left</TD><TD PORT="f1">middle</TD><TD PORT="f2">right</TD>
</TR></TABLE>>''')s.node('struct2', '''<<TABLE BORDER="0" CELLBORDER="1" CELLSPACING="0">
24 Chapter 7. Examples

graphviz Documentation, Release 0.4.8.dev0
<TR><TD PORT="f0">one</TD><TD>two</TD>
</TR></TABLE>>''')s.node('struct3', '''<<TABLE BORDER="0" CELLBORDER="1" CELLSPACING="0" CELLPADDING="4">
<TR><TD ROWSPAN="3">hello<BR/>world</TD><TD COLSPAN="3">b</TD><TD ROWSPAN="3">g</TD><TD ROWSPAN="3">h</TD>
</TR><TR><TD>c</TD><TD PORT="here">d</TD><TD>e</TD>
</TR><TR><TD COLSPAN="3">f</TD>
</TR></TABLE>>''')
s.edges([('struct1:f1', 'struct2:f0'), ('struct1:f2', 'struct3:here')])
s.view()
7.1. Examples 25

graphviz Documentation, Release 0.4.8.dev0
26 Chapter 7. Examples

CHAPTER 8
API Reference
8.1 API Reference
Note: The two main classes Graph and Digraph (for creating undirected vs. directed graphs) have exactly thesame API. Their division reflects the fact that both graph types cannot be mixed.
8.1.1 Graph
class graphviz.Graph(name=None, comment=None, filename=None, directory=None, for-mat=None, engine=None, encoding=None, graph_attr=None, node_attr=None,edge_attr=None, body=None)
Graph source code in the DOT language.
Parameters
• name – Graph name used in the source code.
• comment – Comment added to the first line of the source.
• filename – Filename for saving the source (defaults to name + ‘.gv’).
• directory – (Sub)directory for source saving and rendering.
• format – Rendering output format (‘pdf’, ‘png’, ...).
• engine – Layout command used (‘dot’, ‘neato’, ...).
• encoding – Encoding for saving the source.
• graph_attr – Mapping of (attribute, value) pairs for the graph.
• node_attr – Mapping of (attribute, value) pairs set for all nodes.
• edge_attr – Mapping of (attribute, value) pairs set for all edges.
• body – Iterable of lines to add to the graph body.
Note: All parameters are optional and can be changed under their corresponding attribute name after instancecreation.
attr(kw, _attributes=None, **attrs)Add a graph/node/edge attribute statement.
Parameters
27
graphviz Documentation, Release 0.4.8.dev0
• kw – Attributes target (‘graph’, ‘node’, or ‘edge’)
• attrs – Attributes to be set (must be strings, may be empty).
edge(tail_name, head_name, label=None, _attributes=None, **attrs)Create an edge between two nodes.
Parameters
• tail_name – Start node identifier.
• head_name – End node identifier.
• label – Caption to be displayed near the edge.
• attrs – Any additional edge attributes (must be strings).
edges(tail_head_iter)Create a bunch of edges.
Parameters tail_head_iter – Iterable of (tail_name, head_name) pairs.
engineThe layout commmand used for rendering (‘dot’, ‘neato’, ...)
formatThe output format used for rendering (‘pdf’, ‘png’, etc.).
node(name, label=None, _attributes=None, **attrs)Create a node.
Parameters
• name – Unique identifier for the node inside the source.
• label – Caption to be displayed (defaults to the node name).
• attrs – Any additional node attributes (must be strings).
pipe(format=None)Return the source piped through the Graphviz layout command.
Parameters format – The output format used for rendering (‘pdf’, ‘png’, etc.).
Returns Stdout of the layout command.
render(filename=None, directory=None, view=False, cleanup=False)Save the source to file and render with the Graphviz engine.
Parameters
• filename – Filename for saving the source (defaults to name + ‘.gv’)
• directory – (Sub)directory for source saving and rendering.
• view – Open the rendered result with the default application.
• cleanup – Delete the source file after rendering.
Returns The (possibly relative) path of the rendered file.
save(filename=None, directory=None)Save the DOT source to file.
Parameters
• filename – Filename for saving the source (defaults to name + ‘.gv’)
• directory – (Sub)directory for source saving and rendering.
28 Chapter 8. API Reference
graphviz Documentation, Release 0.4.8.dev0
Returns The (possibly relative) path of the saved source file.
sourceThe DOT source code as string.
subgraph(graph)Add the current content of the given graph as subgraph.
Parameters graph – An instance of the same kind (Graph, Digraph) as the current graph.
view()Save the source to file, open the rendered result in a viewer.
Returns The (possibly relative) path of the rendered file.
8.1.2 Digraph
class graphviz.Digraph(name=None, comment=None, filename=None, directory=None, format=None,engine=None, encoding=None, graph_attr=None, node_attr=None,edge_attr=None, body=None)
Directed graph source code in the DOT language.
Parameters
• name – Graph name used in the source code.
• comment – Comment added to the first line of the source.
• filename – Filename for saving the source (defaults to name + ‘.gv’).
• directory – (Sub)directory for source saving and rendering.
• format – Rendering output format (‘pdf’, ‘png’, ...).
• engine – Layout command used (‘dot’, ‘neato’, ...).
• encoding – Encoding for saving the source.
• graph_attr – Mapping of (attribute, value) pairs for the graph.
• node_attr – Mapping of (attribute, value) pairs set for all nodes.
• edge_attr – Mapping of (attribute, value) pairs set for all edges.
• body – Iterable of lines to add to the graph body.
Note: All parameters are optional and can be changed under their corresponding attribute name after instancecreation.
attr(kw, _attributes=None, **attrs)Add a graph/node/edge attribute statement.
Parameters
• kw – Attributes target (‘graph’, ‘node’, or ‘edge’)
• attrs – Attributes to be set (must be strings, may be empty).
edge(tail_name, head_name, label=None, _attributes=None, **attrs)Create an edge between two nodes.
Parameters
• tail_name – Start node identifier.
8.1. API Reference 29

graphviz Documentation, Release 0.4.8.dev0
• head_name – End node identifier.
• label – Caption to be displayed near the edge.
• attrs – Any additional edge attributes (must be strings).
edges(tail_head_iter)Create a bunch of edges.
Parameters tail_head_iter – Iterable of (tail_name, head_name) pairs.
engineThe layout commmand used for rendering (‘dot’, ‘neato’, ...)
formatThe output format used for rendering (‘pdf’, ‘png’, etc.).
node(name, label=None, _attributes=None, **attrs)Create a node.
Parameters
• name – Unique identifier for the node inside the source.
• label – Caption to be displayed (defaults to the node name).
• attrs – Any additional node attributes (must be strings).
pipe(format=None)Return the source piped through the Graphviz layout command.
Parameters format – The output format used for rendering (‘pdf’, ‘png’, etc.).
Returns Stdout of the layout command.
render(filename=None, directory=None, view=False, cleanup=False)Save the source to file and render with the Graphviz engine.
Parameters
• filename – Filename for saving the source (defaults to name + ‘.gv’)
• directory – (Sub)directory for source saving and rendering.
• view – Open the rendered result with the default application.
• cleanup – Delete the source file after rendering.
Returns The (possibly relative) path of the rendered file.
save(filename=None, directory=None)Save the DOT source to file.
Parameters
• filename – Filename for saving the source (defaults to name + ‘.gv’)
• directory – (Sub)directory for source saving and rendering.
Returns The (possibly relative) path of the saved source file.
sourceThe DOT source code as string.
subgraph(graph)Add the current content of the given graph as subgraph.
Parameters graph – An instance of the same kind (Graph, Digraph) as the current graph.
30 Chapter 8. API Reference

graphviz Documentation, Release 0.4.8.dev0
view()Save the source to file, open the rendered result in a viewer.
Returns The (possibly relative) path of the rendered file.
8.1.3 Source
class graphviz.Source(source, filename=None, directory=None, format=None, engine=None, encod-ing=None)
Verbatim DOT source code string to be rendered by Graphviz.
Parameters
• source – The verbatim DOT source code string.
• filename – Filename for saving the source (defaults to name + ‘.gv’).
• directory – (Sub)directory for source saving and rendering.
• format – Rendering output format (‘pdf’, ‘png’, ...).
• engine – Layout command used (‘dot’, ‘neato’, ...).
• encoding – Encoding for saving the source.
Note: All parameters except source are optional and can be changed under their corresponding attribute nameafter instance creation.
engineThe layout commmand used for rendering (‘dot’, ‘neato’, ...)
formatThe output format used for rendering (‘pdf’, ‘png’, etc.).
pipe(format=None)Return the source piped through the Graphviz layout command.
Parameters format – The output format used for rendering (‘pdf’, ‘png’, etc.).
Returns Stdout of the layout command.
render(filename=None, directory=None, view=False, cleanup=False)Save the source to file and render with the Graphviz engine.
Parameters
• filename – Filename for saving the source (defaults to name + ‘.gv’)
• directory – (Sub)directory for source saving and rendering.
• view – Open the rendered result with the default application.
• cleanup – Delete the source file after rendering.
Returns The (possibly relative) path of the rendered file.
save(filename=None, directory=None)Save the DOT source to file.
Parameters
• filename – Filename for saving the source (defaults to name + ‘.gv’)
• directory – (Sub)directory for source saving and rendering.
8.1. API Reference 31

graphviz Documentation, Release 0.4.8.dev0
Returns The (possibly relative) path of the saved source file.
view()Save the source to file, open the rendered result in a viewer.
Returns The (possibly relative) path of the rendered file.
32 Chapter 8. API Reference

CHAPTER 9
Project Info
9.1 Changelog
9.1.1 Version 0.4.8 (in development)
9.1.2 Version 0.4.7
Fixed view()-method on Linux under Python 3 (pull request Antony Lee).
9.1.3 Version 0.4.6
Fixed view()-method on Linux and Darwin (pull request Eric L. Frederich).
9.1.4 Version 0.4.5
Added example for HTML-like labels (structs.py).
Added Source class for rendering verbatim DOT source code.
Added Python 2.6 support (pull request Jim Crist).
9.1.5 Version 0.4.4
Added the pipe()-method directly returning the stdout of the rendering.
Added _repr_svg_ for inline rendering in IPython notebooks.
9.1.6 Version 0.4.3
Added examples generating some of the graphs from the Graphviz Gallery.
Added sphinx-based API documentation.
9.1.7 Version 0.4.2
Added support for HTML-like labels.
33

graphviz Documentation, Release 0.4.8.dev0
9.1.8 Version 0.4.1
Added support for less common output formats. Removed dropped formats (dia, pcl).
Added osage layout engine.
Documented format and engine options in the README.
The view() convenience method now returns the result file name (like render()).
9.1.9 Version 0.4
Added attr() method for inline switching of node/edge attributes.
Added subgraph() method (obsoletes separate Subgraph class).
Add cleanup option to render().
Replaced dry option on render() with separate save() method.
Removed undocumented append() and extend() methods (if needed, the body attribute can be edited directly).
9.1.10 Version 0.3.5
Skip empty comment when creating DOT source.
Document graph_attr, node_attr, and edge_attr in the README.
More informative exception when Graphviz excutables cannot be called.
9.1.11 Version 0.3.4
Fixed missing identifier quoting for DOT keywords (thanks to Paulo Urio).
9.1.12 Version 0.3.3
Made format and engine case-insensitive.
9.1.13 Version 0.3.2
Indent graph_attr, node_attr, and edge_attr lines, adapt nodes and edges.
9.1.14 Version 0.3.1
Fixed view() failing on paths with forward slashes on Windows.
9.1.15 Version 0.3
Added Python 3.3+ support.
Made attributes order stable (sorting plain dicts).
Fixed edgeop in undirected graphs.
34 Chapter 9. Project Info
graphviz Documentation, Release 0.4.8.dev0
9.1.16 Version 0.2.2
Support pdf opening on Linux.
Fixed rendering filenames w/spaces.
9.1.17 Version 0.2.1
Fixed rendering on Mac OS X.
9.1.18 Version 0.2
Added format selection, use PDF as default. Added engines selection, use dot as default. Added source encoding, useUTF-8 as default.
Changed constructor arguments order, removed compile and save method, reimplemented compilation in rendermethod, make interface more similar to gv.3python (backwards incompatible change).
Double-quote-sign escaping, attribute list quoting.
mkdirs now correctly supports current directory filenames.
9.1.19 Version 0.1.1
Removed automatic ‘-‘ to ‘−’ replacement from labels.
Fixed documentation typos.
9.1.20 Version 0.1
First public release.
9.2 License
The MIT License (MIT)
Copyright (c) 2013-2015 Sebastian Bank
Permission is hereby granted, free of charge, to any person obtaining a copy of this software and associated documen-tation files (the “Software”), to deal in the Software without restriction, including without limitation the rights to use,copy, modify, merge, publish, distribute, sublicense, and/or sell copies of the Software, and to permit persons to whomthe Software is furnished to do so, subject to the following conditions:
The above copyright notice and this permission notice shall be included in all copies or substantial portions of theSoftware.
THE SOFTWARE IS PROVIDED “AS IS”, WITHOUT WARRANTY OF ANY KIND, EXPRESS OR IMPLIED,INCLUDING BUT NOT LIMITED TO THE WARRANTIES OF MERCHANTABILITY, FITNESS FOR A PAR-TICULAR PURPOSE AND NONINFRINGEMENT. IN NO EVENT SHALL THE AUTHORS OR COPYRIGHTHOLDERS BE LIABLE FOR ANY CLAIM, DAMAGES OR OTHER LIABILITY, WHETHER IN AN ACTIONOF CONTRACT, TORT OR OTHERWISE, ARISING FROM, OUT OF OR IN CONNECTION WITH THE SOFT-WARE OR THE USE OR OTHER DEALINGS IN THE SOFTWARE.
9.2. License 35

graphviz Documentation, Release 0.4.8.dev0
36 Chapter 9. Project Info
Index
Aattr() (graphviz.Digraph method), 29attr() (graphviz.Graph method), 27
DDigraph (class in graphviz), 29
Eedge() (graphviz.Digraph method), 29edge() (graphviz.Graph method), 28edges() (graphviz.Digraph method), 30edges() (graphviz.Graph method), 28engine (graphviz.Digraph attribute), 30engine (graphviz.Graph attribute), 28engine (graphviz.Source attribute), 31
Fformat (graphviz.Digraph attribute), 30format (graphviz.Graph attribute), 28format (graphviz.Source attribute), 31
GGraph (class in graphviz), 27
Nnode() (graphviz.Digraph method), 30node() (graphviz.Graph method), 28
Ppipe() (graphviz.Digraph method), 30pipe() (graphviz.Graph method), 28pipe() (graphviz.Source method), 31
Rrender() (graphviz.Digraph method), 30render() (graphviz.Graph method), 28render() (graphviz.Source method), 31
Ssave() (graphviz.Digraph method), 30
save() (graphviz.Graph method), 28save() (graphviz.Source method), 31Source (class in graphviz), 31source (graphviz.Digraph attribute), 30source (graphviz.Graph attribute), 29subgraph() (graphviz.Digraph method), 30subgraph() (graphviz.Graph method), 29
Vview() (graphviz.Digraph method), 30view() (graphviz.Graph method), 29view() (graphviz.Source method), 32
37