relative spectral analysis-rasta -...
TRANSCRIPT

97
Chapter 5
Relative Spectral
Analysis-RASTA

Chapter 5 Relative Spectral Analysis-RASTA
98
The need for noise reduction and suppression technology is more important than ever.
Mobile phones, portable communication devices and other phones are widely used in noisy
environments. As a result, phone calls contain, in addition to the speaker’s voice, unwanted
signals like other people talking around, vehicle engine noise and horns, wind noise, keyboard-
strokes etc. A background noise suppression system developed by Motorola is included as a
feature in IS-127, the TIA/EIA standard for the Enhanced Variable Rate Codec (EVRC) to be
used in CDMA based telephone systems [1]. EVRC was modified to EVRC-B and later on
replaced by Selectable Mode Vocoder (SMV) which retained the speech quality at the same time
improved network capacity. Recently, however, SMV itself has been replaced by the new
CDMA2000 4GV codecs. 4GV is the next generation 3GPP2 standards-based EVRC-B codec
[2]. The EVRC based codec uses combination of STSA based approaches: multiband spectral
subtraction (MBSS) and minimum mean square error (MMSE) gain function estimator for
background noise suppression as a preprocessor. The voice activity detector (VAD) used to
decide speech/silence frame is embedded within the algorithm. Its quality has been proven good
through commercial products. Nevertheless, the quality may not be sufficiently good for a wide
range of SNRs, which were not given much attention when it was standardized. Another
algorithm suggested by A.Sugiyama, M.Kato and M. Serizawa [3] uses modified MMSE-STSA
approach based on weighted noise estimation. The subjective tests on this algorithm claim to
give maximum difference in mean opinion score (MOS) of 0.35 to 0.40 compared to EVRC and
hence its later version is equipped within 3G handsets [3].
The STSA based algorithms are able to suppress the noise effectively subject to accurate
estimation of noise during silence interval detected by VAD. Its performance depends on VAD.
Also, the STSA based approaches have their common problems of musical noise and speech
distortion. Hence it is needed to shift the enhancement domain itself. This leads to investigate the
use of RelAtive SpecTral Amplitude (RASTA) processing of speech originally proposed by
Hermansky and Morgan [4] and designed to alleviate effects of convolutional and additive noise
in automatic speech recognition (ASR). Recently, RASTA was also applied to direct
enhancement of noisy speech in communication systems [4, 6]. A noise suppression system for
cellular communications based on RASTA has been proposed in [5].
Chapter 5 Relative Spectral Analysis-RASTA
99
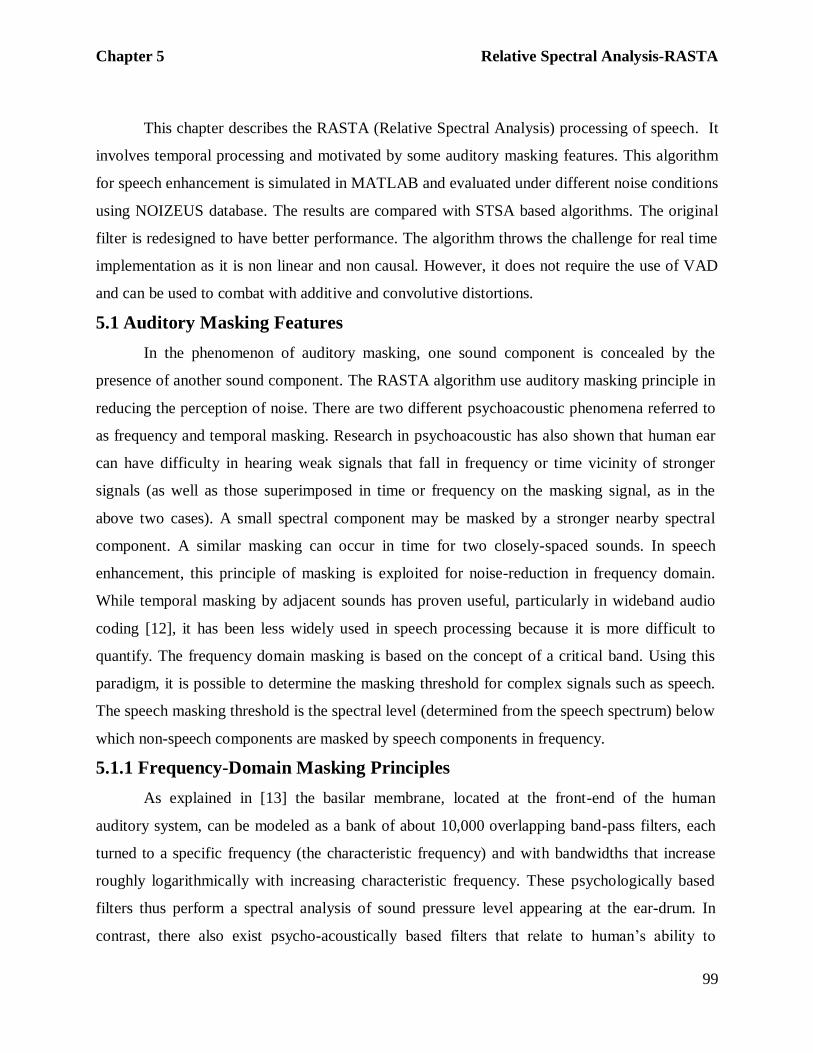
This chapter describes the RASTA (Relative Spectral Analysis) processing of speech. It
involves temporal processing and motivated by some auditory masking features. This algorithm
for speech enhancement is simulated in MATLAB and evaluated under different noise conditions
using NOIZEUS database. The results are compared with STSA based algorithms. The original
filter is redesigned to have better performance. The algorithm throws the challenge for real time
implementation as it is non linear and non causal. However, it does not require the use of VAD
and can be used to combat with additive and convolutive distortions.
5.1 Auditory Masking Features
In the phenomenon of auditory masking, one sound component is concealed by the
presence of another sound component. The RASTA algorithm use auditory masking principle in
reducing the perception of noise. There are two different psychoacoustic phenomena referred to
as frequency and temporal masking. Research in psychoacoustic has also shown that human ear
can have difficulty in hearing weak signals that fall in frequency or time vicinity of stronger
signals (as well as those superimposed in time or frequency on the masking signal, as in the
above two cases). A small spectral component may be masked by a stronger nearby spectral
component. A similar masking can occur in time for two closely-spaced sounds. In speech
enhancement, this principle of masking is exploited for noise-reduction in frequency domain.
While temporal masking by adjacent sounds has proven useful, particularly in wideband audio
coding [12], it has been less widely used in speech processing because it is more difficult to
quantify. The frequency domain masking is based on the concept of a critical band. Using this
paradigm, it is possible to determine the masking threshold for complex signals such as speech.
The speech masking threshold is the spectral level (determined from the speech spectrum) below
which non-speech components are masked by speech components in frequency.
5.1.1 Frequency-Domain Masking Principles
As explained in [13] the basilar membrane, located at the front-end of the human
auditory system, can be modeled as a bank of about 10,000 overlapping band-pass filters, each
turned to a specific frequency (the characteristic frequency) and with bandwidths that increase
roughly logarithmically with increasing characteristic frequency. These psychologically based
filters thus perform a spectral analysis of sound pressure level appearing at the ear-drum. In
contrast, there also exist psycho-acoustically based filters that relate to human’s ability to

Chapter 5 Relative Spectral Analysis-RASTA
100
perceptually resolve sound with respect to frequency. The bandwidths of these filters are known
as the critical bands of hearing and are similar in nature to the physiologically based filters.
Frequency analysis by a human has been studied by using perceptual masking. A tone at
some intensity that human ear trying to perceive is called the maskee. A second tone, adjacent in
frequency, attempts to drown out the presence of the maskee called the masker. If one can
determine the intensity level of the maskee (relative to the absolute level of hearing) at which it
is not audible in the presence of the masker. This intensity level is called the masking threshold
of the maskee. The general shape [12] of the masking curve for a masking tone at frequency
Ω0 with a particular sound-pressure level (SPL) in decibels is shown in figure 5.1. Adjacent
tones that have an SPL below the solid lines are not audible in the presence of the tone atΩ 0 . As
it is shown that there is a range of frequencies about the masker whose audibility is affected.
Tones with intensity below the masking threshold curve are masked by the masking tone. The
curve has asymmetric nature around Ω0 .
Fig. 5.1 General shape of the masking threshold curve for a masking tone at frequency 𝛀𝟎
Another important property of masking curves is that the bandwidth of these curves
increases roughly logarithmically as the frequency of the masker increases. Experiments
conducted have given the roughly logarithmically increasing width of the critical band filters
and suggested about 24 critical band filters cover our maximum frequency range of 15000Hz for
human perception. A means of mapping linear frequency to this perceptual representation is
through the bark scale. In this mapping, one bark covers one critical band with the functional
relation of frequency f to bark z given by [15].
𝑧 = 13 tan−1 0.76𝑓 + 3.5 tan−1 𝑓
7500
(5.1)
In the low end of the bark scale (<1000 Hz), the bandwidths of the critical band filters are found

Chapter 5 Relative Spectral Analysis-RASTA
101
to be about 100Hz and in higher frequencies the bandwidths reach up to about 3000Hz [15]. A
similar mapping uses the mel scale. The mel scale is approximately linear up to 1000Hz and
logarithmic thereafter [15].
𝑚 = 2595𝑙𝑜𝑔10 1 +𝑓
700 (5.2)
Although equation 5.2 provides a continuous mapping from linear to bark scale, most
perceptually motivated speech processing algorithms use quantized bark numbers of 1,2,3…24
that correspond approximately to the upper band edges of the 24 critical bands that cover range
of hearing of human ear. This allows exploiting the perceptual masking properties with feasible
computation in speech signal processing.
5.1.2 Masking Threshold Computation
For speech signal, the effects of individual masking components are additive; the overall
masking at a frequency component due to all the other frequency components is given by the
sum of the masking due to the individual frequency components, giving a single masking
threshold [16]. For a background noise disturbance (the maskee) in the presence of speech (the
masker) it is required to determine the masking threshold curve, as determined from the speech
spectrum, below which background noise would be inaudible. For the speech threshold
calculation, the masking ability of tonal and noise components of speech (in masking
background noise) is different.
5.1.3 Exploiting Frequency Masking in Noise Reduction
In exploiting frequency masking, the basic approach is to attempt to make inaudible
spectral components of annoying background residual (from an enhancement process) by
forcing them to fall below a masking threshold curve as derived from a measured speech
spectrum. The interest is in masking this annoying (often musical) residual while maximizing
noise reduction and minimizing speech distortion. There are a variety of psycho-acoustically
motivated speech enhancement algorithms that seek to achieve this goal by using suppression
filters similar to those from spectral subtraction and Weiner filtering [16-18]. Each algorithm
establishes a different optimal perceptual tradeoff between the noise reduction, background
residual (musical) artifacts, and speech distortion.
There are two particular suppression algorithms that exploit masking in different ways.
The first approach by Virag [19] applies less attenuation when noise is heavily masked so as to

Chapter 5 Relative Spectral Analysis-RASTA
102
limit speech distortion. In this approach a masking threshold curve is used to modify parameters
of a Berouti spectral subtraction scheme. The parameters α and β are adapted to the masking
threshold curve on each frame. Virag found that the proposed spectral subtraction scheme that
adapts to auditory masking outperformed the more classical spectral subtraction approaches,
according to the objective measures. Finally Virag used the subjective Mean Opinion Score
(MOS) test to show that the auditory based algorithm also outperforms other subtractive type
noise suppression algorithms with respect to human perception; the algorithm was judged to
reduce musical artifacts and give acceptable speech distortion. These results motivate the
research work to include perceptual features in speech enhancement algorithms.
The second approach by Gustafsson, Jax, and Vary [20] seeks residual noise that is
perceptually equivalent to an attenuated version of the input noise without explicit consideration
of speech distortion. In this approach, rather than using the masking threshold curve to modify a
standard suppression filter, the masking threshold is used to derive a new suppression filter that
results in perceived noise which is an attenuated version of the original background noise.
An extension of the suppression algorithm by Gustaffson, Jax, and Vary that reduces
speech distortion has been introduced by Govindasamy [18]. This method uses frequency-
domain masking to explicitly seek to hide speech distortion simultaneously with the noise
distortion.
However, all these approaches which exploit the auditory masking features; but perform
speech enhancement by applying various forms of spectral subtraction and Wiener filtering on
short time speech segments, holding the time variable fixed in the STFT. Throughout the review
process it has been observed that if the same direction of thinking continues; the inherent
problems of musical noise and speech distortion will not be solved together. So if a different
approach is taken in which the frequency variable is kept fixed and the filtering is applied along
time trajectories of STFT (temporal domain filtering) the problems may get resolved. It is also
required to embed the perceptual features described here in the temporal domain filter. This
leads to the development of RASTA processing of speech. Frame-by-frame analysis of speech
dates from early days of speech analysis-synthesis. RASTA processing represents a departure
from this paradigm. It is a step in the direction of modeling some temporal properties of human
auditory processing. It has a potential for further improvements as more knowledge about the

Chapter 5 Relative Spectral Analysis-RASTA
103
modeling of human auditory perception will be available.
5.2 RASTA Processing System
In ASR the task is to decode the linguistic message in speech. This linguistic message is
coded into the movements of the vocal tract. The speech signal reflects these movements. The
rate of change of non linguistic components in speech often lies outside the typical rate of
change of vocal tract shape. The relative spectral processing (RASTA) uses this fact. It is
motivated by some auditory features which are, in part, similar to that for adaptivity in the
Weiner filter of Section 5.2.3. It suppresses the spectral components that changes more slowly or
quickly than the typical range of change of speech. This rate of change of the short-time spectral
envelope can be described by the modulation spectrum (temporal feature), i.e. the spectrum of
the time trajectories described by the short-time spectral envelope [7]. For a wide range of
frequency bands, the modulation spectrum of speech exhibits a maximum at about 4Hz, the
average syllabic rate. RASTA exploits this modulation frequency preference. With slowly
varying (rather than fixed) channel degradation, and given human ear insensitivity to low
modulation frequencies, in RASTA a filter that notches out frequency components at and near
DC is applied to each channel. In addition, the RASTA filter suppresses high modulation
frequencies to account for the human’s preference for signal change at a 4Hz rate. Disturbances
such as additive noise may have different modulation spectrum properties than speech and often
have modulation frequency components outside the speech range, and could in principle be
attenuated without significantly affecting the range with relevant linguistic information. The
RASTA processing suppresses the spectral components outside the typical modulation spectrum
of speech. The maximum modulation frequency of the modulation spectrum is half of the
sampling frequency of RASTA filter. The sampling frequency of RASTA filter is decided by
frame rate. The frame rate is obtained by taking ratio of sampling frequency of speech signal to
the number of shift points in a frame.
RASTA based speech enhancement suggested in [6] involves linear filtering of the
trajectory of the short-term power spectrum of noisy speech signal as shown in figure 5.2.

Chapter 5 Relative Spectral Analysis-RASTA
104
Fig. 5.2 Block diagram: RASTA processing system
RASTA algorithm processing steps for each analysis frame are…
Compute the short time power spectrum of windowed signal.
Transform spectral amplitude through a compressing static nonlinear transformation.
Filter the time trajectory of each transformed spectral component.
Transform the filtered speech representation through expanding static nonlinear transformation.
Perform the overlap add synthesis and reconstruct the signal.
5.3 RASTA Method
It is a generalization of cepstral mean subtraction (CMS) that was introduced in section
2.2.2.2. The original algorithm addresses the problem of a slowly time-varying linear channel
(i.e., convolutional distortion) in contrast to the time invariant channel removed by CMS. The
essence of RASTA is a cepstral lifter that removes low and high modulation frequencies and not
simply the DC component, as does CMS. The filter suggested in [4] is the fixed IIR band pass
filter for all time trajectories given by transfer function
𝑃 𝑧 = 0.1𝑧4 ∗2 + 𝑧−1 − 𝑧−3 − 2𝑧−4
1 − 0.94𝑧−1
(5.2)
For the sampling frequency of 100Hz i.e., the frame interval corresponds to 10ms, the filter is
designed with lower cut-off frequency of 0.26Hz. The filter slope decline 6dB/octave from
12.8Hz with sharp zeros at 28.9Hz and at 50Hz. The frequency response of the filter is shown in
figure 5.3.

Chapter 5 Relative Spectral Analysis-RASTA
105
The low cut-off frequency of the filter determines the fastest spectral change of the non-
linearly transformed spectrum, which is ignored in the output, whereas the high cut-off
frequency determines the fastest spectral change that is preserved in the output parameters. The
high-pass portion of the equivalent band pass filter is expected to alleviate the effect of
convolutional noise introduced in the channel. The low-pass filtering helps to smooth some of
the fast frame-to-frame spectral changes present in the short-term spectral estimate due to
analysis artifacts.
Fig. 5.3 Frequency response of fixed IIR RASTA filter
In RASTA for convolutive distortion reduction, the compressing static nonlinear
operator becomes the magnitude followed by the logarithm operator. The expanding static
nonlinear operator is inverse logarithm (exponential). The RASTA enhancement for convolutive
distortion reduction is given by
𝑋 𝑛.𝜔 = 𝑒𝑥𝑝 𝑝 𝑛 −𝑚 𝑙𝑜𝑔 𝑌(𝑚,𝜔
∞
𝑚=−∞
(5.3)
The RASTA filter is seen to peak at about 4Hz. As does CMS, RASTA reduces slowly varying
signal components, but in addition, suppresses variations above about 16Hz. The complete
RASTA temporal processing for blind de-convolution is illustrated in figure 5.4. In this figure, a
0 5 10 15 20 25 30 35 40 45 50
-200
-100
0
100
ModulationFrequency (Hz)
Ph
ase
(d
eg
re
es)
0 5 10 15 20 25 30 35 40 45 50
-60
-40
-20
0
Modulation Frequency (Hz)
Ma
gn
itu
de
(d
B)

Chapter 5 Relative Spectral Analysis-RASTA
106
slowly varying distortion𝑙𝑜𝑔|G(n,ω) |, due to a convolutional distortion g(n) to be removed by
the RASTA filter 𝑝(𝑛), is added to the rapidly varying speech contribution 𝑙𝑜𝑔|𝑋(𝑛,𝜔) |.
Fig. 5.4 Flow diagram of RASTA processing for de-convolution
In addition to reducing convolutional distortion, RASTA can also be used to reduce
additive noise. The temporal processing is applied to the STFT magnitude and the original
(noisy) phase along each temporal trajectory is kept intact. In performing noise reduction along
STFT temporal trajectories, it is assumed that the noise background changes slowly relative to
the rate of change of speech, which is concentrated in the 1-16Hz range. A nonlinear operator
used in equation 5.3 such as the logarithm, however does not preserve the additive noise
property and thus linear trajectory filtering is not strictly appropriate. Nevertheless, a cubic-root
for compression and cubic power for expansion of the power spectrum (2/3rd
power for
compression and 3/2th
power for expansion of magnitude spectrum) results in a noise reduction
[6-8]. However, applying rather aggressive fixed ARMA RASTA filters (designed for
suppression of convolutional distortions in ASR) yields results similar to spectral subtraction,
i.e., enhanced speech often contains musical noise and the technique typically degrades clean
speech. Also, in [4] it is stated that for the RASTA enhancement processing described above,
neither formal perceptual experiments were run nor any significance objective evaluation using
corpus of noisy data was performed. The parameters and filter described are influenced by
audible results only.
A noise suppression system for cellular communication based on RASTA processing [5]
has been proposed. In this method the fixed IIR band pass filter is replaced by multiband non-
causal FIR Wiener like filters with 21 tapes to achieve more reliable noise reduction. The
impulse response of the filer bank is shown in figure 5.5. Here the 256 point window with 192

Chapter 5 Relative Spectral Analysis-RASTA
107
points of overlap for 8 KHz signal sampling frequency is used. This gives sampling frequency of
RASTA filter as 125Hz. The filter in the band 0-100Hz is having almost flat frequency response
and has all pass characteristics. In the bands 150-250Hz and 2700-4000Hz the filters low gain
low pass filters with at least 10dB attenuation for modulation frequencies above 5Hz. For region
300-2300Hz the filter have a band pass characteristics, emphasizing modulation frequencies
around 6-8Hz. Compared to original fixed IIR filter, the low frequency band stop is much
milder, being only at most 10dB down from the maximum. Here each filter is designed
optimally to map a time window of noisy speech spectrum of specific frequency to a single
estimate of short time magnitude spectrum of clean speech as determined from a training speech
database.
Fig. 5.5 Impulse response of multiband 21 taps FIR filters for additive noise removal in
RASTA processing
In general the power law modification of the magnitude trajectories for additive noise
removal is given by following equation.
𝑋 𝑛.𝜔 = 𝑃 𝑛 − 𝑚,𝜔 𝑌(𝑚,𝜔 1/𝛾
∞
𝑚=−∞
𝛾
(5.4)
With the filter design technique described above, the value of γ=3/2 for the power-law
nonlinearity was found in informal listening to give preferred perceptual quality. The general
block diagram of RASTA processing for additive noise removal is shown in figure 5.6.

Chapter 5 Relative Spectral Analysis-RASTA
108
Fig. 5.6 Flow diagram of RASTA processing for additive noise removal (b=1/a=γ)
5.4 RASTA Algorithm Implementation and Modifications
In simulation of original RASTA filter; the filter for each time trajectory is implemented
by fixed IIR band pass filter with transfer function given by equation 5.2. To perform the
RASTA filtering a Hamming window of 200 samples length with an overlap of 120 samples is
used. With 8 KHz signal sampling frequency this gives 25ms window duration and 15ms
overlap. The frame rate and hence the sampling frequency of RASTA filter is 100Hz. The
maximum modulation frequency is 50Hz. The filter is designed with lower cut-off frequency of
0.26Hz. The filter slope decline 6dB/octave from 12.8Hz with sharp zeros at 28.9Hz and at 50
Hz. The frequency response of the filter is shown in figure 5.3. The algorithm used for obtaining
FFT generates 256 points complex FFT, which gives magnitude and phase for first 129 points.
Each spectral value is filtered using the filter described in equation 5.2. These filtered spectral
values are combined with the phase of noisy spectrum, 256 point IFFT is applied and overlap-
add operation is performed to reconstruct the enhanced speech. The value of parameter a is set
to 2/3 and hence b is set to 3/2 which are proposed in [4-6].
As per auditory principles; the nonlinear compression and expansion is critical in
RASTA approach. In simulation experiment the parameters a and b are tested for different
values. The parameters suggested in [4] are based on audible experience only. Hence the
simulation is carried out with originally fixed values of parameters a and b as well as with the
Synth
esis
Phases
𝑌(256)
𝑌(1)
Short time
Analysis
Magnitude
&
Phase
Extraction
( )𝑏 Filter ( )𝑎
Noisy Speech
𝑦(𝑛)
Enhanced
Speech
𝑥 (𝑛)
.
.
. .
.
.
Chapter 5 Relative Spectral Analysis-RASTA
109
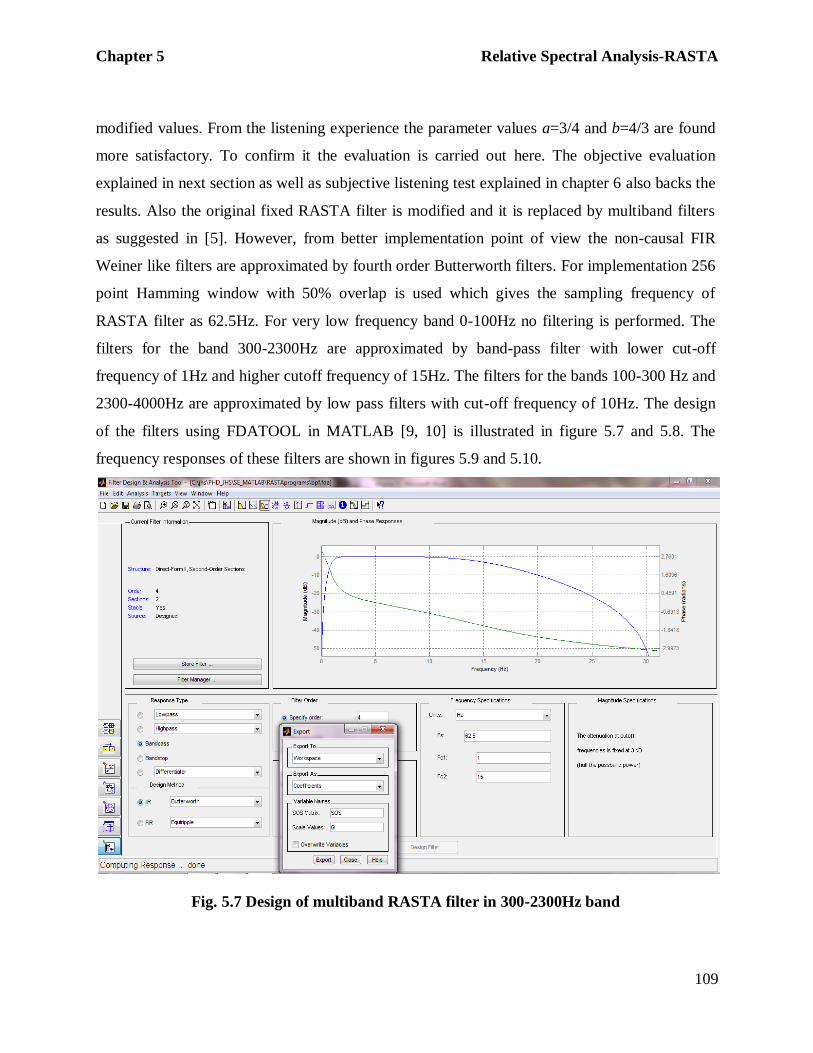
modified values. From the listening experience the parameter values a=3/4 and b=4/3 are found
more satisfactory. To confirm it the evaluation is carried out here. The objective evaluation
explained in next section as well as subjective listening test explained in chapter 6 also backs the
results. Also the original fixed RASTA filter is modified and it is replaced by multiband filters
as suggested in [5]. However, from better implementation point of view the non-causal FIR
Weiner like filters are approximated by fourth order Butterworth filters. For implementation 256
point Hamming window with 50% overlap is used which gives the sampling frequency of
RASTA filter as 62.5Hz. For very low frequency band 0-100Hz no filtering is performed. The
filters for the band 300-2300Hz are approximated by band-pass filter with lower cut-off
frequency of 1Hz and higher cutoff frequency of 15Hz. The filters for the bands 100-300 Hz and
2300-4000Hz are approximated by low pass filters with cut-off frequency of 10Hz. The design
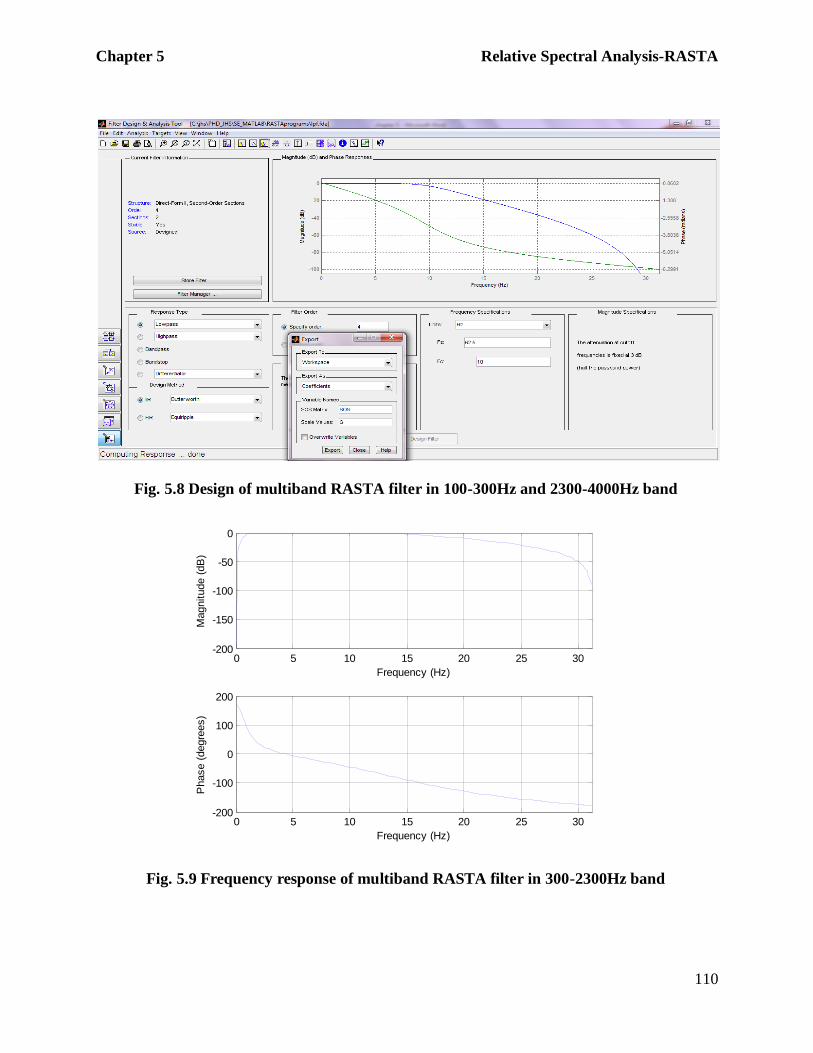
of the filters using FDATOOL in MATLAB [9, 10] is illustrated in figure 5.7 and 5.8. The
frequency responses of these filters are shown in figures 5.9 and 5.10.
Fig. 5.7 Design of multiband RASTA filter in 300-2300Hz band
Chapter 5 Relative Spectral Analysis-RASTA
110
Fig. 5.8 Design of multiband RASTA filter in 100-300Hz and 2300-4000Hz band
Fig. 5.9 Frequency response of multiband RASTA filter in 300-2300Hz band
0 5 10 15 20 25 30-200
-100
0
100
200
Frequency (Hz)
Phase (
degre
es)
0 5 10 15 20 25 30-200
-150
-100
-50
0
Frequency (Hz)
Magnitude (
dB
)

Chapter 5 Relative Spectral Analysis-RASTA
111
Fig. 5.10 Frequency response of multiband RASTA filter in 100-300Hz and 2300-4000Hz
band
The band pass filter is designed using FDATOOL in MATLAB [9, 10]. The implementation
details are given below.
% % Generated by MATLAB(R) 7.8 and the Signal Processing Toolbox 6.11. % % Generated on: 12-May-2011 18:20:50 %
% Coefficient Format: Decimal
% Discrete-Time IIR Filter (real) % ------------------------------- % Filter Structure : Direct-Form II, Second-Order Sections % Number of Sections : 2 % Stable : Yes % Linear Phase : No
SOS matrix: 1 2 1 1 -0.80995029893913273 0.51158976469417017 1 2 1 1 -0.60203320225744494 0.12355934398734861
Scale Values: 0.17540986643875933 0.13038153543247591
0 5 10 15 20 25 30-400
-300
-200
-100
0
Frequency (Hz)
Phase (
degre
es)
0 5 10 15 20 25 30-200
-100
0
100
Frequency (Hz)
Magnitude (
dB
)

Chapter 5 Relative Spectral Analysis-RASTA
112
Following are the implementation details of the low pass filter designed using FDATOOL in
MATLAB [9, 10].
% % Generated by MATLAB(R) 7.8 and the Signal Processing Toolbox 6.11. % % Generated on: 12-May-2011 18:25:12 %
% Coefficient Format: Decimal
% Discrete-Time IIR Filter (real) % ------------------------------- % Filter Structure : Direct-Form II, Second-Order Sections % Number of Sections : 2 % Stable : Yes % Linear Phase : No
SOS matrix: 1 0 -1 1 -1.8586755234480816 0.8690982221474296 1 0 -1 1 -0.13519171958723636 0.20489026841573793
Scale Values: 0.49660644391298536 0.49660644391298536
5.5 Objective Evaluation and Results
To test and evaluate performance of RASTA algorithms; the objective measures are
obtained by using test files from NOIZEUS database [11]. Speech enhancement for white noise,
and eight different colored noises at 0dB, 5dB and 10dB SNR level is carried out using two
STSA algorithms: MBSS and MMSE-LSA and using the RASTA filtering algorithm with two
different cases of parameters a and b.
Figures 5.11 to 5.15 illustrate SSNR, WSS, LLR and PESQ score bar chart comparison
of five algorithms (two good performing STSA algorithms and three versions of RASTA
algorithms explained in previous section) with eight different colored noises at 0, 5 and 10dB
SNRs. Also the same comparison is given under white noise. It can be observed that at relatively
high SNR two STSA algorithms are performing well compared to RASTA algorithms. But at the
lower SNRs the RASTA algorithms have performance comparable to STSA algorithms. Also
the performance of RASTA algorithms is consistent in white and colored noise environments.
The modified RASTA algorithm performs well in most noise conditions compared to its original
Chapter 5 Relative Spectral Analysis-RASTA
113
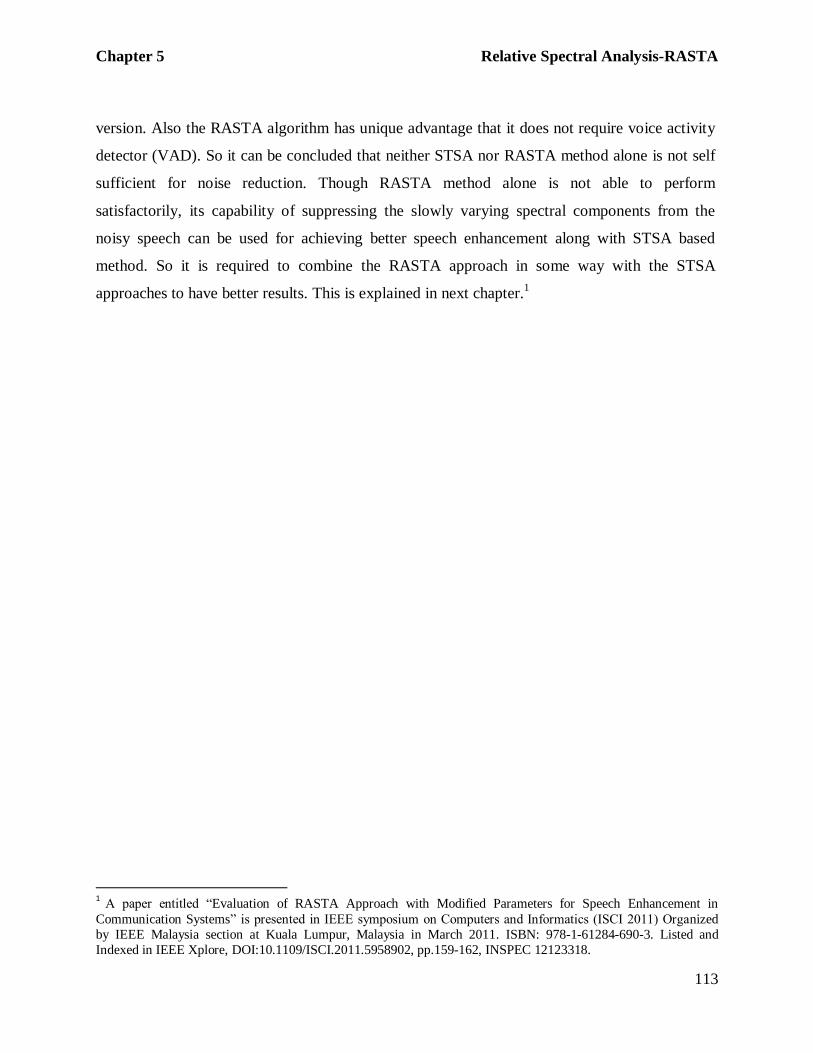
version. Also the RASTA algorithm has unique advantage that it does not require voice activity
detector (VAD). So it can be concluded that neither STSA nor RASTA method alone is not self
sufficient for noise reduction. Though RASTA method alone is not able to perform
satisfactorily, its capability of suppressing the slowly varying spectral components from the
noisy speech can be used for achieving better speech enhancement along with STSA based
method. So it is required to combine the RASTA approach in some way with the STSA
approaches to have better results. This is explained in next chapter.1
1 A paper entitled “Evaluation of RASTA Approach with Modified Parameters for Speech Enhancement in
Communication Systems” is presented in IEEE symposium on Computers and Informatics (ISCI 2011) Organized
by IEEE Malaysia section at Kuala Lumpur, Malaysia in March 2011. ISBN: 978-1-61284-690-3. Listed and
Indexed in IEEE Xplore, DOI:10.1109/ISCI.2011.5958902, pp.159-162, INSPEC 12123318.

Chapter 5 Relative Spectral Analysis-RASTA
114
Fig. 5.11 SSNR comparison of RASTA algorithms over NOIZEUS database

Chapter 5 Relative Spectral Analysis-RASTA
115
Fig. 5.12 WSS comparison of RASTA algorithms over NOIZEUS database

Chapter 5 Relative Spectral Analysis-RASTA
116
Fig. 5.13 LLR comparison of RASTA algorithms over NOIZEUS database

Chapter 5 Relative Spectral Analysis-RASTA
117
Fig. 5.14 PESQ comparison of RASTA algorithms over NOIZEUS database

Chapter 5 Relative Spectral Analysis-RASTA
118
Fig. 5.15 Objective evaluation of RASTA algorithms under white noise conditions
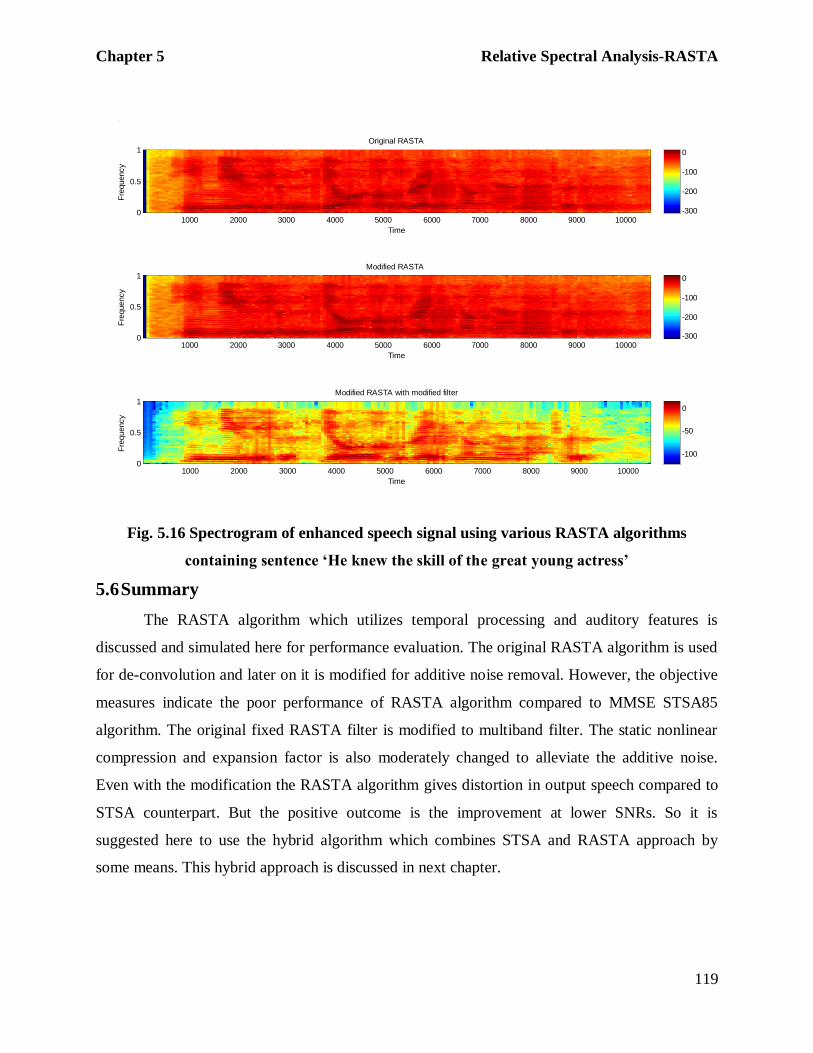
Figure 5.16 also shows the spectrogram of the enhanced speech form 0dB white noise
using various RASTA algorithms. The clean speech signal spectrogram and noisy signal
spectrogram are shown in figure 4.5. The comparison is self explanatory that modified RASTA
with modified filter algorithm is better speech enhancer of the three. Also it can be compared
with spectrogram of enhanced speech by various STSA algorithms as shown in figure 4.6. The
performance of modified RASTA with modified filter algorithm is comparable with the MMSE
LSA (STSA85) and MBSS – the two outstanding STSA algorithms. Also it can be seen that the
speech enhanced by RASTA methods have very high residual noise during the initial portion of
the enhanced speech (Initial 4 to 10 frames). Generally this initial period is assumed to be
silence period and not much more to bother about it. After this period the filters get initialized
and residual noise starts reducing. Like STSA methods RASTA processed speech also generates
musical noise and speech distortion as seen from the spectrograms. So a better performance can
be expected by combining these two different approaches.
Chapter 5 Relative Spectral Analysis-RASTA
119
Fig. 5.16 Spectrogram of enhanced speech signal using various RASTA algorithms
containing sentence ‘He knew the skill of the great young actress’
5.6 Summary
The RASTA algorithm which utilizes temporal processing and auditory features is
discussed and simulated here for performance evaluation. The original RASTA algorithm is used
for de-convolution and later on it is modified for additive noise removal. However, the objective
measures indicate the poor performance of RASTA algorithm compared to MMSE STSA85
algorithm. The original fixed RASTA filter is modified to multiband filter. The static nonlinear
compression and expansion factor is also moderately changed to alleviate the additive noise.
Even with the modification the RASTA algorithm gives distortion in output speech compared to
STSA counterpart. But the positive outcome is the improvement at lower SNRs. So it is
suggested here to use the hybrid algorithm which combines STSA and RASTA approach by
some means. This hybrid approach is discussed in next chapter.
Time
Fre
quency
Original RASTA
1000 2000 3000 4000 5000 6000 7000 8000 9000 100000
0.5
1
Time
Fre
quency
Modified RASTA
1000 2000 3000 4000 5000 6000 7000 8000 9000 100000
0.5
1
Time
Fre
quency
Modified RASTA with modified filter
1000 2000 3000 4000 5000 6000 7000 8000 9000 100000
0.5
1
-100
-50
0
-300
-200
-100
0
-300
-200
-100
0