relative phase noise estimation and mitigation in raman
TRANSCRIPT

This document is downloaded from DR‑NTU (https://dr.ntu.edu.sg)Nanyang Technological University, Singapore.
Relative phase noise estimation and mitigation inRaman amplified coherent opticalcommunication system
Cheng, Jingchi; Tang, Ming; Fu, Songnian; Shum, Perry Ping; Liu, Deming; Xiang, Meng;Feng, Zhenhua; Yu, Dawei
2014
Cheng, J., Tang, M., Fu, S., Shum, P. P., Liu, D., Xiang, M., et al. (2014). Relative phase noiseestimation and mitigation in Raman amplified coherent optical communication system.Optics Express, 22(2), 1257‑1266.
https://hdl.handle.net/10356/102431
https://doi.org/10.1364/OE.22.001257
© 2014 Optical Society of America. This paper was published in Optics Express and is madeavailable as an electronic reprint (preprint) with permission of Optical Society of America.The paper can be found at the following official DOI:[http://dx.doi.org/10.1364/OE.22.001257]. One print or electronic copy may be made forpersonal use only. Systematic or multiple reproduction, distribution to multiple locationsvia electronic or other means, duplication of any material in this paper for a fee or forcommercial purposes, or modification of the content of the paper is prohibited and issubject to penalties under law.
Downloaded on 13 Mar 2022 17:31:10 SGT

Relative phase noise estimation and mitigation in Raman amplified coherent optical
communication system Jingchi Cheng,1,2 Ming Tang,1,2,* Songnian Fu,1,2 Perry Ping Shum,3 Deming Liu,1,2
Meng Xiang,1,2 Zhenhua Feng,1,2 and Dawei Yu1,2 1Wuhan National Laboratory for Optoelectronics, Huazhong University of Science and Technology, Wuhan, 430074,
China 2National Engineering Laboratory for Next Generation Internet Access System, School of Optics and Electronic
Information, Huazhong University of Science and Technology, Wuhan, 430074, China 3Photonics Centre of Excellence, School of Electrical and Electronic Engineering, Nanyang Technological
University, Singapore 637553, Singapore *[email protected]
Abstract: The interplay between the stochastic intensity fluctuation of Raman pump laser and cross-phase modulation (XPM) effect in transmission optical fiber leads to additional phase noise, namely, relative phase noise (RPN) of signal in multi-level modulated coherent optical communication system. Both theoretical analysis and quantitative simulation have been performed to investigate the characteristics and impact of RPN. Being low-pass in nature, RPN is different from XPM induced phase noise in PSK/OOK hybrid system, and has not been considered yet. The noise power of RPN can accumulate incoherently along transmission links. With a proper signal model, we study the impact of RPN to the coherent optical communication system through Monte Carlo simulation. RPN will cause more cycle slips in Viterbi-and-Viterbi (V-V) phase estimation (PE), and the quantitative analysis of cycle slip probability is carried out. When using sliding window V-V without any optimization, the Q factor penalty of RPN on DQPSK signal can be as large as around 5 dB in strong RPN condition. However, it can be reduced by over 3 dB when using an optimal block size or optimal averaging weights.
©2014 Optical Society of America
OCIS codes: (060.1660) Coherent communications; (230.4480) Optical amplifiers.
References and links
1. G. Li, “Recent advances in coherent optical communication,” Adv. Opt. Photonics 1(2), 279–307 (2009). 2. D.-S. Ly-Gagnon, S. Tsukamoto, K. Katoh, and K. Kikuchi, “Coherent detection of optical quadrature phase-
shift keying signals with carrier phase estimation,” J. Lightwave Technol. 24(1), 12–21 (2006). 3. S. Zhang, P. Y. Kam, J. Chen, and C. Yu, “Decision-aided maximum likelihood detection in coherent optical
phase-shift-keying system,” Opt. Express 17(2), 703–715 (2009). 4. T. Tanimura, S. Oda, M. Yuki, H. Zhang, L. Li, Z. Tao, H. Nakashima, T. Hoshida, K. Nakamura, and J. C.
Rasmussen, “Non-linearity tolerance of direct detection and coherent receivers for 43 Gb/s RZ-DQPSK signals with co-propagating 11.1 Gb/s NRZ signals over NZ-DSF,” in Tech. Digest of the Conference on Optical Fiber Communication (2008), paper OTuM4.
5. Z. Tao, W. Yan, S. Oda, T. Hoshida, and J. C. Rasmussen, “A simplified model for nonlinear cross-phase modulation in hybrid optical coherent system,” Opt. Express 17(16), 13860–13868 (2009).
6. L. Li, Z. Tao, S. Oda, T. Tanimura, M. Yuki, T. Hoshida, and J. C. Rasmussen, “Adaptive optimization for digital carrier phase estimation in optical coherent receivers,” in Digest IEEE/LEOS Summer Topical Meetings, Acapulco, Mexico, Jul. 2008, pp. 121–122, paper TuC3.3.
7. L. Li, Z. Tao, L. Liu, W. Yan, S. Oda, T. Hoshida, and J. C. Rasmussen, “XPM tolerant adaptive carrier phase recovery for coherent receiver based on phase noise statistics monitoring,” in Proc. European Conference on Optical Communications (2009), paper P3.16.
8. J. Cheng, M. Tang, S. Fu, P. P. Shum, and D. Liu, “Relative phase noise induced impairment in M-ary phase-shift-keying coherent optical communication system using distributed fiber Raman amplifier,” Opt. Lett. 38(7), 1055–1057 (2013).
9. G. P. Agrawal, Nonlinear Fiber Optics, 3rd ed. (Academic, 2000).
#198555 - $15.00 USD Received 1 Oct 2013; revised 29 Dec 2013; accepted 6 Jan 2014; published 13 Jan 2014(C) 2014 OSA 27 January 2014 | Vol. 22, No. 2 | DOI:10.1364/OE.22.001257 | OPTICS EXPRESS 1257

10. C. R. S. Fludger, V. Handerek, and R. J. Mears, “Pump to signal RIN transfer in Raman fiber amplifiers,” J. Lightwave Technol. 19(8), 1140–1148 (2001).
11. M. G. Taylor, “Phase estimation methods for optical coherent detection using digital signal processing,” J. Lightwave Technol. 27(7), 901–914 (2009).
12. G. Goldfarb and G. Li, “BER estimation of QPSK homodyne detection with carrier phase estimation using digital signal processing,” Opt. Express 14(18), 8043–8053 (2006).
1. Introduction
Demand for large transmission capacity has been increasing exponentially due to the rapid spread of Internet services. The single channel data rate of coherent optical communication systems has been increased to 100 Gb/s and even beyond by employing advanced modulation formats, such as M-ary phase-shift keying (PSK) and M-ary quadrature amplitude modulation (QAM). With the digital signal processing (DSP) technique, linear impairments such as chromatic dispersion (CD) and polarization mode dispersion (PMD) can now be compensated for in the post-signal-processing stage of coherent receiver [1]. Therefore, for multi-level modulated signal at such high bit rate, phase noise has become a major issue. So far, various kinds of DSP-based PE algorithm have been proposed, such as M-th power [2], decision-aided (DA) maximum likelihood (ML) [3] and so forth, to perform phase tracking function in the presence of laser phase noise and additive white Gaussian noise (AWGN). Besides these phase noise, XPM induced phase noise has been reported as one of the major bottlenecks for optical coherent communication systems, especially with PSK/OOK hybrid transmission [4], and a simplified model has been proposed [5]. Optimized PE algorithms have been presented to evaluate the impact of this very kind of phase noise [6,7].
Recently, a different kind of XPM induced phase noise, relative phase noise, has been discovered [8]. It was shown that RPN is caused by intensity fluctuation of pump laser in a Raman amplified system. The noise power of RPN in both co-pumping and counter-pumping configuration has been given by theoretical analysis. However, to the best of our knowledge, no quantitative simulation has been conducted to evaluate RPN induced impairment. In this paper, by properly modeling RPN, we investigate the impact of RPN to the coherent optical communication system using Monte Carlo simulation. RPN induced cycle slip probability for QPSK signal is determined by quantitative analysis. Using two optimized V-V PE (by optimized block size and optimized averaging weights), up to 3 dB Q improvement can be achieved compared with the traditional sliding window V-V algorithm.
2. Relative phase noise and signal model
2.1 Relative phase noise
In coherent optical communication system using multi-level modulated signal where information is modulated on signal’s phase component, it is necessary to assess the complex signal field to explore the effect of pump RIN transfer in coherent system with coupled amplitude equations [9]
2| |2
.p pp p p p
AA i A A
z
αγ
±± ± ±∂
± + =∂
(1)
2 2(2 ) .| | | |2 2
s s s ss s R p s p s
A A gd A i f A A A A
z T
α γ ± ±∂ ∂− + = − +∂ ∂
(2)
where pA and sA are the slowly varying envelopes associated with the pump and signal,
± represents co-pumping and counter-pumping scheme respectively, Rf is the fractional
Raman contribution, 1 1gp gsd v v− −= ± − is the walk-off parameter, gjv is the group velocity, jγ is
the nonlinear parameter with j p= or s . In co-pumping configuration, / gpT t z v= − , while in
counter-pumping configuration, ( ) / gpT t L z v= − − . The walk-off parameter d accounts for the
#198555 - $15.00 USD Received 1 Oct 2013; revised 29 Dec 2013; accepted 6 Jan 2014; published 13 Jan 2014(C) 2014 OSA 27 January 2014 | Vol. 22, No. 2 | DOI:10.1364/OE.22.001257 | OPTICS EXPRESS 1258

group-velocity mismatch between the pump and signal. Since22
s pA A , we thus neglect
the XPM from signal to pump and the self-phase modulation (SPM) of signal. By assuming non-depletion regime of pump power, the above equations could be solved. We define RPN as [8]:
2
2( ) .sRPN fδθ
θ= (3)
where 2δθ is the mean square fluctuation of phase shift induced by pump-signal XPM and
θ is the mean phase shift given by:
0(21
) .p
o
z
s Rp
c p
ePf
α
θ γα
−−= − (4)
0(21
.)p
p
s Rcounter
zL
pp
ePf e
αα
αθ γ − −= − (5)
Using harmonic analysis method, RPN in both co-pumping and counter-pumping configuration can be obtained as follows:
( )
22 2
2 22 2
( ) ( )( ) ( ) .
(2 ) 1 p
ps co p z
p
M z N zRPN f RIN f
fd e α
α
α π −
+= + −
(6)
( )
22 2
2 22 2
( ) ( )( ) ( ) .
(2 ) 1p
ps counter p z
p
M z N zRPN f RIN f
fd eα
α
α π
′ ′+= + −
(7)
where
( ) sin(2 ) 2 cos(2 ) 2 .p z
pM z e fdz fd fdz fdα α π π π π− = + − (8)
( ) 2 sin(2 ) cos(2 ) .p z
p pN z e fd fdz fdzα π π α π α− = − + (9)
( ) sin(2 ) 2 cos(2 ) 2 .p z
pM z e fdz fd fdz fdα α π π π π′ = − + − (10)
( ) 2 sin(2 ) cos(2 ) .p z
p pN z e fd fdz fdzα π π α π α′ = + − (11)
The noise power of RPN is then given by:
2
1
22 2 ( .) ( )RPN RPN st RPN f dfν
νθ θσ = = (12)
where 1ν and 2ν are the lower and upper frequency of the receiver, respectively. In practice, although signal is deteriorated by both intensity noise and phase noise, i.e.,
RIN and RPN, the latter seems to exhibit a greater influence, especially for PSK modulated signal. In a typical 100 km SMF span with 800 mW Raman pump power (i.e., around 22.4 dB Raman on-off gain), 10 mW Raman pump power variation will cause around 25° signal phase variation, while the gain variation is less than 7%. Consequently, for simplicity, we ignore signal RIN in our simulation, so that the impact of RPN is focused on.
Before introducing the signal model, it is reasonable and necessary to further discuss some of the important characteristics of RPN. Firstly, RPN is a stationary Gaussian random process, hence can be modeled as a Gaussian random variable after signal being sampled by analog to digital converter (ADC). This characteristic can be proved from Eqs. (6) and (7), where the
#198555 - $15.00 USD Received 1 Oct 2013; revised 29 Dec 2013; accepted 6 Jan 2014; published 13 Jan 2014(C) 2014 OSA 27 January 2014 | Vol. 22, No. 2 | DOI:10.1364/OE.22.001257 | OPTICS EXPRESS 1259
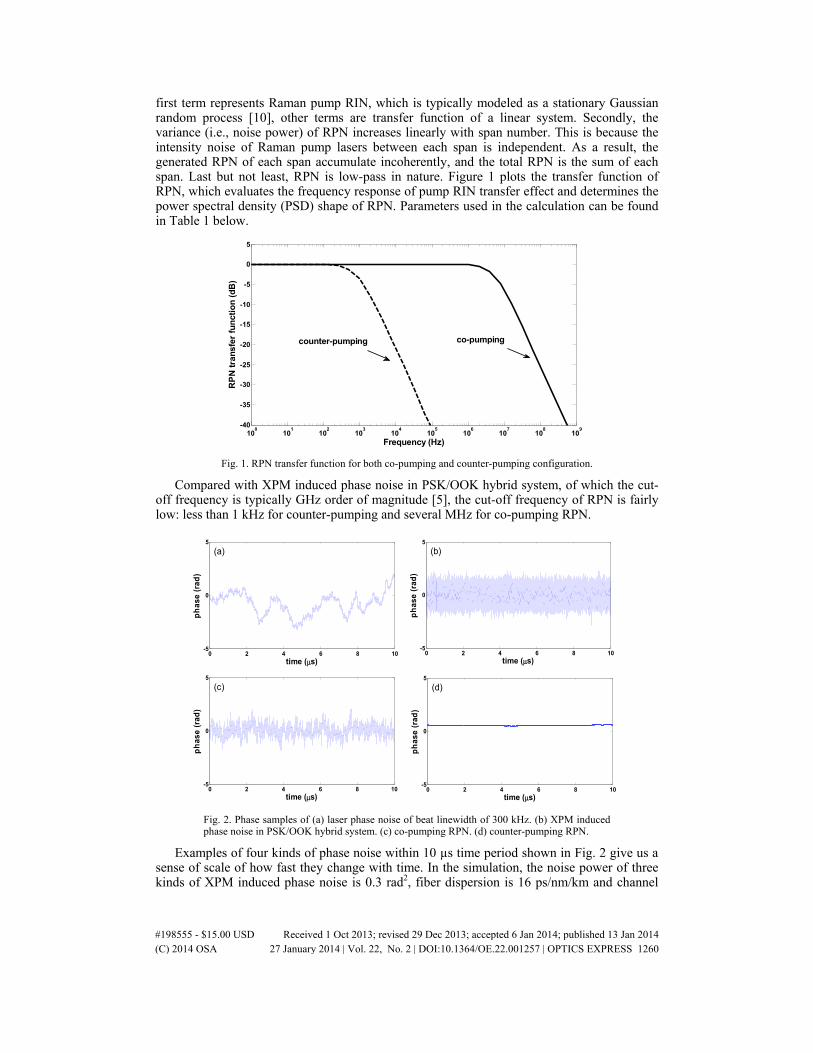
first term represents Raman pump RIN, which is typically modeled as a stationary Gaussian random process [10], other terms are transfer function of a linear system. Secondly, the variance (i.e., noise power) of RPN increases linearly with span number. This is because the intensity noise of Raman pump lasers between each span is independent. As a result, the generated RPN of each span accumulate incoherently, and the total RPN is the sum of each span. Last but not least, RPN is low-pass in nature. Figure 1 plots the transfer function of RPN, which evaluates the frequency response of pump RIN transfer effect and determines the power spectral density (PSD) shape of RPN. Parameters used in the calculation can be found in Table 1 below.
100 101 102 103 104 105 106 107 108 109-40
-35
-30
-25
-20
-15
-10
-5
0
5
Frequency (Hz)
RPN
tran
sfer
func
tion
(dB
)
counter-pumping co-pumping
Fig. 1. RPN transfer function for both co-pumping and counter-pumping configuration.
Compared with XPM induced phase noise in PSK/OOK hybrid system, of which the cut-off frequency is typically GHz order of magnitude [5], the cut-off frequency of RPN is fairly low: less than 1 kHz for counter-pumping and several MHz for co-pumping RPN.
0 2 4 6 8 10-5
0
5
time (μs)
phas
e (r
ad)
(a)
0 2 4 6 8 10-5
0
5
time (μs)
phas
e (r
ad)
(b)
0 2 4 6 8 10-5
0
5
time (μs)
phas
e (r
ad)
(c)
0 2 4 6 8 10-5
0
5
time (μs)
phas
e (r
ad)
(d)
Fig. 2. Phase samples of (a) laser phase noise of beat linewidth of 300 kHz. (b) XPM induced phase noise in PSK/OOK hybrid system. (c) co-pumping RPN. (d) counter-pumping RPN.
Examples of four kinds of phase noise within 10 µs time period shown in Fig. 2 give us a sense of scale of how fast they change with time. In the simulation, the noise power of three kinds of XPM induced phase noise is 0.3 rad2, fiber dispersion is 16 ps/nm/km and channel
#198555 - $15.00 USD Received 1 Oct 2013; revised 29 Dec 2013; accepted 6 Jan 2014; published 13 Jan 2014(C) 2014 OSA 27 January 2014 | Vol. 22, No. 2 | DOI:10.1364/OE.22.001257 | OPTICS EXPRESS 1260
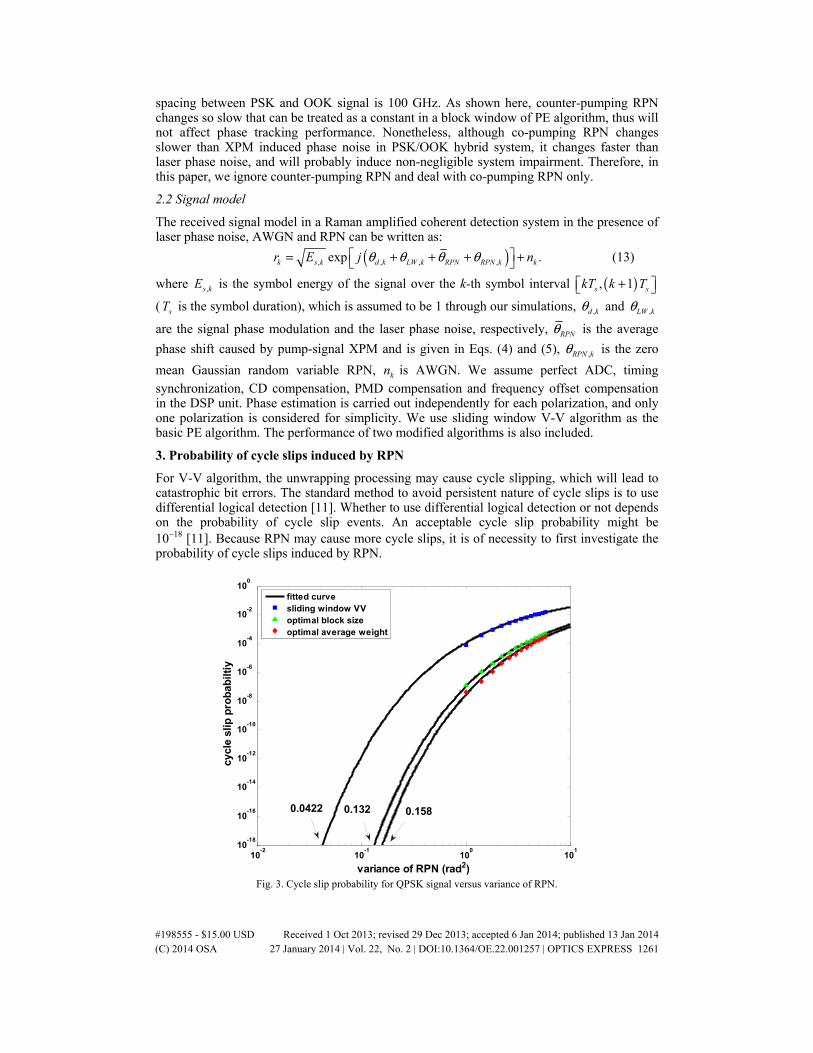
spacing between PSK and OOK signal is 100 GHz. As shown here, counter-pumping RPN changes so slow that can be treated as a constant in a block window of PE algorithm, thus will not affect phase tracking performance. Nonetheless, although co-pumping RPN changes slower than XPM induced phase noise in PSK/OOK hybrid system, it changes faster than laser phase noise, and will probably induce non-negligible system impairment. Therefore, in this paper, we ignore counter-pumping RPN and deal with co-pumping RPN only.
2.2 Signal model
The received signal model in a Raman amplified coherent detection system in the presence of laser phase noise, AWGN and RPN can be written as:
( ), , , ,exp .k s k d k LW k RPN RPN k kr E j nθ θ θ θ = + + + + (13)
where ,s kE is the symbol energy of the signal over the k-th symbol interval ( ), 1s skT k T+
( sT is the symbol duration), which is assumed to be 1 through our simulations, ,d kθ and ,LW kθ
are the signal phase modulation and the laser phase noise, respectively, RPNθ is the average
phase shift caused by pump-signal XPM and is given in Eqs. (4) and (5), ,RPN kθ is the zero
mean Gaussian random variable RPN, kn is AWGN. We assume perfect ADC, timing synchronization, CD compensation, PMD compensation and frequency offset compensation in the DSP unit. Phase estimation is carried out independently for each polarization, and only one polarization is considered for simplicity. We use sliding window V-V algorithm as the basic PE algorithm. The performance of two modified algorithms is also included.
3. Probability of cycle slips induced by RPN
For V-V algorithm, the unwrapping processing may cause cycle slipping, which will lead to catastrophic bit errors. The standard method to avoid persistent nature of cycle slips is to use differential logical detection [11]. Whether to use differential logical detection or not depends on the probability of cycle slip events. An acceptable cycle slip probability might be 10−18 [11]. Because RPN may cause more cycle slips, it is of necessity to first investigate the probability of cycle slips induced by RPN.
10-2 10-1 100 10110-18
10-16
10-14
10-12
10-10
10-8
10-6
10-4
10-2
100
variance of RPN (rad2)
cycl
e sl
ip p
roba
bilti
y
fitted curvesliding window VVoptimal block sizeoptimal average weight
0.1320.0422 0.158
Fig. 3. Cycle slip probability for QPSK signal versus variance of RPN.
#198555 - $15.00 USD Received 1 Oct 2013; revised 29 Dec 2013; accepted 6 Jan 2014; published 13 Jan 2014(C) 2014 OSA 27 January 2014 | Vol. 22, No. 2 | DOI:10.1364/OE.22.001257 | OPTICS EXPRESS 1261
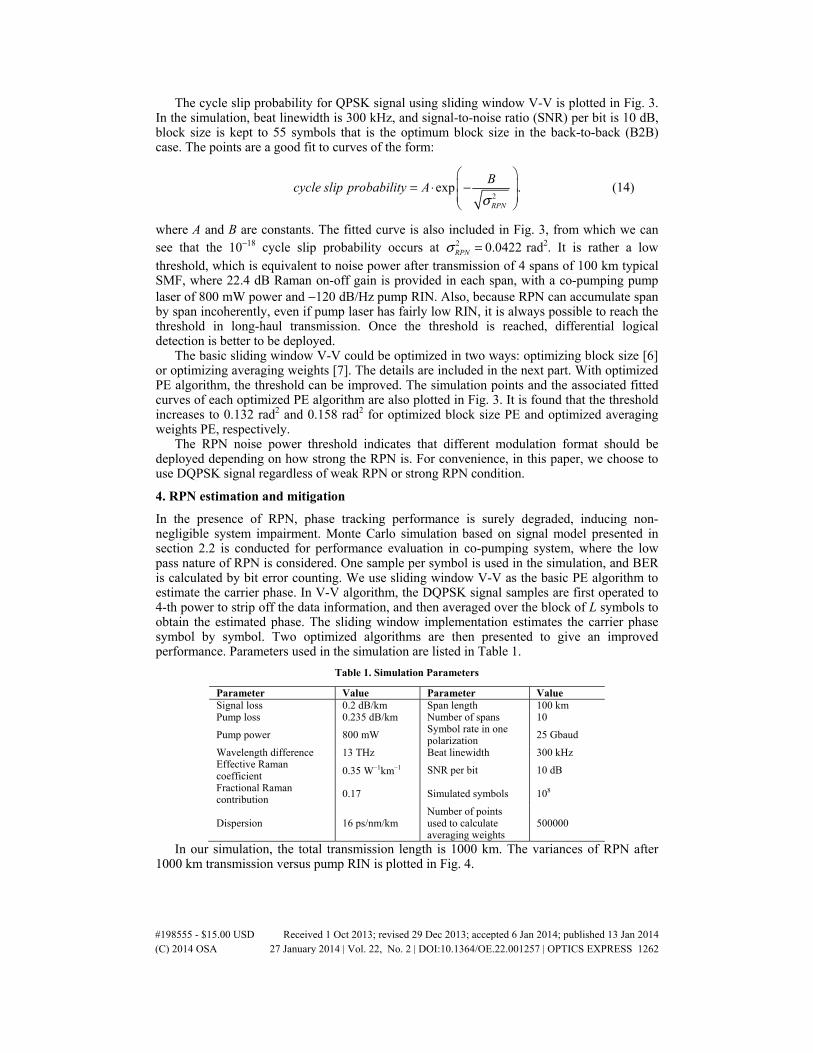
The cycle slip probability for QPSK signal using sliding window V-V is plotted in Fig. 3. In the simulation, beat linewidth is 300 kHz, and signal-to-noise ratio (SNR) per bit is 10 dB, block size is kept to 55 symbols that is the optimum block size in the back-to-back (B2B) case. The points are a good fit to curves of the form:
2
exp .RPN
Bcycle slip probability A
σ
= ⋅ −
(14)
where A and B are constants. The fitted curve is also included in Fig. 3, from which we can see that the 10−18 cycle slip probability occurs at 2 0.0422RPNσ = rad2. It is rather a low threshold, which is equivalent to noise power after transmission of 4 spans of 100 km typical SMF, where 22.4 dB Raman on-off gain is provided in each span, with a co-pumping pump laser of 800 mW power and −120 dB/Hz pump RIN. Also, because RPN can accumulate span by span incoherently, even if pump laser has fairly low RIN, it is always possible to reach the threshold in long-haul transmission. Once the threshold is reached, differential logical detection is better to be deployed.
The basic sliding window V-V could be optimized in two ways: optimizing block size [6] or optimizing averaging weights [7]. The details are included in the next part. With optimized PE algorithm, the threshold can be improved. The simulation points and the associated fitted curves of each optimized PE algorithm are also plotted in Fig. 3. It is found that the threshold increases to 0.132 rad2 and 0.158 rad2 for optimized block size PE and optimized averaging weights PE, respectively.
The RPN noise power threshold indicates that different modulation format should be deployed depending on how strong the RPN is. For convenience, in this paper, we choose to use DQPSK signal regardless of weak RPN or strong RPN condition.
4. RPN estimation and mitigation
In the presence of RPN, phase tracking performance is surely degraded, inducing non-negligible system impairment. Monte Carlo simulation based on signal model presented in section 2.2 is conducted for performance evaluation in co-pumping system, where the low pass nature of RPN is considered. One sample per symbol is used in the simulation, and BER is calculated by bit error counting. We use sliding window V-V as the basic PE algorithm to estimate the carrier phase. In V-V algorithm, the DQPSK signal samples are first operated to 4-th power to strip off the data information, and then averaged over the block of L symbols to obtain the estimated phase. The sliding window implementation estimates the carrier phase symbol by symbol. Two optimized algorithms are then presented to give an improved performance. Parameters used in the simulation are listed in Table 1.
Table 1. Simulation Parameters
Parameter Value Parameter ValueSignal loss 0.2 dB/km Span length 100 kmPump loss 0.235 dB/km Number of spans 10
Pump power 800 mW Symbol rate in one polarization
25 Gbaud
Wavelength difference 13 THz Beat linewidth 300 kHz Effective Raman coefficient 0.35 W−1km−1 SNR per bit 10 dB
Fractional Raman contribution 0.17 Simulated symbols 108
Dispersion 16 ps/nm/km Number of points used to calculate averaging weights
500000
In our simulation, the total transmission length is 1000 km. The variances of RPN after 1000 km transmission versus pump RIN is plotted in Fig. 4.
#198555 - $15.00 USD Received 1 Oct 2013; revised 29 Dec 2013; accepted 6 Jan 2014; published 13 Jan 2014(C) 2014 OSA 27 January 2014 | Vol. 22, No. 2 | DOI:10.1364/OE.22.001257 | OPTICS EXPRESS 1262

-140 -135 -130 -125 -120 -115 -110 -1050
0.5
1
1.5
2
2.5
3
3.5
RIN of pump (dB/Hz)
varia
nce
of R
PN (r
ad2 )
Fig. 4. Variances of RPN versus pump RIN.
To give an intuitive understanding of RPN induced degradation, we plotted signal constellation in Fig. 5, using non-optimized sliding window V-V.
-1.5 -1 -0.5 0 0.5 1 1.5-1.5
-1
-0.5
0
0.5
1
1.5
I
Q
(a)
-1.5 -1 -0.5 0 0.5 1 1.5-1.5
-1
-0.5
0
0.5
1
1.5
I
Q(b)
Fig. 5. Signal constellation (a) back-to-back (b) with RPN, pump RIN is −105 dB/Hz.
We can see that, in the presence of RPN, the four points in the constellation are no longer circular, but stretched in angular direction. However, the performance can be improved by optimizing sliding window V-V in two ways: optimizing block size or optimizing averaging weights. For block size optimization, in principle, a larger block size can better smooth out the AWGN noise, but reduces the phase tracking capability [12]. For this reason, in dealing with RPN, a smaller block size is expected. Besides optimizing block size, we could also optimize the averaging weights of symbols within an average window in V-V PE. This approach provides the best estimation of carrier phase in the sense of minimum mean-square error (MMSE). With the prior information of carrier statistics, optimal averaging weights can be calculated using the equation presented in [7]. In consideration of RPN, supposing the symbols from –L to L are used to estimate the carrier phase at time 0, the optimal averaging weights ( )h m are:
( )( )
( )
( ) ( ) ( )( ) ( ) ( )
( ) ( ) ( )
( )( )
( )
10 1 2
1 1 0 2 1 1.
2 2 1 0
h L R R R L R L
h L R R R L R L
h L R L R L R R L
−′ ′ ′− ′ ′ ′− + − − = × ′ ′ ′− −
(15)
#198555 - $15.00 USD Received 1 Oct 2013; revised 29 Dec 2013; accepted 6 Jan 2014; published 13 Jan 2014(C) 2014 OSA 27 January 2014 | Vol. 22, No. 2 | DOI:10.1364/OE.22.001257 | OPTICS EXPRESS 1263

( ) ( ){ }2exp 16 1 .RPNR m mσ ρ= − (16)
( ) ( ){ } ( )2 2exp 16 1 16 .RPN nR m m mσ ρ σ δ′ = − + (17)
where 2RPNσ is the variance of RPN, ( )mρ is the normalized autocorrelation of RPN, 2
nσ is
the variance of AWGN and ( )mδ is the delta function.
We plotted optimal block size and optimal averaging weights in Figs. 6 and 7.
-140 -135 -130 -125 -120 -115 -110 -1050
10
20
30
40
50
60
70
RIN of pump (dB/Hz)
optim
al b
lock
siz
e
Fig. 6. Optimal block size versus Raman pump RIN.
-30 -20 -10 0 10 20 300
0.1
0.2
0.3
0.4
0.5
0.6
0.7
0.8
0.9
1
tap index
norm
aliz
ed w
eigh
t
-135 dB/Hz-120 dB/Hz-105 dB/Hz
Fig. 7. Optimal averaging weights.
As can be seen from Fig. 6, the optimal block size indeed decreases with the increase of pump RIN (or RPN noise power). And from Fig. 7, we find that the averaging weights difference between central symbol and neighboring symbols becomes larger in stronger RPN condition. The signal constellation at the same pump RIN value as in Fig. 5(b) using two optimized PE algorithms is plotted in Fig. 8. The corresponding optimal values can be found in Figs. 6 and 7.
#198555 - $15.00 USD Received 1 Oct 2013; revised 29 Dec 2013; accepted 6 Jan 2014; published 13 Jan 2014(C) 2014 OSA 27 January 2014 | Vol. 22, No. 2 | DOI:10.1364/OE.22.001257 | OPTICS EXPRESS 1264

-1.5 -1 -0.5 0 0.5 1 1.5-1.5
-1
-0.5
0
0.5
1
1.5
I
Q
(a)
-1.5 -1 -0.5 0 0.5 1 1.5-1.5
-1
-0.5
0
0.5
1
1.5
I
Q
(b)
Fig. 8. Signal constellation using (a) optimal block size (b) optimal weights.
The signal constellation quality of both modified PE algorithms improves greatly compared with non-optimized PE. The associated Q factor curve demonstrates this quantitatively as shown in Fig. 9.
-140 -135 -130 -125 -120 -115 -110 -1056
7
8
9
10
11
12
13
14
RIN of pump (dB/Hz)
Q fa
ctor
(dB
)
back to backsliding window VVoptimal block sizeoptimal average weight
Fig. 9. Q factor performance versus pump RIN.
In the above figure, the baseline Q in B2B is around 12.6 dB. Nearly 5 dB Q penalty is induced when pump RIN is as high as −105 dB/Hz, by using traditional non-optimized sliding window V-V algorithm. It is this intolerable huge penalty that makes it essential to adopt optimized PE to mitigate RPN induced impact in strong RPN condition. As is shown in Fig. 9, both of the two optimized PE provide significant performance improvement. Over 3 dB Q improvement is achieved at −105 dB/Hz pump RIN value. The corresponding Q penalty is reduced to only around 1 dB. In addition, we can find that optimal averaging weights PE outperforms optimal block size PE slightly. This is due to the fact that optimal averaging weights PE works under MMSE criterion, thereby giving the theoretically optimum performance.
5. Conclusion
In Raman amplified coherent optical communication system, the unavoidable power fluctuation of Raman pump will bring out relative phase noise to a multi-level modulated signal through pump-signal XPM effect. By properly modeling, the impact of RPN is investigated through Monte Carlo simulation. The result shows that, although RPN generated in counter-pumping Raman amplifier can be ignored due to its very low cut-off frequency, RPN in co-pumping configuration will introduce non-negligible impairment, hence the design of distributed Raman amplifier in coherent optical communication system should be careful.
#198555 - $15.00 USD Received 1 Oct 2013; revised 29 Dec 2013; accepted 6 Jan 2014; published 13 Jan 2014(C) 2014 OSA 27 January 2014 | Vol. 22, No. 2 | DOI:10.1364/OE.22.001257 | OPTICS EXPRESS 1265

The study of the occurrence of cycle slips induced by RPN indicates that if RPN noise power reaches the threshold of acceptable cycle slip probability, differential logical detection should then be deployed. In strong RPN condition, Q factor penalty of RPN on DQPSK signal can be as large as around 5 dB using non-optimized sliding window V-V. The degradation can be mitigated if we make optimizations on sliding window V-V. With optimized block size or averaging weights, more than 3 dB Q improvement can be achieved. The significant performance enhancement shows the importance of optimizing PE according to the RPN statistics in Raman amplified coherent optical communication system.
Acknowledgments
The work presented in this paper is supported by the National Basic Research Program of China (973 Program: 2010CB328305), the 863 High Technology Plan of China (2012AA011301 and 2013AA013402), and the National Natural Science Foundation of China (NSFC) under Grant No. 61107087 and 61331010.
#198555 - $15.00 USD Received 1 Oct 2013; revised 29 Dec 2013; accepted 6 Jan 2014; published 13 Jan 2014(C) 2014 OSA 27 January 2014 | Vol. 22, No. 2 | DOI:10.1364/OE.22.001257 | OPTICS EXPRESS 1266