relative impact of culture, strategy and capability …
TRANSCRIPT

The relative impact of culture, strategic orientation and capability on new service development performance
Article (Accepted Version)
http://sro.sussex.ac.uk
Storey, Chris and Hughes, Mathew (2013) The relative impact of culture, strategic orientation and capability on new service development performance. European Journal of Marketing, 47 (5/6). pp. 833-856. ISSN 0309-0566
This version is available from Sussex Research Online: http://sro.sussex.ac.uk/id/eprint/56169/
This document is made available in accordance with publisher policies and may differ from the published version or from the version of record. If you wish to cite this item you are advised to consult the publisher’s version. Please see the URL above for details on accessing the published version.
Copyright and reuse: Sussex Research Online is a digital repository of the research output of the University.
Copyright and all moral rights to the version of the paper presented here belong to the individual author(s) and/or other copyright owners. To the extent reasonable and practicable, the material made available in SRO has been checked for eligibility before being made available.
Copies of full text items generally can be reproduced, displayed or performed and given to third parties in any format or medium for personal research or study, educational, or not-for-profit purposes without prior permission or charge, provided that the authors, title and full bibliographic details are credited, a hyperlink and/or URL is given for the original metadata page and the content is not changed in any way.
1
THE RELATIVE IMPACT OF CULTURE, STRATEGIC ORIENTATION AND
CAPABILITY ON NEW SERVICE DEVELOPMENT PERFORMANCE
Dr. Chris Storey
Cass Business School
City University, London
106 Bunhill Row London, England EC1Y 8TZ, United Kingdom
Tel: +44 (0)20 7040 8728; Fax: +44 (0)20 7040 8328
Dr. Matthew Hughes
Nottingham University Business School
University of Nottingham
Jubilee Campus, Wollaton Road, Nottingham, NG8 1BB, United Kingdom
Tel.: +44 (0)115 8467747; Fax: +44 (0)115 8466650.
This is the pre-publication version of: Storey C. and Hughes, M. (2013), “The Relative Impact of
Culture, Strategic Orientation and Capability on New Service Development Performance”,
European Journal of Marketing, 47(5), 833-856.
2
ABSTRACT
Purpose: This research attempts to understand the operant resources required for
new service development (NSD). It aims to construct a more intricate understanding
of how operant resources interact to drive NSD. Specifically, it looks at the impact of
culture, strategic orientation and NSD capability for number of new services, the
success rate of new services and the resulting financial contribution by NSD to
overall firm performance.
Design/methodology/approach: To investigate these relationships, data was
collected from 105 leading UK-based service firms via a key informant survey.
Regression analysis was employed to test the model presented.
Findings: Analysis reveals that a different culture (entrepreneurial culture) is needed
to drive the number of new services from that required for a higher success rate
(learning culture). A NSD capability has an important role supporting both of these
aspects of NSD performance. The quantity and quality of NSD go on affect the
financial contribution made by NSD. A firm’s strategic orientation is also found to
directly affect contribution. NSD performance is further enabled by the appropriate
alignment of culture, capability and strategic orientation.
Research limitations/implications: The results demonstrate that existing research
only partially explain NSD performance. The impact of culture, capability and
strategic orientation is contingent on how performance is measured. Understanding
how different operant resources interweave to deliver NSD will facilitate more
informed decision-making leading to the effective use of organizational resources.

3
Practical implications: The results show that there are different pathways to NSD
performance depending on existing organizational conditions. Firms with an
entrepreneurial culture should employ a Prospector orientation, whereas firms with a
learning culture benefit from an Analyzer orientation. Defenders need to build on
existing capabilities.
Originality/value: To date no study has assessed the relative effect of culture,
strategic orientation and capability on NSD performance. The complex contingency
model presented here offers a timely contribution to the theory base underpinning the
development of operant resources for NSD.
Keywords: New service development, culture, capability, strategic orientation,
operant resources.

4
THE RELATIVE IMPACT OF CULTURE, STRATEGIC ORIENTATION AND
CAPABILITY ON NEW SERVICE DEVELOPMENT PERFORMANCE
1. INTRODUCTION
Whilst there is a growing body of important research into the factors that separate
successful new services from unsuccessful ones, there is a lack of firm level research
(Harmancioglu, Droge and Calantone, 2009). In particular, there is little research into
the conditions that service firms need to have in place to undertake new service
development (NSD) in the first place (Froehle and Roth, 2007; Johne and Storey,
1998). A singular or accidental success does not imply a NSD capability; rather this
requires a reliable practice over time (Schreyögg and Kliesch-Eberl, 2007). In
contrast to the existing prescriptive research on NSD, this research seeks to
understand the factors that drive the extent to which service firms engage in NSD
and “to discredit the view that new services happen as a result of intuition, flair and
luck” (Menor, Tatikonda and Sampson, 2002, p.135). NSD performance is viewed as
a confluence of the number of new services, the new service success rate, and the
financial contribution of NSD to overall firm performance (Barczak et al., 2009; Griffin
and Page, 1996; Storey and Kelly, 2001). NSD is brought about by the organizational
context of the service firm. It is a firm’s ‘operant’ resources that create the requisite
environment to motivate and enable NSD to take place (Chandy, Prabhu and Antia,
2003; Madhavaram and Hunt, 2008). Three key operant resources put forward in
innovation theory are a firm’s organizational culture (Barney, 1986; de Brentani,
Kleinschmidt and Salomo, 2010), its strategic orientation (Paladino, 2009), and its
capabilities (Day, 1994). However, these factors are likely to produce different NSD
outcomes.

5
A culture reinforces to employees how they might seek to generate new service
offerings that are meaningful to the marketplace, efficiently and effectively. The
values and behavioural norms reinforced by an organizational culture filter what NSD
activities are perceived as being desirable (De Long and Fahey, 2000). However, it is
important to distinguish between internally and externally focused cultures
(Deshpande et al., 1993). The framework presented here distinguishes between an
externally focused entrepreneurial culture and an internally focused learning culture.
Both drive organizational performance via NSD (Hult, Hurley and Knight, 2004). But
an entrepreneurial culture seeks to change an organization’s relationship with its
environment whilst a learning culture seeks to understand this relationship (Hakala,
2010). Therefore, it is expected that they will influence NSD activities in different
ways.
While culture captures the environment in which NSD activities take place, the firm’s
strategic orientation then defines the nature of these activities. Miles and Snow
(1978) propose three strategic orientations—Prospectors, Analyzers and
Defenders—that engage in NSD (McKee et al., 1989; Barczak et al., 2009) but will
differ in terms of the innovativeness of new services introduced and the range of
markets to which they aspire. Empirical studies suggest these types all outperform a
fourth type—Reactors (Conant, Mokwa and Varadarajan, 1990; Miles and Snow,
1978).
It is perhaps an organization’s NSD capability that crystallize how and why firms can
differ in their ability to enact NSD activities. Capabilities are complex bundles of skills
and accumulated knowledge that enable firms to coordinate activities and make use
of their assets to shape complex advantages (, 1990, 1994b). A firm’s NSD capability
captures its expertise and excellence (or otherwise) at developing new services. It is

6
brought about by time and investment building tacit and explicit knowledge about
NSD and its accompanying processes (Storey and Kahn, 2010).
Prior research separately stresses the importance of organizational culture (Barney,
1986; Camerer and Vepsalainen, 1988; Deshpande, Farley and Webster, 1993), the
strategic orientation of the firm (McKee, Varadarajan and Pride, 1989; Miles and
Snow, 1978) and a NSD capability (Kusunoki, Nonaka and Nagata, 1998). However,
few studies examine their relative effect on organizational outcomes (Song et al.,
2007), and no study assesses the relative effect of culture, strategic orientation and
capability on NSD performance. Thus this research attends to an important gap
identified in the literature (Hakala, 2010).
The framework put forward in this paper proposes that three NSD performance
dimensions can be manipulated independently by relevant operant resources.
Specifically, an entrepreneurial culture drives the number of new services developed.
Its bias towards creative, flexible market-leading actions fused with an efficient NSD
capability result in rapid idea generation. The success rate is driven by better NSD
decisions made on the back of a learning culture twinned with existing organizational
intelligence. And it is the strategic orientation that drives NSD’s contribution to the
firm’s financial performance as strategies closer to the Prospector end seek to lead
markets and secure positional advantage (Miles and Snow, 1978; Olson et al., 2005).
The findings of this research have important implications for the performance
measures firms employ and the decisions firms must make to achieve their NSD
goals. Improved understanding in this area will facilitate more informed decision-
making leading to the effective use of organizational resources.

7
An important final contribution to theory offered by this research is that it addresses
our understanding of the interactions among operant resources. It is argued that
alternative configurations of operant resources may be used to achieve the same
objectives (Hakala, 2010). Hult, Ketchen and Arrfelt (2007) argue that neither culture
nor capabilities by itself is a sufficient condition to achieve superior performance.
Strategic orientation characterizes the decisions taken to align the firm with its
environment (Daft, 1995; Venkatraman, 1989), and in turn will direct how firms exploit
emerging opportunities in the market for NSD. This study constructs a more intricate
understanding of NSD activity than has previously been presented. This research
offers a timely contribution to the theory base underpinning operant resources,
specifically NSD—a base that at present is far from comprehensive (Madhavaram
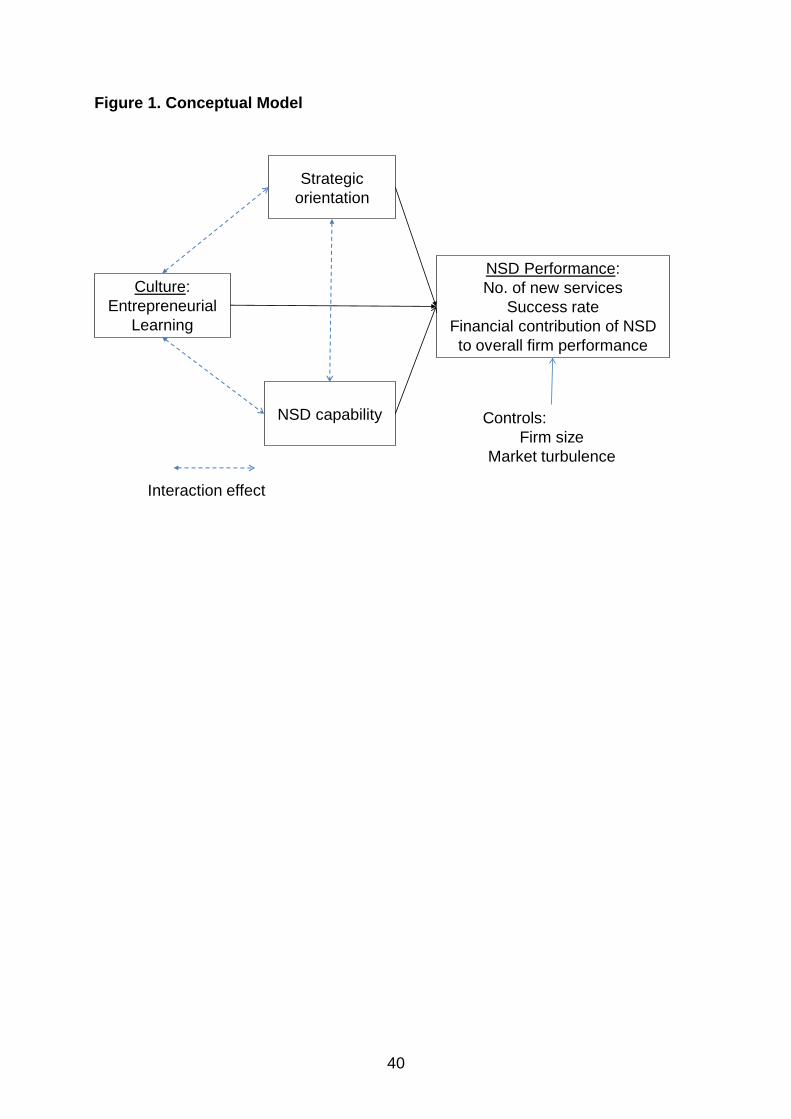
and Hunt, 2008). Figure 1 summarizes the conceptual model and is discussed in
detail below.
[Figure 1 about here]
2. ORGANIZATIONAL CULTURE
A business culture that is focused externally to the firm has been shown to
outperform those dominated by internal cohesiveness or by rules (Deshpande and
Farley, 2004; Deshpande et al., 1993). However, Paladino (2009) found that firms
that emphasized internal resources were more innovative than those with an external
orientation. To explain this contradictory evidence it is important to look at how
different cultures affect the behavioural environment of the firm and hence affect
NSD performance in different ways (de Brentani et al., 2010; Spanjol, Qualls and
Rosa, 2011).

8
An externally-oriented entrepreneurial culture focuses attention on creating value
from the opportunities that are to be discovered outside the firm’s boundaries. This is
a dynamic, aggressive culture which places an emphasis on NSD by being adaptable
to emerging market conditions and taking risks (Deshpande and Farley, 2004). In
firms with an entrepreneurial culture, top management encourage the firm to
proactively pursue new market opportunities (Lumpkin and Dess, 1996; Miller, 1983).
Thus an entrepreneurial culture leads to greater market search behaviour and in turn
to more new service ideas (Spanjol et al., 2011). Entrepreneurially-oriented service
firms have been found to offer a wider range of innovative services (Jambulingam,
Kathuria and Doucette, 2005).
An internally-oriented learning culture focuses on value creation from and around the
established, proven and long-standing activities of the firm. A learning culture is the
degree to which the firm sees knowing the causes and effects of its actions as the
key to competitive advantage (Baker and Sinkula, 1999; Dickson, 1996). A long-term
competitive advantage is maintained by a mechanism of continuous improvement. A
firm that is oriented towards learning will seek to capture knowledge about past and
current projects, and will use this knowledge to benefit its NSD programme. This
stops mistakes being repeated, thereby enabling a greater success rate for new
services.
Whilst an entrepreneurial culture and a learning culture are both key drivers of
innovativeness and organizational performance (Calantone, Cavusgil and Zhao,
2002; Deshpande and Farley, 2004; Hughes and Morgan, 2007; Hult et al., 2004),
the modus operandi each one embeds and reinforces are different (Hughes, Hughes
and Morgan, 2007). Specifically it is proposed that an entrepreneurial culture will spur
a wave of opportunity identification and risk taking that will generate many new

9
services. As such the creation of new services may persist even in the face of their
possible failure hence we do not hypothesise a link with success rate. Whereas the
more methodical nature of a learning culture will decelerate the innovating process to
focus instead on generating a handful of successful new services. While learning
benefits the quality of new service ideas the capacity to introduce new ideas is not
directly affected (Hurley and Hult, 1998; Spanjol et al., 2011).
Thus:
H1: Entrepreneurial culture is positively related to the number of new services.
H2: Learning culture is positively related to the new service success rate.
3. STRATEGIC ORIENTATION
The firm’s strategic orientation guides how it bundles and leverages organizational
resources in pursuit of emerging market opportunities and the exploitation of existing
markets (Menor and Roth, 2007; Hughes and Morgan, 2008).
The Miles and Snow (1978) typology is widely employed in strategy and marketing
research. Empirical studies suggest Reactors are outperformed by the other types
however there is no consensus on the best strategic orientation (Conant, Mokwa and
Varadarajan, 1990; Desarbo et al., 2005). Reactors tend to respond to environmental
pressures with minimal changes and do so only when required to (Song et al., 2007).
Prospectors develop new services to lead markets (Miles and Snow, 1978), tend to
innovate on technological grounds, seeking out market opportunities with a view to
acting in advance of competitors (Song et al., 2007; Hughes and Morgan, 2008). This

10
allows Prospectors to steal a march towards securing positional advantage in the
market place resulting in outperforming other orientations (Olson et al., 2005).
Analyzers tend to monitor market and competitor trends to develop value-enhancing
new services (Hughes and Morgan, 2008; Song et al., 2007). As such, Analyzers
tend to be more customer-oriented when entering markets with new services and
their bias is towards out-thinking the competition instead of outmanoeuvring them.
Defenders develop new services to enhance their links with customers and channels
(Song et al., 2007). They are less avid followers of change and are more risk averse
than the previous two types (Miles and Snow, 1978). Defenders focus on protecting
competitive advantages by incrementally improving quality and/or reducing cost
(Slater and Narver, 1993).
Relative to Reactors, each strategic orientation is expected to have a positive
financial contribution of NSD to overall firm performance. McKee et al. (1989) found
that the four types constitute a continuum with Prospector firms generally the most
engaged in NSD and Reactors the least. Orientations closer to the Prospector end
reflect greater performance in terms of sales and profits from NSDs than other
strategic orientations (Barczak et al., 2009; Paladino, 2009). In addition as
Prospectors aspire to more markets they may develop more new services (Miles and
Snow, 1978; Jambulingam, Kathuria, and Doucette, 2005). However research has
shown no difference in reported success rates between orientations (Kelly and
Storey, 2000) demonstrating the need to accommodate multiple measures of NSD
performance. Thus:

11
H3: A Prospector (Reactor) orientation will have the greatest (least) effect on
(a) the number of new services and (b) the financial contribution of NSD to
overall firm performance.
4. NSD CAPABILITY
A firm’s NSD capability captures its proficiency and excellence (or otherwise) at
developing new services. It reflects its knowledge and expertise in this area, and its
set of differentiated skills, complementary assets and routines for NSD (Barney,
1991). Yet one of the main barriers to innovation in service firms is a lack of expertise
in the skills and processes required to undertake NSD (Kelly and Storey, 2000).
Experience and expertise should speed up execution, reduce development costs,
decrease mistakes and lead to superior solutions (Kyriakopoulos and de Ruyter,
2004; Montoya-Weiss and Calantone, 1994). A NSD capability should increase the
efficiency and effectiveness of a firm’s innovation activities, driving the quantity and
quality of NSD in turn:
H4: NSD capability is positively related to (a) the number of new services and
(b) the new service success rate.
5. INTERACTIONS AMONG STRATEGIC ORIENTATION, CULTURE AND NSD
CAPABILITY
Strategy and culture should be aligned. Moorman (1995) suggests that organizational
processes are more likely to be effective when strategic orientation supports culture
than when they are not congruent. The effective implementation of a strategy is
influenced by the guiding beliefs of the organization (Arogyaswamy and Byles, 1987).
Similarly, a strong culture without a strategy to focus it results in highly enthusiastic

12
and committed individuals pulling the firm toward different directions (Wang, 2008).
Miles and Snow (1978) posit that any strategic orientation can be performance
enhancing when the firm deploys appropriate capabilities to support implementation.
It follows that a NSD capability will be deployed differently and its effects will likely
vary depending on the organizational culture that informs decision-making and on the
strategic orientation of the firm (Hughes and Morgan, 2008; Song et al., 2007).
5.1. Alignment of Strategic orientation and Culture
Wang (2008) found being a Prospector to have a positive interactive effect with
entrepreneurial culture but did not improve the impact of learning on firm
performance. Prospectors tend to innovate on technological grounds seeking out
new service markets in doing so. These often involve radical departures from the
firms’ existing products, administrative procedures, mental models and dominant
logic (Miles and Snow, 1978; Wang 2008). This implies that Prospectors will perform
better if they have an entrepreneurial culture in place.
Analyzers in contrast are often depicted as imitators. They aim to overtake
prospectors by making better decisions when developing new services, tailoring them
closer to customer needs (Hughes and Morgan, 2008; Song et al., 2007). Analyzers
rely on superior market knowledge and continuous improvement hence the need for
a learning culture. An entrepreneurial focus on experimentation and risk taking is
likely to cause tension for Analyzers.
We propose that a firm’s strategic orientation will moderate the culture-performance
link. Where culture and strategic orientation are aligned—an entrepreneurial culture
for Prospectors and a learning culture for Analyzers—performance will increase.
Building upon the previous hypotheses, we argue that:

13
H5: A Prospector orientation positively moderates the relationship between an
entrepreneurial culture and (a) the number of new services and (b) the
financial contribution of NSD to overall firm performance.
H6: An Analyzer orientation positively moderates the relationship between a
learning culture and (a) the new service success rate, and (b) the financial
contribution of NSD to overall firm performance.
5.2. Alignment of Culture and NSD Capability
Organizational culture informs the actions of individuals within the firm, but
capabilities within the firm coordinate these actions around bundles of accumulated
skills and knowledge (Day, 1990). An entrepreneurially-oriented firm spots market
opportunities and generates new service ideas. However, when a strong NSD
capability is present, the throughput of new service ideas to end service outcomes
should increase because the firm will be more proficient at converting entrepreneurial
insights into service outcomes. Put simply, NSD capability enables the transformation
and allocation of complex resource bundles to better convert opportunities into
meaningful outcomes (Sirmon, Hitt and Ireland, 2007). Thus:
H7: NSD capability positively moderates the relationship between
entrepreneurial culture and the number of new services.
A capability is framed by past commitments and investments (Day, 1994), and deep
levels of knowledge and experience can act as a perceptual filter hindering the firm’s
ability to assimilate new knowledge (Leonard-Barton 1992), thereby creating biases
in the results of learning processes (Holcomb et al., 2009). A strong NSD capability
may therefore constrain the learning efforts of the firm around what is believed to be
‘excellence’ (Day, 1994). It is on this basis that firms run the risk of developing core

14
rigidities (Atuahene-Gima, 2005). In addition, a learning culture will in part result in
the discarding of existing knowledge, rather than building on it, limiting the impact of
the existing capability. Therefore:
H8: NSD capability negatively moderates the relationship between learning
culture and the new service success rate.
5.3. Alignment of NSD Capability and Strategic Orientation
An effective NSD capability increases the firm’s efficiency and capacity in developing
new services. It is Prospectors that are best placed to take advantage of this.
Prospectors rely on rapid NSD for success and aspire to enter multiple new markets.
Prospectors compete by responding rapidly to early signals of change in the
competitive environment and service marketplace, devoting significant resources to
generating unique knowledge assets that can be deployed in a timely manner when
taking new services to market (Zheng et al., 2010).
NSD capability should also make the firm more effective by reducing new service
failures. For Analyzers this is crucial. Unlike Prospectors, their new services are
unlikely to be radical. Instead they rely on effective service implementation to
maintain presence in multiple markets (Conant et al., 1990; Hughes and Morgan,
2008; Song et al., 2007). Prospectors tolerate failure whereas Analyzers tend to treat
failures as unaffordable.
Defenders are effective at being efficient in their niche (Slater and Narver, 1993;
Song et al., 2007). They focus on existing markets and improving business
processes within their familiar domain. Defenders protect competitive advantages by
15
incrementally improving quality, margins, and/or reducing cost. Existing capabilities
are important for Defenders, improving the contribution NSD makes to the firm.
Each strategic orientation would appear to benefit from a strong NSD capability
inasmuch as this capability augments the effective conversion of strategy into
competitive advantage. Thus:
H9a: NSD capability positively moderates the relationship between a
Prospector orientation and the number of new services.
H9b: NSD capability positively moderates the relationship between an
Analyzer orientation and the new service success rate.
H9c: NSD capability positively moderates the relationship between a Defender
orientation and the financial contribution of NSD to overall firm performance.
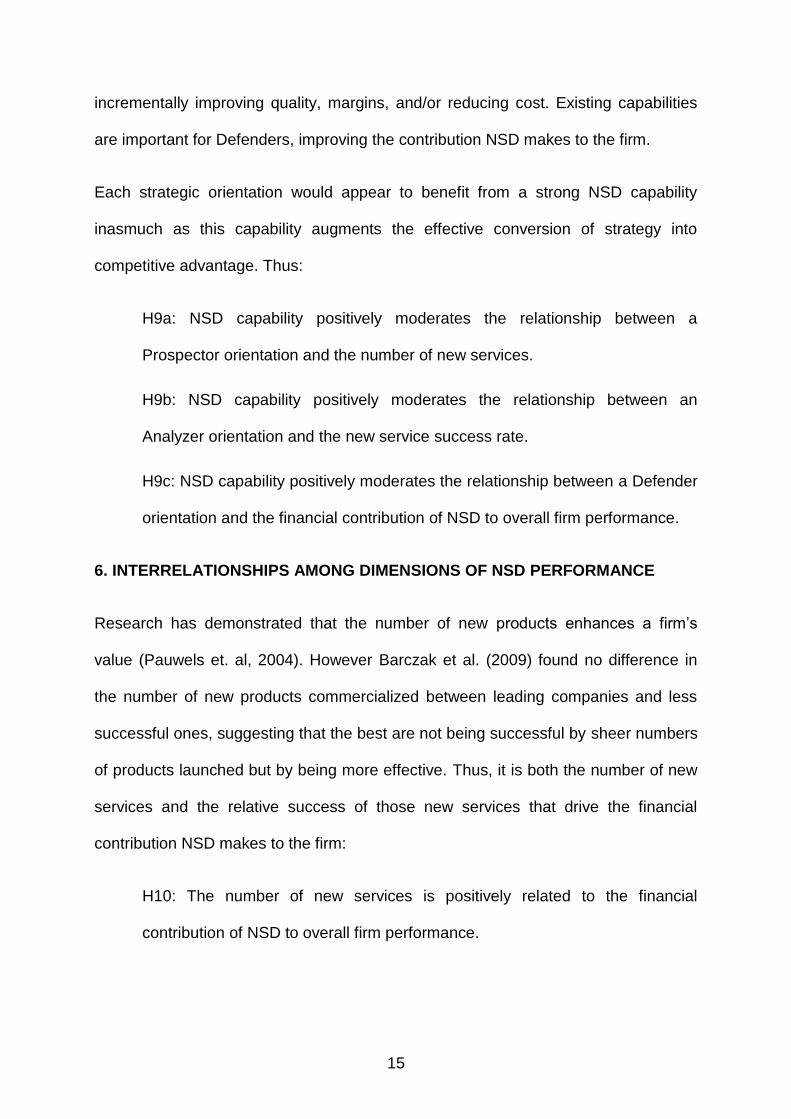
6. INTERRELATIONSHIPS AMONG DIMENSIONS OF NSD PERFORMANCE
Research has demonstrated that the number of new products enhances a firm’s
value (Pauwels et. al, 2004). However Barczak et al. (2009) found no difference in
the number of new products commercialized between leading companies and less
successful ones, suggesting that the best are not being successful by sheer numbers
of products launched but by being more effective. Thus, it is both the number of new
services and the relative success of those new services that drive the financial
contribution NSD makes to the firm:
H10: The number of new services is positively related to the financial
contribution of NSD to overall firm performance.

16
H11: The new service success rate is positively related to the financial
contribution of NSD to overall firm performance.
Notwithstanding these hypotheses, a key factor behind NSD success is resource
availability. Often firms have too many projects and not enough resources (Cooper et
al., 1994). If firms undertake too many projects, they spread development resources
too thinly across projects and do a less-than-proficient job on each. Thus, it is
proposed that the number of new services will have an adverse effect on the firm’s
success rate:
H12: The number of new services is negatively related to the new service
success rate.
7. METHOD
7.1. Measurement Model
A questionnaire survey was designed to test the conceptual model. The
questionnaire consisted of measures of NSD performance, operant resources and
controls. Established scales were used throughout. The development of the
questionnaire was pretested with a small number of marketing directors to ensure
face validity and to determine if respondents possessed sufficient knowledge to
answer. The final version of the questionnaire was also pretested with a number of
senior managers within a leading consultancy firm and a panel of expert academics
to ensure content validity.
NSD Performance: The firm’s NSD activity over the last three years was measured
on a number of dimensions identified in previous research (Barczak et al., 2009,
Griffin and Page, 1996): The number of new services launched; the percentage of

17
new services launched classified as successful; and the financial contribution of NSD
to overall firm performance (the percentage of sales and of profits attributable to new
services launched in the last three years). Quantitative rather than perceptual
measures were employed to reduce common method bias (Frambach, Prabhu and
Verhallen, 2003).
NSD Capability: This is the accumulation of facts, insights, experiences, and lessons
learned from previous and emergent service development activities. The firm’s NSD
capability was operationalized by measuring the amount of knowledge, the degree of
experience and the investment made in NSD (Hult et al., 2007; Moorman and Miner,
1997).
Learning Culture: The learning culture of the firm represents the degree to which the
organisation values knowing the causes and effects of its actions. This was
measured using a scale where learning is seen as a necessity, underpins the values
of the company and viewed as key to competitive advantage. This scale has been
widely employed (Baker and Sinkula, 1999; Calantone et al., 2002; Sinkula, Baker
and Noordewier, 1997).
Entrepreneurial Culture: An entrepreneurial culture is one that values new
opportunities. It was measured by the firm’s commitment to innovation, being
dynamic, risk-tolerant and entrepreneurial, and possessing a leader who reflects
these values (Deshpande and Farley, 2004; Deshpande et al., 1993). This scale has
been employed in a wide range of contextual situations including technological
adoption (Srinivason et al., 2002), supply chain management (Braunscheidel, Suresh
and Boisnier, 2010) and product development (Moorman, 1995).

18
Strategic Orientation: Respondents were asked to identify their strategic orientation
in terms of the four Miles and Snow (1978) typologies, which have been found to be
valid across industries (Hambrick, 2003; Manion and Cherion, 2009). A self-typing
approach used in previous studies was adopted (McKee et al., 1989; Wang, 2008).
Controls: Two controls were included—firm size and market turbulence. Firm size
can have a direct effect on the number of new services introduced because larger
firms operate in more markets, have more resources and are able to develop more
new services. Firm size was measured on a five-point scale based on turnover.
Market turbulence affects the pace of change and thus might influence the level of
NSD (Calantone, Harmancioglu and Droge, 2010). Turbulence was measured based
on a scale from similar studies of product and service development (Atuahene-Gima,
2005)
7.2. Sample
A sample of 385 service businesses was identified from the Times Top 1000 UK-
based firms. These were the leading service firms from the financial services,
travel/transportation, retail, and ICT sectors, based on number of employees. The
senior executive having directorial responsibility for NSD was identified by contacting
each firm. These respondents were chosen because of their organizational
knowledge and access to relevant information. Literature suggests such people are
suitable respondents (Bello, Katsikeas and Robson, 2010). A total of 105 completed
questionnaires were returned, which equated to a 27.3% response rate. Of these
firms, 30 classified themselves as Prospectors, 44 as Analyzers, 20 as Defenders
and 11 as Reactors. These proportions are in line with those reported in previous
research (Song et al., 2007), giving support to the representativeness of the sample.

19
The data was tested for sector, respondent position and firm size differences
between respondents and non-respondents (Bello, Katsikeas and Robson, 2010).
Differences between early and late respondents for all constructs in the model were
tested for. No systematic differences were identified suggesting non-response bias
was not a significant issue (Armstrong and Overton 1977).
8. ANALYSIS AND RESULTS
8.1. NSD Activity
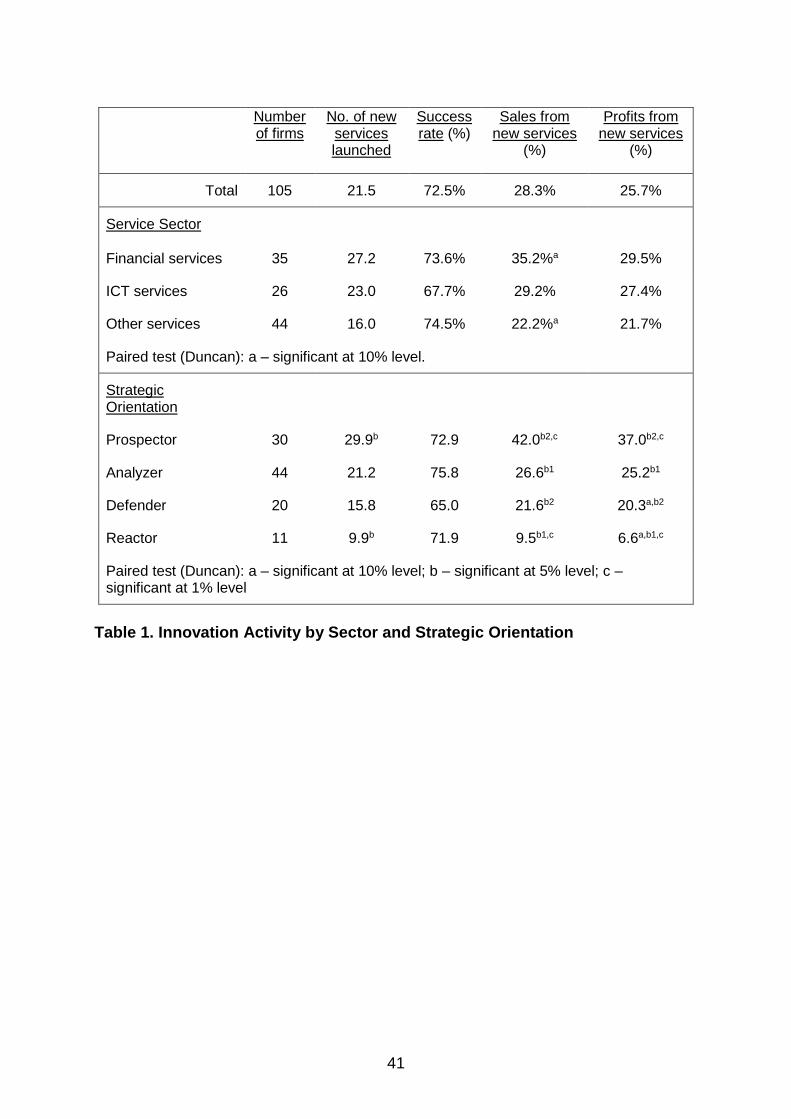
Table 1 shows the mean scores for the measures of NSD activity and the drivers of
this activity. The success rate (72%) is in line with previous research on NSD (Storey
and Kelly, 2001). New services account for around one-quarter of total profits or
sales. A recent study that looked predominately at new products found a success
rate of 59% but a contribution to profits of 28% (Barczak et al., 2009). As these data
are in line with previous studies this give confidence in the generalizability of the
results from the relatively small sample.
The results are broken down by sector. Analysis shows a lack of significance
between the sectors. Table 1 also shows the results by strategic orientation. As
expected Prospectors are the most innovative, Reactors the least, based on number
of new services and contribution supporting hypothesis H3. Analyzers have the
highest success rate although the differences are not significant.
[Table 1 about here]
8.2. Measurement Model

20
Results show the reliability, convergent validity and discriminant validity of the
measurement model to be acceptable. Exploratory factor analysis revealed that the
items load cleanly on their intended constructs and provide evidence of discriminant
validity. The first factor accounted for 37% of the total variance (76%). As no one
factor accounted for the majority of the variance, common method bias does not
appear to be a significant problem (Podsakoff and Organ, 1986).
Confirmatory factor analysis (CFA) was carried out to further test the validity of the
model. The results of the CFA are shown in the Appendix. The model exhibited an
acceptable fit with the data (2 = 138.0, df = 80, p = 0.00, CFI = 0.93, TLI = 0.91,
RMSEA = 0.08). The standardized loadings were all above 0.5 providing evidence for
convergent validity. For each factor, its composite reliability (CR) was calculated.
These ranged from 0.72 to 0.92, well above acceptable levels (Hair et al., 2007).
Discriminant validity was further examined by calculating the average variance
extracted (AVE) for each construct and comparing to the highest shared variance
(HSV) with the other factors in the model. The AVE was always greater than the HSV
supporting the validity of the model (Fornell and Larcker 1981). Correlations between
all constructs and variables are shown in Table 2.
[Table 2 about here]
8.3. Regression Analysis: Main Effects
[Table 3 about here]
As the measurement model is deemed acceptable, multiple regression analysis was
used to test the effects of the independent variables on NSD activity. The results are
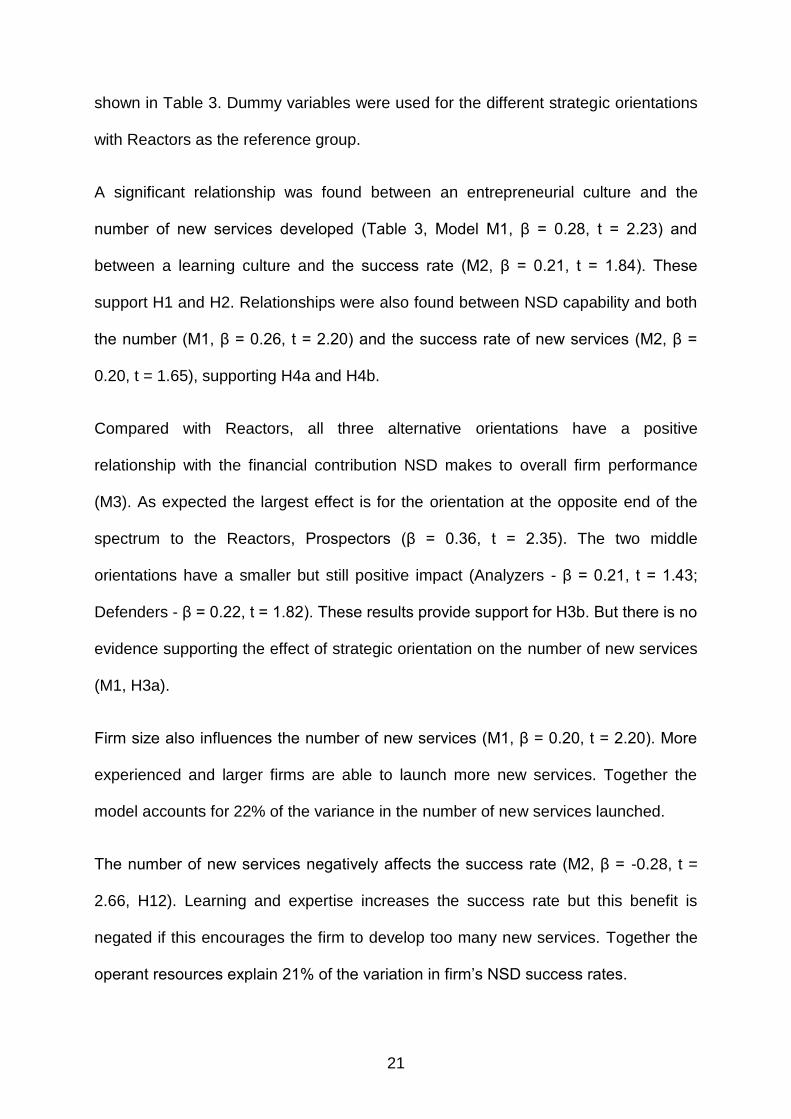
21
shown in Table 3. Dummy variables were used for the different strategic orientations
with Reactors as the reference group.
A significant relationship was found between an entrepreneurial culture and the
number of new services developed (Table 3, Model M1, β = 0.28, t = 2.23) and
between a learning culture and the success rate (M2, β = 0.21, t = 1.84). These
support H1 and H2. Relationships were also found between NSD capability and both
the number (M1, β = 0.26, t = 2.20) and the success rate of new services (M2, β =
0.20, t = 1.65), supporting H4a and H4b.
Compared with Reactors, all three alternative orientations have a positive
relationship with the financial contribution NSD makes to overall firm performance
(M3). As expected the largest effect is for the orientation at the opposite end of the
spectrum to the Reactors, Prospectors (β = 0.36, t = 2.35). The two middle
orientations have a smaller but still positive impact (Analyzers - β = 0.21, t = 1.43;
Defenders - β = 0.22, t = 1.82). These results provide support for H3b. But there is no
evidence supporting the effect of strategic orientation on the number of new services
(M1, H3a).
Firm size also influences the number of new services (M1, β = 0.20, t = 2.20). More
experienced and larger firms are able to launch more new services. Together the
model accounts for 22% of the variance in the number of new services launched.
The number of new services negatively affects the success rate (M2, β = -0.28, t =
2.66, H12). Learning and expertise increases the success rate but this benefit is
negated if this encourages the firm to develop too many new services. Together the
operant resources explain 21% of the variation in firm’s NSD success rates.

22
The number of new services (M3, β = 0.48, t = 5.27) and the success rate (M3, β =
0.25, t = 2.87) have strong positive effects on contribution, supporting H10 and H11.
In addition turbulence has a small positive effect (M3, β = 0.12 t = 1.38). Together the
antecedents account for 44% of the variance in financial contribution of NSD to
overall firm performance.
8.4. Interaction Effects
[Table 4 about here]
The hypotheses specify that the impact of the individual antecedents on NSD
performance is contingent upon their fit with other elements of the model. To assess
this, a series of moderated regression analyses were undertaken with the relevant
interaction terms. A residual centering approach was employed in accordance with
the recommendations of Lance (1988), who indicates residual centering as having
the advantage of minimizing multicollinearity between the interaction term and its
component variables. The residual centering technique involves regressing the
interaction term on its two components via ordinary least squares and then using the
residuals of this regression in the structural model instead of the interaction term. We
employed a hierarchical approach. Taking a model (M1 to M3) from Table 3, an
interaction term was added and the model respecified. The results are shown in
Table 4. To avoid Type 2 errors, this process was carried out for each interaction
term separately and repeated across the three dependent variables captured in
models M1 to M3. Given the relatively limited sample size and the potential for
multicollinearity when several interaction terms that share underlying constructs are
used, the potential for dismissing theoretically sound interactions is high (Aguinis,
1995). This problem is confounded when considering multiple moderators
simultaneously. As an aim of the research was to identify significant interactions

23
amongst operant resources, separate models were therefore analysed to combat the
aforementioned risk (Aguinis, 1995; Filippini, Salmaso and Tessarolo, 2004).
First, there is evidence supporting the fit between strategic orientation and culture.
No interaction was found between an entrepreneurial culture and Prospector
orientation on the number of new services launched (Table 4, Model M1a). However
there is a significant impact on the financial contribution (M3a). R2 increases from
0.435 to 0.466 (t = 2.32) partially supporting H5. The interaction term between
learning culture and Analyzers on the success rate is significant (M2b). R2 increases
from 0.207 to 0.230 (t = 1.68) partially supporting H6 (there is no effect on
contribution, M3b). To help understand the interaction effects the significant
relationships were graphed: Firm’s fail to benefit from an entrepreneurial culture if
they do not employ a Prospector orientation (Figure 2a); Analyzers benefit from
having a learning culture (Figure 2b).
[Figure 2 about here]
The interactions between NSD capability and culture are as expected. An
entrepreneurial culture and NSD capability increases the number of new services
launched (M1b). R2 increases from 0.223 to 0.252 (t = 1.91). An entrepreneurial
culture will have more of an impact when a firm has an existing NSD capability
(Figure 2c). This supports H7. Second, NSD capability and a learning culture have a
significant interaction effect on the success rate (M2b). R2 increases from 0.207 to
0.226 (t = 1.54). At low levels of existing capabilities learning is more important than
at high levels (Figure 2d), supporting H8.
[Figure 3 about here]

24
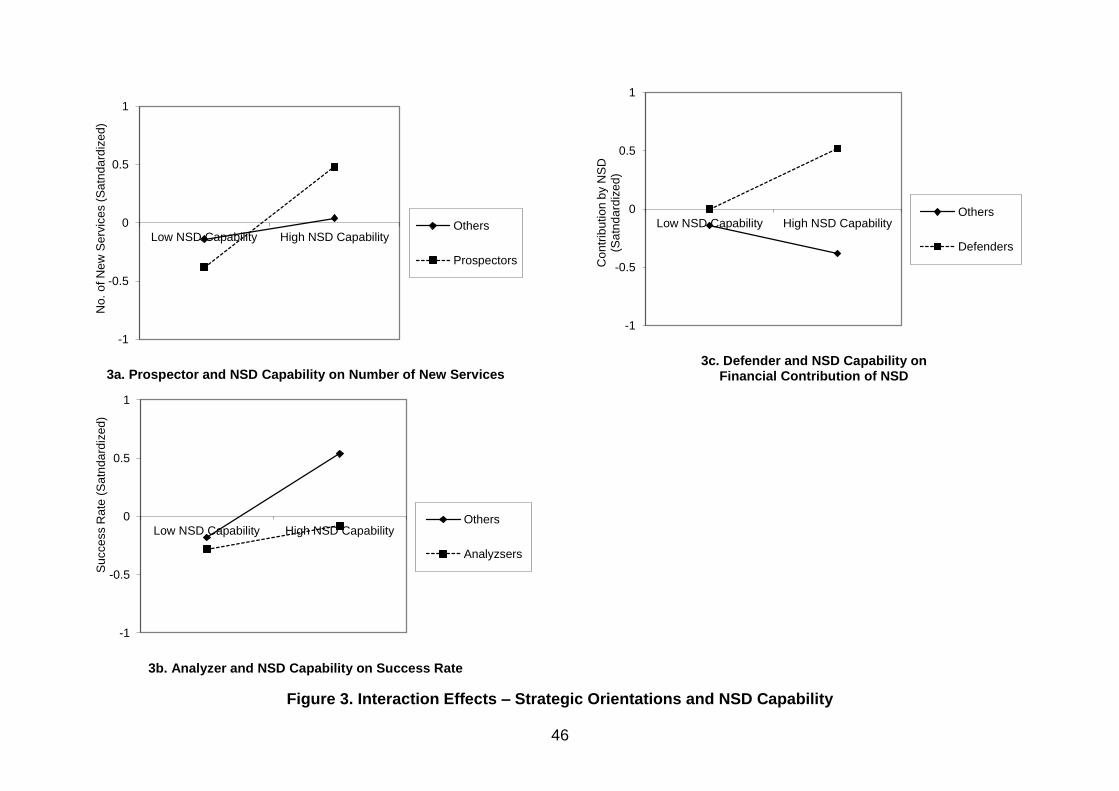
The results also show interaction effects between strategic orientation and NSD
capability. There is a positive interaction effect between Prospectors and NSD
capability on the number of new services (M1c). R2 increases from 0.223 to 0.250 (t
= 1.85). And there is a positive interaction effect between Defenders and NSD
capability on financial contribution (M3c). R2 increases from 0.435 to 0.468 (t = 2.39).
This gives strong support for H9a and H9c. The results are also shown in Figures 3a
and 3c. Unexpectedly the interaction between Analyzers and NSD capability on the
success rate is negative (M2c). R2 increases from 0.207 to 0.221 (t = 1.32).
Analyzers do not get the benefit that other firms do from a high NSD capability
(Figure 3b).
9. DISCUSSION AND CONTRIBUTIONS
This work makes a number of important contributions to the theory base
underpinning NSD. The first contribution is the presentation of an intricate model of
service innovation that disentangles the effects of different operant resources on
distinctive dimensions of NSD performance. This study disaggregates NSD
performance into the number of new services developed, the success rate and the
financial contribution of NSD to overall firm performance, each requiring different
operant resources. Thus previous research provides only a partial explanation of the
drivers of NSD activity. An entrepreneurial culture drives the number of new services
developed; a learning culture drives the success rate. An existing NSD capability
plays an important role in supporting both these aspects of NSD performance, but it
is the firm’s strategic orientation that drives NSD’s financial contribution. Compared to
Reactors all three orientations show performance benefits but it is being a Prospector
that is the key to growth.
25
A second contribution is the finding that the number of new services deleteriously
affects the success rate of new services. This is the first time this relationship has
been evidenced. One reason for this can likely be found in theories of organization
slack (Voss, Sirdeshmukh and Voss, 2008). Developing a greater number of new
services is resource-intensive leaving fewer resources for their effective
commercialization. A second reason can be found in the flaw inherent in
entrepreneurial orientation (Hughes et al., 2007). Entrepreneurial orientation can self-
reinforce a culture of increased opportunity identification, novel idea generation and
escalated risk-taking that can lead to higher numbers of failures. This suggests that
management may be more effective in managing their NSD activities by a priori
selecting their set of success measures based on their organization’s conditions.
The study shows how a conceptualization of NSD performance that fails to account
for its multiple dimensions is flawed. We found no direct effect from culture or NSD
capability on the financial contribution made by NSD to overall firm performance.
The third contribution then is the discovery that NSD capability moderates the
relationships between culture and performance shedding light on the core rigidity
problem. Past research proposes that existing knowledge in the form of a powerful
capability might reduce innovation due to the core rigidity problem (Leonard-Barton,
1992; Subramaniam and Youndt, 2005). The lack of a direct relationship between
NSD capability and contribution may be a symptom of this problem.
This study shows that the core rigidity problem is much more intricate than initially
apparent. First, NSD capability positively moderates the relationship between
entrepreneurial culture and the number of new services developed. Thus, a
synergistic relationship exists between the entrepreneurship of the firm and its NSD
26
capability such that together they increase the number of services generated. In this
sense, there is augmentation of the innovation core of the firm.
On the other hand, NSD capability negatively moderates the relationship between
learning culture and the success rate of NSD. It is this relationship that begins to
capture the core rigidity problem. At low levels of capabilities, learning has a large
impact on success. However the benefit from learning is reduced as the knowledge
and expertise of the firm increases. Existing, powerful capabilities define how
individuals in the firm believe the NSD process is meant to be performed. Intelligence
generated via learning may be suppressed by past expertise. The innovation core of
the firm then becomes more rigid to this past body of expertise as the NSD capability
is reinforced but not redeveloped. These findings show capabilities can augment and
undermine organizational initiatives adding a timely contribution to the recent body of
knowledge on how operant resources develop (Madhavaram and Hunt, 2008).
A final contribution is to further our understanding of the fit between strategic
orientation and organizational conditions. Evidence suggests Prospectors perform
better with an entrepreneurial culture and Analysers with a learning culture.
Conversely a misaligned culture can damage performance. For example an
entrepreneurial climate focusing on exploring new opportunities, taking risks and
embracing change produces egregious misfit with defensive, reactive or even
analyser orientations. Without the correct focus, entrepreneurial efforts are thinned
without reaping performance benefits.
This has important implications for managers. If senior management perceive the
need for an innovative strategy, for competitive or market reasons, but the
organization lacks an entrepreneurial culture, management has a dilemma. Does it
27
press ahead and risk poor performance or does it ignore the strategic imperative? It
is certainly easier to choose a less innovative strategy than to change culture.
Moreover, the culture may override the articulated strategic orientation, derailing
management plans. It may be preferable to adopt a more modest strategy, even at
the expense of missed opportunity, while investing time and effort gradually changing
the culture of the organization.
The correct strategic orientation also reinforces the effect of NSD capability on
performance. A high NSD capability enabled Prospectors to develop significantly
more new services. At low levels of capability the innovative new services being
developed by Prospectors may run into trouble and delays, thereby limiting the
capacity for further NSD. An NSD capability also benefits Defenders. A defensive
orientation focused on protecting existing competitive advantages can build on
existing capabilities as well.
We expected that Analyzers would benefit from a NSD capability to boost their
success rate. However it was the other firms that received this benefit. Analyzers
have the highest success rate, although the differences are not significant. It seems
that increasing a success rate past a certain point may be problematic. It is possible
that as success rates rise then firms’ expectations also rise thus limiting the increase
in the success rate (i.e., NSD projects that in the past would have been seen as
being successful may now be viewed as marginal at best and even as failures). How
managers define success and what influences this definition is an area for further
study. However it remains that strategy must be formulated based on the
interpretation of organizational conditions.

28
Findings suggest different pathways to NSD. It is apparent that not one of the
cultures is superior to the other as both cultures work in different ways. An
entrepreneurial culture aligned with a prospector orientation drives the number of
new services developed and hence the financial contribution of NSD to overall firm
performance. However the number of new services constrains the success rate.
Therefore there is a second path to NSD-driven growth. This is via a higher success
rate driven by an Analyzer orientation coupled with a learning culture. Which path
firms should choose depends on existing capabilities. One may conjecture an
evolutionary sequence as firms grow and change in their competitive environments.
At low levels of NSD capability a culture oriented towards learning may be preferable.
Over time a learning culture will help build the firm’s NSD capability. At high levels of
NSD capability an entrepreneurial culture can take better advantage of this capability
than a learning culture. However, in time, a culture geared towards seeking change
and novelty will breakdown the usefulness of existing knowledge (Carlile and
Rebentisch, 2003).
10. LIMITATIONS AND FUTURE RESEARCH
This study contains some limitations. First, this study is cross-sectional and thus no
inference on causation over time is possible. The causal mechanisms put forward in
the study (culture, strategic orientation, NSD capability and NSD prowess) are ones
that take time to form and thus their origins and evolution are of interest to scholars.
Future studies may wish to trace how different operant resources form, evolve and
impact on each other. Second, the sample consisted of relatively successful firms
from across multiple sectors in the Times Top 1000 UK-based firms. A larger and
more varied sample including smaller and less successful firms would enable further
empirical evaluation of the relationships contained in this study.
29
Several directions for future research emerge from this study. The findings suggest
that to increase NSD performance, top management must devise and manage an
environment where different operant resources come together in different but
mutually synergistic ways according to the dimension of performance. To date
however, few if any studies have sought to disentangle this problem. Further work in
this area may require more intricate measures of the operant resources than
presented in this research. For example, the scale employed to capture
entrepreneurial culture might not capture the full intricacies of its components. An
alternative conceptualisation of entrepreneurial culture comprised of sub-scales of
risk-taking, proactiveness and innovativeness could enable a richer and more robust
understanding of how entrepreneurial culture influences NSD because these
individual components can influence performance differently (Hakala, 2010).
A related problem is that firms should look to strike a balance between the quantity
and quality of their new services. The key issue in both instances therefore is how to
balance conflicting cultures and strategies. Recent developments in the field of
organizational ambidexterity (Judge and Blocker, 2008; Raisch and Birkinshaw,
2008) may enable marketing and innovation scholars to make new and fruitful theory
developments to understand how competing demands can be managed as part of
the NSD process.

30
REFERENCES
Aguinis, H. (1995). Statistical power problems with moderated multiple regression in
management research. Journal of Management, 21(6), 1141-1158.
Armstrong, J. and Overton, T. S. (1977). Estimating nonresponse bias in mail
surveys. Journal of Marketing Research, 14(3), 396-402.
Arogyaswamy, B., and Byles, C.M. (1987). Organizational culture: Internal and
external fits. Journal of Management, 13(4), 647-659
Atuahene-Gima, K. (2005). Resolving the capability–rigidity paradox in new product
innovation. Journal of Marketing, 69(4), 61-83.
Baker, W.E., and Sinkula, J.M. (1999). The synergistic effect of market orientation
and learning orientation on organizational performance. Journal of the Academy of
Marketing Science, 27(4), 411–427.
Barczak, G., Griffin, A., and Kahn, K.B. (2009). Trends and drivers of success in NPD
practices: results of the 2003 PDMA best practices study. Journal of Product
Innovation Management, 26(1), 3-23.
Barney, J. (1986). Organizational culture: Can it be a source of sustained competitive
advantage? Academy of Management Review, 11, 656–665.
Barney, J. (1991). Firm resources and sustained competitive advantage. Journal of
Management, 17(1), 99-121.
Bello, D.C., Katsikeas, C.S., and Robson, M.J. (2010). Does accommodating a self-
serving partner in an international marketing alliance pay off?. Journal of
Marketing, 74(6), 77-93.
Braunscheidel, M.J., Suresh, N.C. and Boisnier, A. D. (2010). Investigating the
impact of organizational culture on supply chain integration. Human Resource
Management, 49(5), 883-911.

31
Calantone, R.J., Harmancioglu, N., and Droge, C. (2010). Inconclusive innovation
'returns': A meta-analysis of research on innovation in new product development.
Journal of Product Innovation Management, 27(7), 1065-1081
Calantone, R.J., Cavusgil, S.T., and Zhao, Y. (2002). Learning orientation, firm
innovation capability, and firm performance. Industrial Marketing Management,
31(6), 515-25.
Camerer, C., and Vepsalainen A. (1988). The economic efficiency of corporate
culture. Strategic Management Journal, 9(Summer), 115-126.
Carlile, P.R., and Rebentisch, E.S. (2003). Into the black box: The knowledge
transformation cycle. Management Science, 49(9), 1180-1195.
Chandy, R.K., Prabhu, J.C., and Antia, K.D. (2003). What will the future bring?
Technology expectations, dominance, and radical product innovation. Journal of
Marketing, 66(3), 1-18.
Conant, J.S., Mokwa, M.P., and Varadarajan, P.R. (1990). Strategic types, distinctive
marketing competencies and organizational performance: A multiple-measures-
based study. Strategic Management Journal, 11, 365-383.
Cooper, R.G., Easingwood C.J., Edgett S., Kleinschmidt E., and Storey C. (1994).
What distinguishes the top performing new products in financial services, Journal
of Product Innovation Management, 11(4), 281-299.
Daft, R.L. (1995). Organizational Theory and Design. St. Paul: West Publishing.
Day, G.S. (1990). Market Driven Strategy: Processes for Creating Value. New York:
Free Press.
Day, G.S. (1994). The capabilities of market-driven organizations. Journal of
Marketing, 58(1), 37-52.

32
de Brentani, U., Kleinschmidt, E.J., and Salomo, S. (2010). Success in global new
product development: impact of strategy and the behavioral environment of the
firm. Journal of Product Innovation Management, 27(2), 143-160.
De Long, D.W., and Fahey, L. (2000). Diagnosing cultural barriers to knowledge
management. Academy of Management Executive, 14(4),113-127.
Desarbo, W.S., Di Benedetto, C.A.., Song, M., and Sinha, I. (2005). Revisiting the
Miles and Snow strategic framework: Uncovering interrelationships between
strategic types, capabilities, environmental uncertainty, and firm performance.
Strategic Management Journal, 26(1), 47-74.
Deshpande, R., and Farley, J. (2004). Organisational culture, market orientation,
innovativeness and firm performance. International Journal of Research in
Marketing, 21, 3-22.
Deshpande, R., Farley, J. and Webster, F. (1993). Corporate culture, customer
orientation, and innovativeness in Japanese firms: A quadrad analysis. Journal of
Marketing, 57, 23-37.
Dickson, P.R. (1996). The static and dynamic mechanics of competition: A comment
on Hunt and Morgan’s comparative advantage theory. Journal of Marketing, 60(4),
102-106.
Filippini, R., Salmaso, L. and Tessarolo, P. (2004). Product development time
performance: Investigating the effect of interactions between drivers. Journal of
Product Innovation Management, 21(3), 199-214.
Fornell, C., and Larcker, D. (1981). Evaluating structural equation models with
unobservable variables and measurement error. Journal of Marketing Research,
18, 39-50.

33
Frambach, R.T., Prabhu, J., and Verhallen, T.M.M. (2003). The influence of business
strategy on new product activity: The role of market orientation. International
Journal of Research in Marketing, 20(4), 377-398.
Froehle, C.M. and Roth, A.V. (2007). A resource-process framework of new service
development. Production and Operations Management, 16(2), 169-188.
Griffin, A., and Page, A.L. (1996). PDMA success measurement project:
recommended measures for product development success and failure. Journal of
Product Innovation Management, 13, 478–496.
Hair, J., Black. W,, Babin, B., Anderson, R., and Tatham, R. (2007). Multivariate Data
Analysis 6e, Prentice-Hall, New Jersey.
Hakala, H. (2010), Strategic orientations in management literature: Three
approaches to understanding the interaction between market, technology,
entrepreneurial and learning orientations. International Journal of Management
Reviews, forthcoming.
Hambrick, D. C. (2003). On the staying power of defenders, analyzers, and
prospectors. Academy of Management Executive, 17(4), 115-118.
Harmancioglu, N., Droge, C., and Calantone, R.J. (2009). Theoretical lenses and
domain definitions in innovation research. European Journal of Marketing, 43(1/2),
229-263.
Holcomb, T.R., Ireland, R.D., Holmes, R.M. Jr., and Hitt, M.A. (2009). Architecture of
entrepreneurial learning: Exploring the link among heuristics, knowledge, and
action. Entrepreneurship Theory & Practice, 33, 167-192.
Hughes, M., and Morgan, R.E. (2007). Deconstructing the relationship between
entrepreneurial orientation and business performance at the embryonic stage of
firm growth. Industrial Marketing Management, 36(5), 651-661.

34
Hughes, M., Hughes, P., and Morgan, R.E. (2007). Exploitative learning and
entrepreneurial orientation alignment in emerging young firms: implications for
market and response performance. British Journal of Management, 18(4), 359-
375.
Hughes, P., and Morgan, R.E. (2008). Fitting strategic resources with product-market
strategy: Performance implications. Journal of Business Research, 61(4), 323-331.
Hult, G.T., Hurley, R.F., and Knight, G.A. (2004). Innovativeness: Its antecedents and
impact on business performance. Industrial Marketing Management, 33, 429-438.
Hult, G.M., Ketchen, D.J. and Arrfelt, M. (2007). Strategic supply chain management:
Improving performance through a culture of competitiveness and knowledge
development. Strategic Management Journal, 28(10), 1035-1052.
Hurley, R.F., and Hult, G.M. (1998). Innovation, market orientation, and
organizational learning: An integration and empirical examination. Journal of
Marketing, 62(3), 42-54.
Jambulingam, T., Kathuria, R., and Doucette, W.R. (2005). Entrepreneurial
orientation as a basis for classification within a service industry: The case of retail
pharmacy industry. Journal of Operations Management, 23(1), 23-42.
Johne, A., and Storey, C. (1998). New service development: A review of the literature
and annotated bibliography. European Journal of Marketing, 32(3/4), 184-252.
Judge, W.Q., and Blocker, C.P. (2008). Organizational capacity for change and
strategic ambidexterity: Flying the plane while rewiring it. European Journal of
Marketing, 42(9/10), 915-926.
Kelly, D., and Storey, C. (2000). New service development: initiation strategies.
International Journal of Service Industry Management, 11(1), 45-62.
35
Kusunoki, K., Nonaka, I., and Nagata, A. (1998). Organizational capabilities in
product development of Japanese firms: a conceptual framework and empirical
findings. Organization Science, 9(6), 699-718.
Kyriakopoulos, K., and de Ruyter K. (2004), “Knowledge stocks and information
flows in new product development,” Journal of Management Studies, 41(8),
1469-1499.
Lance, C.E. (1988), “Residual centering, exploratory and confirmatory moderator
analysis, and decomposition of effects in path models containing interactions,”
Applied Psychological Measurement, 12, 163-175.
Leonard-Barton, D. (1992). Core capabilities and core rigidities: A paradox in
managing new product development. Strategic Management Journal, 13, 111-125.
Lumpkin, G.T. and Dess, G.G. (1996). Clarifying the entrepreneurial orientation
construct and linking it to performance. Academy of Management Review, 21,
135-172.
Madhavaram, S., and Hunt, S.D. (2008). The service-dominant logic and a hierarchy
of operant resources: developing masterful operant resources and implications for
marketing strategy. Journal of the Academy of Marketing Science, 36, 67-82.
Manion, M. T., and Cherion, J. (2009). Impact of strategic type on success measures
for product development projects. Journal of Product Innovation Management,
26(1), 71-85.
McKee, D., Varadarajan, P.R. and Pride, W.M. (1989). Strategic adaptability and firm
performance: a market contingent perspective. Journal of Marketing, 53(3), 21-35.
Menor, L.J., and Roth, A.V. (2007). New service development competence in retail
banking. Journal of Operations Management, 25, 825-846.

36
Menor, LJ., Tatikonda M.V., and Sampson S.E. (2002). New service development:
areas for exploitation and exploration. Journal of Operations Management, 20(2),
135-157.
Miles, R.E., and Snow, C.C. (1978). Organizational Strategy, Structure and Process.
McGraw-Hill, New York.
Miller, D. (1983). The correlates of entrepreneurship in three types of firms.
Management Science, 29, 770-791.
Montoya-Weiss, M., and Calantone, R. (1994), “Determinants of new product
performance: A review and meta-analysis,” Journal of Product Innovation
Management, 11(5), 397-418.
Moorman, C. (1995). Organizational market information processes: Cultural
antecedents and new product outcomes. Journal of Marketing Research, 32(3),
318-335.
Moorman, C.,and Miner, S.A. (1997). The impact of organisational memory on new
product performance and creativity. Journal of Marketing Research, 34, 91-106.
Olson, E.M., Slater, S.F., and Hult, G.T.M. (2005). The performance implications of fit
among business strategy, marketing organization structure, and strategic
behavior. Journal of Marketing, 69(3), 49-65.
Paladino, A. (2009). Financial champions and masters of innovation: Analyzing the
effects of balancing strategic orientations. Journal of Product Innovation
Management, 26, 616-626.
Pauwels, K., Silva-Risso, J., Srinivasan, S., and Hanssens, D.M. (2004). New
products, sales promotions, and firm value: The case of the automobile industry.
Journal of Marketing, 68(4), 142-156.

37
Podsakoff, P.M., and Organ D.W. (1986). Self-reports in organizational research:
problems and prospects. Journal of Management, 12(4), 531-45.
Raisch, S., and Birkinshaw, J. (2008). Organizational ambidexterity: Antecedents,
outcomes, and moderators. Journal of Management, 34(3), 375-409.
Schreyögg, G., and Kliesch-Eberl, M. (2007). How dynamic can organizational
capabilities be? Towards a dual-process model of capability dynamization.
Strategic Management Journal, 28(9), 913-933.
Sinkula, J.M., Baker W.E., and Noordewier T. (1997). A framework for market-based
organisational learning: linking values knowledge and behaviour. Journal of the
Academy of Marketing Science, 25, 305-315.
Sirmon, D.G., Hitt, M.A., and Ireland, R.D. (2007). Managing firm resources in
dynamic environments to create value: Looking inside the black box. Academy of
Management Review, 32(1), 273-292.
Slater, S.F, and Narver, J.C. (1993). Product-market strategy and performance: An
analysis of the Miles and Snow strategy types. European Journal of Marketing,
27(10), 33-51.
Song, M., Di Benedetto C.A., and Nason, R.W. (2007). Capabilities and financial
performance: the moderating effect of strategic type. Journal of the Academy of
Marketing Science, 35, 18-34.
Spanjol, J., Qualls, W. J., and Rosa, J. (2011). How many and what kind? The role of
strategic orientation in new product ideation. Journal of Product Innovation
Management, 28(2), 236-250.
Srinivasan, R., Lilien, G.L., and Rangaswamy, A. (2002). Technological opportunism
and radical technology adoption: An application to e-business. Journal of
Marketing, 66(3), 47-60.

38
Storey, C., and Kahn, K.B. (2010). The role of knowledge management strategies
and task knowledge in stimulating service innovation. Journal of Service
Research, 13(4), 397-410.
Storey, C., and Kelly, D.T. (2001). Measuring the performance of new service
development activities: An exploratory study. Service Industries Journal, 21(2), 71-
90.
Subramaniam, M., and Youndt, M.A. (2005). The influence of intellectual capital on
the types of innovative capabilities. Academy of Management Journal, 48(3), 450-
463.
Venkatraman N. (1989). Strategic orientation of business enterprises: The construct,
dimensionality, and measurement. Management Science, 35, 942-962.
Voss, G.B., Sirdeshmukh, D., and Voss, Z.G. (2008). The effects of slack resources
and environmental threat on product exploration and exploitation. Academy of
Management Journal, 51(1), 147-164.
Wang, C.L. (2008). Entrepreneurial orientation, learning orientation, and firm
performance. Entrepreneurship: Theory & Practice, 32(4): 635-657.
Zheng, W., Yang, B., and McLean, G.N. (2010). Linking organizational culture,
structure, strategy, and organizational effectiveness: mediating role of knowledge
management. Journal of Business Research, 63(7), 763-771.

39
Appendix. Items and Loadings of Constructs in the Model
CONSTRUCTS AND COMPONENT VARIABLES1 Standardized loadings2
Entrepreneurial Culture (α = 0.80, CR = 0.81; AVE = 0.59, HSV = 0.36)3
The head of the business is generally considered an entrepreneur, an innovator, a risk-taker
The business is dynamic, entrepreneurial
The business is committed to innovation
0.90
0.70
0.69
NSD Capability (α = 0.84, CR = 0.85, AVE = 0.65, HSV = 0.36)
Compared to competitive businesses, this business has:
greater knowledge of NSD tasks and activities
has extensive practical experience in implementing NSD tasks and activities
invested substantial time and money in NSD expertise
0.87 0.68 0.86
Learning Culture (α = 0.92, CR = 0.92, AVE = 0.79, HSV = 0.31)
The basic values of the company include learning
Staff and management view the ability to learn as key to competitive advantage
Learning is seen as necessary for organizational survival
0.90 0.93 0.84
Financial Contribution of NSD
to Overall Firm Performance (α = 0.94, CR = 0.94, AVE = 0.88, HSV = 0.23)
% Sales from new services introduced in last 3 years
% Profit from new services introduced in last 3 years
0.96 0.92
Market Turbulence (α = 0.70, CR = 0.72, AVE = 0.40, HSV= 0.19)
In the markets in which this business operates:
It is very difficult to forecast were the technology will be in the next 5 years
A large number of new service ideas have been made possible through technological breakthrough
Customer’s service preferences change rapidly over time
Customers look for new services all the time
0.55 0.60 0.75 0.58
1. All scales were assessed on seven-point Likert scales
2. Confirmatory factor analysis (CFA): Χ2 = 138.0; Χ2/df = 1.73; p = .00; CFI = 0.93; RMSEA = 0.08.
3. α = Scale reliability coefficient; CR = Composite reliability; AVE = Average variance extracted, HSV = Highest shared variance.
40
Figure 1. Conceptual Model
Culture:
Entrepreneurial
Learning
NSD capability
NSD Performance:
No. of new services
Success rate
Financial contribution of NSD
to overall firm performance
Strategic
orientation
Interaction effect
Controls:
Firm size
Market turbulence
41
Number of firms
No. of new services launched
Success rate (%)
Sales from new services
(%)
Profits from new services
(%)
Total 105 21.5 72.5% 28.3% 25.7%
Service Sector
Financial services 35 27.2 73.6% 35.2%a 29.5%
ICT services 26 23.0 67.7% 29.2% 27.4%
Other services 44 16.0 74.5% 22.2%a 21.7%
Paired test (Duncan): a – significant at 10% level.
Strategic Orientation
Prospector 30 29.9b 72.9 42.0b2,c 37.0b2,c
Analyzer 44 21.2 75.8 26.6b1 25.2b1
Defender 20 15.8 65.0 21.6b2 20.3a,b2
Reactor 11 9.9b 71.9 9.5b1,c 6.6a,b1,c
Paired test (Duncan): a – significant at 10% level; b – significant at 5% level; c – significant at 1% level
Table 1. Innovation Activity by Sector and Strategic Orientation

42
No. of New
Services Success
Rate
Financial Cont. by
NSD NSD
Capability Entrep. Culture
Learning Culture Firm size
Success Rate
-.15 -
Financial Cont. by NSD
.53*** .19** -
NSD Capability
.37*** .25** .43*** -
Entrepreneurial Culture
.37*** .20** .36*** .54*** -
Learning Culture
.17* .32*** .25** .50*** .46*** -
Firm Size .21** -.12 .13 .06 -.02 .00 -
Market Turbulence
.16* .08 .27*** .31*** .30*** .25*** .12
* Correlation is significant at the 0.10 level; ** Correlation is significant at the 0.05 level; *** Correlation is significant at the 0.01 level.
Table 2. Variable Correlations

43
Dependent variable: No. of New Services
Success Rate Financial Contribution of NSD
Independent variables: M1 M2 M3
NSD Capability 0.261 (2.20) ** 0.20 (1.65) ** 0.12 (1.09)
Learning Culture -0.08 (0.67) 0.21 (1.84) ** 0.01 (0.08)
Entrepreneurial Culture 0.28 (2.23) ** 0.16 (1.22) -0.08 (0.73).
Prospector Strategy2 -0.01 (0.07) -0.21 (1.20) 0.36 (2.35) ***
Analyzer Strategy2 0.01 (0.04) -0.14 (0.81) 0.21 (1.43) *
Defender Strategy2 0.02 (0.12) -0.18 (1.26) 0.22 (1.82) **
Firm Size 0.20 (2.20) ** -0.06 (0.68) 0.04 (0.48)
Market Turbulence 0.00 (0.00) -0.02 (0.25) 0.12 (1.38) *
No. of New Services - -0.28 (2.66) *** 0.48 (5.27) ***
Success Rate - - 0.25 (2.87) ***
R2 0.223 0.207 0.435
F (all sig at 0.01 level) 3.45 2.75 7.23
1. Standardized coefficient (t-statistic); * – significant at 0.10 level; ** - significant at 0.05 level; *** - significant at 0.01 level.
2. Dummy variable (Reactor strategy excluded from analysis)
Table 3. Regression Analysis on NSD Performance Measures

44
Dependent Variable: No. of New Services Success Rate Financial Contribution of NSD Relevant Hypoth.
Model no. M1a1 M1b M1c M2a1 M2b M2c M3a1 M3b M3c
NSD Capability .252 (2.06)** .26 (2.25)** .26 (2.29)** .19 (1.52)* .202 (1.64)* .23 (1.86)** .08 (0.77) .12 (1.13) .07 (0.68)
Learning Culture -.07 (0.62) -.08 (0.71) -.08 (0.74) .23 (2.01)** .22 (1.90)** .21 (1.80)** .03 (0.26) .00 (0.02) .02 (0.22)
Entrepreneurial Culture .28 (2.17)** .28 (2.28)** .24 (1.89)** .17 (1.31)* .18 (1.35)* .16 (1.22) -.09 (0.87) -.09 (0.77) -.06 (0.54)
Prospect Strategy .01 (0.06) .01 (0.03) .05 (0.28) -.28 (1.53)* -.24 (1.34)* -.28 (1.52)* .43 (2.85)*** .38 (2.45)*** .41 (2.71)***
Analyzer Strategy .02 (0.12) .06 (0.32) .06 (0.37) -.18 (1.04) -.18 (1.03) -.18 (1.02) .30 (2.01)** .23 (1.52)* .24 (1.69)**
Defender Strategy .03 (0.20) .04 (0.33) .03 (0.22) -.19 (1.37)* -.19 (1.36)* -.18 (1.30)* .26 (2.14)** .23 (1.89)** .26 (2.13)**
Firm Size .20 (2.17)** .21 (2.27)** .20 (2.17)** -.07 (0.76) -.07 (0.69) -.07 (0.71) .03 (0.35) .04 (0.47) .01 (0.07)
Market Turbulence -.02 (0.21) -.02 (0.21) -.01 (0.09) -.04 (0.36) -.04 (0.35) -.02 (0.19) .13 (1.52)* .12 (1.44)* .13 (1.61)*
No. of New Services - - - -.26 (2.54)*** -.27 (2.57)*** -.28 (2.71)*** .46 (5.17)*** .47 (5.18)*** .51 (5.67)***
Success Rate - - - - - - .24 (2.82)*** .26 (2.95)*** .24 (2.87)***
Interaction term
Entrep Culture x Prospector .05 (0.57) - - - - - .19 (2.32)** - - H5
Learning Culture x Analyzer - - - -.16 (1.68)** - - - .06 (0.74) - H6
NSD Capability x Entrep Culture - .18 (1.91)** - - - - - - - H7
NSD Capability x Learning Culture - - - - -.14 (1.54)* - - - - H8
NSD Capability x Prospector - - .17 (1.85)** - - - - - - H9a
NSD Capability x Analyzer - - - - - -.13 (1.32)* - - - H9b
NSD Capability x Defender - - - - - - - - .19 (2.39)*** H9c
R2 .226 .252 .250 .230 .226 .221 .466 .438 .468
Δ R2 .003 .028 .027 .023 .020 .014 .031 .003 .033
F (all sig at 0.01 level) 3.08 3.55 3.52 2.81 2.75 2.67 7.37 6.59 7.43
1. Comparison against model M1, M2 or M3 (see table 3).
2. Standardized coefficient (t-statistic); * – significant at 0.10 level; ** - significant at 0.05 level; *** - significant at 0.01 level.
Table 4. Regression Analysis with Interaction Terms

45
2a. Prospector and Entrepreneurial culture on
Financial Contribution of NSD
2b. Analyzer and Learning Culture on Success Rate
2c. Entrepreneurial Culture and NSD Capability on No. of New Services
2d. Learning Culture and NSD Capability on Success Rate
Figure 2. Interaction Effects
-1
-0.5
0
0.5
1
Others Prospectors
Con
trib
utio
n b
y N
SD
(S
atn
da
rdiz
ed
)
Low Entrep.Culture
High Entrep.Culture
-1
-0.5
0
0.5
1
Others Analyzers
Su
cce
ss R
ate
(S
atn
da
rdiz
ed
)
LowLearningCulture
HighLearningCulture
-1
-0.5
0
0.5
1
Low NSD Capability High NSD Capability
No.
of N
ew
Se
rvic
es (
Sa
tnd
ard
ize
d)
Low Entrep.Culture
High Entrep.Culture
-1
-0.5
0
0.5
1
Low NSD Capability High NSD Capability
Su
cce
ss R
ate
(S
atn
da
rdiz
ed
)
LowLearningCulture
HighLearningCulture
46
3a. Prospector and NSD Capability on Number of New Services
3b. Analyzer and NSD Capability on Success Rate
3c. Defender and NSD Capability on
Financial Contribution of NSD
Figure 3. Interaction Effects – Strategic Orientations and NSD Capability
-1
-0.5
0
0.5
1
Low NSD Capability High NSD Capability
No.
of N
ew
Se
rvic
es (
Sa
tnd
ard
ize
d)
Others
Prospectors
-1
-0.5
0
0.5
1
Low NSD Capability High NSD Capability
Su
cce
ss R
ate
(S
atn
da
rdiz
ed
)
Others
Analyzsers
-1
-0.5
0
0.5
1
Low NSD Capability High NSD Capability
Con
trib
utio
n b
y N
SD
(S
atn
da
rdiz
ed
)
Others
Defenders

47