relationships of type a behavior with biographical ... · washington, d.c. 20591 14. spooring...
TRANSCRIPT
AD-A283 813
DOT/FAA/AM-94/13 Relationships of Type ABehavior With Biographical
Office of Aviation Medicine Characteristics and TrainingWashington, D.C. 20591 Performance of Air Traffic
Controllers
L.G. NyeDJ. SchroederC.S. Dollar
Civil Aeromedical InstituteAMLECTEFederal Aviation Administration
S 2 4 1994 Oklahoma City, Oklahoma 73125
FJuly 1994
Final Report
T d . This document is available to the publicutiazfor public release @ad s through the National Technical Information
Service, Springfield, Virginia 22161.
D-Te' QUA.LTMY INSPECTED 5
914--26916 .U.S. Department
of Transportation
Federal AviationAdministration
94 8 23 078
NOTICE
This document is disseminated under the sponsorship ofthe U.S. Department of Transportation in the interest of
information exchange. The United States Governmentassumes no liability for the contents or use thereof.
Technical Report Documentation Page1. Repoet No. 2. Government Accession No. 3. Recipient's Catalog No.
DOT/FAA/AM-94/13
4t To Od sum* 5. Report Date
Relationships of Type A Behavior with Biographical Characteristics and July 1994Training Performance of Air Traffic Control Specialists
6. Performing Organization Code
7. Auttior() 8. Performing Organization Report No.
LG. Nye, D.J. Schroeder, and C.S. Dollar
9. Pedormlng Organization Name and Address 10. Work Unit No. (TRAIS)
FAA Civil Aeromedical InstituteP.O. Box 25082 11. Contract or Grant No.
Oklahoma City, OK 7312512. SponsoWng Agency name and Address 13. Type of Report and Period Covered
Office of Aviation MedicineFederal Aviation Administration800 Independence Avenue, S.W.Washington, D.C. 20591 14. spooring Agency Code
15. Supplemental Note
This work was performed under Task AM-B-94-HRR-12216. Abstract
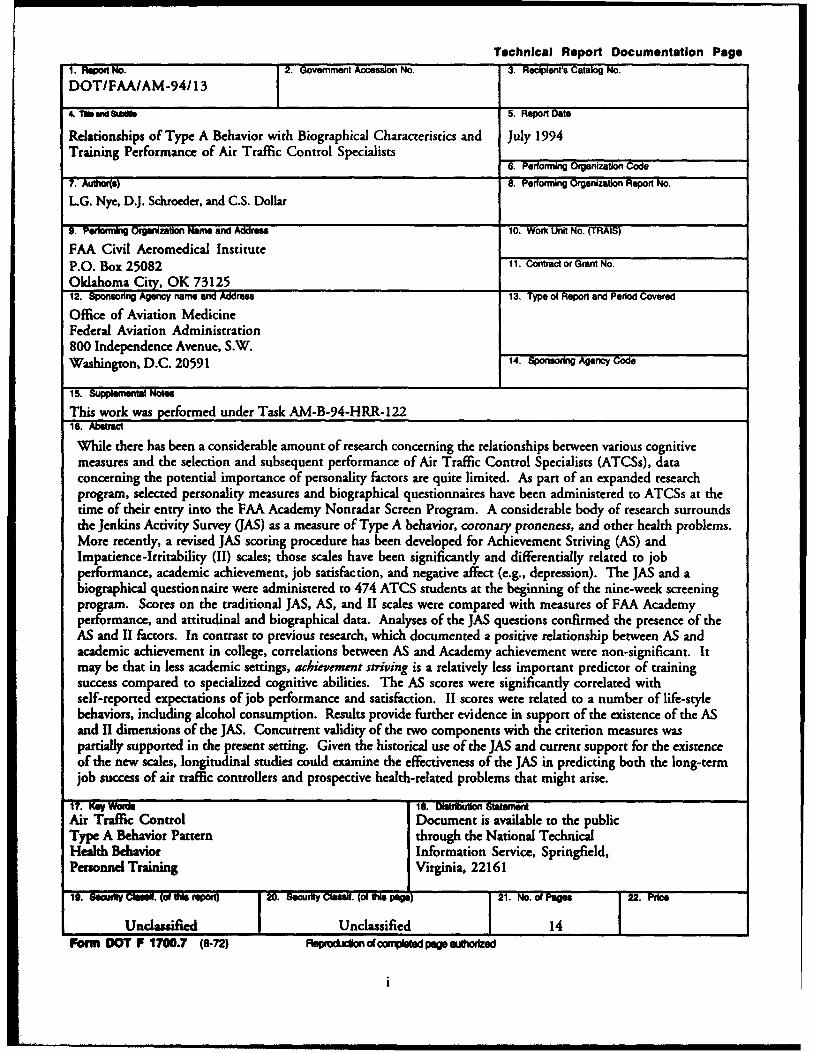
While there has been a considerable amount of research concerning the relationships between various cognitivemeasures and the selection and subsequent performance of Air Traffic Control Specialists (ATCSs), dataconcerning the potential importance of personality factors are quite limited. As part of an expanded researchprogram, selected personality measures and biographical questionnaires have been administered to ATCSs at thetime of their entry into the FAA Academy Nonradar Screen Program. A considerable body of research surroundsthe Jenkins Activity Survey (JAS) as a measure of Type A behavior, coronary proneness, and other health problems.More recently, a revised JAS scoring procedure has been developed for Achievement Striving (AS) andImpatience-Irritability (II) scales; those scales have been significantly and differentially related to jobperformance, academic achievement, job satisfaction, and negative affect (e.g., depression). The JAS and abiographical questionnaire were administered to 474 ATCS students at the beginning of the nine-week screeningprogram. Scores on the traditional JAS, AS, and II scales were compared with measures of FAA Academyperformance, and attitudinal and biographical data. Analyses of the JAS questions confirmed the presence of theAS and II factors. In contrast to previous research, which documented a positive relationship between AS andacademic achievement in college, correlations between AS and Academy achievement were non-significant. Itmay be that in less academic settings, achievement striving is a relatively less important predictor of trainingsuccess compared to specialized cognitive abilities. The AS scores were significantly correlated withself-reported expectations of job performance and satisfaction. II scores were related to a number of life-stylebehaviors, including alcohol consumption. Results provide further evidence in support of the existence of the ASand II dimensions of the JAS. Concurrent validity of the two components with the criterion measures waspartially supported in the present setting. Given the historical use of the JAS and current support for the existenceof the new scales, longitudinal studies could examine the effectiveness of the JAS in predicting both the long-termjob success of air traffic controllers and prospective health-related problems that might arise.
17. Key WOrt 18. Distrbution StatementAir Traffic Control Document is available to the publicType A Behavior Pattern through the National TechnicalHealth Behavior Information Service, Springfield,Personnel Training Virginia, 22161
19. sectirt yGWO~.(ocat *arepo"t 20. f•acrtyCiase. (od V"p• 21. No. of Pages 22. Price
~Uhn tssi rep jUnclassified 14
Form DOT F 1700.7 (8-72) Raprocmon of cowqIsbd pogep atahod
RELATIONSHIPS OF TYPE A BEHAVIOR WITH BIOGRAPHICAL CHARACTERISTICS ANDTRAINING PERFORMANCE OF AIR TRAFFIC CONTROL SPECIALISTS
A considerable amount of research surrounds the used to measure coronary prone behavior. The JASJenkins Activity Survey (JAS) as a measure of Type A provides an overall -,lobal measure of Type A behaviorbehavior pattern (TABP), coronary proneness, and UAS-AB), along with subscales measuring speed andother health problems. More recently, a revised JAS impatience (JAS-SI), hard-driving and competitive-scoring procedure has measured Achievement Striv- ness (JAS-HDC), and job involvement (JAS-JI). Asing (AS) and Impatience-Irritability (II) scales, which part of their analysis of the relationship between thehave been significantly and differentially related to TABP and achievement, Pred, Helmreich, and Spencejob performance, academic achievement, job satisfac- (1986) demonstrated the presence of 2 distinct fac-tion, and negative affect (e.g., depression). The first tors. One, which they labeled Achievement Strivingpurpose of the present study was to validate the (AS), was significantly related to the overall gradeexistence of the AS and HI scales as constructs with a point average of students (Spence, Helmreich, &sample of subjects from an occupation that is quite Pred, 1987) and to scientific productivity (Helmreich,different from most previous studies. Traditionally, Spence, & Pred, 1988). The second, Impatience andresearch concerning the selection of Air Traffic Con- Irritability (II), measured more negative qualities andtrol Specialists (ATCSs) has focused on the role of was correlated with the self-reported presence of acognitive abilities and biographical/demographic fac- number of health symptoms (Helmreich, et al., 1988).tors. As part of an expanded program of research Bluen, Barling, and Burns (1990), using the AS and 11(Collins, Schroeder, & Nye, 1991; Nye & Collins, measures of the JAS, found that the AS predicted sales1993; Schroeder, Broach, & Young, 1993), we have performance and job satisfaction, while II scale scoresbeen evaluating the importance of personality traits were positively correlated with depression. In a studythat have historically demonstrated some utility for involving a survey of airline crew members, higher ASpredicting academic or job success in other settings. scores were associated with better performance rat-Therefore, the second purpose of this study was to ings, while higher II levels were related to increaseddetermine the extent to which the JAS scale scores tension and lower quality of sleep (Chidester, 1990).predicted the performance of students in the Federal These findings, along with more recent research byAviation Administration (FAA) Academy screen. Ad- Burns and Bluen (1992), reflect trends to view TABPditionally, this study was designed to provide infor- as a multidimensional construct comprised of bothmation concerning the relationship between the JAS "toxic" and "non-toxic" components and to expandmeasures and 2 attitudinal measures; job satisfaction the initial research that examined the relationship ofexpectations and self-reported performance expecta- TABP with coronary heart disease (Friedman &tions at the beginning of the Academy screen. Lastly, Rosenman, 1959) to include the correlations betweenwe wanted to examine the association of TABP, espe- TABP and various employee reactions in the workcially the AS and II constructs, with regard to certain environment. Additional research is needed to clarifyhealth-related activities, (e.g., smoking and alcohol the presence of the AS and 1I scales on the JAS inconsumption) and coping strategies for dealing with different populations and provide further evidencestress. to support the use of those scales as measures of
Individuals who possess the Type A behavior pat- positive achievement and poor health, as suggested 0tern are described as being impatient, competitive, by Helmreich, Spence, and Pred (1988). In this 0hard driving, and time-pressured. A commonly used study, the ATCS scores for the traditional JASmeasure of TABP is the JAS, a self-report measure scales were compared with both occupational normsthat was developed by Jenkins, Zyzanski, and (Jenkins, 1979) and the results of a recent study ofRosenman (1971, 1979) as a substitute for the U. S. Navy students in flight training (Shull,more costly, time-cc.nsuming psychiatric interview Dolgin, & Gibb, 1988). Subsequently, a series of ,ds
o1
confirmatory factor analyses were evaluated to help signed to eliminate individuals lacking in aptitudesdetermine the construct validity of the AS and II not easily measured using paper-and-pencil cognitivescales. tests. While there has been considerable research con-
The connections have not been well established cerning some of the cognitive abilities that predictbetween global, overall levels of TABP and individu- success in the FAA Academy (Rock, Dailey, Ozur,als' job performance or educational success. Specifi- Boone, & Pickrel, 1982; Schroeder, Dollar, & Nye,cally, Ivancevich and Matteson (1988) described TABP 1990; VanDeventer, 1984), evidence is more limitedemployees as "workaholics" who are constantly seek- concerning the relationship between personality oring to accomplish more and improve their perfor- behavioral characteristics and performance. Becausemance. In certain organizational settings, those the JAS-AS scale provides a measure of achievementqualities may result in higher levels of performance or striving, we hypothesized that those scores would begreater achievement. Matthews, Helmreich, Beane, predictive of performance in the Academy screenand Lucker (1980), using the Jenkins Activity Survey, program.demonstrated that scientists possessing the TABP had As with job performance, previous research con-a greater number of publications and more citations cerning the relationship between Type A behavior andthan their Type B colleagues. Taylor, Locke, Lee, and job satisfaction has been inconsistent. A positive rela-Gist (1984) also found Type A faculty to be more tionship between Type A characteristics and intrinsicproductive. In academic settings, Type A's have higher job satisfaction was demonstrated by Day and Bedeiangrades (Waldron et al., 1980) andearn more academic (1991), who used a different measure of TABP thanhonors (Glass, 1977). In contrast to those results, the JAS. However, using the Framingham Type AShull, et al., (1988) found that the traditional JAS scale, Matteson, Ivancevich, and Smith (1984) foundscores were unrelated to performance in a group of that Type A's and B's did not exhibit different levelspilots involved in a Navy flight training program. of job satisfaction. We sought to determine whetherUsing supervisor ratings of the job performance of Type A individuals differ from Type B's (at thewhite-collar workers, Jamal (1985) found that Type beginning of their careers) in their expectations re-A's exerted greater effort on the job; however, Type garding job satisfaction in the future. An attitudinalB's were rated higher on quality of performance. measure that has been found to be significantly corre-There were no differences between the 2 groups on lated with FAA Academy success is self-reported per-quantity of performance and promotions received. In formance expectations at the beginning of the screena field study of sales personnel, Ivancevich, Matteson, program (Collins, Nye, & Manning, 1992). We ex-and Smith (1983) found that Type A's were more pected that achievement striving scores would beambitious, but did not differ from Type B's in perfor- positively associated with entrants' expectations formance. Matteson, Ivancevich, and Smith (1984) found success in their careers.that Type A life insurance sales personnel did not Finally, we wanted to develop a more completediffer from their Type B counterparts on 3 objective understanding of the association of TABP, especiallysales measures. the AS and II constructs, with regard to smoking and
In this study, the performance criterion was perfor- alcohol consumption, and coping strategies for deal-mance in the FAA Academy screening program for ing with stress. A study of college students (Jordan &newly hired air traffic controllers. Applicants for the Perry, 1987) found that Type A behavior (measuredjob of air traffic controller with the FAA are generally by JAS-AB scores) was not related to such behavioralrequired to pass a battery of paper-and-pencil selec- risk factors as smoking, alcohol consumption, andtion tests that primarily measure cognitive aptitudes. lack of physical exercise. However, with a sample ofAt the time of this study, less than 10% of those who healthy, middle-aged men where Type A behaviorinitially applied to become air traffic control special- pattern was determined by structured interview, theists were selected (Manning, Della Rocco, & Bryant, group classified asTypeAreportedsignificantlygreater1989) to enter a second-stage screening process de- consumption of alcohol (Camargo, Vranizan,
2
Thoresen, & Wood, 1986). By contrast, Burke and satisfied with your job" with a 5-point rating scaleWeir (1980), using the structured interview for clas- (from "not at all" to "to a very great extent") was usedsification, reported that Type A managers were less to measure job satisfaction expectations. Self-expectedlikely to be smokers and regularly consumed less job performance was determined by the sum of ratingsalcohol. on 2 BQ items, "how long it will take to become fully
effective in your current job (from "much longer" toMETHOD .much less time than others")" and "percentile of
performance expected compared to all ATCSs (fromSubjects and Instruments. The sample of 474 had "the lowest 10%" to "the top 10%")". Alcohol con-
a mean age of 26.1 years (SD = 3.0 years), and sumption was measured by the combined responses toincluded 13.1% women and 8.0% minorities. The 2 items on the BQ; the frequency of use (5 categories;JAS and a biographical questionnaire (BQ) were ad- from "non-drinker" to "every day") and the usualministered to Air Traffic Control Specialist (ATCS) number of alcoholic drinks per occasion (4 categories;students during the third day following their entry from "1-2" to "12 or more"). Tobacco usage wasinto the Nonradar Screen Program (NRSP) at the indicated by the amount of tobacco smoked dailyFAA Academy in Oklahoma City, OK. The NRSP (from "non-smoker" to "2 packs or more per day").was the second stage of the selection process for The sample was comprised of 18.4% non-drinkersATCSs. At the time of this study, the screen was a 9- and 81.9% nonsmokers. Respondents to the BQalsoweek program and assessed entrants' ability to learn indicated how frequently (from "almost never" toair traffic procedures and then to apply those proce- "almost always") they engaged in certain activitiesdures during a series of laboratory simulations, not when they feel "nervous or tense." The behavioralinvolving radar. Performance in this program in- options listed included: a) using a relaxation tech-cluded a final paper-and-pencil test of air traffic nique such as meditation; b) engaging in physicalcontrol skills called the Controller Skills Test (CST) activity such as jogging or exercise; c) having anand the final Academy composite grade (COMP) alcoholic drink; and d) talking with a friend, co-based on the CST, academic tests, and technical and worker, or family member.instructor assessments of student performance on The JAS item responses were transformed into unitlaboratory problems. More specifically, the percent- weights in order to compensate for the varying num-ages assigned to each component for determining the ber of response categories, which ranged from 3 to 5,final grade were as follows: the CST (20%), academic thus applying the scoring procedure suggested for thetests (20%), and the two evaluations of performance AS and II scales by Spence, et al. (1987). Standardon the best five of six graded laboratory problems - procedures established by Jenkins, Zyzanski, andinstructor assessment (30%) and technical assessment Rosenman (1979) were used to calculate scores for the(30%). A final grade of 70.0 was required for success- 4 traditional scales; the JAS-AB, JAS-SI, JAS-HDC,ful completion of the NRSP. and JAS-JI. The items from the JAS that comprised
The BQ contains a total of 145 items, some of the AS and II scales are listed in Appendix A.which provide information concerning the entrants' Analyses. Mean standard JAS scores were com-prior educational and work experiences. Another sec- puted for the ATCS trainees and compared to norma-tion of the BQ measures attitudes regarding self- tive data, as reported byJenkins, et al. (1979) and withexpectations of job satisfaction and job performance. average scores of U. S. Navy student aviators reportedGeneral information is also requested regarding life- by Shull, et al. (1988).style issues such as alcohol and tobacco usage. This A series of confirmatory factor analyses were per-questionnaire has been used to evaluate the role of formed to test for the presence of the AS and IIbiographical factors in screening/training success constructs. The goodness-of-fit measures obtained(Collins, Manning, & Taylor, 1984; Collins, et al., from LISREL VI (Joreskog & Sorbom, 1986) in-1992). A single item "extent to which you expect to be cluded the chi square statistic for the fit between the
3
data and the model, the ratio of chi square to degrees was applied to the set of correlations to preventof freedom index (X/df), and the adjusted goodness- inflating the Type I error rate. Specifically, for thisof-fit index (AGFI). One set of criteria (Hoelter, study, the approximate rrequired for thep < .05 level1983) for an acceptable model include a XV/df ratio of of significance was. 15 for a one-tailed test and. 16 forless than 2.0 and an AGFI of.90 or greater. Initially, a two-tailed test. While the use of single items froman analysis was performed in which the 14 items, the BQprovided preliminary information concerningshown in Appendix A, were considered to be I factor. the associations with the JAS scales, future researchThis unidimensional factor model was then compared should evaluate these relationships using more psy-to the hypothesized 2-factor structure in which each chometrically reliable measures of the attitudinal anditem loaded only on 1 factor. The third model con- behavioral risk factors.tained the AS and 11 factors, but each item was allowedto load on both factors if both loadings were statisti- RESULTScally significant. The chi square difference test (Bentler& Bonett, 1980) was also utilized to contrast the Average JAS scores. The mean standard scoresmodels and determine the best model based on good- obtained for the ATCS trainees fell into theness-of-fit characteristics. predesignated 55th, 45th, 50th and 50th percentiles
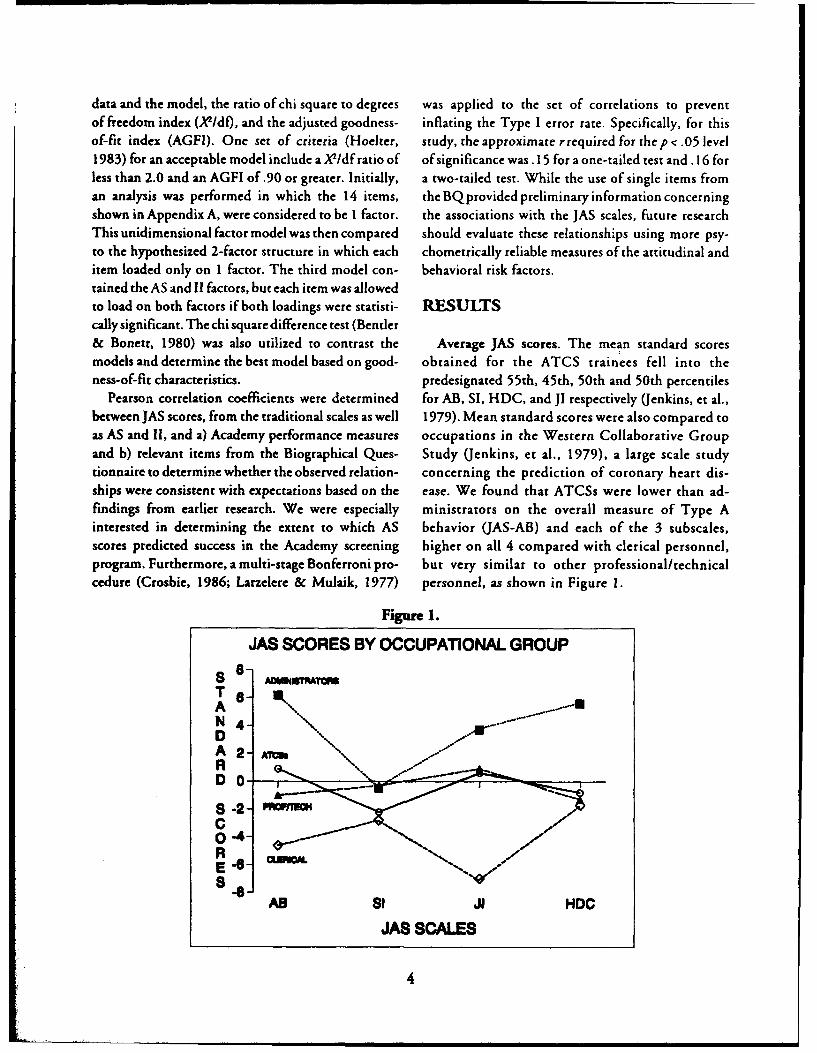
Pearson correlation coefficients were determined for AB, SI, HDC, and JI respectively (Jenkins, et al.,between JAS scores, from the traditional scales as well 1979). Mean standard scores were also compared toas AS and II, and a) Academy performance measures occupations in the Western Collaborative Groupand b) relevant items from the Biographical Ques- Study (Jenkins, et al., 1979), a large scale studytionnaire to determine whether the observed relation- concerning the prediction of coronary heart dis-ships were consistent with expectations based on the ease. We found that ATCSs were lower than ad-findings from earlier research. We were especially ministrators on the overall measure of Type Ainterested in determining the extent to which AS behavior (JAS-AB) and each of the 3 subscales,scores predicted success in the Academy screening higher on all 4 compared with clerical personnel,program, Furthermore, a multi-stage Bonferroni pro- but very similar to other professional/technicalcedure (Crosbie, 1986; Larzelere & Mulaik, 1977) personnel, as shown in Figure 1.
FgRpm 1.
JAS SCORES BY OCCUPATIONAL GROUPS$ AMD •MT M
T 6AN 4-
R
C
Rs--
AB SI Jl HDCJAS SCALES
4
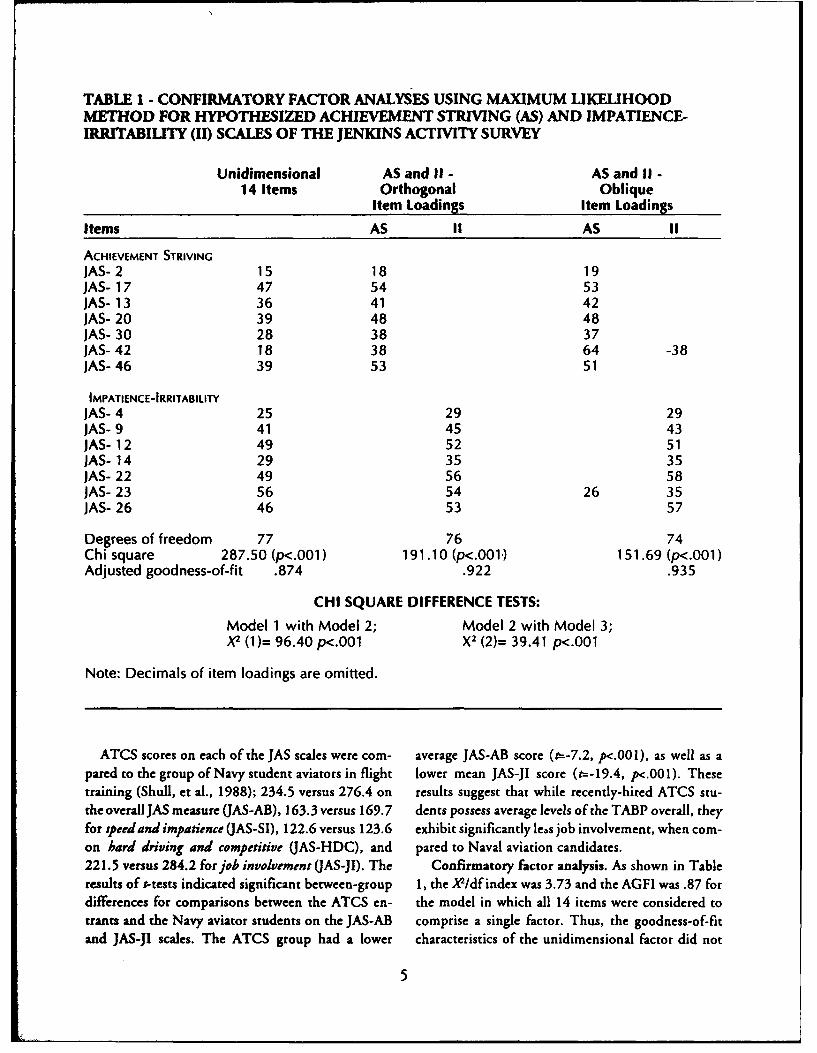
TABLE 1 - CONFIRMATORY FACTOR ANALYSES USING MAXIMUM LIKELIHOODMETHOD FOR HYPOTHESIZED ACHIEVEMENT STRIVING (AS) AND IMPATIENCE-IRRITABILITY (II) SCALES OF THE JENKINS ACTIVITY SURVEY
Unidimensional AS and II - AS and II -14 Items Orthogonal Oblique
Item Loadings Item Loadings
Items AS II AS II
ACHIEVEMENT STRIVING
JAS- 2 15 18 19JAS- 17 47 54 53JAS- 13 36 41 42JAS- 20 39 48 48JAS- 30 28 38 37JAS- 42 18 38 64 -38JAS- 46 39 53 51
IMPATIENCE-IRRITABILITY
JAS- 4 25 29 29JAS- 9 41 45 43JAS- 12 49 52 51JAS- 14 29 35 35jAS- 22 49 56 58JAS- 23 56 54 26 35JAS- 26 46 53 57
Degrees of freedom 77 76 74Chi square 287.50 (p<.001) 191.10 (p<.001.) 151.69 (p<.001)Adjusted goodness-of-fit .874 .922 .935
CHI SQUARE DIFFERENCE TESTS:
Model 1 with Model 2; Model 2 with Model 3;X2 (1)= 96.40 p<.001 X2 (2)= 39.41 p<.001
Note: Decimals of item loadings are omitted.
ATCS scores on each of the JAS scales were com- average JAS-AB score (t-7.2, p/.001), as well as apared to the group of Navy student aviators in flight lower mean JAS-JI score (t=-19.4, p<.o01). Thesetraining (Shull, et al., 1988); 234.5 versus 276.4 on results suggest that while recently-hired ATCS stu-the overall JAS measure (.AS-AB), 163.3 versus 169.7 dents possess average levels of the TABP overall, theyfor speed and impatience (JAS-SI), 122.6 versus 123.6 exhibit significantly lees job involvement, when corn-on hard driving and competitive (AS-HDC), and pared to Naval aviation candidates.221.5 versus 284.2 for job involvement UAS-JI). The Confirmatory factor analysis. As shown in Tableresults of t-tests indicated significant between-group 1, the XV/df index was 3.73 and the AGFI was .87 fordifferences for comparisons between the ATCS en- the model in which all 14 items were considered totrants and the Navy aviator students on the JAS-AB comprise a single factor. Thus, the goodness-of-fitand JAS-JI scales. The ATCS group had a lower characteristics of the unidimensional factor did not
5
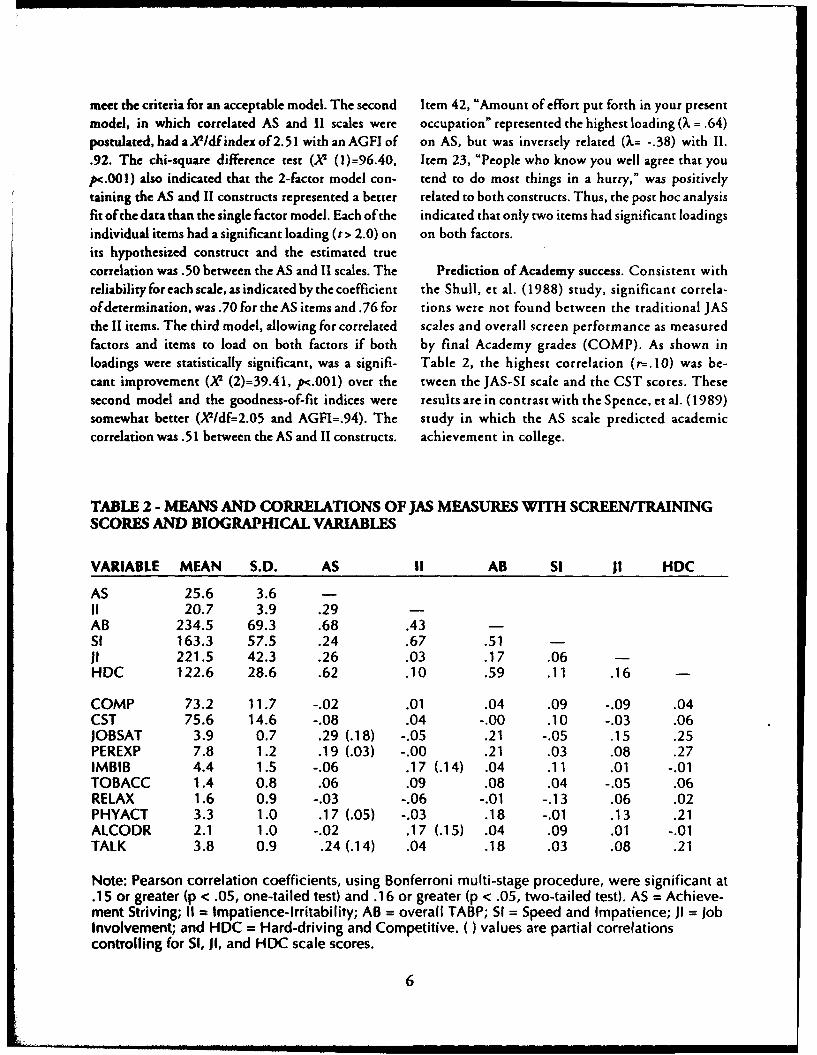
meet the criteria for an acceptable model. The second Item 42, "Amount of effort put forth in your presentmodel, in which correlated AS and II scales were occupation" represented the highest loading (k = .64)postulated, had a XA2 df index of 2.51 with an AGFI of on AS, but was inversely related (X,= -.38) with I1..92. The chi-square difference rest (XA (1)=96.40, Item 23, "People who know you well agree that youp<. 0 0 1) also indicated that the 2-factor model con- tend to do most things in a hurry," was positivelytaining the AS and II constructs represented a better related to both constructs. Thus, the post hoc analysisfit of the data than the single factor model. Each of the indicated that only two items had significant loadingsindividual items had a significant loading (t> 2.0) on on both factors.its hypothesized construct and the estimated truecorrelation was .50 between the AS and 11 scales. The Prediction of Academy success. Consistent withreliability for each scale, as indicated by the coefficient the Shull, et al. (1988) study, significant correla-of determination, was .70 for the AS items and .76 for tions were not found between the traditional JASthe II items. The third model, allowing for correlated scales and overall screen performance as measuredfactors and items to load on both factors if both by final Academy grades (COMP). As shown inloadings were statistically significant, was a signifi- Table 2, the highest correlation (r=.P10) was be-cant improvement (XA (2)=39.41, p<.001) over the tween the JAS-SI scale and the CST scores. Thesesecond model and the goodness-of-fit indices were results are in contrast with the Spence, et al. (1989)somewhat better (XV/df=2.05 and AGFI=.94). The study in which the AS scale predicted academiccorrelation was .51 between the AS and II constructs. achievement in college.
TABLE 2 - MEANS AND CORRELATIONS OF JAS MEASURES WITH SCREEN/TRAININGSCORES AND BIOGRAPHICAL VARIABLES
VARIABLE MEAN S.D. AS II AB SI JI HDC
AS 25.6 3.6 -
II 20.7 3.9 .29 -
AB 234.5 69.3 .68 .43 -
SI 163.3 57.5 .24 .67 .51 -
ii 221.5 42.3 .26 .03 .17 .06 -
HDC 122.6 28.6 .62 .10 .59 .11 .16 -
COMP 73.2 11.7 -.02 .01 .04 .09 -.09 .04CST 75.6 14.6 -.08 .04 -.00 .10 -.03 .06JOBSAT 3.9 0.7 .29 (.18) -.05 .21 -.05 .15 .25PEREXP 7.8 1.2 .19 (.03) -.00 .21 .03 .08 .27IMBIB 4.4 1.5 -.06 .17 (.14) .04 .11 .01 -.01TOBACC 1.4 0.8 .06 .09 .08 .04 -.05 .06RELAX 1.6 0.9 -.03 -.06 -.01 -.13 .06 .02PHYACT 3.3 1.0 .17 (.05) -.03 .18 -.01 .13 .21ALCODR 2.1 1.0 -.02 .17 (.15) .04 .09 .01 -.01TALK 3.8 0.9 .24 (.14) .04 .18 .03 .08 .21
Note: Pearson correlation coefficients, using Bonferroni multi-stage procedure, were significant at.15 or greater (p < .05, one-tailed test) and .16 or greater (p < .05, two-tailed test). AS = Achieve-ment Striving; II = Impatience-Irritability; AB = overall TABP; SI = Speed and Impatience; JI = JobInvolvement; and HDC = Hard-driving and Competitive. ()values are partial correlationscontrolling for SI, JI, and HDC scale scores.
6
Relationships between JAS and BQ items. Results scores were higher for those who more frequentlyshown in Table 2 indicated a significant correlation consumed alcohol in response to being nervous orbetween future job satisfaction - "Extent to which tense (ALCODR; r. 17). As for alcohol consumptionyou expect to be satisfied with your job" (JOBSAT)- (IMBIB), the overall measure of Type A behaviorand AS scores (rm.29), but not the II scale scores (rb- pattern was not significantly correlated with alcohol.05). In addition, overall Type A and HDC subscale consumption as a response to feeling nervous or tense.scores were significantly correlated with expectations Partial correlations, controlling for the effects ofof future job satisfaction. Thus, individuals who were the JAS-SI, JAS-JI, and JAS-HDC scales, were deter-achievement striving and hard-driving/competitive mined to establish the residual relationships of the ASwere more likely to report greater expectations of and II scales with the attitudinal and behavioral inca-future job satisfaction. sures. As shown in Table 2, the partial correlations
Table 2 also shows, as expected, that AS scores were were nonsignificant for achievement striving with jobsignificantly associated (r-. 19) with the measure of performance expectations, the preference for engag-expected job performance (PEREXP). The JAS-HDC ing in physical activity when nervous or tense, and theand JAS-AB scale scores were similarly correlated, preference for social interaction when anxious. How-Thus, in addition to expectations of greater job satis- ever, the AS scores accounted for significant variancefaction, individuals who were achievement striving in job satisfaction expectations. Most of the associa-and hard-driving/competitive expected that they were tion between II and alcohol consumption patternslikely to perform better on the job. was not explained by SI, JI, or HDC levels.
Consistent with the findings of Jordan and Perry(1987) for their sample of college students, overall CONCLUSIONSType A behavior pattern (JAS-AB) was not signifi-cantly related to reported alcohol (IMBIB) or tobacco While ATCSs represent a select group with respectconsumption (TOBACC). However, the II scale scores to certain cognitive abilities, their JAS scores werewere associated with alcohol consumption (r=.17). similar to overall normative response patterns re-This finding adds another dimension to the Spence et ported by Jenkins, et al. (1971). The pattern of ATCSal. (1987) suggestion that the impatience-irritability scores differed from those of certain other occupa-scale might predict health problems; namely that the tional groups (administrator and clerical) as well asII scale scores were associated with certain life-style other aviation trainees (Navy flight students).characteristics, which can also lead to potential health Results of this study provide further confirmatoryproblems. evidence of the existence of the AS and II factors in the
The AS and II scale scores had different patterns of Jenkins Activity Survey. Model testing procedurescorrelations with the entrants' preferred method(s) of clearly suggested that the 2 constructs werehandling anxiety/stress. Higher AS scores were associ- distinguishable aspects of the JAS responses for aated with the preferences of engaging in a physical sample of trainees at the FAAAcademy screen program.activity (PHYACT; t-. 17) and talking with a friend, Discriminant validityof the scales representingpositiveco-worker, or family member (TALK; r=.24). Simi- (AS) and negative (II) components of TABP waslarly, relationships were found between the JAS-AB further demonstrated by the differential correlationsand JAS-HDC scale scores and these methods of between these recently developed scale scores andcoping with stress. Thus for our sample, greater over- various attitudinal and biographical data. Theall Type A behavior pattern was related to a higher use favorable, work-related correlates of achievementof both exercise and social support as methods of striving included self-expectations of both future jobcoping. The later finding was consistent with studies satisfaction and better job performance. By contrast,(Lobel, 1988; Chesney, Black, Chadwick, & impatience-irritability levels were found to be slightlyRosenman, 1981) that found those identified as Type higher for those who reported greater usage of alcohol.A's to be more extroverted. By comparison, II scale The findings of this study suggest that relationships
7
between TABP and thedevelopmentofhealthconcerns already highly qualified group in terms of aptitude formight be confounded by significant relationships the occupation. Also, the TABP scales and perfor-among TABP components, such as impatience- mance criteria were examined across a relatively shortirritability, and life-style behaviors which also can time-frame of less than 3 months. As illustrated byrepresent potential health risks. Helmreich, Sawin, and Carsrud (1986), job-related
This study supports the viewpoint that Type A personality measures can exhibit larger associationsbehavior pattern is a multidimensional construct in with longer-term, rather than shorter-term, job per-which only some of the components are associated formance. Thus, potential relationships should bewith potentially negative attitudes and behaviors. explored between TABP scores and more long-termClearly, research that attempts to measure only overall job performance criteria including on-the-job train-TABP risks missing significant subscale correlations. ing success, and subsequent promotion to, and perfor-Similarly, some of the inconsistency found across mance as, supervisory ATCSs in the FAA.previous studies could have been the result of sampledifferences in the combinations of the "toxic" and REFERENCES"non-toxic" subscale levels which could not be ac-counted for when using overall TABP scores. Bender, P. M., & Bonett, D. G. (1980). Significance
In general, future research using a longitudinal tests and goodness of fit in the analysis of covari-design with this sample could determine whether the ance structure. Psychological&ulin, 88,588-606,
JAS subscales are predictive of health outcomes and Bluen, S. D., Barling,J. & Burns, W. (1990). Predictingemployee attitudes such as job satisfaction and self- sales performance, job satisfaction, and depressionreported "burnout". This study provided base line by using the Achievement Strivings and Impa-
afor potential use in examining changes in TABP tience-Irritability dimensions of Type A behavior.data fo oeta s neaiigcagsi APJournal of Applied Psychology, 75, 2 12-6.
over time and for other research. For example, BurkeRJ.,&WeiT(8.hela p e 75p212n6.
DeFrank, Jenkins, and Rose (1987), using data from Burke, ILJ., &Weir, T. (1980). The Type A experience:
the Air Traffic Controller Health Change Study (Rose, Occupational and life demands, satisfaction, and
Jenkins, & Hurst, 1978), reported a possible causal well-being. Journal ofHuman Stress, 6, 28-38.
link between stress and greater alcohol consumption Burns, W., & Bluen, S.D. (1992). Assessing a multidi-mensional Type A behavior scale. Personality andthat, in turn, resulted in elevated diastolic blood Individual Differences, 13, 977-86.
pressure levels. Given our results, a hypothesis would
be that individuals who either exhibited (at base line) Camargo, C. A., Vranizan, K. M., Thoresen, C. E., &Wood, P. D. (1986). Type A behavior pattern and
or developed higher levels of impatience-irritability alcohol intake in middle-aged men. Psychosomaticare more susceptible to stressors at work and likely to Medicine, 48, 575-81.engage in greater consumption of alcohol. Thus, the Chesney, M. A., Black, G. W., Chadwick, J. M., &nature of the TABP relationship with the develop- Rosenman, R. H. (1981). Psychological correlatesment of hypertension could be shown to be limited to of the Type A behavior pattern. Journal of Behav-specific components ofTABP and indirect; in that the ioral Medicine, 4, 217-29.correlation was mediated by factors such as workplace Chidester, M. A. (1990). Trends and individual differ-stress and individual behavioral patterns (e.g., alcohol ences in response to short-haul flight operations.consumption). Aviation, Space, and Environmental Medicine, 61,
Overall, the ATCSs in this study were not indi- 132-8.rectly "de-selected" to any significant extent duringthe Academy screen based on their self-reported levelsof Type A behavior pattern. Similarly, evidence con-cerning the utility of achievement striving as a predic-tor of training performance was not supported in thissetting, possibly because the sample comprised an
8
Collins, W. E., Manning, C. A., & Taylor, D. K. Hoelter, J. W. (1983). The analysis of covariance struc-(1984). A comparison of prestrike and poststrike tures: Goodness-of-fit indices. Sociological Meth-ATCS trainees: Biographic factors associated with ods and Research, 11, 325-44.Academy training success. In VanDeventer, A. D., Ivancevich, J. M., & Matteson, M. T. (1988). Type ACollins, W. E., Manning, C. A., Taylor, D. K., & behavior and the healthy individual. BritishJour-Baxter, N. E. Studies ofpoststrike air traffic control nal of Meadcal Psychology, 61, 37-56.specialist trainees: L Age, biographical factors, andselection test performance related to Academy train- Ivancevich, J. M., & Matteson, M. T., & Smith, S. V.ing success. Washington, D.C.: Office of Aviation (1983). Technical Report for Blue Company on SalesMedicine Report, DOT/FAA/AM-84-6. Personnel and Type A Behavior Pattern. Houston,
Collins, W. E., Nye, L. G., & Manning, C. A. (1992). TX: University of Houston, Department of Man-
Poststrike air traffic control trainees: agement.
Biodemographic predictors of success in selection Jamal, M. (1985). Type A behavior and job perfor-and screening. The International Journal ofAvia- mance: Some suggestive findings. Journal of Hu-lion Psychology, 2, 213-23. man Stress, 11, 60-8.
Collins, W. E., Schroeder, D. J., & Nye, L. G. (1991). Jenkins, C.D., Zyzanski, S. J., & Rosenman, R. H.,Relationships of anxiety scores to screening and (1971). Progress toward validation of a computer-training status of air traffic controllers. Aviation, scored test for the Type A coronary-prone behav-Space, and Environmental Medicine, 62,236-40. ior pattern. New England Journal ofMedicine, 23,
Crosbie, J. (1986). A Pascal program to perform the 1271-5.
Bonferroni multistage multiple-correlation proce- Jenkins, C.D., Zyzanski, S. J., & Rosenman, R.H.dure. Behavior Research Methods, Instruments, and (1979). Jenkins Activity Survey (Form C). San An-Computers, 18, 327-9. tonio, TX: Psychological Corporation.
Day, V. D., & Bedeian, A. G. (1991). Workclimate and Jordan, B. E., & Perry, A. R. (1987). Health-risk behav-Type A status as predictors of job satisfaction: A ior and the Type A behavior pattern. Psychologicaltest of the interactional perspective. Journal of Reports, 61, 963-6.Vocational Behavior, 38, 39-52. Joreskog, K. G. & Sorbom, D. (1986). LISREL VI user's
DeFrank, R. S., Jenkins, C. D., & Rose, R. M. (1987). guide. Mooresville, IN: Scientific Software Inc.A longitudinal investigation of the relationships Larzelere, R. E. & Mulaik, S. A. (1977). Single-sampleamong alcohol consumption, psychological fac- tests for many correlations. Psychological Bulletintors, and blood pressure. Psychosomatic Medicine, 84, 557-67.49,236-49.
Friedman, M., & Rosenman, R. H. (1959). Association Lobel, T. E. (1988). Personality correlates of Type A
of specific overt behavior pattern with blood and coronasy-prone behavior. Journal of Personality
cardiovascular findings. Journal of the American Assessment 52,43440.
MedicalAssociation, 169, 1286-96. Manning, C. A., Della Rocco, P. S., & Bryant, K. D.
Glass, D. C., (1977). Behaviorpatterns, stress, and coro- (1989). Prediction of success in FAA air traffic con-
G nar disease., Hilsale, NJ: Erlbaum. trol field training as a function of selection andscreening test perfrmance. Washington, D. C.:
Helmreich, R. L., Sawin, L. L, Carsrud, A. L. (1986). Office of Aviation Medicine Report, DOT/FAA/The Honeymoon effect in job performance: Tern- AM-89-6.poral increases in the predictive power of achieve- Matteson, M. T., Ivancevich, J. M., & Smith, S. V.ment motivation. Journal of Appied Psycholog, (1984). Relation of Type A behavior to perfor-71, 185-8. mance and satisfaction among sales personnel.
Helmreich, R. L., Spence, J. T., & Pred, R. S. (1988). Journal of Vocational Behavior, 25(2), 203-14.Making it without losing it: Type A, achievement Matthews, K. A., Helmreich, R. L., Beane, W. F., &motivation, and scientific attainment revisited. Lucker, G. W. (1980). Pattern A, achievementPersonality and Social Psychology Bulletin, 14, 95- striving, and scientific merit: Does Pattern A help504. or hinder? Journal ofPersonality and Social Psychol-
ogy, 39, 962-7.
9
Nye, L. G., & Collins, W. E. (1993). Some personality Spence, J. T., Helmreich, R. L., & Pred, R. S. (1987).and aptitude characteristics of Air Traffic Control Impatience versus Achievement Strivings in theSpecialist trainees. Aviation, Space, and Environ- Type A pattern: Differential effects on students'mental Medicne, 64, 711-6. health and academic achievement. Journal ofAp-
Pred, R. S., Helmreich, R. L., & Spence, J. T. (1986). plied Psychology, 72, 522-8.
The Jenkins Activity Survey and Type A pattern: Spence, J. T., Pred, R. S., & Helmreich, R. L. (1989).A psychometric analysis. Social and Behavioral Achievement strivings, scholastic aptitude, andScience Documents, 16, 51-3. academic performance: A follow-up to "Impa-
Rock, D. B., Dailey, J. T., Ozur, H., Boone, J. 0., & tience versus achievement strivings in the Type A
Pickrel, E. W. (1982). Selection ofapplicantsfor the pattern". Journal ofApplied Psychology, 74, 176-8.
air traffic controller occupation. Washington, D. Taylor, M. S., Locke, E. A., Lee, C., & Gist, M. (1984).C.: Office of Aviation Medicine Report, DOT/ Type A behavior and faculty research productiv-FAAJAM-82-1 1. ity: What are the mechanisms? Organizational
Rose, R. M., Jenkins, C. D., & Hurst, M. W. (1978). Behavior and Human Perfrmance, 34,402-8.
Air traffic controller health change study. Washing- VanDeventer, A. D. (1984). A follow-up evaluation ofton, D. C.: Office of Aviation Medicine Report, the new aptitude testing procedures for selectionDOT/FAVA/A I-78-39. of FAA air traffic control specialists. In
Schroeder, D. J., Broach D., & Young W. (1993). VanDeventer, A. D., Collins, W. E., Manning, C.
Contributions ofpersonality to the prediction ofsuc- A., Taylor, D. K., & Baxter, N. E. Studies of
cess in initial air traffic control specialist training. poststrike air traffic control specialist trainees:. L Age,
Washington, D.C.: Office of Aviation Medicine Re- biographical factors, and selection test performance
port, DOT/FAAJAM-93/4. related to Academy training success. Washington,D. C.: Office of Aviation Medicine Report, DOT/
Schroeder, D. J., Dollar, C. S., & Nye, L. G. (1990). FAAIAM-84-6.Correlates oftwo experimental tests with performance Waldron, I., Hickey, A., McPherson, C., Butensky, A.,in the FAA Academy air traffic control nonradar Gruss, L., Overall, K., Schmnader, A., & Wohlmuth,screenprogram. Washington, D.C.: Office ofAvia- D. (1980). Type A behavior pattern: Relationshiption Medicine Report, DOT/FAA/AM-90/8. to variation in blood pressure, parental character-
Shull, R. N., Dolgin, D. L., & Gibb, G. D. (1988). The istics, and academic and social activities of stu-relationship between flight training performance, a dents. Journal of Human Stress, 6, 16-27.risk asesment test, and the Jenkins Activity Survey.Pensacola, FL: Naval Aerospace Medical ResearchLaboratory. Report No. NAMRL-1339.
10
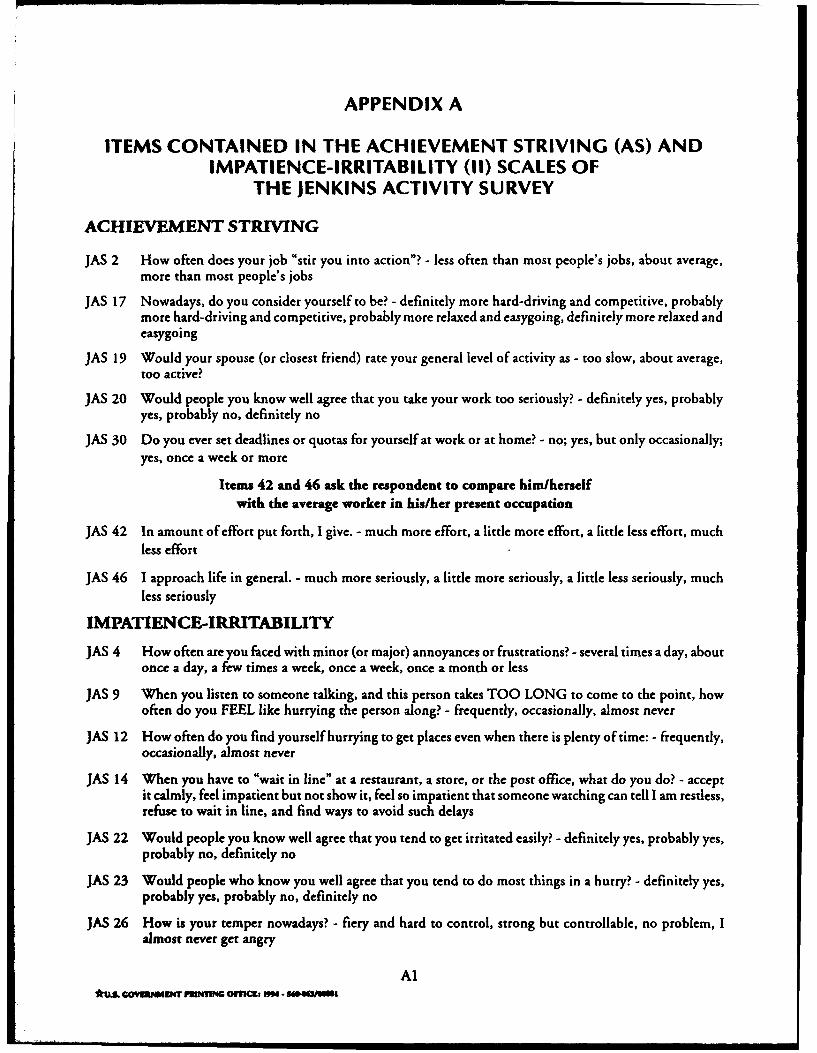
APPENDIX A
ITEMS CONTAINED IN THE ACHIEVEMENT STRIVING (AS) ANDIMPATIENCE-IRRITABILITY (11) SCALES OF
THE JENKINS ACTIVITY SURVEY
ACHIEVEMENT STRIVNG
JAS 2 How often does your job "stir you into action"? - less often than most people's jobs, about average,more than most people's jobs
JAS 17 Nowadays, do you consider yourself to be? - definitely more hard-driving and competitive, probablymore hard-driving and competitive, probably more relaxed and easygoing, definitely more relaxed andeasygoing
JAS 19 Would your spouse (or closest friend) rate your general level of activity as - too slow, about average,too active?
JAS 20 Would people you know well agree that you take your work too seriously? - definitely yes, probablyyes, probably no, definitely no
JAS 30 Do you ever set deadlines or quotas for yourself at work or at home? - no; yes, but only occasionally;yes, once a week or more
Items 42 and 46 ask the respondent to compare him/herselfwith the average worker in his/her present occupation
JAS 42 In amount of effort put forth, I give. - much more effort, a little more effort, a little less effort, muchless effort
JAS 46 I approach life in general. - much more seriously, a little more seriously, a little less seriously, muchless seriously
IMPATIENCE-IRRITABILITY
JAS 4 How often are you faced with minor (or major) annoyances or frustrations? - several times a day, aboutonce a day, a few times a week, once a week, once a month or less
JAS 9 When you listen to someone talking, and this person takes TOO LONG to come to the point, howoften do you FEEL like hurrying the person along? - frequently, occasionally, almost never
JAS 12 How often do you find yourself hurrying to get places even when there is plenty of time: - frequently,occasionally, almost never
JAS 14 When you have to "wait in line" at a restaurant, a store, or the post office, what do you do? - acceptit calmly, feel impatient but not show it, feel so impatient that someone watching can tell I am restless,refuse to wait in line, and find ways to avoid such delays
JAS 22 Would people you know well agree that you tend to get irritated easily? - definitely yes, probably yes,probably no, definitely no
JAS 23 Would people who know you well agree that you tend to do most things in a hurry? - definitely yes,probably yes, probably no, definitely no
JAS 26 How is your temper nowadays? - fiery and hard to control, strong but controllable, no problem, Ialmost never get angry
Al*Us. coamomma FUmwG omccl uw - saiIa l i