relationships between vehicle mass, footprint, and …...relationships between vehicle mass,...
TRANSCRIPT

Relationships between Vehicle Mass, Footprint, and Societal
Risk
Tom Wenzel Lawrence Berkeley National Laboratory
June 17, 2014 Project ID:
LM071
This presentation does not contain any proprietary, confidential, or otherwise restricted information

2
• Start date: Mar 2010 • End date: Sep 2015 • 67% complete
• Barriers addressed – Fuel economy not top criterion
when purchasing vehicle – Mass reduction is a cost-
effective approach to improve fuel economy
– Concern that mass reduction may reduce societal safety
• Total funding to date: $1,267,000
• FY13: $248,000 • FY14: $275,000
Timeline
Budget
Barriers
• DOT National Highway Traffic Safety Administration
• EPA Office of Transportation and Air Quality
Partners
Overview

3
• Objective: Estimate how changes in weight and size of contemporary vehicles would have affected historical societal risk, holding footprint and other variables constant
• Results have enabled NHTSA and EPA to set appropriate new vehicle standards that will encourage down-weighting of vehicles without affecting safety
• These standards will in turn encourage manufacturers to use advanced lightweight materials to reduce new vehicle weight without necessarily reducing size
• Standards will overcome some of the reluctance of consumers to purchase vehicles with high fuel economy
Relevance

4
• Facilitate collaboration among DOE, NHTSA and EPA • Improve upon, and increase transparency of, previous NHTSA
analyses • Phase 1: Replicate NHTSA 2012 regression analysis of US societal
fatality risk per vehicle mile traveled (VMT) – Advise NHTSA on data, variables, and methods
• Phase 2: Conduct separate regression analysis of casualty (fatality + serious injury) risk using data from 13 states – Provide another perspective from NHTSA analysis
• Databases and programs made public, to allow replication of results • Investigate aspects of 2012 analyses • Begin mid-term review of 2017-25 standards, with draft NPRM in
mid-2015
Strategy

5
• NHTSA (1997, 2003, 2010, 2012) and LBNL Phase 1 (2012) – Numerator: US fatalities, from FARS – Denominator: vehicle miles traveled (VMT) – Result: US fatalities per vehicle miles traveled (VMT)
• LBNL Phase 2 (2012) – All data from police-reported crashes in 13 states – Numerator: fatalities or casualties (fatalities + serious injuries) – Denominator: all crash-involved vehicles – Result: 13-state fatalities or casualties per crash – Also two components of casualties per VMT:
• Crash frequency: crashes per mile traveled, using NHTSA weights • Crashworthiness/compatibility: casualties per crash
Two Analytical Approaches
6
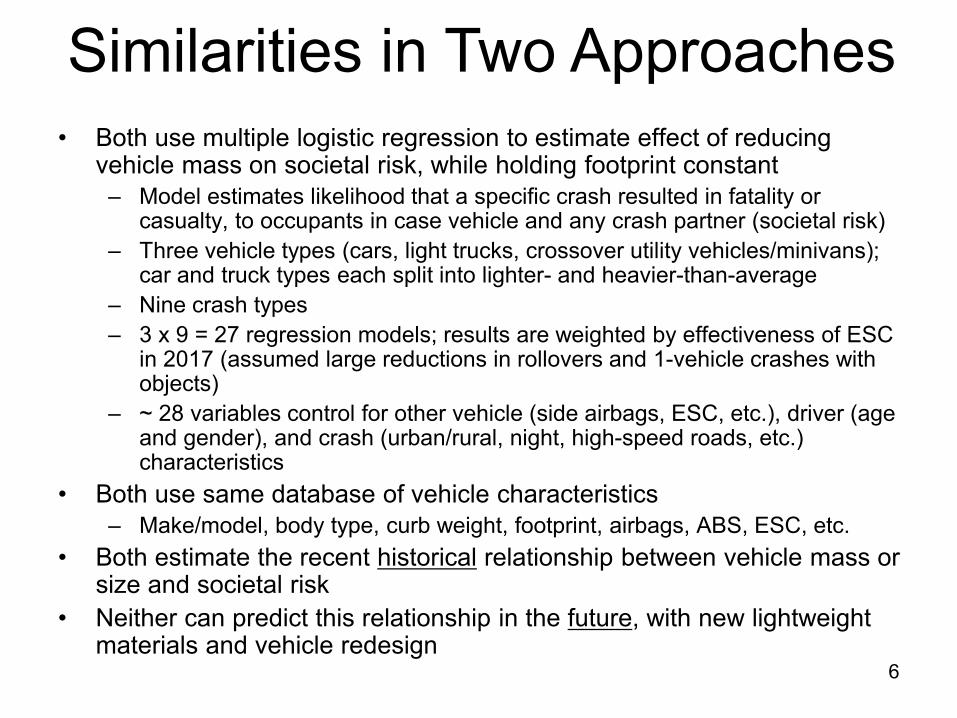
• Both use multiple logistic regression to estimate effect of reducing vehicle mass on societal risk, while holding footprint constant – Model estimates likelihood that a specific crash resulted in fatality or
casualty, to occupants in case vehicle and any crash partner (societal risk) – Three vehicle types (cars, light trucks, crossover utility vehicles/minivans);
car and truck types each split into lighter- and heavier-than-average – Nine crash types – 3 x 9 = 27 regression models; results are weighted by effectiveness of ESC
in 2017 (assumed large reductions in rollovers and 1-vehicle crashes with objects)
– ~ 28 variables control for other vehicle (side airbags, ESC, etc.), driver (age and gender), and crash (urban/rural, night, high-speed roads, etc.) characteristics
• Both use same database of vehicle characteristics – Make/model, body type, curb weight, footprint, airbags, ABS, ESC, etc.
• Both estimate the recent historical relationship between vehicle mass or size and societal risk
• Neither can predict this relationship in the future, with new lightweight materials and vehicle redesign
Similarities in Two Approaches

7
• Benefits of LBNL approach – All data from same source (16 states crash data) – Estimates relationship of mass/size reduction on serious injuries and
fatalities – Allows analysis of two components of risk per VMT
• Crash frequency (crashes per VMT) • Crashworthiness/compatibility (risk once a crash has occurred)
• Drawbacks of LBNL approach – Limited to states that provide Vehicle Identification Number (VIN)
• 16 states in 2012 study; 21 states in 2015 update • Does relationship between weight/size and risk vary by state? • Are 16 or 21 states representative of national relationship?
– May not be enough fatalities in states to also get robust results for fatality risk
Differences in Two Approaches
8
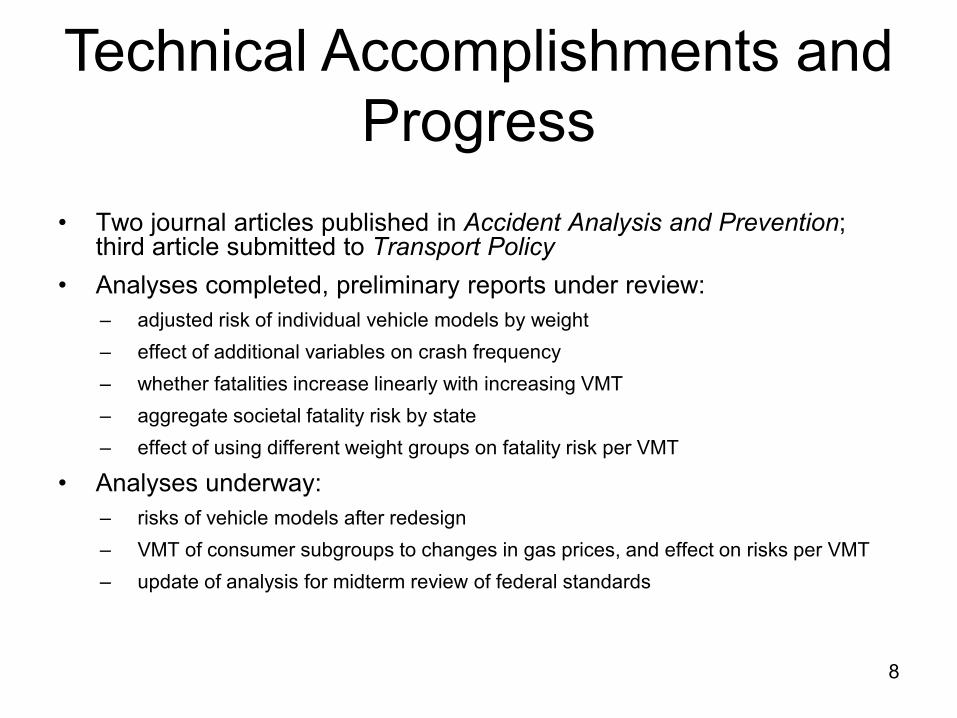
• Two journal articles published in Accident Analysis and Prevention; third article submitted to Transport Policy
• Analyses completed, preliminary reports under review: – adjusted risk of individual vehicle models by weight – effect of additional variables on crash frequency – whether fatalities increase linearly with increasing VMT – aggregate societal fatality risk by state – effect of using different weight groups on fatality risk per VMT
• Analyses underway: – risks of vehicle models after redesign – VMT of consumer subgroups to changes in gas prices, and effect on risks per VMT – update of analysis for midterm review of federal standards
Technical Accomplishments and Progress

9
• Little correlation between US societal fatality risk per VMT and curb weight (or footprint) after adjusting for driver age/gender and crash circumstances – Adjusted risk = Standardized * (Actual / Expected)
• Expected risk: expected fatalities from vehicles/drivers in induced exposure dataset, after accounting for all variables except weight and footprint
• Standardized risk: fatalities assuming standard conditions (50-year old male driver in a 4-year old vehicle on a high-speed road)
– Correlation is highest for 4-door cars (R2=0.60), followed by 2-door cars (R2=0.39)
Conclusions on risk by model (1)
R² = 0.39 R² = 0.60 R² = 0.35 R² = 0.07 R² = 0.09 R² = 0.36 R² = 0.14
0
40
80
120
160
200
240
280
320
900 1100 1300 1500 1700 1900 2100 2300 2500 2700 2900 3100 3300
Adj
uste
d U
S fa
talit
y ris
k (c
rash
fata
litie
s pe
r 101
0 VM
T)
Curb weight (kg)
2-dr cars 4-dr cars Small pickups Fullsize pickups SUVs CUVs Minivans

10
– Even for 4-door cars, adjusted risk can vary dramatically for models of similar weight – Lighter cars with lowest adjusted risk have lower adjusted risk than heaviest cars
Conclusions on risk by model (2)
R² = 0.39 R² = 0.60
0
50
100
150
200
250
300
900 1000 1100 1200 1300 1400 1500 1600 1700 1800 1900
US
fata
lity
risk
stan
dard
ized
to a
vera
ge d
river
and
cra
sh,
(cra
sh fa
talit
ies
per 1
010
VM
T)
Curb weight (kg)
US fatality risk per VMT standardized to average driver, crash & vehicle
2-door 4-door
Galant
Sephia
Spectra IS-300
Protege
Charger
CTS LS
Vibe Jetta
Passat
Rio
Prizm
Mazda6
Sebring
Cobalt


12
• Adding five vehicle/driver variables has little effect on relationship between mass or footprint reduction and crash frequency in cars – adding vehicle price results in small reduction in crash frequency for heavier cars
• Additional variables have similar results for light trucks and CUVs/minivans
Conclusions on crash frequency (2)
1.97
%
1.34
%
0.85
%
1.41
%
-0.1
6%
0.94
%
1.93
%
1.16
%
1.14
%
1.67
%
1.89
%
1.09
%
1.94
%
1.08
%
1.21
%
2.02
%
1.30
%
0.99
%
1.97
%
1.39
%
0.89
%
1.43
%
0.80
%
1.48
%
-1%
0%
1%
2%
3%
UNDERWT OVERWT FOOTPRINT
Per
cent
cha
nge
in c
rash
freq
uenc
y (c
rash
es p
er V
MT)
Estimated effect on crash frequency in cars
Baseline Price Income Makes Record Alc/drug use Belt use All 5+Makes

13
• Linear regression model of state-level fatalities per mile traveled – Fatality risk increases as rural population, percent light trucks, and night driving increases.
Risk is 20% higher in “red” states – Fatality risk decreases as percent young or old drivers, percent minivans or large pickups, and
inclement weather increases. – Risk declines over time (calendar year) – These factors account for much of range in fatality risk across states (model R2 of 0.80)
Other conclusions (1)
-250
-200
-150
-100
-50
0
50
100
RU
RA
L
HH
INC
000
PC
TLT
PC
TUN
BE
LT
PC
TYO
UN
G
PC
TOLD
PC
TMA
LE
PC
TNIG
HT
PC
THIS
PD
PC
TBA
D
PC
TRA
IN
RE
D
PC
TTW
OD
R
PC
TMVA
N
PC
TLG
PU
PC
TLU
XC
AR
CY
94
CY
95
CY
96
CY
97
CY
98
CY
99
CY
00
CY
01
CY
02
CY
03
CY
04
CY
06
CY
07
CY
08
CY
09
CY
10
CY
11
Per
cent
cha
nge
in ri
sk (f
atal
ity p
roba
bilit
y pe
r 101
0 VM
T)
Effect of control variables on societal fatality risk per mile traveled


15
• Generally positive comments • “Regression model should include fewer variables”
– NHTSA and LBNL ran a sensitivity stepwise regression where only statistically-significant variables were included in the model. This sensitivity did not indicate substantially different estimates of the effect of mass reduction on risk from the baseline model.
• “Changes in weight and size of past vehicles cannot be used to predict effect in future vehicle designs” – NHTSA, EPA, and California ARB are all conducting computer-aided
engineering (CAE) studies of the effect of mass reduction on safety in current and future vehicle designs. The results from these CAE studies will be used in conjunction with this study of the statistical, recent historical relationship between mass or size reduction and risk to assess the likely effect they may have on risk in future vehicle designs.
Response to 2013 AMR Reviewer Comments
16
• “No reason to continue study” – Although the 2012 study suggests that mass reduction will not have a
detrimental effect on safety, the fuel economy/GHG emission rulemaking requires a mid-term review of the standards, including their safety implications, by April 2018 (with draft NPRM by April 2015) to determine if the standard levels should be upheld or somehow changed. And the effect on occupant safety of widespread changes in vehicle mass or design to meet the standards will need to be evaluated. Since future rulemakings will continue to use the existing, or similar, methodology, the purpose of this research is to ensure that future analyses continue to be robust and transparent.
Response to 2013 AMR Comments (cont.)

17
Collaboration and Coordination with Other Institutions
• Worked closely with NHTSA, Volpe, and EPA on data, variables, and methodology used in regression analyses
• Responded to all reviewer comments from formal EPA peer review
18
• Conduct additional statistical analysis to further illuminate relationship between vehicle mass, size, and safety – Study risks of vehicle models after redesign – Analyze VMT of consumer subgroups in response to increases
in gas prices, and effect on risks per VMT
• Update analyses for midterm review of federal standards – Model year 2004 to 2011 vehicles in calendar years 2006 to
2012
Proposed Future Work

19
• Regression analyses can inform regulators on what effect standards may have on safety…
• … but cannot predict that effect, especially given extensive use of new technologies and materials that breaks historical relationships
• Findings – There is a wide range in risk by vehicle model, even after accounting for
differences in vehicles, drivers, and crash circumstances. Indicates that manufacturers can mitigate the relationship between vehicle mass and societal risk using careful design
– Adding additional vehicle and driver variables does not change unexpected result of higher crash frequency in lighter vehicles
– Linear regression model of state-level fatality risk shows similar results to logistic model, and explains much of the range in risk
– Using a higher weight “flex-point” for cars lowers the increase in risk for lighter cars, and reduces the risk for heavier cars, from mass reduction
Summary

20
Technical Back-Up Slides

21
1. First-event rollover 2. Crash with stationary object 3. Crash with pedestrian/bicycle/motorcycle 4. Crash with heavy-duty vehicle 5. Crash with car/CUV/minivan less than 3,082 lbs 6. Crash with car/CUV/minivan greater than 3,082 lbs 7. Crash with light truck (pickup/SUV/van) less than 4,150 lbs 8. Crash with light truck (pickup/SUV/van) greater than 4,150 lbs 9. Other (mostly crashes involving 3+ vehicles)
• Market saturation of ESC assumed to reduce fatal crashes by:
– Cars: rollovers by 56%, crashes with objects by 47% – Light trucks/CUVs/minivans: rollovers by 74%, crashes with objects by 45% – All: all other crashes by 8%
Nine crash types

22
• Vehicle – UNDRWT00 (lbs less than average mass; 3,106 lbs for cars, 4,594 lbs for LTs) – OVERWT00 (lbs more than average mass; 3,106 lbs for cars, 4,594 lbs for LTs) – LBS100 (for CUVS/minivans only) – FOOTPRINT (wheelbase times track width) – Type: two-door car, SUV, heavy-duty (200/300 series) pickup, minivan – LT compatibility measure: bumper overlap, blocker beam – 5 side airbag variables: rollover curtain, curtain, torso, combo curtain/torso – ABS, ESC, AWD, vehicle age, if a brand new vehicle
• Driver – Male driver, 8 age variables: years younger/older than 50 (for age groups 14-30,
30-50, 50-70, 70-90, for male and female)
• Crash – At night, in rural county (<250 pop/sq mile), on road with 55+ mph speed limit, in
high-fatality rate state (25 southern/mountain states, plus KS and MO) – Crash occurred in 2002, 2003, 2004, 2005, 2007, or 2008
• Not all variables used for each vehicle or crash type
Control variables

23
• Alternative definitions of risk 1. Weighted by current distribution of fatalities (rather than after 100% ESC) 2. Single regression model across all crash types (rather by crash type) 3. Fatal crashes (rather than fatalities) per VMT 4. Fatalities per induced exposure crash (rather than VMT) 5. Fatalities per registered vehicle-year (rather than VMT)
• Alternative control variables/data 6. Allow footprint to vary with mass (and vice versa) 7. Account for 14 vehicle manufacturers 8. Account for 5 additional luxury vehicle brands 9. Account for initial vehicle purchase price (based on Polk VIN decoder) 10. Exclude CY variables 11. Exclude crashes with alcohol/drugs 12. Exclude crashes with alcohol/drugs, and drivers with poor driving record 13. Account for median household income (based on vehicle zip code, from CA registration
data) 14. Include sports, police, and all-wheel drive cars, and full size vans
• Suggested by peer reviewers 15. Use stopped instead of non-culpable vehicles from 13-state crash data for induced exposure 16. Replace footprint with track width and wheelbase 17. Above two models combined 18. Reweight CUV/minivans by 2010 sales 19. Exclude non-significant control variables
Alternative regression models

24
• 2.3 million non-culpable vehicles involved in two-vehicle crashes in 13 states • 6 crash states (AL, FL, KS, KY, MO, WY) represent states with high fatality rates • 7 crash states (MD, MI, NE, NJ, PA, WA, WI) represent states with low fatality
rates • DRI proposed using 632,000 stopped vehicles involved in two-vehicle crashes
• Assign weight to each crash vehicle so that sum of weights equals total US vehicle registrations (from RL Polk), by MY and model
• Develop schedule of average annual VMT by vehicle age for cars and trucks, using 2001 National Household Travel Survey
• Use average odometer by make and model (from RL Polk) to adjust annual VMT by make and model
Method to estimate registration and VMT weights