relationships between different types and modes of …
TRANSCRIPT

RELATIONSHIPS BETWEEN DIFFERENT TYPES AND MODES OF ARTS-
RELATED EXPERIENCES,
MOTIVATION, AND CIVIC ENGAGEMENT
Donald J. Polzella and Jeremy S. Forbis University of Dayton1
Submitted: 6.23.16
1 This research was supported in part by Research: Art Works Grant #14-3800-7016 from the National Endowment for the Arts. The investigators are grateful also to the University of Dayton Research Institute Office of Contracts and Grants Administration and to the College of Arts and Sciences for providing additional administrative and funding support. The opinions expressed in this paper are those of the author(s) and do not necessarily represent the views of the Office of Research & Analysis or the National Endowment for the Arts. The NEA does not guarantee the accuracy or completeness of the information included in this report and is not responsible for any consequence of its use.

University of Dayton 2
Executive Summary A recent report commissioned by the National Endowment for the Arts (Medvedeva, Novak-Leonard, & Brown, 2012) provides a theoretical context for the present investigation. The report reviews the literature assessing the intrinsic impacts of arts events and helps to clarify these impacts by organizing them into three categories. The first category consists of the constructs that have been measured. These include, for example, happiness and affect, engagement, experienced utility, rewards and efforts, physiological correlates, attendance, participation, and creation. The second category consists of the ways constructs have been measured, which are often obtained from surveys or other qualitative methodologies. The principal focus has been on social and economic well-being, as measured by public activities, interactions with people, values, aspirations, or social institutions and agencies, and income. The third category includes studies that address impact opportunities, particularly those afforded by museums and exhibitions. Of particular interest for this investigation is the second category of intrinsic benefits. We set two goals: (a) to determine the relationship between participation in the arts and pro-social civic engagement, and (b) to determine the motivation that leads to participation in the arts. This is the second of two studies that addressed these goals. The first study, (Polzella & Forbis, 2013) analyzed data from 6257 households who took part in the 2008 U. S. Department of Commerce Current Population Survey: Participation in the Arts Supplement. We analyzed the data in two ways. First, we used logistic regression, in which three specific pro-social behaviors (i.e., voting in the most recent presidential election, making charitable donations or volunteering time, and attending community meetings) were regressed on having or not having attended a live traditional music concert (classical, jazz, or opera). Second, we used structural equation modeling to predict various types of participation in the arts from economic well-being. The first analysis showed that individuals who attended a greater number of music performances over the course of that year had a greater likelihood of voting, a greater likelihood of volunteering or making charitable contributions, and a greater likelihood of participating in community activities. Other theoretically important variables, including age, education, income and the non-autonomous occupational categories remained significant predictors of pro-social behavior. There were both strengths and limitations of the previous investigation. On the positive side, the data were extracted from a Federal database that met rigorous standards for validity and reliability. Another strength is that the results reinforced previous findings, thereby further bolstering arguments for the benefits of arts engagement. A third strength was the finding that the benefits were not exclusive to any one type of participation. A fourth strength was the finding that participation in the arts increased the likelihood of voting. This suggests that individuals who participate in the arts are motivated to influence the behavior and decisions of public servants. Finally, by focusing on what is probably the most common way that individuals participate in the arts, i.e., through direct encounter, the findings can be applied to individuals of varied backgrounds and interests.
University of Dayton 3
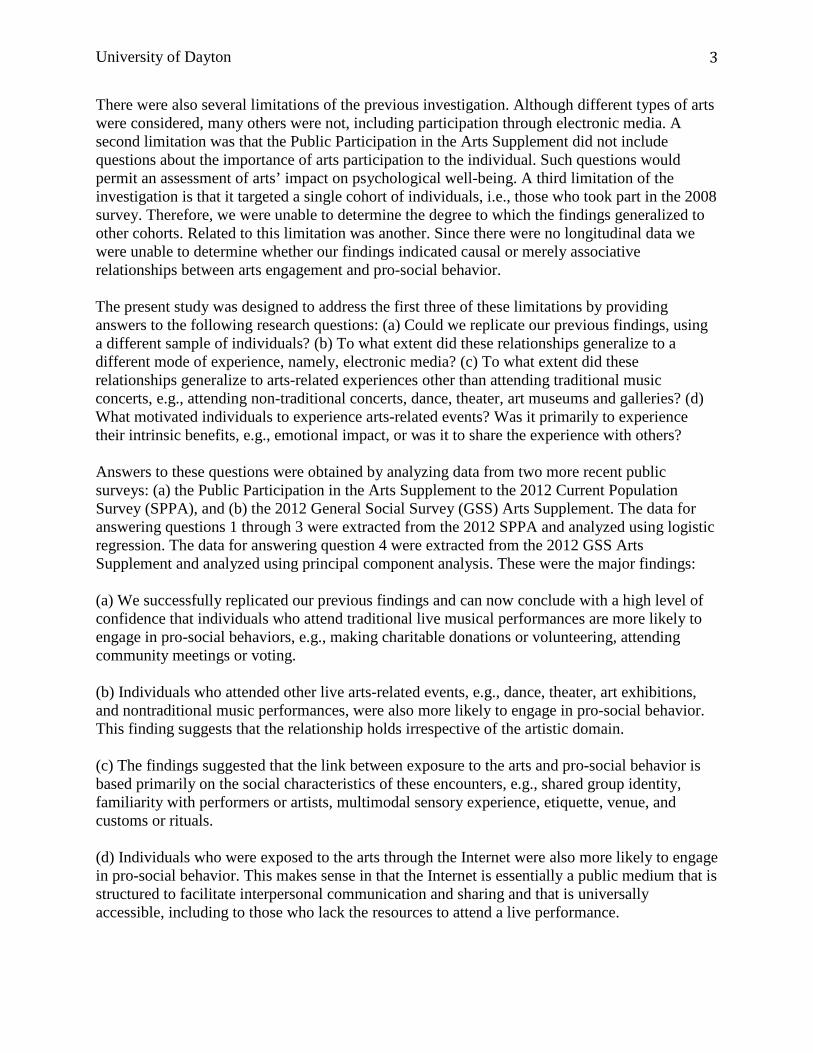
There were also several limitations of the previous investigation. Although different types of arts were considered, many others were not, including participation through electronic media. A second limitation was that the Public Participation in the Arts Supplement did not include questions about the importance of arts participation to the individual. Such questions would permit an assessment of arts’ impact on psychological well-being. A third limitation of the investigation is that it targeted a single cohort of individuals, i.e., those who took part in the 2008 survey. Therefore, we were unable to determine the degree to which the findings generalized to other cohorts. Related to this limitation was another. Since there were no longitudinal data we were unable to determine whether our findings indicated causal or merely associative relationships between arts engagement and pro-social behavior. The present study was designed to address the first three of these limitations by providing answers to the following research questions: (a) Could we replicate our previous findings, using a different sample of individuals? (b) To what extent did these relationships generalize to a different mode of experience, namely, electronic media? (c) To what extent did these relationships generalize to arts-related experiences other than attending traditional music concerts, e.g., attending non-traditional concerts, dance, theater, art museums and galleries? (d) What motivated individuals to experience arts-related events? Was it primarily to experience their intrinsic benefits, e.g., emotional impact, or was it to share the experience with others? Answers to these questions were obtained by analyzing data from two more recent public surveys: (a) the Public Participation in the Arts Supplement to the 2012 Current Population Survey (SPPA), and (b) the 2012 General Social Survey (GSS) Arts Supplement. The data for answering questions 1 through 3 were extracted from the 2012 SPPA and analyzed using logistic regression. The data for answering question 4 were extracted from the 2012 GSS Arts Supplement and analyzed using principal component analysis. These were the major findings: (a) We successfully replicated our previous findings and can now conclude with a high level of confidence that individuals who attend traditional live musical performances are more likely to engage in pro-social behaviors, e.g., making charitable donations or volunteering, attending community meetings or voting. (b) Individuals who attended other live arts-related events, e.g., dance, theater, art exhibitions, and nontraditional music performances, were also more likely to engage in pro-social behavior. This finding suggests that the relationship holds irrespective of the artistic domain. (c) The findings suggested that the link between exposure to the arts and pro-social behavior is based primarily on the social characteristics of these encounters, e.g., shared group identity, familiarity with performers or artists, multimodal sensory experience, etiquette, venue, and customs or rituals. (d) Individuals who were exposed to the arts through the Internet were also more likely to engage in pro-social behavior. This makes sense in that the Internet is essentially a public medium that is structured to facilitate interpersonal communication and sharing and that is universally accessible, including to those who lack the resources to attend a live performance.

University of Dayton 4
(e) There were numerous reasons that individuals were drawn to the arts. But most important was that the reasons for attending did not operate independently of one another, and considering them in isolation would be misleading. All reports and other documents produced through this grant will be stored in eCommons, a digital archive of the research and creative works produced by University of Dayton scholars and artists. Hosted by Digital Commons ( < http://digitalcommons.bepress.com >), eCommons meets the 2010 Americans with Disabilities Act Standards for Accessible Design. Future research will be used to build a model that explicates the relationship between a broad spectrum of arts-related experiences and varieties of civic engagement.

University of Dayton 5
Literature Review It is well established that participation in the arts can enhance cognitive performance (Corrigall & Trainor, 2011; Moreno, Bialystok, et al., 2011; Schellenberg, 2004, 2011a, 2011b; Schellenberg & Mankarious, 2012; Winner & Hetland, 2000; Winner et al., 2006). Furthermore, some of the neurological processes underlying these benefits are now understood (Ehrlich, 2015; Gute & Gute, 2015; Hardiman, et al., 2009; Marcus, 2012; Peretz & Zatorre, 2003; Zatorre, 2005). Participation in the arts is beneficial in other ways. The National Endowment for the Arts (NEA) has formulated an ambitious five-year research framework to increase “public knowledge and understanding about [these benefits] so that, as a direct outcome, evidence of the value and impact of the arts is expanded and promoted” (National Endowment for the Arts, 2012, p. 32). A good example of this line of research is Catterall, Dumais, and Hampden-Thompson’s (2012) recent NEA report summarizing the findings of four large-scale government surveys that assessed the relationship between arts participation, academic achievement, and civic behavior among at-risk youth. It was found that participation in the arts, whether occurring within or outside of school, led to better academic performance and to greater involvement in civic behavior, such as participating in student government and service clubs, visiting libraries and reading books, and volunteering in the community. In addition, graduates who had participated in the arts as students chose professionally oriented majors when beginning college and were more likely to vote in local or national elections. A useful strategy for understanding these benefits is to focus on audience members rather than on artists or performers (Brown & Novak, 2007). A recent report commissioned by the National Endowment for the Arts (Medvedeva, Novak-Leonard, J. & Brown, 2012) helps to clarify audience impacts by organizing the research literature into three categories. The first category consists of the constructs that have been measured. These include, for example, happiness and affect, engagement, experienced utility, rewards and efforts, physiological correlates, attendance, participation, and subsequent creative behaviors. The second category consists of commonly used qualitative measures of affect, happiness, and personal satisfaction. The principal focus here has been on social well-being, as measured by public activities, interactions with people, values, aspirations, and participation in social institutions and agencies. The third category includes studies that address audience venues, such as concert halls, theaters, and museums. In a previous study (Polzella & Forbis, 2013) we focused on the second category and explored the relationship between audience participation and social and economic well-being. The data were obtained by from 6257 households who took part in the 2008 U. S. Department of Commerce Current Population Survey: Participation in the Arts Supplement. The data were analyzed in two ways. First, using logistic regression, three specific pro-social behaviors (i.e., voting in the most recent presidential election, making charitable donations or volunteering time, and attending community meetings) were regressed on what the NEA considers “traditional” music audience participation (i.e., attending classical, jazz, or opera music concerts). Second, using structural equation modeling, economic well-being was used to predict participation in arts-related events.

University of Dayton 6
The first analysis showed that individuals who attended a greater number of music performances over the course of the previous year were approximately one and one-half times more likely to vote, two times more likely to volunteer time or contribute to charities, and two times more likely to participate in community activities. The second analysis showed that indicators of economic well-being were associated with greater participation in traditional arts-related events. There were both strengths and limitations of that earlier study. On the positive side, the data we analyzed met rigorous psychometric standards, because they were extracted from a principal U.S. Government database. The results also expanded previous findings, thereby bolstering arguments for the broad range of benefits of arts engagement. In particular, the finding that audience members were more likely to vote suggested that individuals who participate in the arts are motivated to influence the behavior and decisions of public servants. There were also several limitations of the earlier study. First, it targeted only a single cohort of individuals, i.e., those who took part in the 2008 survey. We do not yet know whether or the degree to which the findings generalize to other cohorts. A second limitation was that only one type of live arts-related experience, i.e., traditional music audience participation, was considered. There are many other categories of live experiences including attending “nontraditional” music concerts (e.g., rock, pop, rhythm and blues, country), visiting art museums and galleries, attending outdoor festivals, and reading. A third limitation was that the most frequent mode of engagement with the arts, i.e., electronic media (see Novak-Leonard and Brown, 2011), was not considered. A fourth limitation was that the Public Participation in the Arts Supplement did not include questions concerning the reasons individuals participate in the arts. Finally, because the survey did not include longitudinal data, we were unable to determine whether our findings indicated causal or merely associative relationships between arts engagement and pro-social and economic well-being.
The Present Study The present study was designed to address the first three of these limitations by providing answers to the following research questions: (a) Could we replicate our previous findings, using a different sample of individuals? (b) To what extent did these relationships generalize to a different mode of experience, namely, electronic media? (c) To what extent did these relationships generalize to arts-related experiences other than attending traditional music concerts, e.g., attending non-traditional concerts, dance, theater, art museums and galleries? (d) What motivated individuals to experience arts-related events? Was it primarily to experience their intrinsic benefits, e.g., emotional impact, or was it to share the experience with others? Answers to these questions were obtained by analyzing data from two major public surveys: (a) the Public Participation in the Arts Supplement (SPPA) to the 2012 Current Population Survey, and (b) the 2012 General Social Survey (GSS) Arts Supplement. The data for answering questions 1 through 3 were extracted from the 2012 SPPA. The data for answering question 4 were extracted from the 2012 GSS Arts Supplement. The Current Population Survey and the Supplemental Survey of Public Participation in the Arts

University of Dayton 7
The Current Population Survey (CPS, < http://www.census.gov/cps/ >), managed jointly by the US Census Bureau and the US Bureau of Labor Statistics, is the principal source of high-profile economic statistics as well as extensive demographic data and behavioral information that, together, provide a comprehensive understanding of labor market conditions in the nation overall. The CPS is administered monthly to a random sample of 57,000 individuals. It has its origins in the 1930s, when it was used as a means of tracking unemployment during the Great Depression. It has been updated numerous times since then in order to account for significant changes in the national economy. In certain years, the CPS has included a Survey of Public Participation in the Arts (SPPA). This supplemental survey, developed by the NEA, included items that measure the household member’s participation in various arts-related activities, e.g., frequency of participation, training and exposure, musical and artistic preferences, length of travel for trips to arts-related events, school-age socialization, and computer usage related to arts information. In our earlier study, we analyzed data from the 2008 supplemental survey. In this case, we analyzed data from the 2012 supplemental survey, which is the most recent version. Because the 2008 and 2012 SPPA surveys were similar, the two cohorts could be compared on numerous dimensions.
The General Social Survey (GSS) Funded by the Sociology Program of the National Science Foundation, the General Social Survey (GSS, < http://www3.norc.org/gss+website/ >) is administered by the National Opinion Research Center (NORC) at the University of Chicago. Aside from the U.S. Census, it is the most frequently analyzed database of social science information. The GSS has been conducted nearly every year since 1972 to approximately 1500 individuals and contains data on over 5500 variables. Although longitudinal trends are not the focus of the present study, the GSS does include time-trend data for over 2000 of these variables. Like the 2012 CPS, the 2012 GSS included an Arts Supplement. But there were important differences. Whereas the SPPA focused on the frequency of individuals’ participation in various arts-related activities, the principal focus of the GSS Arts Supplement was on the reasons that individuals did or did not attend arts-related events. Included were questions on type of event, whether they attended with others; the importance of cost, time, distance, venue, or to support community activities; the desire to socialize with friends; and whether they attended in order to learn about or experience great artistic works.
Method Participants The number of participants ranged between 586 and 3009. Participants received alternative forms of the SSPA and GSS surveys, which resulted in different numbers of participants for each data analysis.

University of Dayton 8
Data Analyses Appendix A lists the SPPA survey variables that provided the data and describes how each was coded. Logistic regression was used to analyze these data. Appendix B lists the GSS arts supplement variables. Principal component analysis, a factor analytic procedure, was used to analyze these data. To answer the first question, regarding the replicability of our earlier findings (Polzella & Forbis, 2013), we repeated the same procedures, this time applied to the 2012 SPPA. The analysis measured the relationships between attending traditional music concerts and engaging in two types of civic engagement: (a) making charitable donations or volunteering time, and (b) attending community meetings. [Note: Unlike the 2008 SPPA, the 2012 SPPA did not include a question addressing whether the participant voted in the most recent presidential election.] In technical terms, civic engagements, i.e., the criterion variables, were regressed on having or not having attended musical concerts, i.e., the predictor variables. All variables were assigned binary values, such that 1 = observed and 0 = not observed. Appendix C contains a more detailed technical description of logistic regression analysis. To answer the second research question, regarding the difference between live versus media encounters with the arts, we computed separate logistic regression analyses for each pro-social behavior, treated as criterion variables along with the data for the two modes of arts-related experiences, treated as predictor variables. To answer the third research question, regarding the relative strengths of association between different types of arts-related experiences and pro-social behaviors, we computed separate logistic regression analyses for each pro-social behavior, treated as criterion variables, along with the data for the various arts-related experiences, treated as predictor variables. Each regression model included seven control variables, which are known to predict civic engagement: Age, Race, Sex, Income, Education, Marital Status, and Occupation Class. To measure occupational class, we used a conventional six-category scheme (Goldthorpe 1987; Hout 1989; Manza, Hout & Brooks, 1995): (a) business owners and proprietors (including farm owners and the self-employed), (b) managers and administrators, (c) professional and technical workers, (d) clerical workers, (e) skilled and unskilled laborers, and (f) service workers. To test for occupational class, we created a binary “class gap” measure that contrasted non-working class individuals, i.e., those in the first three categories, with working class individuals, i.e., those in the last three categories. We included the working class occupations in our analyses and used the non-working class occupations as a reference group of individuals who possess a relatively greater degree of capital autonomy or authority. Principal component analyses of the data contained in the 2012 GSS Arts Supplement was used to address the fourth research question, regarding the reasons that individuals attend arts-related events. Each analysis focused on one of four outcomes: (a) reasons for attending a live performance, (b) reasons for not attending a live performance, (c) reasons for attending an art exhibit, or (d) reasons for not attending an art exhibit. In technical terms, each principal component analysis summarized the results by identifying higher order latent constructs that were derived from response similarities between pairs of variables, i.e., reasons for attending/not

University of Dayton 9
attending. Appendix D provides a more complete technical description of principal component analysis. (See O’Rourke & Hatcher, 2013, Chapter 1.)
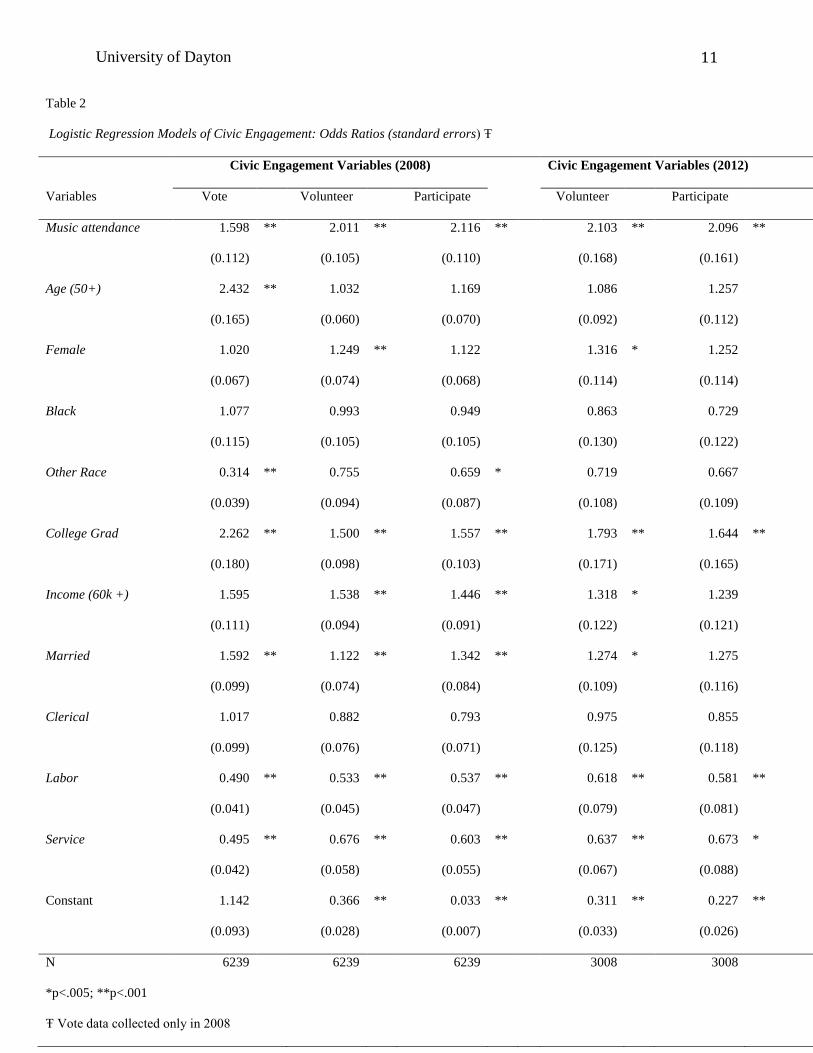
Results Strategy for Reporting the Results The primary goal of this project was to provide evidence of the value and impact of the arts. As described above, we used logistic regression or principal component analysis to provide answers to the four research questions. While this final report follows the usual format for reporting scientific findings, it was also important that the evidence be reported in a manner that would be intelligible to a variety of stakeholders, including those who might not possess scientific expertise. In the case of logistic regression, it is helpful to express the findings as odds likelihood ratios. This is the strategy we followed in our earlier study (Polzella & Forbis, 2013). For example, in one analysis we found a significant relationship between attending a musical performance and volunteering or contributing to charity. In addition to reporting this finding in the form of a regression coefficient, we were able to state that individuals who attended a greater number of musical performances over the course of the year were “twice as likely” to volunteer or contribute to charity. In the case of principal component analysis we followed the standard approach for presenting the results of a factor analysis, by constructing a table showing the variables, factor loadings, communalities, eigenvalues, and percentages of variance. (See Nicol & Pexman, 1999, Chapter 9.) Replication Table 1 shows descriptive statistics for the 2008 and 2012 SPPA databases. Although there were fewer respondents in the 2012 survey, the numbers exceeded the minimum threshold needed for most multivariate analyses (Stevens, 2009). With few exceptions, the samples were comparable. The largest discrepancies were a decrease in community engagement, an increase in “other” races, a decrease in married participants, and an increase in service-sector employees. As expected (Novak-Leonard & Brown, 2011), a greater proportion of respondents experienced the arts through electronic means rather than through live attendance. Table 2 compares the regression models derived from the 2008 and 2012 SPPA databases. The data are expressed as odds ratios, computed after accounting for variance due to inter-correlations among the variables. The table rows correspond to the predictor variables, the columns to the criterion variables. For example, in 2008, individuals who attended music concerts were 2.011 times more likely to volunteer than those who did not. In 2012, the ratio was nearly identical (2.103). The other odds ratios followed the same pattern. Table 3 compares the odds ratios obtained for each type of concert. It is clear that the previous findings were confirmed.

University of Dayton 10
University of Dayton 11
Table 2
Logistic Regression Models of Civic Engagement: Odds Ratios (standard errors) Ŧ
Civic Engagement Variables (2008) Civic Engagement Variables (2012)
Variables Vote Volunteer Participate Volunteer Participate
Music attendance 1.598 ** 2.011 ** 2.116 ** 2.103 ** 2.096 **
(0.112) (0.105) (0.110) (0.168) (0.161)
Age (50+) 2.432 ** 1.032 1.169 1.086 1.257
(0.165) (0.060) (0.070) (0.092) (0.112)
Female 1.020 1.249 ** 1.122 1.316 * 1.252
(0.067) (0.074) (0.068) (0.114) (0.114)
Black 1.077 0.993 0.949 0.863 0.729
(0.115) (0.105) (0.105) (0.130) (0.122)
Other Race 0.314 ** 0.755 0.659 * 0.719 0.667
(0.039) (0.094) (0.087) (0.108) (0.109)
College Grad 2.262 ** 1.500 ** 1.557 ** 1.793 ** 1.644 **
(0.180) (0.098) (0.103) (0.171) (0.165)
Income (60k +) 1.595 1.538 ** 1.446 ** 1.318 * 1.239
(0.111) (0.094) (0.091) (0.122) (0.121)
Married 1.592 ** 1.122 ** 1.342 ** 1.274 * 1.275
(0.099) (0.074) (0.084) (0.109) (0.116)
Clerical 1.017 0.882 0.793 0.975 0.855
(0.099) (0.076) (0.071) (0.125) (0.118)
Labor 0.490 ** 0.533 ** 0.537 ** 0.618 ** 0.581 **
(0.041) (0.045) (0.047) (0.079) (0.081)
Service 0.495 ** 0.676 ** 0.603 ** 0.637 ** 0.673 *
(0.042) (0.058) (0.055) (0.067) (0.088)
Constant 1.142 0.366 ** 0.033 ** 0.311 ** 0.227 **
(0.093) (0.028) (0.007) (0.033) (0.026)
N 6239 6239 6239 3008 3008
*p<.005; **p<.001
Ŧ Vote data collected only in 2008

University of Dayton 12

University of Dayton 13
Table 4
Logistic Regression Models of Civic Engagement With Live and Electronic Exposure to Traditional Music:
Odds Ratios (standard errors)
Volunteer
Participat
e Volunteer
Participat
e
Music Attendance 1.723
*
* 1.961
*
* Dance 1.387 1.427
(0.320) (0.362) (0.405) (0.429)
Classical
Attendance 2.297 * 1.857 * Theater
1.735
** 2.675
*
*
(0.787) (0.611) (0.378) (0.606)
Jazz Attendance 1.887 * 2.272
*
* Visual Arts 2.896 ** 3.953
*
*
(0.616) (0.754) (0.663) (0.999)
Opera Attendance 1.868 3.541
*
* Other Music 1.607 * 2.498
*
*
(0.954) (1.842) (0.417) (0.679)
N 586 586 N 586 586
Volunteer
Participat
e Volunteer
Participat
e
e-Music 2.035
*
* 2.141 * e-Dance
2.273
** 2.256
*
*
(0.451) (0.500) (0.580) (0.585)
e-Classical 2.698
*
* 2.877
*
* e-Theater 2.424 ** 2.112
*
*
(0.711) (0.758) (0.801) (0.689)

University of Dayton 14
e-Jazz Attendance 1.381 2.259 * e-Visual Arts 1.387 2.348
*
*
(0.370) (0.635) (0.338) (0.598)
e-Opera Attendance 4.111
*
* 4.004
*
*
e-Other
Music 1.489 ** 1.976
*
*
(1.671) (1.569) (.277) (0.435)
N 586 586 N 586 586
*p<.005, **p<.001

University of Dayton 15
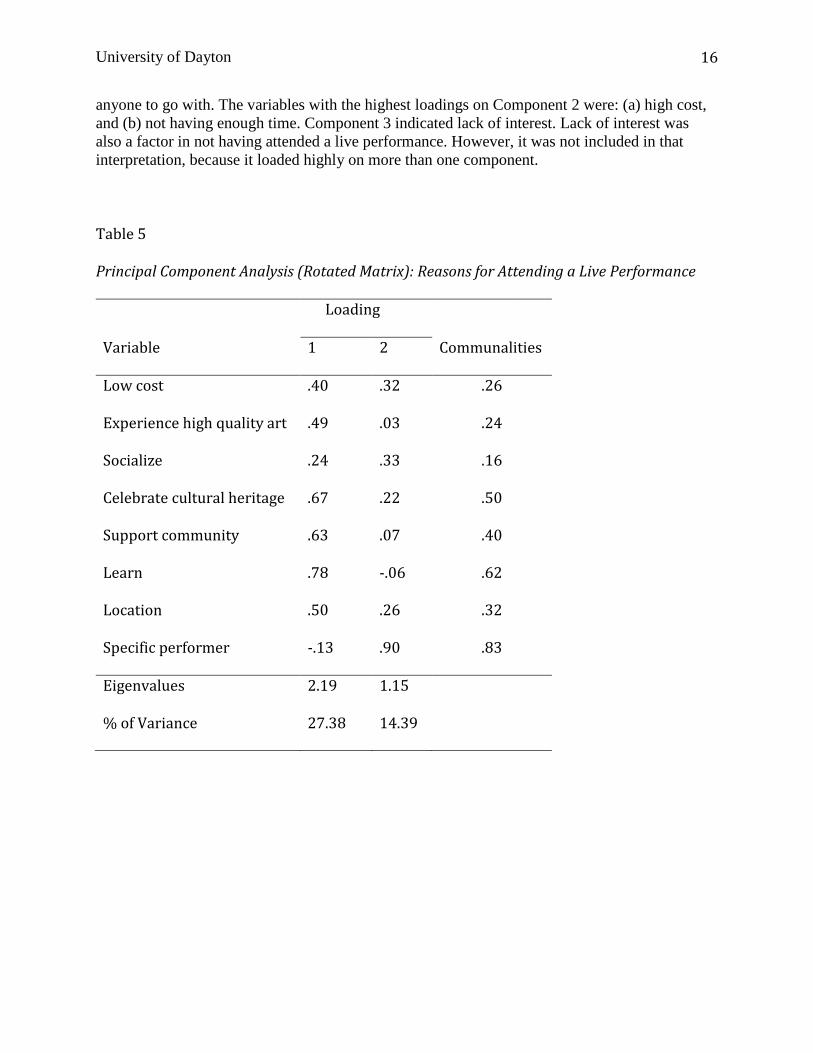
Exposure to Live Versus Electronic Arts-Related Performances and Civic Engagement Table 4 compares the odds ratios for live versus electronic arts-related performances. The table shows traditional types of music along with several other categories, such as dance, theater, visual arts, and nontraditional music. In the majority of cases, both live and electronic engagements were associated with greater likelihoods of volunteer or community activity. Motivation to Experience Live Arts-Related Events The GSS 2012 survey included questions that identified the reasons that individuals choose to attend live arts-related events. Blume-Kohout, Leonard, and Novak-Leonard (2015) summarized the findings in a recent NEA report: (a) socializing with friends or family was the most common motivation for attending arts-related events, especially live performances; (b) the desire to learn new things was also a motivation, especially visual arts exhibitions; (c) lack of time was the most common reason for not attending; (d) other reasons for not attending included cost, difficulty in getting to the venue, and not having anyone to go with. In the present study, we used principal component analysis to examine these findings in greater detail. The principal component analysis of the reasons for having attended a live performance is summarized in Table 5. The variables with the highest loadings on Component 1 were: (a) wanting to experience high quality art, (b) wanting to celebrate cultural heritage, (c) wanting to support community, (d) wanting to learn, and (e) desirable location. Component 1 appeared to reflect reasons that were unrelated to the particular performance, whereas Component 2 did, in this case, a desire to see or hear the scheduled performer. Curiously, wanting to socialize had little or no impact on the interpretation. Table 6 summarizes the analysis of the reasons for not having attended a live performance. Here, three components were retained. The variables with the highest loadings on Component 1 were: (a) too difficult to get there, and (b) not having anyone to go with. Component 1 appeared to reflect the need for company when traveling to a remote location. Component 2 reflected not having sufficient time to attend, whereas Component 3 reflected the cost to attend. Table 7 summarizes the analysis of the reasons for having attended an art exhibit. Two components were retained. The variables with the highest loadings on Component 1 were: (a) wanting to experience high quality art, (b) wanting to learn, and (c) desirable location. Component 1 appeared to reflect a desire to view and learn about specific pieces exhibited in a good location. All the remaining variables had the highest loadings on Component 2: (a) low cost, (b) wanting to socialize, (c) wanting to celebrate a cultural heritage, and (d) wanting to support one’s community. Component 2 appeared to capture pro-social behavior in a low cost environment. Of the four analyses, this one was interpreted most easily. Table 8 summarizes the reasons for not having attended an art exhibit. In general, the results were similar to those for not having attended a live performance (cf. Table 6). Three components were retained. The variables with the highest loadings on Component 1 reflected the need for company when traveling to a remote location: (a) too difficult to get to, and (b) not having
University of Dayton 16
anyone to go with. The variables with the highest loadings on Component 2 were: (a) high cost, and (b) not having enough time. Component 3 indicated lack of interest. Lack of interest was also a factor in not having attended a live performance. However, it was not included in that interpretation, because it loaded highly on more than one component. Table 5
Principal Component Analysis (Rotated Matrix): Reasons for Attending a Live Performance
Loading
Variable 1 2 Communalities
Low cost .40 .32 .26
Experience high quality art .49 .03 .24
Socialize .24 .33 .16
Celebrate cultural heritage .67 .22 .50
Support community .63 .07 .40
Learn .78 -.06 .62
Location .50 .26 .32
Specific performer -.13 .90 .83
Eigenvalues 2.19 1.15
% of Variance 27.38 14.39

University of Dayton 17
Table 6
Principal Component Analysis (Rotated Matrix): Reasons for Not Attending a Live
Performance
Loading
Variable 1 2 3 Communalities
High cost -.16 .28 .79 .73
Lack of interest .05 .75 .13 .58
Getting there .81 .04 -.06 .67
No one to go with .77 .12 .11 .61
No time -.26 .30 -.72 .68
Undesirable location .11 .75 -.10 .58
Eigenvalues 1.36 1.31 1.19
% of Variance 22.60 21.83 19.80

University of Dayton 18
Table 7
Principal Component Analysis (Rotated Matrix): Reasons for Attending an Art Exhibit
Loading
Variable 1 2 Communalities
Low cost .10 .56 .32
Experience high quality art .74 -.03 .55
Socialize -.05 .62 .39
Celebrate cultural heritage .34 .61 .49
Support community .03 .70 .49
Learn .78 .04 .62
Location .58 .23 .39
Eigenvalues 1.64 1.62
% of Variance 23.41 23.07

University of Dayton 19
Table 8
Principal Component Analysis (Rotated Matrix): Reasons for Not Attending an Art Exhibit
Loading
Variable 1 2 3 Communalities
High cost -.08 -.70 .31 .60
Lack of interest .02 -.02 .91 .84
Getting there .68 .11 -.28 .55
No one to go with .72 -.16 .22 .59
No time -.42 .66 .23 .66
Undesirable location .47 .49 .18 .50
Eigenvalues 1.37 1.21 1.14
% of Variance 22.89 20.14 19.07

University of Dayton 20
Discussion Arts-Related Exposure Through Live Performance The present findings along with those of Polzella and Forbis (2013) indicate that a strong relationship between traditional music audience participation and civic engagement has persisted more or less unchanged from 2008 through 2012. Apparently the relationship extends to nontraditional music as well. In their study of the musical preferences of young adolescents, Leung and Kier (2008) found significant relationships between many different types of music and civic activism, including world music, new age, heavy metal, ska, blues, folk, bluegrass, as well as classical. In addition to music, the present findings indicate that other forms of arts-related experiences, e.g., theater and visual arts, are also related to civic engagement. An analysis of the music audience experience may help in understanding this relationship. Reacting to the music itself may have primary importance, but extra-musical aspects are also an essential part of the experience. A principal component analysis of classical music concert attendees’ experiences (Thompson, 2007) revealed five coherent extra-musical components: anticipation and shared experience, mood, familiarity with performers or venue, distraction and boredom, and visual aspects. Under certain circumstances, visual cues have primacy over auditory cues (Tsay, 2013). Another important determinant of listening enjoyment is what Wilson, Marczynski, and O’Brien (2014) call “psychological setting.” This includes such factors as concert etiquette, venue, and rituals. Many of these extra-musical variables have a social component, an inherent characteristic of civic engagement, as well. Altruistic civic engagement, in particular, may be beneficial to the individual. Konrath, Fuhrel-Forbis, Lou, and Brown (2012) found that socially motivated volunteers had a lower mortality risk than did self-motivated volunteers. Arts-Related Exposure through Electronic Media A major objective of this study was to determine whether exposure to the arts through electronic media predicted civic engagement and to see whether this prediction was comparable to that for live exposure. As shown in Table 4, electronic exposure to a variety of arts-related performances was a strong predictor of civic engagement. Previous studies may help in understanding this finding. In a survey of university students, Potter, Lee, and Rubenking (2011) correlated individual differences in motivational style with preferences for media genres and programming types. Motivational style was assessed as either appetitive or defensive. Individuals motivated primarily through the appetitive activation system tend to be more sensation-seeking and approach-oriented. Those motivated primarily through the defensive activation system tend to be calmer, avoidance-oriented and value predictability. Appetitive individuals preferred more intense programming, such as alternative rock, classic rock, or rap, whereas defensive individuals preferred more popular genres, such as country, soft rock, or top 40. A preference for electronic traditional music (i.e., classical, jazz) was unrelated to motivational style. This suggests that the relationship between electronic traditional performances and civic engagement is mediated by something other than motivational style.
University of Dayton 21
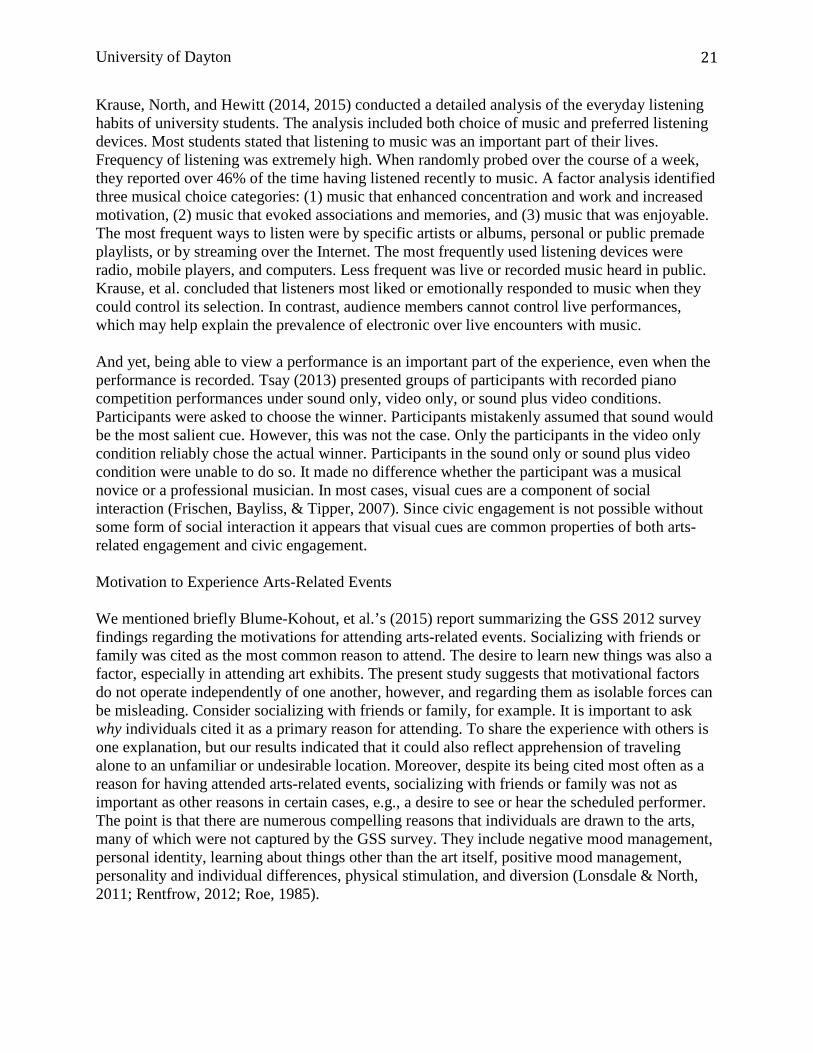
Krause, North, and Hewitt (2014, 2015) conducted a detailed analysis of the everyday listening habits of university students. The analysis included both choice of music and preferred listening devices. Most students stated that listening to music was an important part of their lives. Frequency of listening was extremely high. When randomly probed over the course of a week, they reported over 46% of the time having listened recently to music. A factor analysis identified three musical choice categories: (1) music that enhanced concentration and work and increased motivation, (2) music that evoked associations and memories, and (3) music that was enjoyable. The most frequent ways to listen were by specific artists or albums, personal or public premade playlists, or by streaming over the Internet. The most frequently used listening devices were radio, mobile players, and computers. Less frequent was live or recorded music heard in public. Krause, et al. concluded that listeners most liked or emotionally responded to music when they could control its selection. In contrast, audience members cannot control live performances, which may help explain the prevalence of electronic over live encounters with music. And yet, being able to view a performance is an important part of the experience, even when the performance is recorded. Tsay (2013) presented groups of participants with recorded piano competition performances under sound only, video only, or sound plus video conditions. Participants were asked to choose the winner. Participants mistakenly assumed that sound would be the most salient cue. However, this was not the case. Only the participants in the video only condition reliably chose the actual winner. Participants in the sound only or sound plus video condition were unable to do so. It made no difference whether the participant was a musical novice or a professional musician. In most cases, visual cues are a component of social interaction (Frischen, Bayliss, & Tipper, 2007). Since civic engagement is not possible without some form of social interaction it appears that visual cues are common properties of both arts-related engagement and civic engagement. Motivation to Experience Arts-Related Events We mentioned briefly Blume-Kohout, et al.’s (2015) report summarizing the GSS 2012 survey findings regarding the motivations for attending arts-related events. Socializing with friends or family was cited as the most common reason to attend. The desire to learn new things was also a factor, especially in attending art exhibits. The present study suggests that motivational factors do not operate independently of one another, however, and regarding them as isolable forces can be misleading. Consider socializing with friends or family, for example. It is important to ask why individuals cited it as a primary reason for attending. To share the experience with others is one explanation, but our results indicated that it could also reflect apprehension of traveling alone to an unfamiliar or undesirable location. Moreover, despite its being cited most often as a reason for having attended arts-related events, socializing with friends or family was not as important as other reasons in certain cases, e.g., a desire to see or hear the scheduled performer. The point is that there are numerous compelling reasons that individuals are drawn to the arts, many of which were not captured by the GSS survey. They include negative mood management, personal identity, learning about things other than the art itself, positive mood management, personality and individual differences, physical stimulation, and diversion (Lonsdale & North, 2011; Rentfrow, 2012; Roe, 1985).
University of Dayton 22
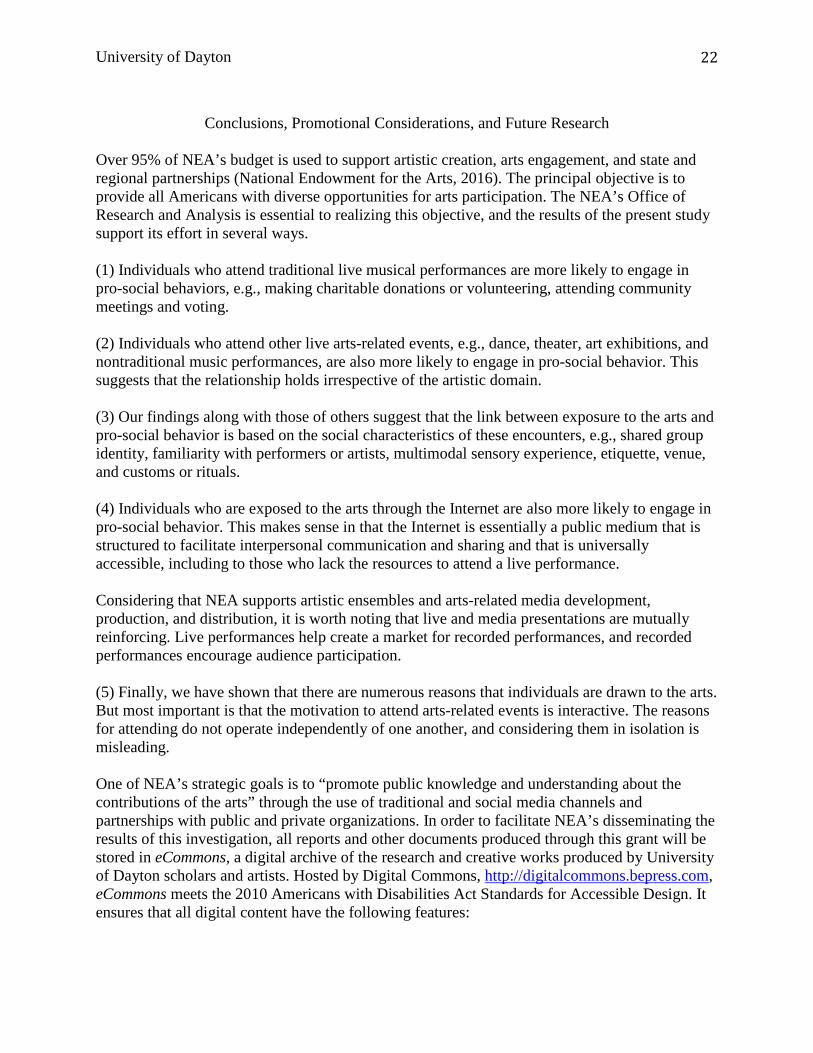
Conclusions, Promotional Considerations, and Future Research
Over 95% of NEA’s budget is used to support artistic creation, arts engagement, and state and regional partnerships (National Endowment for the Arts, 2016). The principal objective is to provide all Americans with diverse opportunities for arts participation. The NEA’s Office of Research and Analysis is essential to realizing this objective, and the results of the present study support its effort in several ways. (1) Individuals who attend traditional live musical performances are more likely to engage in pro-social behaviors, e.g., making charitable donations or volunteering, attending community meetings and voting. (2) Individuals who attend other live arts-related events, e.g., dance, theater, art exhibitions, and nontraditional music performances, are also more likely to engage in pro-social behavior. This suggests that the relationship holds irrespective of the artistic domain. (3) Our findings along with those of others suggest that the link between exposure to the arts and pro-social behavior is based on the social characteristics of these encounters, e.g., shared group identity, familiarity with performers or artists, multimodal sensory experience, etiquette, venue, and customs or rituals. (4) Individuals who are exposed to the arts through the Internet are also more likely to engage in pro-social behavior. This makes sense in that the Internet is essentially a public medium that is structured to facilitate interpersonal communication and sharing and that is universally accessible, including to those who lack the resources to attend a live performance. Considering that NEA supports artistic ensembles and arts-related media development, production, and distribution, it is worth noting that live and media presentations are mutually reinforcing. Live performances help create a market for recorded performances, and recorded performances encourage audience participation. (5) Finally, we have shown that there are numerous reasons that individuals are drawn to the arts. But most important is that the motivation to attend arts-related events is interactive. The reasons for attending do not operate independently of one another, and considering them in isolation is misleading. One of NEA’s strategic goals is to “promote public knowledge and understanding about the contributions of the arts” through the use of traditional and social media channels and partnerships with public and private organizations. In order to facilitate NEA’s disseminating the results of this investigation, all reports and other documents produced through this grant will be stored in eCommons, a digital archive of the research and creative works produced by University of Dayton scholars and artists. Hosted by Digital Commons, http://digitalcommons.bepress.com, eCommons meets the 2010 Americans with Disabilities Act Standards for Accessible Design. It ensures that all digital content have the following features:
University of Dayton 23
(a) All static pages follow U.S. Federal Government Section 508 Guidelines, according to the Voluntary Product Accessibility Template (VPAT). (b) All static pages follow priorities 1 & 2 guidelines of the W3C Web Content Accessibility Guidelines. (c) All static pages validate as HTML5. (d) All static pages use structured semantic markup. H2 tags are used for main titles; H3 and H4 tags are used for subtitles.
NEA has funded a proposal for future research that will begin in FY 2016 (NEA Art Works Application #16-968196). The principal objective is to build a model that can be used to explicate the relationship between a broad spectrum of arts-related experiences and varieties of civic engagement.

University of Dayton 24
References Blume-Kohout, M. E., Leonard, S. R., & Novak-Leonard, J. L. (2015). When the going gets
tough: Barriers and motivations affecting arts attendance (Research Report No. 59). Washington, DC: National Endowment for the Arts.
Brown, A. S., & Novak, J. L. (2007). Assessing the intrinsic impacts of a live performance.
Fairfield, CT: WolfBrown. Catterall, J. S., Dumais, S. A., & Hampden-Thompson, G. (2012). The arts and achievement in
at-risk youth: Findings from four longitudinal studies (Research Report No. 55). Washington, DC: National Endowment for the Arts.
Corrigall, K. A., & Trainor, L. J. (2011). Associations between length of music training and
reading skills in children. Music Perception, 29, 147-155. Ehrlich, B. (2015, February). The neuroscience of art: What are the sources of creativity and
innovation? Salzburg Global Seminar (Session Report No. 547). Salzburg: AUSTRIA. Available: < http://www.salzburgglobal.org/fileadmin/user_upload/Documents/2010-2019/2015/Session_547/SalzburgGlobal_Report_547_FINAL_lo_res.pdf >
Frischen, A., Bayliss, A. P., & Tipper, S. P. (2007). Gaze cueing of attention: Visual attention,
social cognition, and individual differences. Psychological Bulletin, 133, 694-724. Goldthorpe, J. H. (1987). Social mobility and class structure in modern Britain (2nd ed.).
Oxford, UK: Clarendon Press. Gute, D., & Gute, G. (2015). How creativity works in the brain. Washington, DC: National
Endowment for the Arts. Hardiman, M., Magsamen, S., McKhann, G., & Eilber, J. (2009). Neuroeducation: Learning,
arts, and the brain: Findings and challenges for educators and researchers from the 2009 Johns Hopkins University Summit. New York: Dana Press.
Hout, M. (1989). Following in father’s footsteps: Social mobility in Ireland. Cambridge, MA:
Harvard University Press. Konrath, S., Fuhrel-Forbis, A., Lou, A., & Brown, S. (2012). Motives for volunteering are
associated with mortality risk in older adults. Health Psychology, 31, 87-96. Krause, A., North, A., & Hewitt, L. (2014). Music selection behaviors in everyday listening.
Journal of Broadcasting & Electronic Media, 58, 306-323. Krause, A. E., North, A. C., & Hewitt, L. Y. (2015). Music-listening in everyday life: Devices
and choice. Psychology of Music, 43, 155-170.
University of Dayton 25
Leung, A., & Kier, C. (2008). Music preferences and civic activism of young people. Journal of Youth Studies, 11, 445-460.
Lonsdale A. J., & North, A. C. (2011). Why do we listen to music? A uses and gratifications
analysis. British Journal of Psychology, 102, 108-134. Manza, J., Hout, M., & Brooks, C. (1995). Class voting in capitalist democracies since World
War II: Dealignment, realignment, or trendless fluctuation? Annual Review of Sociology, 21, 137-162.
Marcus, G. F. (2012). Musicality: Instinct or acquired skill? Topics in Cognitive Science, 4, 498-
512. Medvedeva, M., Novak-Leonard, J. & Brown, A. (2012). Audience impact study: Literature
review. Washington DC: National Endowment for the Arts. Moreno, S., Bialystok, E., Barac, R., Schellenberg, E. G., Cepeda, N. J., & Chau, T. (2011).
Short-term music training enhances verbal intelligence and executive function. Psychological Science, 22, 1425-1433.
National Endowment for the Arts (2012). How art works. Washington, DC: National
Endowment for the Arts. National Endowment for the Arts (2014). Art works for America (Strategic Plan 2014-2018).
Washington, DC: National Endowment for the Arts. National Endowment for the Arts (2016). 2015 annual report. Washington, DC: National
Endowment for the Arts. Nicol, A. A. M., & Pexman, P. M. (1999). Presenting your findings: A practical guide for
creating tables. Washington, DC: American Psychological Association. Novak-Leonard, J. L., & Brown, A. S. (2011). Beyond attendance: A multi-modal understanding
of arts participation (Research Report No. 54). Washington, DC: National Endowment for the Arts.
O’Rourke, N., & Hatcher, L. (2013). A step-by-step-approach to using SAS for factor analysis
and structural equation modeling (2nd ed.). Cary, NC: SAS Institute, Inc. Peretz, I., & Zatorrre, R. J. (Eds.). (2003). The cognitive neuroscience of music. New York:
Oxford University Press Inc. Polzella, D. J., & Forbis, J. S. (2013). Pro-social and economic indications of participation in
the arts (Final Report, Grant No. FDR 12-3800-7012). Washington, DC: National Endowment for the Arts.

University of Dayton 26
Potter, R. F., Lee, S., & Rubenking, B. E. (2011). Correlating a motivation-activation measure with media preference. Journal of Broadcasting & Electronic Media, 55, 400-418.
Rentfrow, P. J. (2012). The role of music in everyday life: Current directions in the social
psychology of music. Social and Personality Psychology Compass, 6, 402-416. Roe, K. (1985). Swedish youth and music: Listening patterns and motivations. Communication
Research, 12, 353-362. Schellenberg, E. G. (2004). Music lessons enhance IQ. Psychological Science, 14, 511-514. Schellenberg, E. G. (2011a). Examining the association between music lessons and intelligence.
British Journal of Psychology, 102, 283-302. Schellenberg, E. G. (2011b). Music lessons, emotional intelligence, and IQ. Music Perception,
29, 185-194. Schellenberg, E. G., & Mankarious, M. (2012). Music training and emotional comprehension in
childhood. Emotion, 12, 887-891. Stevens, J. P. (2009). Applied multivariate statistics for the social sciences (5th ed.). New York,
NY: Taylor & Francis. Thompson, S. (2007). Determinants of listeners’ enjoyment of a performance. Psychology of
Music, 35, 20-36. Tsay, C. (2013). Sight over sound in the judgment of music performance. Proceedings of the
National Academy of Sciences, 110, 14580-14585. Wilson, M. K., Marczynski, S., & O’Brien, E. (2014). Ethical behavior of the classical music
audience. Ethical Human Psychology and Psychiatry: An International Journal of Critical Inquiry, 16, 120-126.
Winner, E., & Hetland, L. (Eds.) (2000). The arts and academic achievement: What the evidence
shows. Journal of Aesthetic Education, 34 (3/4), 2-307. Winner, E., Hetland, L., Veenema, S., Sheridan, K., & Palmer, P. (2006). In P. Locher, C.
Martindale, & L. Dorfman (Eds.), New directions in aesthetics (pp. 189-205). Amity, NY: Baywood Publishing Co.
Zatorre, R. (2005). Music, the food of neuroscience? Nature (434), 312-315.

University of Dayton 27
Appendices
University of Dayton 28
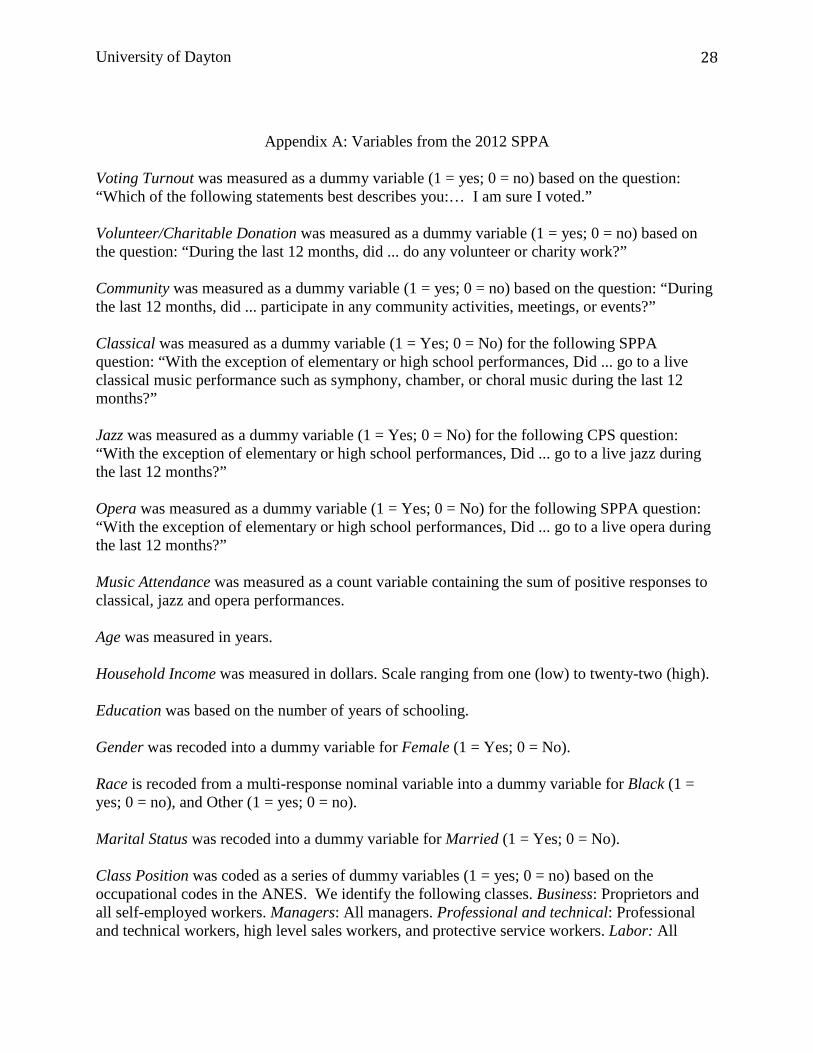
Appendix A: Variables from the 2012 SPPA
Voting Turnout was measured as a dummy variable (1 = yes; 0 = no) based on the question: “Which of the following statements best describes you:… I am sure I voted.” Volunteer/Charitable Donation was measured as a dummy variable (1 = yes; 0 = no) based on the question: “During the last 12 months, did ... do any volunteer or charity work?” Community was measured as a dummy variable (1 = yes; 0 = no) based on the question: “During the last 12 months, did ... participate in any community activities, meetings, or events?” Classical was measured as a dummy variable (1 = Yes; 0 = No) for the following SPPA question: “With the exception of elementary or high school performances, Did ... go to a live classical music performance such as symphony, chamber, or choral music during the last 12 months?” Jazz was measured as a dummy variable (1 = Yes; 0 = No) for the following CPS question: “With the exception of elementary or high school performances, Did ... go to a live jazz during the last 12 months?” Opera was measured as a dummy variable (1 = Yes; 0 = No) for the following SPPA question: “With the exception of elementary or high school performances, Did ... go to a live opera during the last 12 months?” Music Attendance was measured as a count variable containing the sum of positive responses to classical, jazz and opera performances. Age was measured in years. Household Income was measured in dollars. Scale ranging from one (low) to twenty-two (high). Education was based on the number of years of schooling. Gender was recoded into a dummy variable for Female (1 = Yes; 0 = No). Race is recoded from a multi-response nominal variable into a dummy variable for Black (1 = yes; 0 = no), and Other (1 = yes; 0 = no). Marital Status was recoded into a dummy variable for Married (1 = Yes; 0 = No). Class Position was coded as a series of dummy variables (1 = yes; 0 = no) based on the occupational codes in the ANES. We identify the following classes. Business: Proprietors and all self-employed workers. Managers: All managers. Professional and technical: Professional and technical workers, high level sales workers, and protective service workers. Labor: All

University of Dayton 29
manual workers. Clerical and Sales Workers: All clerical and sales workers (except high level sales). Service Workers: All service workers (except protective service).
University of Dayton 30
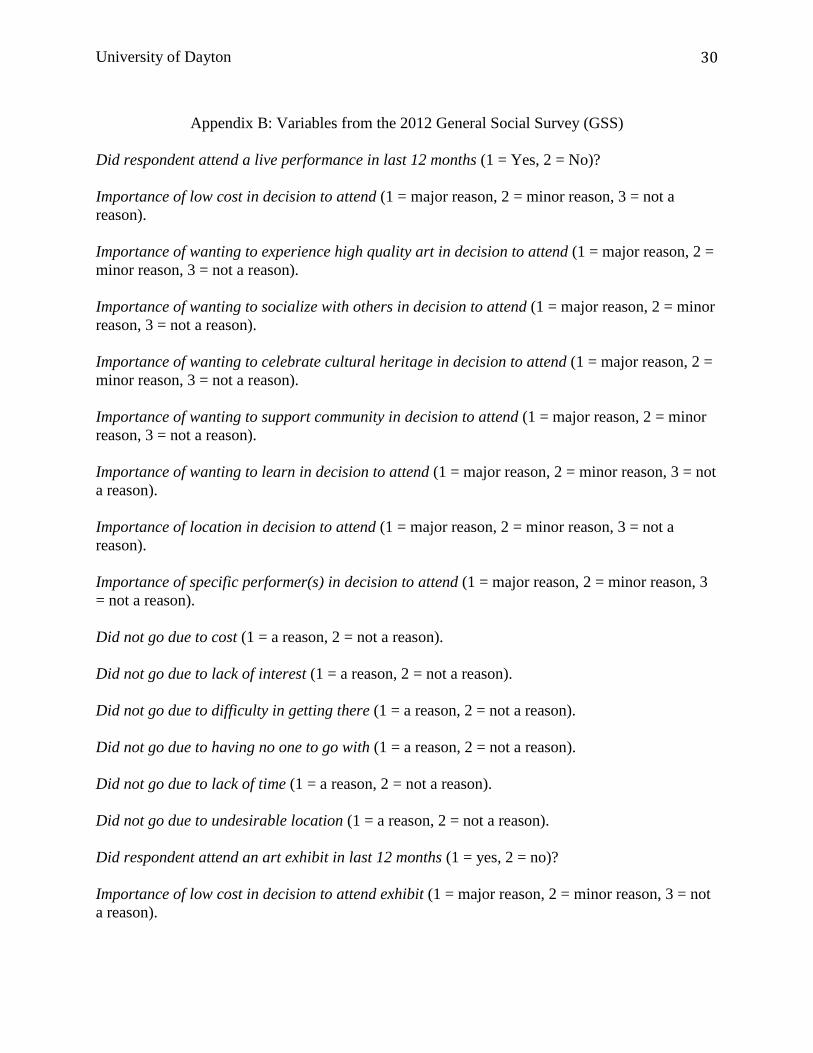
Appendix B: Variables from the 2012 General Social Survey (GSS)
Did respondent attend a live performance in last 12 months (1 = Yes, 2 = No)? Importance of low cost in decision to attend (1 = major reason, 2 = minor reason, 3 = not a reason). Importance of wanting to experience high quality art in decision to attend (1 = major reason, 2 = minor reason, 3 = not a reason). Importance of wanting to socialize with others in decision to attend (1 = major reason, 2 = minor reason, 3 = not a reason). Importance of wanting to celebrate cultural heritage in decision to attend (1 = major reason, 2 = minor reason, 3 = not a reason). Importance of wanting to support community in decision to attend (1 = major reason, 2 = minor reason, 3 = not a reason). Importance of wanting to learn in decision to attend (1 = major reason, 2 = minor reason, 3 = not a reason). Importance of location in decision to attend (1 = major reason, 2 = minor reason, 3 = not a reason). Importance of specific performer(s) in decision to attend (1 = major reason, 2 = minor reason, 3 = not a reason). Did not go due to cost (1 = a reason, 2 = not a reason). Did not go due to lack of interest (1 = a reason, 2 = not a reason). Did not go due to difficulty in getting there (1 = a reason, 2 = not a reason). Did not go due to having no one to go with (1 = a reason, 2 = not a reason). Did not go due to lack of time (1 = a reason, 2 = not a reason). Did not go due to undesirable location (1 = a reason, 2 = not a reason). Did respondent attend an art exhibit in last 12 months (1 = yes, 2 = no)? Importance of low cost in decision to attend exhibit (1 = major reason, 2 = minor reason, 3 = not a reason).

University of Dayton 31
Importance of wanting to experience high quality art in decision to attend exhibit (1 = major reason, 2 = minor reason, 3 = not a reason). Importance of wanting to socialize with others in decision to attend exhibit (1 = major reason, 2 = minor reason, 3 = not a reason). Importance of wanting to celebrate cultural heritage in decision to attend exhibit (1 = major reason, 2 = minor reason, 3 = not a reason). Importance of wanting to support community in decision to attend exhibit (1 = major reason, 2 = minor reason, 3 = not a reason). Importance of wanting to learn in decision to attend exhibit (1 = major reason, 2 = minor reason, 3 = not a reason). Importance of location in decision to attend exhibit (1 = major reason, 2 = minor reason, 3 = not a reason). Did not go to exhibit due to cost (1 = a reason, 2 = not a reason). Did not go to exhibit due to lack of interest (1 = a reason, 2 = not a reason). Did not go to exhibit due to difficulty in getting there (1 = a reason, 2 = not a reason). Did not go to exhibit due to having no one to go with (1 = a reason, 2 = not a reason). Did not go to exhibit due to lack of time (1 = a reason, 2 = not a reason). Did not go to exhibit due to undesirable location (1 = a reason, 2 = not a reason).

University of Dayton 32
Appendix C: Technical Note on Logistic Regression Analysis
Logistic regression allows the researcher to fit a regression model of dependent variables on independent variables, where the dependent is categorical or dichotomous (or, more precisely, a 0/non-0 variable). Logistic regression displays estimates as odds ratios, which allows for interpretation of the probability of a change in the dependent variable (Y) given a change in the independent variable. Logistic regression can also show results in the form of coefficients for an alternative interpretation of the relationship between the independent and dependent variables. Typically, goodness of fit tests for logistic regression include the Wald test, which is similar to a t-test in linear regression. The likelihood-ratio test is also commonly used as an alternative test and allows one to test the contribution of individual predictors (Y) in a given model. In addition to arts participation variables, our regression model also included seven control variables, which are known to predict civic engagement. These were: Age, Race, Sex, Income, Education, Marital Status and Occupation Class. To measure occupational class, we used a conventional six-category scheme (Goldthorpe 1987; Hout 1989; Manza, Hout and Brooks, 1995) to distinguish: (1) business owners and proprietors (including farm owners and the self-employed), (2) managers and administrators, (3) professional and technical workers, (4) clerical workers, (5) skilled and unskilled laborers, and (6) service workers. Next, we constructed a binary “class gap” measure by grouping the first three categories into an “upper” class and the last three into a “lower” class, the basic difference being the degree to which its members have capital autonomy or exercise authority. The regression model can be stated as:
𝑌𝑌 = 𝛽𝛽0 + 𝛽𝛽1𝑋𝑋1 + 𝛽𝛽2𝑋𝑋2 + ⋯+ 𝛽𝛽𝑘𝑘𝑋𝑋𝑘𝑘 + 𝑒𝑒 , where, in our analysis, Y represents the binary pro-social behavior to be predicted, 𝑋𝑋1,𝑋𝑋2 …𝑋𝑋𝑘𝑘 are the independent variables, 𝛽𝛽0 is the intercept, 𝛽𝛽1, 𝛽𝛽2 …𝛽𝛽𝑘𝑘 are the slope coefficients, and 𝑒𝑒 is the random error.

University of Dayton 33
Appendix D: Technical Note on Principal Component Analysis
(after O’Rourke and Hatcher, 2013) Principal component analysis is a variable reduction procedure. It is appropriate when you have data on a relatively large number of variables and believe that there may be some redundancy in the data, i.e., that some of the variables are correlated with one another, possibly because they are measuring the same construct. Because of this redundancy, it may be possible to reduce the number of observed variables into a smaller number of principal components (latent variables) that will account for most of the variance in the observed variables. Technically, a principal component can be defined as a linear combination of optimally-weighted observed variables. The weights are determined by applying a special type of equation called an eigenequation. The weights produced by these eigenequations are optimal weights in the sense that, for a given set of data, the obtained set of components will account for the maximal amount of variance in the observed variables. The weights are created so as to satisfy a principle of least squares similar to that used in multiple regression. In most analyses, only the first few extracted components account for meaningful amounts of variance, so only these first few components are retained and interpreted. The first component extracted accounts for the greatest amount of the total variance in the observed variables. The second component extracted will account for the greatest amount of variance that was not accounted for by the first component. Under typical conditions, the second component will be correlated with some of the observed variables that did not display strong correlations with component 1. A principal component analysis proceeds in this fashion, with each new component accounting for progressively smaller and smaller amounts of variance. This is why only the first few components are usually retained and interpreted. When the analysis is complete, the resulting components will display varying degrees of correlation with the observed variables, but are completely uncorrelated with one another. Ideally, the correlations between the variables and the components are used to interpret the components; that is, to determine what construct each component measures. Unfortunately, when more than one component has been retained in an analysis, interpreting the factor pattern may be difficult unless it is rotated. A rotation is a linear transformation that makes the solution easier to interpret while preserving factor independence. Another feature that helps in the interpretation is a variable’s communality, which is the percent of variance in the observed variable that is accounted for by the retained components. A variable with a large communality loads heavily on at least one of the retained components. Interpreting a solution means determining what is being measured by each of the retained components. In general, this involves identifying the variables that show high loadings on only one component. (As a rule of thumb, a loading of at least 0.40 is considered high.) The investigator then decides what it is that these variables have in common, and that is what the component presumably measures. Variables with high loads on more than one component are

University of Dayton 34
usually discarded, since they are not pure measures and, therefore, complicate the interpretation. The process is repeated for each of the retained components. Contact information:
Donald Polzella 9775 Greenside Court Centerville, OH 45458 937-307-2542 < [email protected] >
Digital archiving
Digital copies of any publications or presentations based on this project that are not copyright-restricted as well as statistical log and output files will be archived in the University of Dayton eCommons institutional repository (http://ecommons.udayton.edu ) Hosted by Digital Commons (http://digitalcommons.bepress.com), the University of Dayton eCommons institutional repository software can be configured to provide open access to these materials.