relationships between danish organic farming and landscape composition
TRANSCRIPT
www.elsevier.com/locate/agee
Agriculture, Ecosystems and Environment 120 (2007) 330–344
Relationships between Danish organic farming and
landscape composition
Gregor Levin *
Department of Environmental, Social and Spatial Change (ENSPAC), Roskilde University, Universitetsvej 1,
P.O. Box 260, 4000 Roskilde, Denmark
Received 6 March 2006; received in revised form 7 September 2006; accepted 13 October 2006
Available online 30 November 2006
Abstract
This article presents an investigation of relationships between organic farming and landscape composition in Denmark. Landscape
composition was analysed in terms of density of uncultivated landscape elements (I), number of land uses per hectare (II), diversity of land use
(III) and mean field size (IV). Two analytical approaches were used. The first was based on an examination of the national agricultural
registers for 1998, 2001 and 2004. The second approach used aerial photo interpretation for an analysis of 72 conventional and 40 organic
farms within three sample areas for 1982, 1995 and 2002. The national analysis indicated that organic farming has a direct effect on landscape
composition. In 2001, organic farms were characterised by a higher number of land uses per ha, a higher land use diversity and smaller mean
field sizes. From 1998 to 2004, conversion to organic farming was related to an increasing number of land uses per ha, increasing land-use
diversity and decreasing mean field sizes. Relationships between organic farming and landscape composition were independent of variations
in regional location, farm size or farm size change. At the level of sample areas, a significant relationship between organic farming and
landscape composition was only found for densities of small biotopes. However, when differences in farm size and physical geographical
conditions between conventional and organic farms were taken into account, several significant differences in landscape composition were
clarified in two of the three sample areas. Furthermore, changes in landscape composition following conversion to organic farming were
largely biased by the characteristics of the sample areas. Thus, in contrast to the national level, the sample area study indicated that differences
in landscape composition between organic and conventional farms were not a direct implication of organic farming practices, but were related
to variations within other parameters and to the location of organically farmed land.
# 2006 Elsevier B.V. All rights reserved.
Keywords: Organic farming; Conventional farming; Landscape composition; Landscape change; Farm properties
1. Introduction
Organic farming constitutes an important component of
European agriculture, not least in Denmark, where in 2004
over 6% of all arable land was farmed organically (Ministry
of Food, Agriculture and Fisheries, 2004). It is generally
expected that changes in agricultural practices related to
conversion from conventional to organic farming influence
landscape composition. In Denmark, organic farming has
been claimed to be an instrument for the protection and
* Tel.: +45 46742000; fax: +45 46743000.
E-mail address: [email protected].
0167-8809/$ – see front matter # 2006 Elsevier B.V. All rights reserved.
doi:10.1016/j.agee.2006.10.018
improvement of natural and semi-natural elements (FØJO,
2000; Strukturdirektoratet, 1999; Wilhjelmudvalget, 2001).
As far as the EU is concerned, it has recently been suggested
that the proportion of land under organic farming is a
response indicator for the relationship between agriculture
and the landscape (European Environmental Agency, 2005).
Yet, though the principles of organic farming include
sustainable landscape management (IFOAM, 2002), in most
countries, standards and rules for organic farming do not
specifically concern landscape. While it is well documented
that the ban on chemicals in organic farming has a beneficial
effect on flora and fauna within the area of cultivated land
and in edge biotopes (Aude et al., 2003; Benton et al., 2003;
G. Levin / Agriculture, Ecosystems and Environment 120 (2007) 330–344 331
Stolze et al., 2000; Tybirk et al., 2003), knowledge of the
relationship between organic farming and landscape
composition is limited.
There are two reasons why a relationship between
organic farming and landscape composition can be
expected. First, due to the ban on chemical fertilisers,
organic farming is forced to maintain nutrient balances
through crop rotation with a larger number of crops. This is
expected to lead to a greater diversity in land use and
consequently to more but smaller fields with longer field
margins, which are potential habitats and corridors for wild
flora and fauna (Frederiksen, 2001; van Elsen, 2000).
Secondly, land-use practices and their effects on land-
scape composition have to be seen within a broader
framework, embracing socio-economic and cultural para-
meters, as well as physical geographical conditions (Brandt
et al., 1999; Busck, 2002; Ellis et al., 1999; Kristensen et al.,
2001; Madsen, 2001; Primdahl, 1999; Schmitzberger et al.,
2005). If differences in these conditions exist between
organic and conventional farms, they may imply differences
in landscape composition.
Mander et al. (1999) and Stolze et al. (2000) argue that
existing research indicates that organic farming has a
generally positive effect on landscape composition. How-
ever, when evaluated in the context of applied data and
methods, existing research does not, in fact, support this
proposition. As part of an EU Concerted Action (van
Mansvelt and van der Lubbe, 1999), significant relationships
between organic farming and densities of natural and semi-
natural landscape elements were found in several European
regions (Clemetsen and van Laar, 2000; Hendriks et al.,
2000; Kuiper, 2000; MacNaeidhe and Culleton, 2000; Rossi
and Nota, 2000; Stobbelaar et al., 2000; van Mansvelt et al.,
1998). However, since these investigations were charac-
terised by very small samples (2–8 farms per region), the
results cannot be generalized. Furthermore, the effects of
other farm-specific parameters on landscape composition
were not explored. Investigations using larger samples and
exploring the effects of other parameters indicated little or
no impact of organic farming on landscape composition
(Ackermann, 2003; ENTEC, 1995; Lindkqvist, 2002; Tress,
1999). Generally, production type, farm size and physical
geographical conditions had a much stronger influence on
landscape composition than organic farming. Only two
investigations explored changes in landscape composition:
neither found a significant effect of organic farming
(Ackermann, 2003; Tress, 1999).
On the basis of a lack of appropriate investigations and
the need to document the effects of organic farming, the
main aim of this study was to investigate differences in
landscape composition between organic and conventional
farms. Landscape composition was analysed in terms of the
densities of different uncultivated landscape elements (I),
numbers of land uses per hectare (II), land-use diversity (III)
and mean field size (IV). Two central questions were raised.
First, do differences in landscape composition between
organic and conventional farms exist? Secondly, was
conversion to organic farming followed by changes in
landscape composition? Furthermore, the influence of
regional location, farm size and physical geographical
conditions, as well as interactions between these and organic
or conventional farming, were investigated.
2. Methods
For this paper, two methodological approaches were
adopted. In the first method, data for farm and landscape
parameters for the whole country except the island of
Bornholm were used. In the second method, three sample
areas, covering 40 organic and 72 conventional farms, were
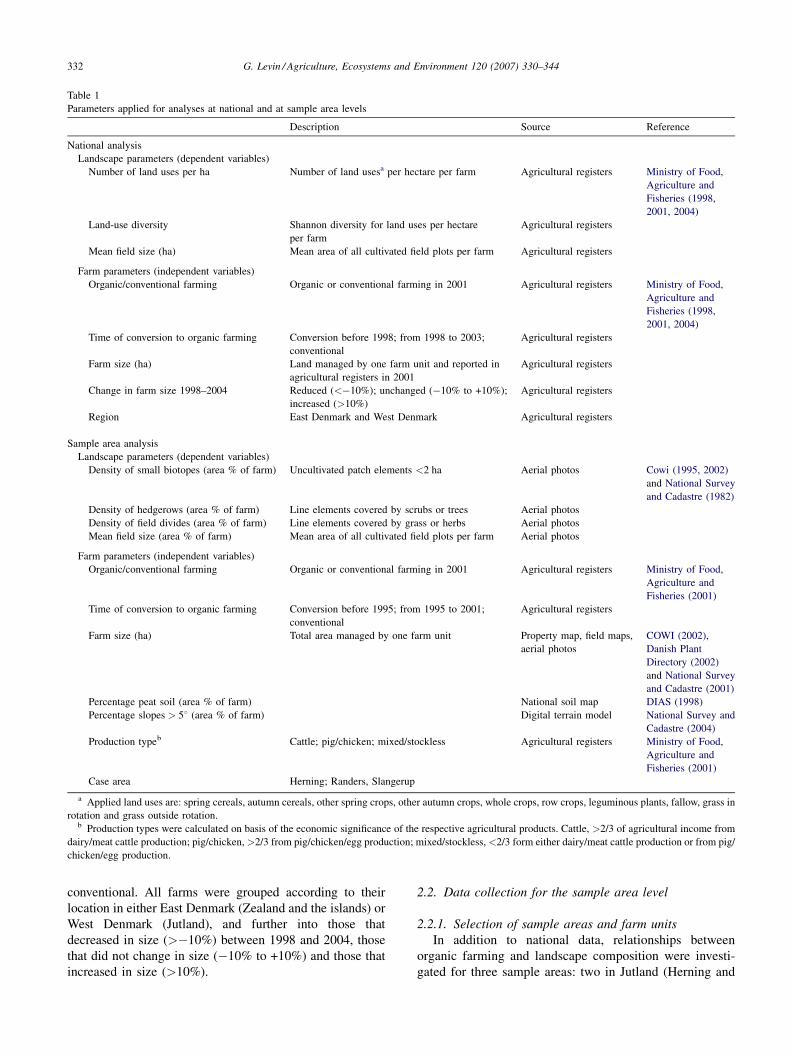
investigated. Table 1 summarizes the parameters applied in
the two analyses.
2.1. Data collection for the national level
For the national investigation, information on organic or
conventional production, year of conversion, farm size, mean
field size, number of land uses per hectare and diversity of
land use was compiled for each farm unit in Denmark on the
basis of the national agricultural registers for 1998, 2001 and
2004 (Ministry of Food, Agriculture and Fisheries, 1998,
2001, 2004). Land uses were classified into categories,
which represent different types and stages of vegetation and
thus deliver different functions for farmland species
(Table 1). Diversity of land use was derived using Shannon’s
index for diversity per ha. The index was calculated as
follows: Sh ¼Pn
i¼1ðPi � ln PiÞ; where Pi is the proportion
of land occupied by land use i. Shannon equals 0 if only one
land use occupies the whole farm unit and increases with an
increasing number of land uses and with an increasingly
equal distribution of land uses. Relations to landscape
composition in 2001 were tested for 3339 organic and
46,264 conventional farms, covering all registered farms in
Denmark except for the island of Bornholm. Due to
biophysical conditions, which are very different from those
on Denmark in general, it was decided to exclude Bornholm
from this study. Furthermore, for the period from 1998 to
2004, changes in numbers of land uses per ha, land-use
diversity and mean field size were calculated for 38,506
farms that could be traced in both registers. In order to test
relationships between time of conversion to organic farming
and landscape changes, the farms were grouped into the
following categories: organic farms that converted before
1998 (N = 825) (I); organic farms that converted between
1998 and 2003 (N = 1248) (II); farms that, in 2004, were
being managed conventionally (N = 36,433) (III). For the
group of farms that converted from 1998 to 2003, the 1998
agricultural register represents the situation prior to
conversion, while the 2004 register represents the situation
subsequent to conversion to organic farming. Farms that
reverted back from organic to conventional were classified as
G. Levin / Agriculture, Ecosystems and Environment 120 (2007) 330–344332
Table 1
Parameters applied for analyses at national and at sample area levels
Description Source Reference
National analysis
Landscape parameters (dependent variables)
Number of land uses per ha Number of land usesa per hectare per farm Agricultural registers Ministry of Food,
Agriculture and
Fisheries (1998,
2001, 2004)
Land-use diversity Shannon diversity for land uses per hectare
per farm
Agricultural registers
Mean field size (ha) Mean area of all cultivated field plots per farm Agricultural registers
Farm parameters (independent variables)
Organic/conventional farming Organic or conventional farming in 2001 Agricultural registers Ministry of Food,
Agriculture and
Fisheries (1998,
2001, 2004)
Time of conversion to organic farming Conversion before 1998; from 1998 to 2003;
conventional
Agricultural registers
Farm size (ha) Land managed by one farm unit and reported in
agricultural registers in 2001
Agricultural registers
Change in farm size 1998–2004 Reduced (<�10%); unchanged (�10% to +10%);
increased (>10%)
Agricultural registers
Region East Denmark and West Denmark Agricultural registers
Sample area analysis
Landscape parameters (dependent variables)
Density of small biotopes (area % of farm) Uncultivated patch elements <2 ha Aerial photos Cowi (1995, 2002)
and National Survey
and Cadastre (1982)
Density of hedgerows (area % of farm) Line elements covered by scrubs or trees Aerial photos
Density of field divides (area % of farm) Line elements covered by grass or herbs Aerial photos
Mean field size (area % of farm) Mean area of all cultivated field plots per farm Aerial photos
Farm parameters (independent variables)
Organic/conventional farming Organic or conventional farming in 2001 Agricultural registers Ministry of Food,
Agriculture and
Fisheries (2001)
Time of conversion to organic farming Conversion before 1995; from 1995 to 2001;
conventional
Agricultural registers
Farm size (ha) Total area managed by one farm unit Property map, field maps,
aerial photos
COWI (2002),
Danish Plant
Directory (2002)
and National Survey
and Cadastre (2001)
Percentage peat soil (area % of farm) National soil map DIAS (1998)
Percentage slopes > 58 (area % of farm) Digital terrain model National Survey and
Cadastre (2004)
Production typeb Cattle; pig/chicken; mixed/stockless Agricultural registers Ministry of Food,
Agriculture and
Fisheries (2001)
Case area Herning; Randers, Slangerup
a Applied land uses are: spring cereals, autumn cereals, other spring crops, other autumn crops, whole crops, row crops, leguminous plants, fallow, grass in
rotation and grass outside rotation.b Production types were calculated on basis of the economic significance of the respective agricultural products. Cattle, >2/3 of agricultural income from
dairy/meat cattle production; pig/chicken,>2/3 from pig/chicken/egg production; mixed/stockless, <2/3 form either dairy/meat cattle production or from pig/
chicken/egg production.
conventional. All farms were grouped according to their
location in either East Denmark (Zealand and the islands) or
West Denmark (Jutland), and further into those that
decreased in size (>�10%) between 1998 and 2004, those
that did not change in size (�10% to +10%) and those that
increased in size (>10%).
2.2. Data collection for the sample area level
2.2.1. Selection of sample areas and farm units
In addition to national data, relationships between
organic farming and landscape composition were investi-
gated for three sample areas: two in Jutland (Herning and

G. Levin / Agriculture, Ecosystems and Environment 120 (2007) 330–344 333
Fig. 1. Location of the sample areas.
Randers), and one on Zealand (Slangerup) (Fig. 1). The
sample areas, which are described in Table 2, were selected
in order to have a high density of organic farms and to
represent different agricultural landscapes in terms of
physical geographical conditions and agricultural produc-
tion, as well as distance from major urban centers.
The three sample areas include 40 organic and 72
conventional farms. Each farm unit was registered and
demarcated using both maps of agricultural fields (Danish
Plant Directory, 2002) and cadastral maps (National Survey
and Cadastre, 2001). The demarcated farm areas cover all
owned land plus rented land minus land rented out.
Information on production type and organic versus
conventional farming was derived from the national
agricultural register for 2001 (Ministry of Food, Agriculture
and Fisheries, 2001). By means of a spatial overlay with
maps of slope (National Survey and Cadastre, 2004) and soil
properties (DIAS, 1998), percentage of peat soil and
percentage of slopes exceeding 58 was calculated for each
farm unit. All parameters and data sources are summarised
in Table 1.
2.2.2. Land cover registration
A land cover registration was carried out on the basis of a
visual interpretation of aerial photos from 1954 (National
Survey and Cadastre, 1954), 1982 (National Survey and
Cadastre, 1982) and 2002 (COWI, 2002). The registration
embraces 18 land cover classes. All landscape elements
exceeding 20 m2 were registered. The limit of 20 m2 was
chosen on the basis of the resolution of the aerial photos
(0.8 m).
The landscape elements that were used to illustrate
landscape composition at sample area level were defined as
follows.
G. Levin / Agriculture, Ecosystems and Environment 120 (2007) 330–344334
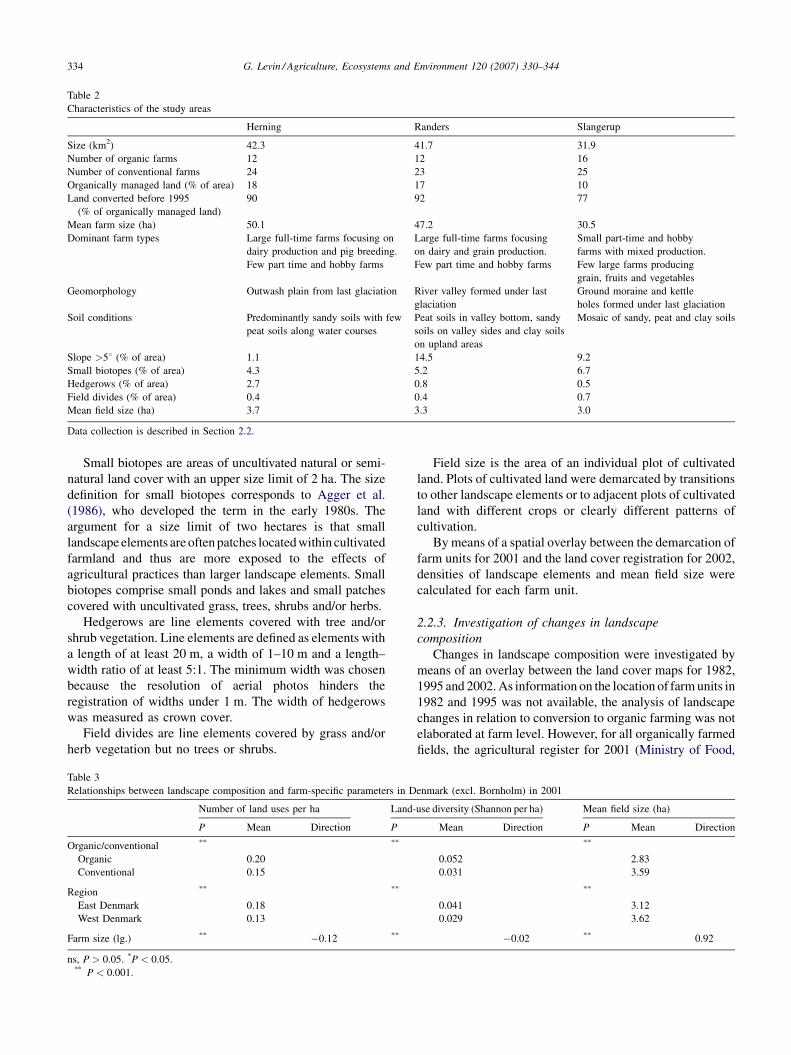
Table 2
Characteristics of the study areas
Herning Randers Slangerup
Size (km2) 42.3 41.7 31.9
Number of organic farms 12 12 16
Number of conventional farms 24 23 25
Organically managed land (% of area) 18 17 10
Land converted before 1995
(% of organically managed land)
90 92 77
Mean farm size (ha) 50.1 47.2 30.5
Dominant farm types Large full-time farms focusing on
dairy production and pig breeding.
Few part time and hobby farms
Large full-time farms focusing
on dairy and grain production.
Few part time and hobby farms
Small part-time and hobby
farms with mixed production.
Few large farms producing
grain, fruits and vegetables
Geomorphology Outwash plain from last glaciation River valley formed under last
glaciation
Ground moraine and kettle
holes formed under last glaciation
Soil conditions Predominantly sandy soils with few
peat soils along water courses
Peat soils in valley bottom, sandy
soils on valley sides and clay soils
on upland areas
Mosaic of sandy, peat and clay soils
Slope >58 (% of area) 1.1 14.5 9.2
Small biotopes (% of area) 4.3 5.2 6.7
Hedgerows (% of area) 2.7 0.8 0.5
Field divides (% of area) 0.4 0.4 0.7
Mean field size (ha) 3.7 3.3 3.0
Data collection is described in Section 2.2.
Small biotopes are areas of uncultivated natural or semi-
natural land cover with an upper size limit of 2 ha. The size
definition for small biotopes corresponds to Agger et al.
(1986), who developed the term in the early 1980s. The
argument for a size limit of two hectares is that small
landscape elements are often patches located within cultivated
farmland and thus are more exposed to the effects of
agricultural practices than larger landscape elements. Small
biotopes comprise small ponds and lakes and small patches
covered with uncultivated grass, trees, shrubs and/or herbs.
Hedgerows are line elements covered with tree and/or
shrub vegetation. Line elements are defined as elements with
a length of at least 20 m, a width of 1–10 m and a length–
width ratio of at least 5:1. The minimum width was chosen
because the resolution of aerial photos hinders the
registration of widths under 1 m. The width of hedgerows
was measured as crown cover.
Field divides are line elements covered by grass and/or
herb vegetation but no trees or shrubs.
Table 3
Relationships between landscape composition and farm-specific parameters in D
Number of land uses per ha Land-
P Mean Direction P
Organic/conventional ** **
Organic 0.20
Conventional 0.15
Region ** **
East Denmark 0.18
West Denmark 0.13
Farm size (lg.) ** �0.12 **
ns, P > 0.05. *P < 0.05.** P < 0.001.
Field size is the area of an individual plot of cultivated
land. Plots of cultivated land were demarcated by transitions
to other landscape elements or to adjacent plots of cultivated
land with different crops or clearly different patterns of
cultivation.
By means of a spatial overlay between the demarcation of
farm units for 2001 and the land cover registration for 2002,
densities of landscape elements and mean field size were
calculated for each farm unit.
2.2.3. Investigation of changes in landscape
composition
Changes in landscape composition were investigated by
means of an overlay between the land cover maps for 1982,
1995 and 2002. As information on the location of farm units in
1982 and 1995 was not available, the analysis of landscape
changes in relation to conversion to organic farming was not
elaborated at farm level. However, for all organically farmed
fields, the agricultural register for 2001 (Ministry of Food,
enmark (excl. Bornholm) in 2001
use diversity (Shannon per ha) Mean field size (ha)
Mean Direction P Mean Direction
**
0.052 2.83
0.031 3.59
**
0.041 3.12
0.029 3.62
�0.02 ** 0.92
G. Levin / Agriculture, Ecosystems and Environment 120 (2007) 330–344 335
Agriculture and Fisheries, 2001) contains information for the
year of conversion. In combination with the field maps, the
sample areas were divided into land converted to organic
farming before 1995, land converted between 1995 and 2001,
and conventionally managed land. The sample areas were
split up into cells of 100 m � 100 m, and for each cell,
information on the time of conversion to organic farming and
on changes in the densities of landscape elements and in mean
field size was registered. Resolution at 100 m was chosen
because this is fine enough to embrace variations in landscape
composition and the location of fields. A finer resolution
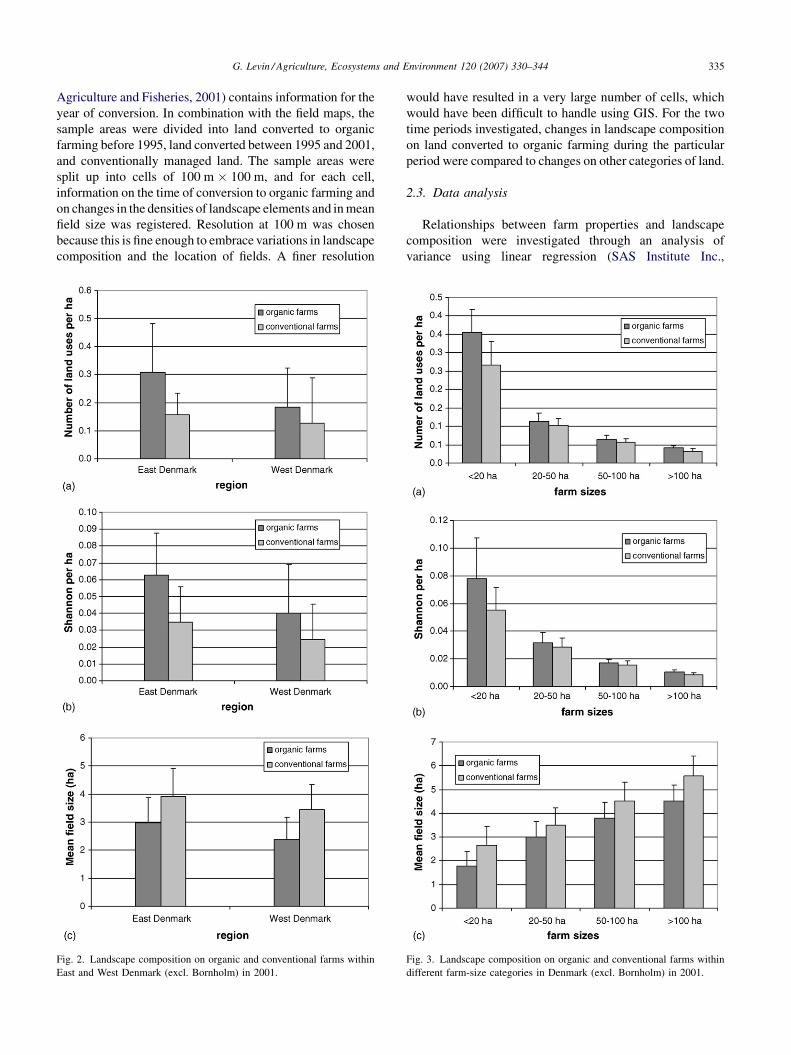
Fig. 2. Landscape composition on organic and conventional farms within
East and West Denmark (excl. Bornholm) in 2001.
would have resulted in a very large number of cells, which
would have been difficult to handle using GIS. For the two
time periods investigated, changes in landscape composition
on land converted to organic farming during the particular
period were compared to changes on other categories of land.
2.3. Data analysis
Relationships between farm properties and landscape
composition were investigated through an analysis of
variance using linear regression (SAS Institute Inc.,
Fig. 3. Landscape composition on organic and conventional farms within
different farm-size categories in Denmark (excl. Bornholm) in 2001.
G. Levin / Agriculture, Ecosystems and Environment 120 (2007) 330–344336
2004). Dependent and independent variables are listed in
Table 1. To ensure variance homogeneity, logit transforma-
tion was performed for all density data. As relationships
between farm size and density of the investigated landscape
elements and between farm size and mean field size were
characterised by an S-shaped curve, the logarithm of farm
size was used in the analyses. Furthermore, by crossing
explanatory variables, interactions between these variables
and their relationships to landscape composition and
landscape changes were investigated.
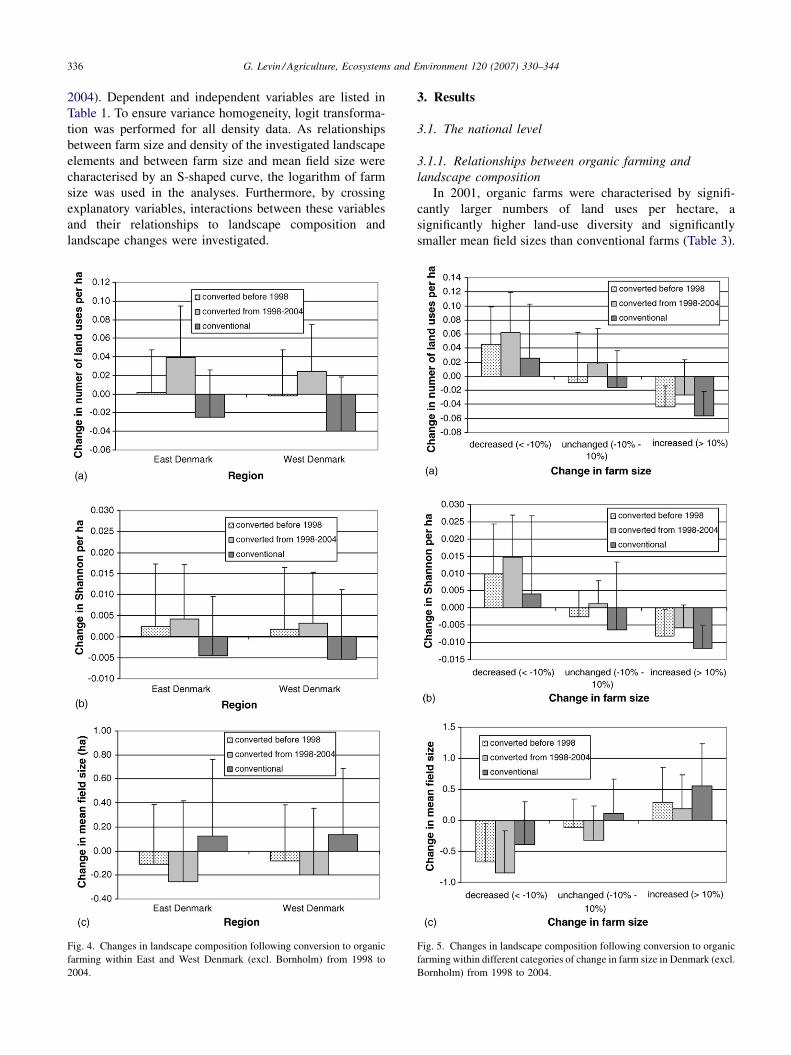
Fig. 4. Changes in landscape composition following conversion to organic
farming within East and West Denmark (excl. Bornholm) from 1998 to
2004.
3. Results
3.1. The national level
3.1.1. Relationships between organic farming and
landscape composition
In 2001, organic farms were characterised by signifi-
cantly larger numbers of land uses per hectare, a
significantly higher land-use diversity and significantly
smaller mean field sizes than conventional farms (Table 3).
Fig. 5. Changes in landscape composition following conversion to organic
farming within different categories of change in farm size in Denmark (excl.
Bornholm) from 1998 to 2004.
G. Levin / Agriculture, Ecosystems and Environment 120 (2007) 330–344 337
Landscape composition was also significantly related to
regional location and to farm size. Number of land uses per
hectare and land-use diversity were significantly higher on
farms in East Denmark, while mean field size was
significantly higher on farms in West Denmark. Further-
more, farm size was significantly negatively related to
number of land uses per hectare and to land-use diversity and
positively related to mean field size. Fig. 2 shows that
differences in landscape composition between organic and
conventional farms applied to both East and West Denmark.
Furthermore, Fig. 3 shows that differences in landscape
composition between organic and conventional farms
applied within all groups of farm sizes. Consequently,
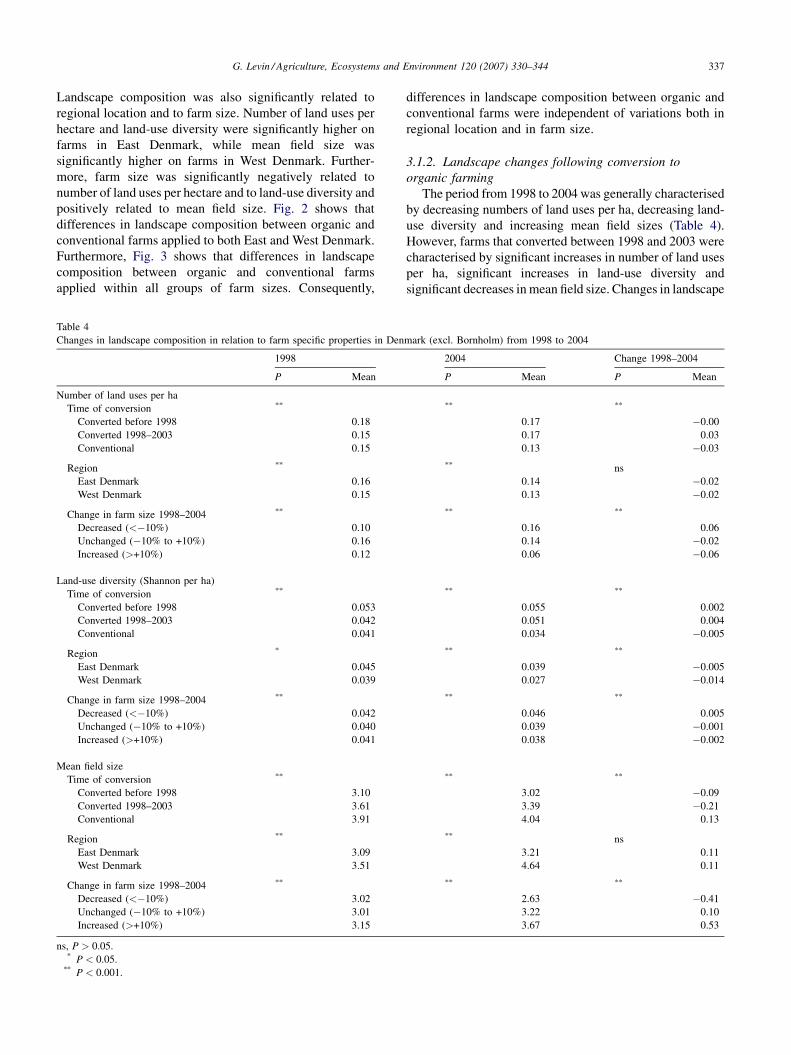
Table 4
Changes in landscape composition in relation to farm specific properties in Den
1998
P Mean
Number of land uses per ha
Time of conversion **
Converted before 1998 0.18
Converted 1998–2003 0.15
Conventional 0.15
Region **
East Denmark 0.16
West Denmark 0.15
Change in farm size 1998–2004 **
Decreased (<�10%) 0.10
Unchanged (�10% to +10%) 0.16
Increased (>+10%) 0.12
Land-use diversity (Shannon per ha)
Time of conversion **
Converted before 1998 0.053
Converted 1998–2003 0.042
Conventional 0.041
Region *
East Denmark 0.045
West Denmark 0.039
Change in farm size 1998–2004 **
Decreased (<�10%) 0.042
Unchanged (�10% to +10%) 0.040
Increased (>+10%) 0.041
Mean field size
Time of conversion **
Converted before 1998 3.10
Converted 1998–2003 3.61
Conventional 3.91
Region **
East Denmark 3.09
West Denmark 3.51
Change in farm size 1998–2004 **
Decreased (<�10%) 3.02
Unchanged (�10% to +10%) 3.01
Increased (>+10%) 3.15
ns, P > 0.05.* P < 0.05.
** P < 0.001.
differences in landscape composition between organic and
conventional farms were independent of variations both in
regional location and in farm size.
3.1.2. Landscape changes following conversion to
organic farming
The period from 1998 to 2004 was generally characterised
by decreasing numbers of land uses per ha, decreasing land-
use diversity and increasing mean field sizes (Table 4).
However, farms that converted between 1998 and 2003 were
characterised by significant increases in number of land uses
per ha, significant increases in land-use diversity and
significant decreases in mean field size. Changes in landscape
mark (excl. Bornholm) from 1998 to 2004
2004 Change 1998–2004
P Mean P Mean
** **
0.17 �0.00
0.17 0.03
0.13 �0.03
** ns
0.14 �0.02
0.13 �0.02
** **
0.16 0.06
0.14 �0.02
0.06 �0.06
** **
0.055 0.002
0.051 0.004
0.034 �0.005
** **
0.039 �0.005
0.027 �0.014
** **
0.046 0.005
0.039 �0.001
0.038 �0.002
** **
3.02 �0.09
3.39 �0.21
4.04 0.13
** ns
3.21 0.11
4.64 0.11
** **
2.63 �0.41
3.22 0.10
3.67 0.53
G. Levin / Agriculture, Ecosystems and Environment 120 (2007) 330–344338
composition were also related to regional location and change
in farm size. Decreases in number of land uses per hectare and
in land-use diversity and increases in mean field size were
significantly stronger on farms in West Denmark. Farms that
increased in size by more than 10% were characterised by
significant decreases in numbers of land uses per hectare and
in land-use diversity. Farms which increased by size were also
characterised by significant increases in mean field size. Fig. 4
shows that relationships between conversion to organic
farming and changes in landscape composition applied within
both East Denmark and West Denmark. The relationship
between conversion to organic farming and change in
landscape composition was also found for all groups of
change in farm size (Fig. 5). Among farms that decreased in
size and those that did not change in size, farms converted
between 1998 and 2003 were characterised by significant
stronger increases in number of land uses per hectare (Fig. 5a)
and land-use diversity (Fig. 5b) and significantly stronger
decreases in farm sizes (Fig. 5c). Within the group of farms
that increased in size, farms that converted to organic farming
between 1998 and 2003 were characterised by a decreasing
number of land uses per hectare, decreasing land-use diversity
and an increasing mean field size. However, these changes
are less marked than on farms that converted before 1998
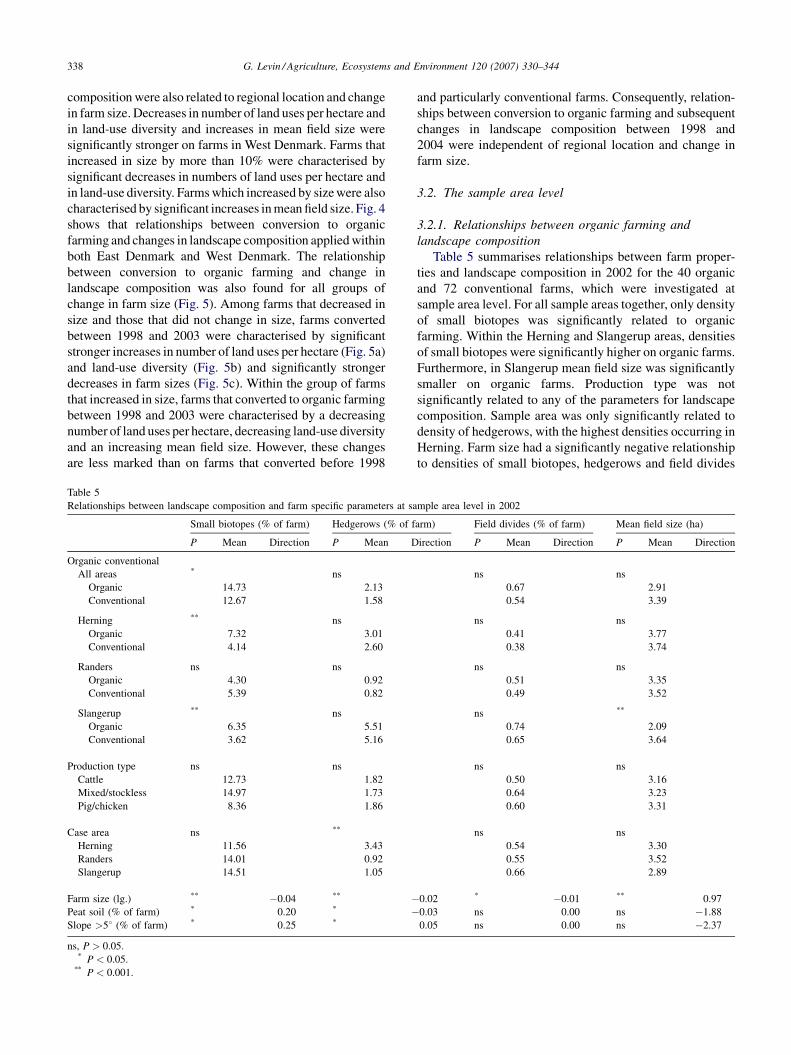
Table 5
Relationships between landscape composition and farm specific parameters at sa
Small biotopes (% of farm) Hedgerows (% of f
P Mean Direction P Mean D
Organic conventional
All areas * ns
Organic 14.73 2.13
Conventional 12.67 1.58
Herning ** ns
Organic 7.32 3.01
Conventional 4.14 2.60
Randers ns ns
Organic 4.30 0.92
Conventional 5.39 0.82
Slangerup ** ns
Organic 6.35 5.51
Conventional 3.62 5.16
Production type ns ns
Cattle 12.73 1.82
Mixed/stockless 14.97 1.73
Pig/chicken 8.36 1.86
Case area ns **
Herning 11.56 3.43
Randers 14.01 0.92
Slangerup 14.51 1.05
Farm size (lg.) ** �0.04 ** �Peat soil (% of farm) * 0.20 * �Slope >58 (% of farm) * 0.25 *
ns, P > 0.05.* P < 0.05.
** P < 0.001.
and particularly conventional farms. Consequently, relation-
ships between conversion to organic farming and subsequent
changes in landscape composition between 1998 and
2004 were independent of regional location and change in
farm size.
3.2. The sample area level
3.2.1. Relationships between organic farming and
landscape composition
Table 5 summarises relationships between farm proper-
ties and landscape composition in 2002 for the 40 organic
and 72 conventional farms, which were investigated at
sample area level. For all sample areas together, only density
of small biotopes was significantly related to organic
farming. Within the Herning and Slangerup areas, densities
of small biotopes were significantly higher on organic farms.
Furthermore, in Slangerup mean field size was significantly
smaller on organic farms. Production type was not
significantly related to any of the parameters for landscape
composition. Sample area was only significantly related to
density of hedgerows, with the highest densities occurring in
Herning. Farm size had a significantly negative relationship
to densities of small biotopes, hedgerows and field divides
mple area level in 2002
arm) Field divides (% of farm) Mean field size (ha)
irection P Mean Direction P Mean Direction
ns ns
0.67 2.91
0.54 3.39
ns ns
0.41 3.77
0.38 3.74
ns ns
0.51 3.35
0.49 3.52
ns **
0.74 2.09
0.65 3.64
ns ns
0.50 3.16
0.64 3.23
0.60 3.31
ns ns
0.54 3.30
0.55 3.52
0.66 2.89
0.02 * �0.01 ** 0.97
0.03 ns 0.00 ns �1.88
0.05 ns 0.00 ns �2.37
G. Levin / Agriculture, Ecosystems and Environment 120 (2007) 330–344 339
Table 6
Interrelationships between farm specific parameters at sample area level in
2002
Farm size
(ha)
Peat soil
(% of farm)
Slope >58(% of farm)
P Mean P Mean P Mean
All areas ns ns ns
Organic 42.4 15.2 9.7
Conventional 41.8 13.4 7.5
Herning * ** ns
Organic 51.9 0.12 0.03
Conventional 49.8 0.05 0.00
Randers * ns ns
Organic 57.9 0.15 0.14
Conventional 41.7 0.14 0.15
Slangerup ** ns **
Organic 15.6 0.18 0.12
Conventional 40.0 0.19 0.07
ns, P > 0.05.* P < 0.05.
** P < 0.001.
and a significantly positive relationship to mean field size.
Percentage of peat soil was significantly positively related to
density of small biotopes and significantly negatively related
to density of hedgerows. Percentages of slopes exceeding 58were significantly positively related to densities of small
biotopes.
Relationships between organic and conventional farming
and other farm properties are summarised in Table 6. In
Herning, organic farms were characterised by significantly
greater densities of peat soil. In Slangerup, organic farms
were characterised by significantly smaller farm sizes and
Table 7
Relationships between landscape composition and interactions between
farm parameters at sample area level
Small biotopes
(% of farm)
P Direction
Herning
Organic/conventional �% peat **
Organic �% peat 0.76
Conventional � % peat 0.07
Slangerup
Organic/conventional �% slope >58 **
Organic �% slope >58 0.55
Conventional � % slope >58 �0.07
Mean field size (ha)
P Direction
Slangerup
Organic/conventional � farm size **
Organic � farm size �1.49
Conventional � farm size 1.58
ns, P > 0.05. *P < 0.05.** P < 0.001.
significantly larger percentages of slopes exceeding 58. In
Randers, organic and conventional farms did not differ
significantly.
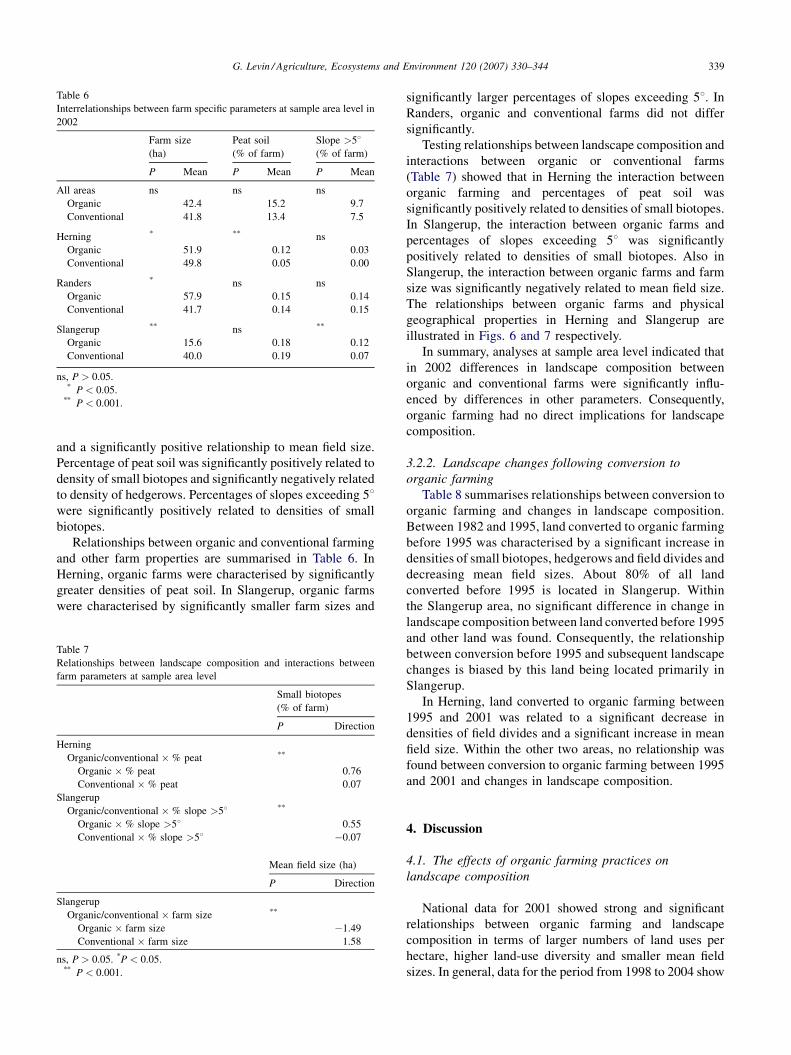
Testing relationships between landscape composition and
interactions between organic or conventional farms
(Table 7) showed that in Herning the interaction between
organic farming and percentages of peat soil was
significantly positively related to densities of small biotopes.
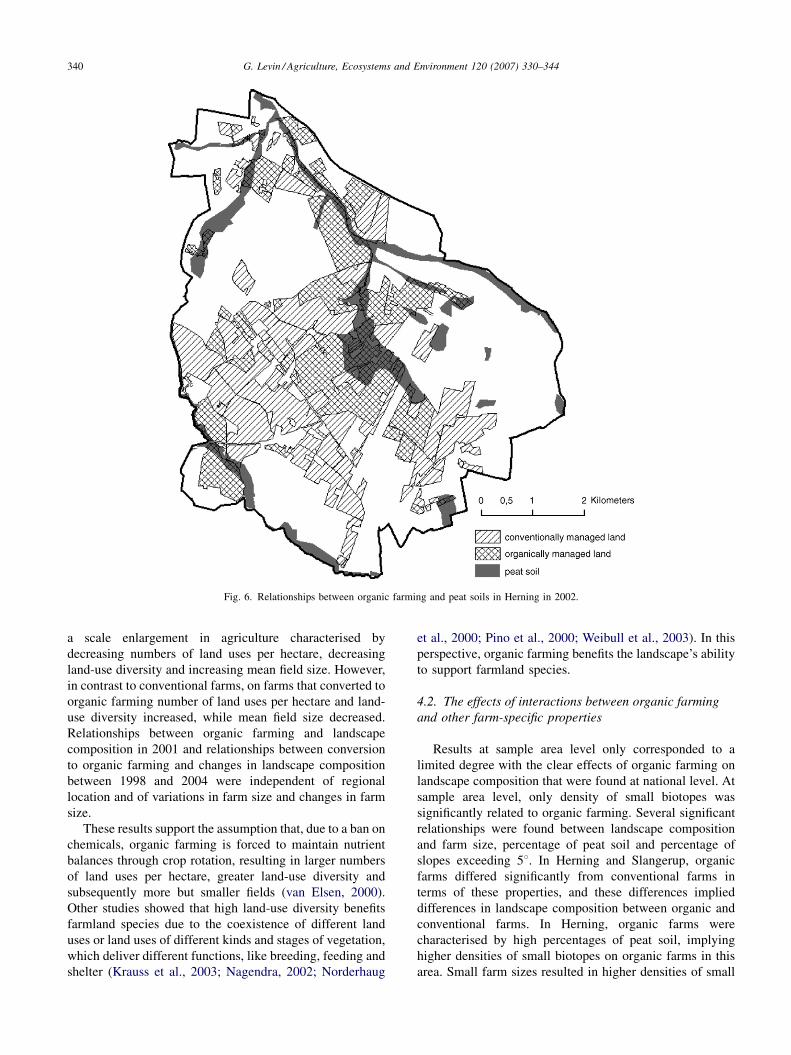
In Slangerup, the interaction between organic farms and
percentages of slopes exceeding 58 was significantly
positively related to densities of small biotopes. Also in
Slangerup, the interaction between organic farms and farm
size was significantly negatively related to mean field size.
The relationships between organic farms and physical
geographical properties in Herning and Slangerup are
illustrated in Figs. 6 and 7 respectively.
In summary, analyses at sample area level indicated that
in 2002 differences in landscape composition between
organic and conventional farms were significantly influ-
enced by differences in other parameters. Consequently,
organic farming had no direct implications for landscape
composition.
3.2.2. Landscape changes following conversion to
organic farming
Table 8 summarises relationships between conversion to
organic farming and changes in landscape composition.
Between 1982 and 1995, land converted to organic farming
before 1995 was characterised by a significant increase in
densities of small biotopes, hedgerows and field divides and
decreasing mean field sizes. About 80% of all land
converted before 1995 is located in Slangerup. Within
the Slangerup area, no significant difference in change in
landscape composition between land converted before 1995
and other land was found. Consequently, the relationship
between conversion before 1995 and subsequent landscape
changes is biased by this land being located primarily in
Slangerup.
In Herning, land converted to organic farming between
1995 and 2001 was related to a significant decrease in
densities of field divides and a significant increase in mean
field size. Within the other two areas, no relationship was
found between conversion to organic farming between 1995
and 2001 and changes in landscape composition.
4. Discussion
4.1. The effects of organic farming practices on
landscape composition
National data for 2001 showed strong and significant
relationships between organic farming and landscape
composition in terms of larger numbers of land uses per
hectare, higher land-use diversity and smaller mean field
sizes. In general, data for the period from 1998 to 2004 show
G. Levin / Agriculture, Ecosystems and Environment 120 (2007) 330–344340
Fig. 6. Relationships between organic farming and peat soils in Herning in 2002.
a scale enlargement in agriculture characterised by
decreasing numbers of land uses per hectare, decreasing
land-use diversity and increasing mean field size. However,
in contrast to conventional farms, on farms that converted to
organic farming number of land uses per hectare and land-
use diversity increased, while mean field size decreased.
Relationships between organic farming and landscape
composition in 2001 and relationships between conversion
to organic farming and changes in landscape composition
between 1998 and 2004 were independent of regional
location and of variations in farm size and changes in farm
size.
These results support the assumption that, due to a ban on
chemicals, organic farming is forced to maintain nutrient
balances through crop rotation, resulting in larger numbers
of land uses per hectare, greater land-use diversity and
subsequently more but smaller fields (van Elsen, 2000).
Other studies showed that high land-use diversity benefits
farmland species due to the coexistence of different land
uses or land uses of different kinds and stages of vegetation,
which deliver different functions, like breeding, feeding and
shelter (Krauss et al., 2003; Nagendra, 2002; Norderhaug
et al., 2000; Pino et al., 2000; Weibull et al., 2003). In this
perspective, organic farming benefits the landscape’s ability
to support farmland species.
4.2. The effects of interactions between organic farming
and other farm-specific properties
Results at sample area level only corresponded to a
limited degree with the clear effects of organic farming on
landscape composition that were found at national level. At
sample area level, only density of small biotopes was
significantly related to organic farming. Several significant
relationships were found between landscape composition
and farm size, percentage of peat soil and percentage of
slopes exceeding 58. In Herning and Slangerup, organic
farms differed significantly from conventional farms in
terms of these properties, and these differences implied
differences in landscape composition between organic and
conventional farms. In Herning, organic farms were
characterised by high percentages of peat soil, implying
higher densities of small biotopes on organic farms in this
area. Small farm sizes resulted in higher densities of small
G. Levin / Agriculture, Ecosystems and Environment 120 (2007) 330–344 341
Fig. 7. Relationships between organic farming and slopes in Slangerup in 2002.
biotopes, higher densities of field divides and smaller mean
field sizes on organic farms in Slangerup. Furthermore, high
densities of small biotopes were also related to high
percentages of steep slopes on organic farms in Slangerup.
In Randers, where organic and conventional farms were not
significantly different in terms of farm size, percentage of
peat soil or percentage of slopes exceeding 58, no
relationship between organic farming and landscape
composition was found.
Land converted to organic farming before 1995 was
characterised by subsequent increases in densities of small
biotopes, hedgerows and field divides. However, this
relationship is biased by the fact that 80% of all land
converted before 1995 was located in Slangerup. The
explanation for changes in landscape composition in relation
to conversion before 1995 must thus be found within the
characteristics of the Slangerup area. While from 1982 to
1995 Herning and Randers were characterised by decreasing
densities of small biotopes and field divides and increasing
mean field sizes, the opposite changes occurred in
Slangerup. Furthermore, agriculture in Slangerup is domi-
nated by small part-time and hobby farms, including organic
farms in this area. Other studies argue that part-time and
hobby farms are often characterised by the greater
significance of non-productive functions (Frederiksen and
Langer, 2005; Kristensen, 1999; Præstholm, 2002). Conse-
quently, changes in landscape composition following
conversion to organic farming in Slangerup are likely to
be influenced by the dominance of small part-time and
hobby farms in this sample area.
In Herning, land converted between 1995 and 2001 was
related to decreasing densities of field divides and
increasing mean field sizes. Based on an investigation of
landscape changes on organic farms in southern Jutland,
Ackermann (2003) found that, among large dairy farms,
conversion to organic farming was followed by a
rearrangement of field structures resulting in increasing
field sizes. As the effects of conversion to organic farming

G. Levin / Agriculture, Ecosystems and Environment 120 (2007) 330–344342
Table 8
Changes in landscape composition following conversion to organic farming at sample area level
Small biotopes
(% of farm)
Hedgerows
(% of farm)
Field divides
(% of farm)
Mean field
size (ha)
P Mean P Mean P Mean P Mean
Changes in landscape composition per year, 1982–1995
All ** ** * **
Converted before 1995 0.098 0.026 0.001 �0.07
Other areas 0.012 0.019 �0.002 0.05
Herning ns ns ns ns
Converted before 1995 0.000 0.038 �0.001 0.04
Other areas �0.001 0.037 �0.002 0.05
Randers ns ns ns ns
Converted before 1995 �0.004 0.008 �0.002 0.07
Other areas �0.006 0.008 �0.002 0.06
Slangerup ns ns ns ns
Converted before 1995 0.111 0.028 0.001 �0.08
Other areas 0.100 0.001 0.001 �0.07
Changes in landscape composition per year, 1995–2002
All ns ns ns ns
Converted 1995–2001 0.023 0.011 0.010 0.04
Other areas 0.022 0.012 0.011 0.04
Herning ns ns ** **
Converted 1995–2001 �0.001 0.023 �0.021 0.08
Other areas �0.001 0.020 �0.005 0.02
Randers ns ns ns ns
Converted 1995–2001 �0.018 0.004 �0.008 0.00
Other areas �0.019 0.005 �0.008 0.01
Slangerup ns ns ns ns
Converted 1995–2001 0.101 0.007 0.005 �0.03
Other areas 0.104 0.006 0.004 �0.04
ns, P > 0.05.* P < 0.05.
** P < 0.001.
were investigated at the field level, it was not possible to
link changes in landscape composition to specific types of
production. However, as agriculture in Herning is
dominated by large dairy farms, it is likely that a
rearrangement of field structures following conversion to
organic farming has resulted in increasing field sizes and
decreasing densities of field divides.
Consequently, in contrast to the national analysis, results
at sample area level do not indicate any direct effect of
organic farming on landscape composition. The differences
in landscape composition between organic and conventional
farms were implied by differences in farm sizes and in
physical geographical conditions. Furthermore, differences
in changes in landscape composition following conversion
to organic farming were biased by the specific character-
istics of the sample areas.
4.3. Strengths and limitations of the applied methods
The data and methods used in this study proved to be
convenient tools for the investigation of relationships
between organic farming and landscape composition. The
focus on farm-specific parameters other than organic or
conventional farming enabled the influences and biases of
these parameters to be examined. However, farm parameters
that were not addressed in this study can affect landscape
composition. In particular, parameters related to the farmer
as an actor can influence landscape management. For
example, farmers’ ages, educational backgrounds and
values, as well as differences between full-time, part-time
and hobby farmers, are important for decision-making in
landscape management. Addressing such parameters would,
however, require information from questionnaires or inter-
views, which went beyond the resources available for this
study.
The particular strength of the investigation at the national
level was that results were general for all of Denmark, except
Bornholm. However, as data for landscape composition at
the national level were limited to the number and diversity of
land uses and field size, no general conclusion regarding the
effect of organic farming on densities of uncultivated
landscape elements could be made.
G. Levin / Agriculture, Ecosystems and Environment 120 (2007) 330–344 343
At the sample are level, it was possible to investigate
landscape composition in terms of densities of different
uncultivated landscape elements. However, the sample area
level only applies to 112 farms in the three sample areas.
Although the sample areas were selected to represent different
kinds of Danish agricultural landscapes, the results were not
representative at the national level. This also explains the
limited correspondence between results at the sample area
level and national level respectively. In spite of this limitation,
the sample area analysis identified important concerns for the
effects of organic farming on landscape composition.
5. Conclusions
It is usually expected that organic farming benefits the
composition of agricultural landscapes. Although sustainable
landscape management is embraced in the principles of
organic farming, standards and rules for organic farming do
not concern landscape specifically. On basis of this
discrepancy between principles and rules, and due to a lack
of appropriate investigations, the aim of this study has been to
investigate differences in landscape composition between
organic and conventional farms, as well as to explore changes
in landscape composition following conversion to organic
farming. Two analytical approaches were used. The first was
based on an investigation of national agricultural registers.
The second approach used aerial photo interpretation for an
analysis of three sample areas.
Analyses at the national level identified a clear relation-
ship between organic farming and landscape composition.
Compared to conventional farms, in 2001 organic farms
were characterised by significantly higher numbers of land
uses per ha, greater land-use diversities and smaller mean
field sizes. In contrast to a general scale enlargement in
agriculture, between 1998 and 2004 conversion to organic
farming was significantly related to increasing numbers of
land uses per hectare, increasing land-use diversity and
decreasing mean field sizes. Both landscape composition in
2001 and changes in landscape composition between 1998
and 2004 were related to the regional location of farms and
to variations in farm size and in change in farm size.
However, the effect of organic farming was independent of
variations in these parameters. Consequently, results at the
national level support the assumption that the ban on
chemicals forces organic farms to maintain nutrient balances
through crop rotation, implying increasing numbers of land
uses per hectare and consequently increasing land-use
diversity and decreasing field sizes, thus improving
conditions for farmland species. Although greater land-
use diversities and smaller field sizes are not intended, the
rules for organic farming necessitate land-use practices that
have a direct beneficial effect on landscape composition.
Results at sample area level did not correspond with those
at the national level. For 2002, significant differences
between organic and conventional farms in terms of higher
densities of small biotopes and in terms of smaller mean
field sizes were only found within two of the three sample
areas. Furthermore, differences in landscape composition
were biased by differences in farm size and in physical
geographical conditions between organic and conventional
farms, and were consequently not a direct effect of organic
farming. Changes in landscape composition in relation to
conversion to organic farming were influenced by the
specific characteristics of the sample areas. Analyses
indicated the respective effects of small part-time and
hobby farms, which dominate agriculture in Slangerup, and
of large dairy farms, which dominate agriculture in Herning.
As the sample area analysis only embraced 112 farms, the
results could not be generalized to the national scale.
However, for understanding the relationships between
organic farming and landscape composition, the findings
indicated the necessity to focus on interactions between
organic farming and other farm-specific characteristics.
References
Ackermann, H.Ø., 2003. Økologiske landmænds landskabsforvaltning – og
faktorerne bag. University of Copenhagen, Institute of Geography,
Copenhagen.
Agger, P., Brandt, J., Byrnak, E., Jensen, S.M., Ursin, M., 1986. Udviklingen
i agerlandets smabiotoper i Østdanmark. Roskilde University, Roskilde.
Aude, E., Tybirk, K., Pedersen, M.B., 2003. Vegetation diversity of con-
ventional and organic hedgerows in Denmark. Agric. Ecosyst. Environ.
99, 135–147.
Benton, T.G., Vickery, J.A., Wilson, J.D., 2003. Farmland biodiversity: is
habitat heterogeneity the key? Trends Ecol. Evol. 16, 182–188.
Brandt, J., Primdahl, J., Reenberg, A., 1999. Rural land-use and landscape
dynamics: analysis of ‘‘driving forces’’ in space and time. In: Kronert,
R., Baudry, J., Bowler, I.R., Reenberg, A. (Eds.), Land-use Changes
and their Environmental Impact in Rural Areas in Europe. UNESCO,
London, pp. 81–102.
Busck, A.G., 2002. Farmers’ landscape decisions: relationships between
farmers’ values and landscape practices. Sociol. Ruralis 42, 233–249.
Clemetsen, M., van Laar, J., 2000. The contribution of organic agriculture to
landscape quality in the Sogn og Fjordane region of Western Norway.
Agric. Ecosyst. Environ. 77, 125–141.
COWI, 1995. Ortophotos 1995.
COWI, 2002. Ortophotos 2002.
Danish Plant Directory, 2002. Field maps 2004.
DIAS (Danish Institute of Agricultural Sciences), 1998. Basisdatakort (top-
soil map) 1:50,000.
Ellis, N.E., Heal, O.W., Dent, J.B., Firbank, L.G., 1999. Pluriactivity, farm
household socio-economics and the botanical characteristics of grass
fields in the Grampian region of Scotland. Agric. Ecosyst. Environ. 76,
121–134.
ENTEC, 1995. Effects of Organic Farming on the Landscape. Entec,
Warwick.
European Environmental Agency, 2005. Agriculture and the environment in
EU-15: the IRENA indicator report. European Environmental Agency,
Copenhagen.
FØJO, 2000. Principper for økologisk jordbrug. Forskningscenter for
økologisk jordbrug, Tjele, Denmark.
Frederiksen, P., 2001. Økologisk omlægning i regionalt perspektiv:
drivkræfter, processer og landskab. In: Tybirk, K., Alrøe, H.F.
(Eds.), Naturkvalitet i økologisk jordbrug. Tjele, Denmark, pp.
25–33.
G. Levin / Agriculture, Ecosystems and Environment 120 (2007) 330–344344
Frederiksen, P., Langer, V., 2005. Density, structure and management of
landscape elements on Danish organic farms. In: Nordic Association of
Agricultural Scientists: Organic Farming for a New Millennium,
Alnarp, Sweden, pp. 157–160.
Hendriks, K., Stobbelaar, D.J., van Mansvelt, J.D., 2000. The appearance of
agriculture: an assessment of the quality of landscape of both organic
and conventional horticultural farms in West Friesland. Agric. Ecosyst.
Environ. 77, 157–175.
IFOAM, 2002. IFOAM Basic Standards for Organic Production and Pro-
cessing. International Federation of Organic Agriculture Movements,
Victoria, Canada.
Krauss, J., Steffan-Dewenter, I., Tscharntke, T., 2003. How does landscape
context contribute to effects of habitat fragmentation on diversity and
population density of butterflies? J. Biogeogr. 30, 889–900.
Kristensen, S.P., 1999. Agricultural land use and landscape changes in
Rostrup, Denmark: processes of intensification and extensification.
Landscape Urban Plan. 46, 117–123.
Kristensen, S.P., Thenail, C., Kristensen, L.S., 2001. Farmers’ involvement
in landscape activities: an analysis of the relationship between farm
location, farm characteristics and landscape changes in two study areas
in Jutland, Denmark. J. Environ. Manage. 61, 301–318.
Kuiper, J., 2000. A checklist approach to evaluate the contribution of organic
farms to landscape quality. Agric. Ecosyst. Environ. 77, 143–156.
Lindkqvist, K., 2002. Hur varierar landskapet mellan ekologiska och
konventionella gardar? Sveriges landbruksuniversitet, Upsalla, Sweden.
MacNaeidhe, F.S., Culleton, N., 2000. The application of parameters
designed to measure nature conservation and landscape development
on Irish farms. Agric. Ecosyst. Environ. 77, 65–78.
Madsen, L.M., 2001. Location of Woodlands: The Danish Afforestation
Programme for Field Afforestation. University of Copenhagen, Institute
of Geography, Copenhagen.
Mander, U., Mikk, M., Kulvik, M., 1999. Ecological and low intensity
agriculture as contributors to landscape and biological diversity. Land-
scape Urban Plan. 46, 169–177.
Ministry of Food, Agriculture and Fisheries, 1998. Agricultural register
1998.
Ministry of Food, Agriculture and Fisheries, 2001. Agricultural register
2001.
Ministry of Food, Agriculture and Fisheries, 2004. Agricultural register
2004.
Nagendra, H., 2002. Opposite trends in response for the Shannon and
Simpson indices of landscape diversity. Appl. Geogr. 22, 175–186.
National Survey and Cadastre, 1954. Aerial photos 1954.
National Survey and Cadastre, 1982. Aerial photos 1982.
National Survey and Cadastre, 2001. Cadastre map of Denmark, 1:40,000.
National Survey and Cadastre, 2004. Digital terrain model Denmark.
Norderhaug, A., Ihse, M., Pedersen, O., 2000. Biotope patterns and abun-
dance of meadow plant species in a Norwegian rural landscape. Land-
scape Ecol. 15, 201–218.
Pino, J., Roda, F., Ribas, J., Pons, X., 2000. Landscape structure and bird
species richness: implications for conservation in rural areas between
natural parks. Landscape Urban Plan. 49, 35–48.
Præstholm, S., 2002. Hobby landowners and afforestation in Europe:
perspectives for sustainable land use planning. In: ISOMUL (Eds.),
Collaborative Planning for the Metropolitan Landscape. Bellingham,
Washington State.
Primdahl, J., 1999. Agricultural landscapes as places of production and for
living in owner’s versus producer’s decision making and the implica-
tions for planning. Landscape Urban Plan. 46, 143–150.
Rossi, R., Nota, D., 2000. Nature and landscape production potentials
of organic types of agriculture: a check of evaluation criteria and
parameters in two Tuscan farm-landscapes. Agric. Ecosyst. Environ.
77, 53–64.
SAS Institute Inc., 2004. SAS/STAT1 9.1 User’s Guide. SAS, Cary, USA.
Schmitzberger, I., Wrbka, Th., Steurer, B., Aschenbrenner, G., Peterseil, J.,
Zechmeister, H.G., 2005. How farming styles influence biodiversity
maintenance in Austrian agricultural landscapes. Agric. Ecosyst.
Environ. 108, 274–290.
Stobbelaar, D.J., Kuiper, J., van Mansvelt, J.D., Kabourakis, E., 2000.
Landscape quality on organic farms in the Messara valley: Crete organic
farms as components in the landscape. Agric. Ecosyst. Environ. 77, 79–
93.
Stolze, M., Piorr, A., Harring, A., Dabbert, S.D., 2000. The Environmental
Impacts of Organic Farming in Europe. University of Hohenheim,
Stuttgart-Hohenheim.
Strukturdirektoratet, 1999. Aktionsplan 2. Økologi i udvikling. Ministeriet
for Fødevarer, Landbrug og Fiskeri, Copenhagen.
Tress, B., 1999. Landwirt schafft Landschaft: Umstellungspotentiale und
landschaftliche Konsequenzen der okologischen Landwirtschaft in
Danemark. Roskilde University, Roskide, Denmark.
Tybirk, K., Ejrnaes, R., Elmegaard, N., Langer, V., Holmstrup, M., 2003.
Naturkvalitet og biodiversitet. In: Holmstrup, M. (Ed.), Gør økologisk
jordbrug en forskel? Danmarks Miljøundersøgelser, Copenhagen, pp.
33–41.
van Elsen, T., 2000. Species diversity as a task for organic agriculture in
Europe. Agric. Ecosyst. Environ. 77, 101–109.
van Mansvelt, J.D., van der Lubbe, M.J., 1999. Checklist for sustainable
landscape management: final report of the EU concerted action AIR3-
CT93-1210: the landscape and nature protection capacity of organic/
sustainable types of agriculture. Elsevier, Amsterdam.
van Mansvelt, J.D., Stobbelaar, D.J., Hendriks, K., 1998. Comparison of
landscape features in organic and conventional farming systems. Land-
scape Urban Plan. 41, 209–227.
Weibull, A.C., Ostman, O., Granquist, A., 2003. Species richness in
agroecosystems: the effect of landscape, habitat and farm management.
Biodivers. Conserv. 13, 1335–1355.
Wilhjelmudvalget, 2001. En rig natur i et rigt samfund. Skov- og Natur-
styrelsen, Copenhagen.