relationship between the tcap and the pearson benchmark
TRANSCRIPT

East Tennessee State UniversityDigital Commons @ East
Tennessee State University
Electronic Theses and Dissertations Student Works
5-2014
Relationship Between the TCAP and the PearsonBenchmark Assessment in Elementary Students’Reading and Math Performance in a NortheasternTennessee School DistrictCherith A. Dugger-RobertsEast Tennessee State University
Follow this and additional works at: https://dc.etsu.edu/etd
Part of the Elementary and Middle and Secondary Education Administration Commons
This Dissertation - Open Access is brought to you for free and open access by the Student Works at Digital Commons @ East Tennessee StateUniversity. It has been accepted for inclusion in Electronic Theses and Dissertations by an authorized administrator of Digital Commons @ EastTennessee State University. For more information, please contact [email protected].
Recommended CitationDugger-Roberts, Cherith A., "Relationship Between the TCAP and the Pearson Benchmark Assessment in Elementary Students’Reading and Math Performance in a Northeastern Tennessee School District" (2014). Electronic Theses and Dissertations. Paper 2330.https://dc.etsu.edu/etd/2330
Relationship Between the TCAP and the Pearson Benchmark Assessment in Elementary
Students’ Reading and Math Performance in a Northeastern Tennessee School District
_____________________
A dissertation
presented to
the faculty of the Department of Educational Leadership and Policy Analysis
East Tennessee State University
in partial fulfillment
of the requirements for the degree
Doctor of Education in Educational Leadership
_____________________
by
Cherith A. Dugger-Roberts
May 2014
_____________________
Dr. Virginia Foley, Chair
Dr. Eric Glover
Dr. James Lampley
Dr. Arnold Nyarambi
Keywords: Benchmark, Formative Assessment, Student Achievement, TCAP
2
ABSTRACT
Relationship Between the TCAP and the Pearson Benchmark Assessment in Elementary
Students’ Reading and Math Performance in a Northeastern Tennessee School District
by
Cherith A. Dugger-Roberts
The purpose of this quantitative study was to determine if there was a relationship between the
TCAP test and Pearson Benchmark assessment in elementary students’ reading and language arts
and math performance in a northeastern Tennessee school district. This study involved 3rd
, 4th,
5th
, and 6th
grade students. The study focused on the following subgroups: gender, Title I school
status, and socioeconomic status as determined by free and reduced-price meal benefits. Test
scores of students taking the Pearson Benchmark assessment in the fall, winter, and spring of the
2011-2012 academic school year and the TCAP in the spring of the 2012 academic school year
were compared. Test scores were collected from 5 elementary schools. A total of 1,069 students
were included in this study.
The analysis focused on 10 research questions. Data collected for this study were entered into an
Excel data file for analysis using IBM-SPSS. The research questions were examined using the
Pearson product-moment correlation coefficients, the t test for independent samples, and the
multivariate analysis of variance (MANOVA) to account for differences in a set of 2 dependent
variables.
3
Based on the analyses and findings of this study, there appears to be a positive relationship
between the TCAP test and Pearson Benchmark assessment in elementary students’ reading and
language arts and math performance in a northeastern Tennessee school district. This
relationship extended across students’ gender, Title I school status, and socioeconomic status as
determined by free and reduced-price meal benefits.
Major recommendations from this study included the use of formative assessment benchmark
tools to generate timely data aimed at the improvement of student learning and achievement,
tracking the time spent on benchmark testing and carefully evaluating whether this is the optimal
use of student academic time, analyzing the use of formative assessment and the relationship to
teacher growth and development, and considering the development of the whole child as opposed
to strictly focusing on quantitative academic measures to define student success.
4
DEDICATION
“In the same way, let your light shine before others, so that they may see your good works and
give glory to your Father who is in heaven.”
(Matthew 5:16 - ESV).
First and foremost I dedicate this work to my Lord and Savior, Jesus Christ. His
everlasting strength and grace have allowed me to persevere in this journey. Glory to my Father,
ad infinitum, for allowing the opportunities to succeed and the intelligence, temperament, and
gifts to accomplish praiseworthy things.
To my husband and best friend, Preston, for his enduring love, unwavering support, and
sweet spirit. Thank you for your endless patience and gentle encouragement. Above all, your
belief that I can accomplish anything has given me the fortitude and tenacity to see this process
to the end.
To my mother and father, Donald and Sherree, for their unconditional love, support, and
guidance. Thank you for being wonderful role models, teachers, and cheerleaders. You always
encourage my endeavors and have instilled in me the faith and values I hold so dear. To my
mother, Sherree, thank you for embodying the true meaning of resilience.
To the memory of my aunt, Joyce, who instilled in me the audacity to persevere no matter
the challenge. I am so thankful that we shared many years and countless memories. I am truly
blessed that you were an integral part of influencing the person I am today.
To many family members, special friends, and colleagues who have offered their support,
encouragement, guidance, and prayers. I am reminded that happiness is found in the journey, not

5
at the destination. I have been truly blessed by all those I have encountered and learned from
along this journey. May God bless you!
6
ACKNOWLEDGEMENTS
I wish to extend my sincere gratitude to Dr. Virginia Foley, my dissertation chair, whose
wisdom, patience, and kindness have been a source of inspiration throughout this process. Our
paths never crossed prior to the dissertation phase of my doctoral journey, but I am certain that
the Lord placed you in my life. During this endeavor, I would find myself telling others, “Dr.
Foley is earning jewels in her crown,” and I truly meant every word! Thank you for embodying
lifelong learning and being such an integral part of my personal and educational journey!
Additionally, I extend my gratitude to each of my dissertation committee members:
To Dr. James Lampley, thank you for guiding me throughout the research process. I am
blessed to have known you as an undergraduate student and equally as blessed to learn from you
through my doctoral coursework and dissertation.
To Dr. Eric Glover, my ETSU experience would be incomplete without you! Thank you
for imparting your wisdom, sharing your vision, and constantly challenging me to think
unconventionally!
To Dr. Arnold Nyarambi, thank you for sharing your educational expertise. I am so
thankful that you were a part of my doctoral journey!
A special thank you to Mrs. Jennifer Rouse for mentoring and encouraging a young
teacher with leadership aspirations. Thank you, again, for mentoring, inspiring, and uplifting a
young leader. You have been an essential part of my professional and educational journey and
your time, thoughtfulness, advice, and encouragement will not be forgotten.
7
I also wish to thank Dr. Susan Twaddle, my statistician, and Ms. Anita Black, my editor.
You both contributed greatly to the success and timely completion of this study. Thank you for
sharing your expertise!

8
TABLE OF CONTENTS
Page
ABSTRACT ..................................................................................................................... 2
DEDICATION .................................................................................................................. 4
ACKNOWLEDGEMENTS............................................................................................... 6
LIST OF TABLES….......................................................................................................... .. 12
LIST OF FIGURES .......................................................................................................... 15
Chapter
1. INTRODUCTION ..................................................................................................... 19
Statement of the Problem ....................................................................................... 23
Research Questions ............................................................................................... 24
Significance of the Study ....................................................................................... 26
Definition of Terms ............................................................................................... 27
Delimitations and Limitations ................................................................................ 28
Overview of the Study ........................................................................................... 29
2. REVIEW OF LITERATURE .................................................................................... 30
American Education in the Age of Accountability ................................................. 30
Historical Goals of Education .......................................................................... 30
Educational Accountability .............................................................................. 32
Political Influence and Education........................................................................... 33
The Elementary and Secondary Education Act (ESEA) .................................... 33
A Nation at Risk – A Manufactured Crisis ....................................................... 34
Goals 2000: Educate America Act ................................................................... 39
The Improving America’s Schools Act (ISIA) ................................................. 41
The No Child Left Behind Act (NCLB) ........................................................... 43

9
Chapter Page
The Race to the Top ......................................................................................... 47
Tennessee’s First to the Top ............................................................................. 51
Standards and Assessments ........................................................................ 53
Data to Inform Instruction .......................................................................... 53
Great Teachers and Leaders ....................................................................... 54
Teacher and Principal Evaluation ............................................................... 54
Investment in Professional Development .................................................... 55
Turnaround Schools ................................................................................... 55
STEM ........................................................................................................ 55
A Blueprint for Educational Reform ................................................................ 57
Tennessee Comprehensive Assessment Program (TCAP) ...................................... 60
Tennessee Value-Added Assessment Program (TVAAS)....................................... 61
Formative Assessment ........................................................................................... 64
The History of Formative Assessment .............................................................. 65
Defining Formative Assessment ....................................................................... 66
Functions and Elements of Formative Assessment ........................................... 68
Political Policy and Formative Assessment ...................................................... 70
Benchmark Assessments as Formative Assessment................................................ 72
Pearson Benchmark ............................................................................................... 77
3. METHODOLOGY ................................................................................................... 78
Introduction ........................................................................................................... 78
Research Design .................................................................................................... 78
Population ............................................................................................................. 79
Procedures ............................................................................................................. 80
Instrumentation...................................................................................................... 81
Research Questions and Hypotheses ...................................................................... 81

10
Chapter Page
Data Analysis ........................................................................................................ 90
Summary ............................................................................................................... 90
4. DATA ANALYSIS ................................................................................................... 92
Introduction ........................................................................................................... 92
Demographics ....................................................................................................... 92
Gender ............................................................................................................. 93
Title I School Status ......................................................................................... 93
Socioeconomic Status ...................................................................................... 94
Analysis of Research Questions ............................................................................. 94
Research Question #1 ............................................................................................ 94
Research Question #2 ............................................................................................ 99
Research Question #3 ............................................................................................ 103
Research Question #4 ............................................................................................ 103
Research Question #5 ............................................................................................ 112
Research Question #6 ............................................................................................ 117
Research Question #7 ............................................................................................ 122
Research Question #8 ............................................................................................ 133
Research Question #9 ............................................................................................ 141
Research Question #10 .......................................................................................... 153
5. SUMMARY OF FINDINGS, CONCLUSIONS, AND RECOMMENDATIONS ..... 164
Introduction ........................................................................................................... 164
Summary of Findings ............................................................................................ 164
Research Question #1 ...................................................................................... 165
Research Question #2 ...................................................................................... 166
Research Question #3 ...................................................................................... 166
Research Question #4 ...................................................................................... 167

11
Chapter Page
Research Question #5 ...................................................................................... 167
Research Question #6 ...................................................................................... 168
Research Question #7 ...................................................................................... 168
Research Question #8 ...................................................................................... 169
Research Question #9 ...................................................................................... 170
Research Question #10 .................................................................................... 171
Conclusions ........................................................................................................... 172
Conclusion #1 .................................................................................................. 172
Conclusion #2 .................................................................................................. 172
Conclusion #3 .................................................................................................. 172
Conclusion #4 .................................................................................................. 172
Conclusion #5 .................................................................................................. 173
Concluding Summary ...................................................................................... 173
Recommendations for Practice............................................................................... 174
Recommendations for Further Research................................................................. 175
Summary ............................................................................................................... 177
REFERENCES ................................................................................................................. 179
APPENDICES .................................................................................................................. 186
APPENDIX A: Director of Schools’ Letter ........................................................... 186
APPENDIX B: ETSU IRB Exemption Letter ....................................................... 187
VITA…....................................................................................................................... .......... 188

12
LIST OF TABLES
Table Page
1. Correlations for Pearson Benchmark Reading and Language Arts and TCAP
Reading and Language Arts by Grade .................................................................... 96
2. Correlations for Pearson Benchmark Math and TCAP Math by Grade ................... 100
3. Means and Standard Deviations for Third Grade TCAP Reading and Language
Arts and Pearson Benchmark Reading and Language Arts by Title I Status ........... 124
4. Means and Standard Deviations for Fourth Grade TCAP Reading and Language
Arts and Pearson Benchmark Reading and Language Arts by Title I Status ........... 127
5. Means and Standard Deviations for Fifth Grade TCAP Reading and Language
Arts and Pearson Benchmark Reading and Language Arts by Title I Status ........... 129
6. Means and Standard Deviations for Sixth Grade TCAP Reading and Language
Arts and Pearson Benchmark Reading and Language Arts by Title I Status ........... 132
7. Means and Standard Deviations for Third Grade TCAP Math and Pearson
Benchmark Math by Title I Status ......................................................................... 134
8. Means and Standard Deviations for Fourth Grade TCAP Math and Pearson
Benchmark Math by Title I Status ......................................................................... 136
9. Means and Standard Deviations for Fifth Grade TCAP Math and Pearson
Benchmark Math by Title I Status ......................................................................... 138
10. Means and Standard Deviations for Sixth Grade TCAP Math and Pearson
Benchmark Math by Title I Status ......................................................................... 140

13
Table Page
11. Means and Standard Deviations for Third Grade TCAP Reading and Language
Arts and Pearson Benchmark Reading and Language Arts by Socioeconomic
Status as Measured by Free and Reduced-Price Meal Benefits ............................... 143
12. Means and Standard Deviations for Fourth Grade TCAP Reading and Language
Arts and Pearson Benchmark Reading and Language Arts by Socioeconomic
Status as Measured by Free and Reduced-Price Meal Benefits ............................... 146
13. Means and Standard Deviations for Fifth Grade TCAP Reading and Language
Arts and Pearson Benchmark Reading and Language Arts by Socioeconomic
Status as Measured by Free and Reduced-Price Meal Benefits ............................... 149
14. Means and Standard Deviations for Sixth Grade TCAP Reading and Language
Arts and Pearson Benchmark Reading and Language Arts by Socioeconomic
Status as Measured by Free and Reduced-Price Meal Benefits ............................... 152
15. Means and Standard Deviations for Third Grade TCAP Math and Pearson
Benchmark Math by Socioeconomic Status as Measured by Free and
Reduced-Price Meal Benefits ................................................................................. 155
16. Means and Standard Deviations for Fourth Grade TCAP Math and Pearson
Benchmark Math by Socioeconomic Status as Measured by Free and
Reduced-Price Meal Benefits ................................................................................. 158
17. Means and Standard Deviations for Fifth Grade TCAP Math and Pearson
Benchmark Math by Socioeconomic Status as Measured by Free and
Reduced-Price Meal Benefits ................................................................................. 160

14
Table Page
18. Means and Standard Deviations for Sixth Grade TCAP Math and Pearson
Benchmark Math by Socioeconomic Status as Measured by Free and
Reduced-Price Meal Benefits ................................................................................ 163
15
LIST OF FIGURES
Figure Page
1. Scatterplot for TCAP Reading and Language Arts and Pearson Benchmark Reading
and Language Arts for the Third Grade .................................................................. 97
2. Scatterplot for TCAP Reading and Language Arts and Pearson Benchmark Reading
and Language Arts for the Fourth Grade ................................................................ 97
3. Scatterplot for TCAP Reading and Language Arts and Pearson Benchmark Reading
and Language Arts for the Fifth Grade ................................................................... 98
4. Scatterplot for TCAP Reading and Language Arts and Pearson Benchmark Reading
and Language Arts for the Sixth Grade .................................................................. 98
5. Scatterplot for TCAP Math and Pearson Benchmark Math for the Third Grade...... 101
6. Scatterplot for TCAP Math and Pearson Benchmark Math for the Fourth Grade .... 101
7. Scatterplot for TCAP Math and Pearson Benchmark Math for the Fifth Grade ....... 102
8. Scatterplot for TCAP Math and Pearson Benchmark Math for the Sixth Grade ...... 102
9. Boxplots for Third Grade TCAP Reading and Language Arts Scores by Gender .... 104
10. Boxplots for Fourth Grade TCAP Reading and Language Arts Scores by Gender .. 105
11. Boxplots for Fifth Grade TCAP Reading and Language Arts Scores by Gender ..... 106
12. Boxplots for Sixth Grade TCAP Reading and Language Arts Scores by Gender .... 107
13. Boxplots for Third Grade TCAP Math Scores by Gender....................................... 108
14. Boxplots for Fourth Grade TCAP Math Scores by Gender ..................................... 110
15. Boxplots for Fifth Grade TCAP Math Scores by Gender ........................................ 111
16. Boxplots for Sixth Grade TCAP Math Scores by Gender ....................................... 112

16
Figure Page
17. Boxplots for Third Grade Pearson Benchmark Reading and Language Arts Scores
by Gender .............................................................................................................. 113
18. Boxplots for Fourth Grade Pearson Benchmark Reading and Language Arts Scores
by Gender .............................................................................................................. 114
19. Boxplots for Fifth Grade Pearson Benchmark Reading and Language Arts Scores
by Gender .............................................................................................................. 116
20. Boxplots for Sixth Grade Pearson Benchmark Reading and Language Arts Scores
by Gender .............................................................................................................. 117
21. Boxplots for Third Grade Pearson Benchmark Math Scores by Gender.................. 118
22. Boxplots for Fourth Grade Pearson Benchmark Math Scores by Gender ................ 120
23. Boxplots for Fifth Grade Pearson Benchmark Math Scores by Gender ................... 121
24. Boxplots for Sixth Grade Pearson Benchmark Math Scores by Gender .................. 122
25. Boxplots for Third Grade TCAP Reading and Language Arts and Pearson
Benchmark Reading and Language Arts by Title I Status ....................................... 125
26. Boxplots for Fourth Grade TCAP Reading and Language Arts and Pearson
Benchmark Reading and Language Arts by Title I Status ....................................... 127
27. Boxplots for Fifth Grade TCAP Reading and Language Arts and Pearson
Benchmark Reading and Language Arts by Title I Status ....................................... 130
28. Boxplots for Sixth Grade TCAP Reading and Language Arts and Pearson
Benchmark Reading and Language Arts by Title I Status ....................................... 132
29. Boxplots for Third Grade TCAP Math and Pearson Benchmark Math by Title I
Status ….................................................................................................................... 134

17
Figure Page
30. Boxplots for Fourth Grade TCAP Math and Pearson Benchmark Math by Title I
Status .................................................................................................................. 136
31. Boxplots for Fifth Grade TCAP Math and Pearson Benchmark Math by Title I
Status .................................................................................................................. 138
32. Boxplots for Sixth Grade TCAP Math and Pearson Benchmark Math by Title I
Status .................................................................................................................. 140
33. Boxplots for Third Grade TCAP Reading and Language Arts and Pearson
Benchmark Reading and Language Arts by Socioeconomic Status as Measured
by Free and Reduced-Price Meal Benefits.............................................................. 144
34. Boxplots for Fourth Grade TCAP Reading and Language Arts and Pearson
Benchmark Reading and Language Arts by Socioeconomic Status as Measured
by Free and Reduced-Price Meal Benefits.............................................................. 147
35. Boxplots for Fifth Grade TCAP Reading and Language Arts and Pearson
Benchmark Reading and Language Arts by Socioeconomic Status as Measured
by Free and Reduced-Price Meal Benefits.............................................................. 150
36. Boxplots for Sixth Grade TCAP Reading and Language Arts and Pearson
Benchmark Reading and language Arts by Socioeconomic Status as Measured
by Free and Reduced-Price Meal Benefits.............................................................. 153
37. Boxplots for Third Grade TCAP Math and Pearson Benchmark Math by
Socioeconomic Status as Measured by Free and Reduced-Price Meal Benefits ...... 156
38. Boxplots for Fourth Grade TCAP Math and Pearson Benchmark Math by
Socioeconomic Status as Measured by Free and Reduced-Price Meal Benefits ...... 158

18
Figure Page
39. Boxplots for Fifth Grade TCAP Math and Pearson Benchmark Math by
Socioeconomic Status as Measured by Free and Reduced-Price Meal Benefits ...... 161
40. Boxplots for Sixth Grade TCAP Math and Pearson Benchmark Math by
Socioeconomic Status as Measured by Free and Reduced-Price Meal Benefits ...... 163

19
CHAPTER 1
INTRODUCTION
Our nation, which has prevailed in conflict after conflict over several centuries, now
faces a stark and sudden choice: adapt or perish. I’m not referring to the war against
terrorism but to a war of skills – one that America is at a risk of losing to India, China
and other emerging economies. And we’re not at risk of losing it on factory floors or lab
benches. It’s happening every day, all across the country, in our public schools. Unless
we transform those schools and do it now . . . it will soon be too late. (Louis Gerstner,
former Chairman, IBM, as cited in Hershberg, 2005, p. 1)
As former IBM Chairman Louis Gerstner has recognized, one of the gravest dangers
facing America today is the challenge of human capital development. The foundation for this
effort lies in American public schools. Consequently the last five presidents, the Congress, state
governors, and corporate leaders have developed a keen understanding that if America is to
remain a stable, middle-class society and a key contributor in the global economic context,
measures are required in order to significantly improve American public education (Hershberg,
2005).
The challenge of developing human capital has thrust America into an age of educational
accountability and in an era currently pronounced by political goals aimed at educational reform,
excellence in education is most often equated to good standardized test scores. The impetus
placed on standardized test scores as a measure of accountability has grown in intensity
commensurate with the emphasis placed on educational legislation directed at transforming
America’s public schools. Consequently public schools are constantly seeking avenues to

20
increase student achievement as measured by test scores; districts, schools, and teachers desire to
bolster their instructional effectiveness by collecting timely student data to drive standards-based
instruction and make informed curricular decisions.
The passage of the Elementary and Secondary Education Act of 1965 (ESEA) led the
modern educational reform movement. Over the next several decades, a Nation at Risk, Goals
2000: Educate America Act, and the Improving America’s Schools Act (ISIA) all paved the way
for the most prominent piece of American educational legislation. The No Child Left Behind Act
(NCLB) was passed with bipartisan consensus in 2002 and provided unprecedented expansion of
the role of the federal government in K-12 education. NCLB required all states to set academic
standards in an effort to move away from norm-based testing and required schools to test
students annually in order to create baseline measures to gain insight about changes in
achievement levels over time. It forced schools to shift their attention to the academic progress
of long-overlooked low-income and minority students and introduced controversial
consequences for schools that failed to meet NCLB’s performance targets (U.S. Department of
Education, 2010). Given the political realities at the state and federal level, NCLB was not and
could not in itself provide an extraordinary overhaul of the American public education system. It
contained many flaws; however, it did set the tone that America was determined to educate all
children to unprecedentedly high levels of educational achievement and provided high stakes to
affect such change (Hershberg, 2005).
Under the Obama administration two key pieces of educational legislation followed
NCLB. The Race to the Top and the Blueprint for Educational Reform could be perceived as
direct descendants of and attempts to repair the shortcomings of their legislative predecessors.
Race to the Top required the implementation of rigorous standards and high quality assessments.
21
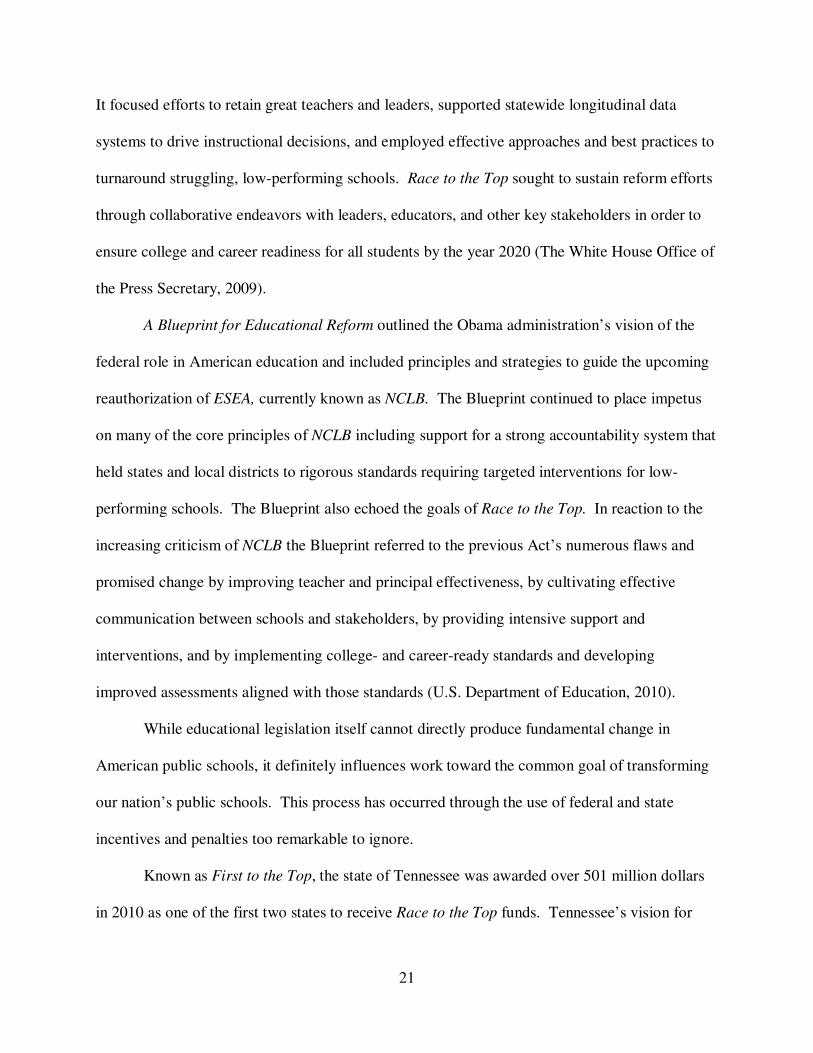
It focused efforts to retain great teachers and leaders, supported statewide longitudinal data
systems to drive instructional decisions, and employed effective approaches and best practices to
turnaround struggling, low-performing schools. Race to the Top sought to sustain reform efforts
through collaborative endeavors with leaders, educators, and other key stakeholders in order to
ensure college and career readiness for all students by the year 2020 (The White House Office of
the Press Secretary, 2009).
A Blueprint for Educational Reform outlined the Obama administration’s vision of the
federal role in American education and included principles and strategies to guide the upcoming
reauthorization of ESEA, currently known as NCLB. The Blueprint continued to place impetus
on many of the core principles of NCLB including support for a strong accountability system that
held states and local districts to rigorous standards requiring targeted interventions for low-
performing schools. The Blueprint also echoed the goals of Race to the Top. In reaction to the
increasing criticism of NCLB the Blueprint referred to the previous Act’s numerous flaws and
promised change by improving teacher and principal effectiveness, by cultivating effective
communication between schools and stakeholders, by providing intensive support and
interventions, and by implementing college- and career-ready standards and developing
improved assessments aligned with those standards (U.S. Department of Education, 2010).
While educational legislation itself cannot directly produce fundamental change in
American public schools, it definitely influences work toward the common goal of transforming
our nation’s public schools. This process has occurred through the use of federal and state
incentives and penalties too remarkable to ignore.
Known as First to the Top, the state of Tennessee was awarded over 501 million dollars
in 2010 as one of the first two states to receive Race to the Top funds. Tennessee’s vision for

22
First to the Top would create an intensive focus on the power of human capital through great
teachers and leaders who have access to the tools needed to develop the human capital of their
students. Two critical components, or tools, of First to the Top involved standards and
assessments as well as data to drive and inform instruction (Tennessee Department of Education,
2010e). The Tennessee Comprehensive Assessment Program (TCAP) is the state’s annual
standards-based assessment measure that is required in grades 3 through 8. The TCAP provides
an annual, summative measure of achievement in reading and language arts, mathematics,
science, and social studies (Tennessee Department of Education, 2010b). The Tennessee Value-
Added Assessment System (TVAAS) is a statistical process that measures the impact that
schools and teachers provide on their students’ academic progress by analyzing the factors
affecting student achievement that the school can control, such as their students’ academic
progress during the school year (Tennessee Department of Education, 2013b). (However, it is
important to note that some educators have disagreed with the premise of TVAAS asserting that
schools and teachers cannot ultimately control students’ yearly academic progress as external
factors such as socioeconomic status and previous achievement directly impact student progress.)
TVAAS is based upon TCAP scores and focuses on ensuring that all students, not just the lowest
performers, receive at least a year’s growth of academic achievement in a year. TVAAS also
provides rich diagnostics designed to improve instruction (Hershberg, 2005).
While TCAP and TVAAS provide valuable information, both are based on summative
measures. Therefore, school districts are opting to use formative assessment measures to provide
information and feedback regarding instructional effectiveness throughout the school year in an
ongoing manner. According to Black and Wiliam (1998a) there is clear evidence that teachers’
ongoing use of assessment to guide and inform instruction can lead to statistically significant

23
gains in students’ learning and achievement. Pearson Benchmark is one example of a formative
assessment package. Pearson Benchmark is a comprehensive, customizable, Web-based district-
level formative assessment testing system and reporting tool. It provides formative assessment
through multiple measures of student performance against standards at any point throughout the
school year and also provides opportunities to monitor student progress against standards and
recheck mastery with student performance results collected over time (Pearson, 2013a, 2013b).
Statement of the Problem
In an era marked by educational accountability school effectiveness dedicated to
improving students’ academic achievement is paramount. The purpose of this study was to
determine if there is a relationship between the TCAP test and Pearson Benchmark assessment in
elementary students’ reading and language arts and math performance in a northeastern
Tennessee school district. This study involved third, fourth, fifth, and sixth grade students in the
content areas of reading and language arts and math. The study was focused on the following
subgroups: gender, Title I school status, and socioeconomic status as determined by free and
reduced-price meal benefits.
The objective of this study was to examine the relationship between the TCAP test and
the Pearson Benchmark assessment. If a strong positive relationship exists, benchmark
assessments could be critical to the teaching and learning cycle in order to improve instruction
prior to high-stakes, summative, standardized tests. Douglas B. Reeves, founder of the Center
for Performance Assessment, has suggested that there is good reason for the boom in the use of
benchmark assessments. He indicated that most states and school districts are merely providing
nothing more than academic achievement “autopsy reports” based on summative measures. To

24
continue the analogy these reports simply explain how the “patient” died because the time to use
that data to affect instructional outcomes for the “patient” has already passed (Olson, 2005).
Benchmark tests can provide ongoing data to provide interventions and improve student
achievement throughout the teaching and learning cycle.
Research Questions
The following research questions guided this study:
Research Question 1: Are there significant relationships between the percentage correct
scores on the Tennessee Comprehensive Assessment Program (TCAP) in reading and language
arts and the percentage correct scores on the Pearson Benchmark assessment in reading and
language arts for students in grade 3, grade 4, grade 5, and grade 6?
Research Question 2: Are there significant relationships between the percentage correct
scores on the Tennessee Comprehensive Assessment Program (TCAP) in math and the
percentage correct scores on the Pearson Benchmark assessment in math for students in grade 3,
grade 4, grade 5, and grade 6?
Research Question 3: Are there significant differences in the mean percentage correct
scores on the Tennessee Comprehensive Assessment Program (TCAP) in reading and language
arts between male and female students for each grade?
Research Question 4: Are there significant differences in the mean percentage correct
scores on the Tennessee Comprehensive Assessment Program (TCAP) in math between male
and female students for each grade?

25
Research Question 5: Are there significant differences in the mean percentage correct
scores on the Pearson Benchmark assessment in reading and language arts between male and
female students for each grade?
Research Question 6: Are there significant differences in the mean percentage correct
scores on the Pearson Benchmark assessment in math between male and female students for each
grade?
Research Question 7: Are there differences between students who are attending Title I
and non-Title I schools and the percentage correct scores on the Tennessee Comprehensive
Assessment Program (TCAP) in reading and language arts and the percentage correct scores on
the Pearson Benchmark assessment in reading and language arts for each grade?
Research Question 8: Are there significant differences between students who are
attending Title I and non-Title I schools and the percentage correct scores on the Tennessee
Comprehensive Assessment Program (TCAP) in math and the percentage correct scores on the
Pearson Benchmark assessment in math for each grade?
Research Question 9: Are there significant relationships between students’
socioeconomic status (as measured by free and reduced-price meal benefits) and the percentage
correct scores on the Tennessee Comprehensive Assessment Program (TCAP) in reading and
language arts and the percentage correct scores on the Pearson Benchmark assessment in reading
and language arts for each grade?
Research Question 10: Are there significant relationships between students’ socioeconomic
status (as measured by free and reduced-price meal benefits) and the percentage correct scores on
the Tennessee Comprehensive Assessment Program (TCAP) in math and the percentage correct
scores on the Pearson Benchmark assessment in math for each grade?

26
Significance of the Study
Eighty percent of superintendents and directors of schools surveyed by Education Week
in 2005 indicated that they would be using benchmark assessments three to five times per year
during the 2005-2006 school year. This may be the direct result of the National Center for
Educational Accountability’s finding that the periodic use of benchmark assessments is a
common characteristic of high-performing school districts (Olson, 2005). Proponents of
benchmark assessments as a formative assessment tool have touted their ability to help educators
“work smarter, not harder” and more effectively teach more in less time. Accordingly the
vendors that generate state-specific, standard-driven benchmark and formative assessments have
comprised a half-billion dollar market.
The significance of this study resides in the fact that so many American public schools
are devoting large amounts of money to purchase formative benchmark assessment packages.
Schools are using benchmark tests to guide and improve instruction aimed at simultaneously
increasing student achievement and standardized test scores. Therefore, there is a great need to
gather and analyze data about these formative benchmark assessments to determine if they are in
fact a predictive indicator of academic achievement and performance.
It is essential to make educators aware of the potential quality that benchmark
assessments may hold. Used as a formative assessment tool, the data can inform and drive
instruction in an ongoing manner to affect student learning as well as predict student
achievement on standardized, high-stakes tests. The researcher hopes that an examination of this
study will add to the discussion about the use of formative benchmark assessments. Examining
the surrounding issues may help school districts make best use of their resources to impact
student achievement. The information gleaned through this study may assist school districts as
27
they examine the challenging opportunities that benchmark assessments provide. Additionally
the researcher anticipates that an ongoing discussion will lead to questions for further research.
Definition of Terms
1. Benchmark assessment: A benchmark assessment is a type of formative assessment.
Benchmark assessments usually are available in multiple forms so that the assessment can be
administered to the same students at several times during a school year limiting the impact of
practice effects. In addition to formative functions, benchmark assessments allow educators
to monitor the progress of students against state standards and to predict performance on state
exams (Brown & Coughlin, 2007).
2. Criterion-referenced test: A criterion-referenced test is an assessment that evaluates the
performance of a student measured against a standard or set of prespecified criteria rather
than the performance of other students who take the same test (Harvey, 2004-2013).
3. Formative assessment: A formative assessment is an assessment designed to provide
information to guide instruction (Brown & Coughlin, 2007).
4. Non-Title I School: A non-Title I school is a school that does not have access to Title I funds
(U.S. Department of Education, 2002b).
5. Pearson benchmark: A comprehensive, customizable, Web-based district-level formative
assessment testing system and reporting tool (Pearson, 2013a).
6. State content standards: State content standards are the knowledge and skills that all students
are expected to learn for each grade level and academic subject area. This includes the
minimum standards for school districts to follow and to communicate to the public (Brown &
Coughlin, 2007).

28
7. Student achievement: For this study student achievement is primarily used to indicate
student learning as measured by test scores.
8. Tennessee Comprehensive Assessment Program (TCAP): The Tennessee Comprehensive
Assessment Program (TCAP) assesses reading and language arts, mathematics, science, and
social studies for students in Grades 3-8 each spring. The TCAP is a criterion-referenced,
timed, multiple-choice assessment based on Tennessee content standards. The results are
reported to parents, teachers, and administrators (Tennessee Department of Education,
2010b).
9. Tennessee Value-Added Assessment System (TVAAS): The Tennessee Value-Added
Assessment System (TVAAS) is a tool that provides feedback to school leaders and teachers
on student progress based upon the factors the school can control. It allows districts, schools,
and teachers to follow student achievement over time and provides schools with a
longitudinal view of student performance. TVAAS provides valuable information for
teachers to make informed instructional decisions (Tennessee Department of Education,
2013a).
10. Title I school: A Title I school is a school that receives funds under Title I of the Elementary
and Secondary Education Act (ESEA). Title I supports programs to improve the academic
achievement of students from low-income families. This category is the method used to
analyze economically disadvantaged (U.S. Department of Education, 2003).
Delimitations and Limitations
This study was delimited to students enrolled in the third, fourth, fifth, and sixth grade in
five public schools in a northeastern Tennessee city school district during the 2011-2012 school

29
year. Further the population of this study was delimited to students in the third, fourth, fifth, and
sixth grade having taken the Pearson Benchmark test in the fall, winter, and spring and the TCAP
test in April during the 2011-2012 school year.
This study was limited to those third, fourth, fifth, and sixth grade students who had taken
both the Pearson Benchmark and TCAP test in reading and language arts and math during the
2011-2012 school year. The main limitation of this study is one of limited generalizability.
Overview of the Study
This study is organized in five chapters. Chapter 1 contains an introduction to the study,
statement of the problem, research questions, significance of the study, definition of terms, and
delimitations and limitations. Chapter 2 provides a review of literature pertinent to the issues
addressed in this study. The research methodology and design are discussed in Chapter 3 along
with the study’s population, procedures, instrumentation, research questions, and data collection
and analysis. Chapter 4 presents the results of the study. Finally Chapter 5 contains the
summary of findings, the conclusions, and recommendations for further study.
30
CHAPTER 2
REVIEW OF THE LITERATURE
American Education in the Age of Accountability
Since its inception American education has been marked by a multitude of social,
economic, and political goals. These goals have directly influenced and challenged the
educational process, teaching and learning, assessment to monitor progress, and accountability.
In an era currently pronounced by political goals aimed at educational reform, excellence in
education is equated to good test scores. The instrument used to determine excellence in
education is standards- and test-based accountability (Spring, 2006; Webb 2006; Zhao, 2009).
Emphasizing the central role and relationship of accountability, standards, and testing, President
George W. Bush stated,
Accountability is an exercise in hope. When we raise academic standards, children raise
their academic sights. When children are regularly tested, teachers know where and how
to improve. When scores are known to parents, parents are empowered to push for
change. When accountability for our schools is real, the results for our children are real
(U.S. Department of Education, 2002a, slide 6).
Historical Goals of Education
According to Spring (2006) and Webb (2006) the historical goals of American education
have evolved with the social, economic, and political circumstances and demands of the
particular period. In the 1820s America’s first common schools were charged with the task of
teaching Caucasian children a common set of moral and political principles with the aim of
31
improving economic opportunities and society in general. Decades later American education in
the post-Civil War era was characterized by transformations in public elementary and secondary
education. One of these transformations involved the manual training movement designed to
prepare students for work; it served as a precursor to vocational education.
At the turn of the 20th century attention shifted to compulsory attendance, literacy, urban
development, industrialization, and emphasis on improving familial life. Then, at a time when
the country faced a significant economic downturn prior to World War II, the educational focus
shifted to the labor market, youth socialization, and character education. Patriotism and a
curriculum designed to preserve and promote national security were also predominant at this
time. Next, the liberal reforms that began in the 1960s to fight the War on Poverty greatly
impacted the goals of American education. The aim of equality of opportunity sought to end the
vicious cycle of inadequate education, low wages, and impoverished conditions: housing, diet,
health, and medical care. The American school provided one avenue to address these issues.
Further, equality of opportunity served as a backdrop for the civil rights movement, increasing
educational opportunities for immigrants and children with disabilities as well as key education
legislation. This era was followed by waves of reform movements and a call to return to the
basics in the 1980s. These reform movements generated an emphasis on standards and
accountability and replaced a focus on equity in education with a focus on excellence in
education (Spring, 2006; Webb, 2006).
Yet another wave of educational reform swept the nation in the 1990s and brought with it
an unprecedented event in American educational history. For the first time the federal
government joined state leaders as they sanctioned national goals for American schools.
Education had officially become a part of the modern day political agenda. This set the stage for
32
the development of national curriculum standards and the adoption of accountability systems to
monitor the progress of standards-based instruction. Concurrently, schools were charged with
the urgent and important goals of teaching students to become critical thinkers and economic
opportunists in an ever-changing global society (Spring, 2006; Webb, 2006). In 2012 political
pressure continued to stimulate and direct the purposes of the American educational system. As
in the past, American schools faced the challenges of encountering and effectively conquering
multiple and complex social, economic, and political goals.
Educational Accountability
According to Carnoy and Leob (2002) American educational accountability traditionally
has been embedded in the control exerted by the local community and parents through school
boards. However with the added impetus on standards-based accountability in recent decades,
educational accountability in America is controlled less and less by local school boards and more
and more by agencies at the state level. Hoy and Miskel (2008) suggested that the force behind
educational accountability is grounded on three underlying principles:
1. Schools should be held accountable for higher standards of performance.
2. Schools should be provided assistance to build their capacities for delivering improved
education.
3. Schools must increase the quality and quantity of their performance outcomes,
especially student achievement (p. 307).
As states began to exert more influence over educational accountability in the 1990s
performance outcomes based on collections and analyses of data became compulsory. As a
result accountability plans generally included a three-prong approach: curriculum standards,

33
assessments aligned to standards, and consequences attached to particular levels of goal
achievement (Fuhrman, 1999). Curriculum standards detailed what was expected; assessments
evaluated whether the standards were met; and, rewards, sanctions, and interventions were
initiated to strengthen or diminish behaviors and attitudes in light of performance outcomes. By
aligning these three components with the overall educational process, schools should gain the
internal, consistent direction necessary for the improvement of the quality and quantity of their
external outcomes – academic achievement (Hoy & Miskel, 2008).
Political Influence and Education
The Elementary and Secondary Education Act (ESEA)
In 1954 the Supreme Court made a landmark decision in the case Brown v. Board of
Education of Topeka. Central to equality of opportunity, the Brown (1954) decision overturned
an earlier ruling and made the separate but equal doctrine unconstitutional. Ten years later little
progress had occurred in school desegregation and the provision of equal educational
opportunities for all students. When President Lyndon B. Johnson signed the Civil Rights Act of
1964, it became one of the most significant legislative actions in regard to social reform. It would
end segregation in all public facilities, prohibit discrimination in employment, and establish
nondiscriminatory practices for all organizations receiving federal funding. Consequently, it also
set the tone for the involvement of the federal government in the activities of the nation’s schools
as federal funding was directly tied compliance with the Act (Spring, 2006; Webb, 2006).
The passage of the Elementary and Secondary Education Act of 1965 (ESEA) followed 1
year after the passage of the Civil Rights Act of 1964. Title I of ESEA is the principal federal
program developed to provide quality, equitable, educational opportunities for all students in
34
American schools. Passed as a component of the Johnson Administration’s War on Poverty,
federal funding to schools under ESEA was based on the socioeconomic status of the students a
school served. The objective of this heightened federal role in education was targeted at
decreasing the achievement gap between students of different backgrounds, primarily minorities
and students from low-income families. As federal funding increased so did the need for
accountability. Consequently, in the late 1960s the National Assessment for Education Progress
(NAEP) test was introduced as a way to assess student progress (Berry & Herrington, 2011;
Standerfer, 2006; Webb, 2006). American schools, the role of the federal government, and
accountability for learning became intricately connected with the passage of ESEA in 1965.
A Nation at Risk – A Manufactured Crisis
In the 1980s American schools were charged with the momentous undertaking to develop
productive citizens that would help America maintain its status as world superpower and
economic leader. This shift in school reform, from equity to excellence, mirrored the business
industry. Schools adopted a business model aimed at improvement; this proved to be difficult
for schools to implement. In response to the concern about the quality of education being
provided by American schools, President Ronald Reagan established the National Commission
on Educational Excellence. The Commission drafted a report, A Nation at Risk: The Imperative
for Educational Reform in 1983. This landmark call to reform would become the blueprint for
national, state, and local educational reform that swept the nation for several decades (Webb,
2006).
A Nation at Risk implied that America’s economic success and competitive edge in the
global marketplace were directly dependent upon the quality of the American educational

35
system. As a result the status of American education was tarnished by the nation’s difficulties in
global competitiveness and productivity (Spring 2006; Webb, 2006). A Nation at Risk (1983)
addressed four main areas of mediocrity in education: the lack of depth and rigor in the
curriculum; decreased expectations in grades, testing, and postsecondary requirements; reduced
time spent on academia; and inadequate, ineffective teacher training.
Multiple reports citing the condition of education in America followed A Nation at Risk.
Jointly calling for reform, these reports asserted that the educational system was in crisis. This
collective call to action has been referred to as the Education Reform Movement or the
Excellence Movement. This movement emanated in three waves (Webb, 2006).
The first wave of resulting reform, from 1983 to1985, attempted to repair schools using a
top-down approach pointed at improving achievement and accountability. This wave followed a
business model that involved goal setting, restructuring existing configurations, and rewards and
punishments. It focused on the system as a whole and sought repair through incremental
improvement and performance measurement. Higher graduation requirements, a mandated
standardized curriculum, increased measures of assessment for students and teachers, and
advanced teacher certification requirements were among many resulting initiatives (Murphy,
1990; Webb, 2006).
Critics argued that the first-wave reformers’ attempts to repair the existing structure were
not sufficient to eliminate the problems within the educational system. Instead, the second wave
of reformers, 1986 to 1989, concentrated on a bottom-up, collaborative approach emphasizing
professional educators and parents as agents of change. Restructuring was the target for the
second wave of reform and involved decentralization, site-based school management, teacher
empowerment, and improved parent involvement. Calls to overhaul teacher education programs

36
and require national certification for teachers were also key elements of this wave (Murphy,
1990; Webb, 2006).
The third and final wave of reform during this era began in 1988 and centered on
children. The goal of this wave was to redesign the educational system’s programs and empower
students through a comprehensive delivery of services to children. The focus rested on both the
school and the family (Murphy, 1990; Webb, 2006).
According to Webb (2006) schools identified these three waves of reform as a broad,
collective movement, not as individual waves of influence. Therefore, schools responded by
considering recommendations that echoed their specific needs. Overall, reform
recommendations that involved the least reallocation of resources and were the least expensive
and complex took hold in schools. This was mostly reflected in the first wave of reform and as a
result its suggestions were the most widely adopted. However, as the three waves of reform
ended and multiple reform initiatives had taken their course, little significant change had
transpired in American schools.
Berliner and Biddle (1995) and Ansary (2007) have suggested that A Nation at Risk was
nothing more than a manufactured crisis that began in 1983 when the report was released. This
report was the first of criticism of its kind for several reasons. It was sponsored by a secretary of
education in the national government, prepared by a very prestigious committee, and endorsed
by a president of the United States. Further the report, in a very flamboyant manner, made
explicit charges about a supposed recent and tragic decline of American education that was said
to be confirmed by longitudinal and comparative studies. A Nation at Risk created a national
crisis that was allegedly marked by a decline in leadership in industry, science, and innovation,
and the report ascribed blame to the inadequacies in American educational programs and its

37
incompetent educators. The report claimed that these charges were based on evidence, yet no
studies were cited in the document to provide support, nor did the report indicate where said
evidence could be found.
Critics of A Nation at Risk purported that this manufactured crisis was not accidental.
Rather, it appeared within a specific historical and political context that was led by identifiable
critics whose political agendas could be advanced by scapegoating educators. School reform
was thrust to the forefront of the nation’s political agenda under the provision that failing schools
were creating a national-security crisis; this provided great campaign fodder for Ronald Reagan
as it echoed the growing “get-tough” conservative movement (Ansary, 2007). Berliner and
Biddle (1995) suggested that the report was founded in questionable techniques including
misleading methods for data analysis, distorted findings, and the suppression of contradictory
evidence.
The Sandia Report was a critical piece of contradictory evidence that was suppressed by
the American government. This report, initially commissioned by Secretary of Energy Admiral
James Watkins, was prepared in 1990 by the Sandia National Laboratories of the United States
Department of Energy. The report documented a careful analysis of the status of American
education. Key findings of The Sandia Report emphatically contradicted the claims about
American education perpetuated by Presidents Ronald Reagan and George H. W. Bush and their
administrations in A Nation at Risk; therefore, The Sandia Report and the information therein
was suppressed by the government until after George H. W. Bush left office. The Sandia Report
found steady or slightly improving trends in American education on nearly every measure
presented in A Nation at Risk and suggested that much of the nonproductive rhetoric surrounding

38
education was based on the improper use of simplistic data (Ansary, 2007; Berliner & Biddle,
1995).
Ansary’s (2007) analysis of A Nation at Risk and The Sandia Report suggested that there
were multiple, fundamental differences in the reports. In 1983 A Nation at Risk, without
referencing any evidence, claimed:
� When compared to other industrialized nations American students are never first and
frequently last academically;
� American student achievement began to deteriorate radically after Russia launched
Sputnik and hit an all-time low in the 1980s;
� Between 1960 and 1980 SAT scores declined dramatically;
� Student achievement in science was decreasing markedly; and,
� American military and business industries were devoting millions of dollars aimed at
providing remedial education for new recruits and new hires.
Conversely, The Sandia Report revealed clear, evidence-based conclusions about the status of
American education in 1990. This report claimed:
� SAT scores rose or held steady for every student subgroup between 1975 and 1988;
� Between 1977 and 1988 math proficiency levels among 17-year-old students improved
significantly for minorities and slightly for Caucasians;
� Reading skills for all student subgroups remained steady or improved between 1971 and
1988;
� Seventeen-year-old students’ science competency levels at or above basic stayed the
same or improved somewhat between 1977 and 1988;
39
� Between 1977 and 1988 the number of 22-year-old Americans with a bachelor’s degree
increased each year; and,
� In 1988 the United States led all developed nations in education.
Although A Nation at Risk resulted in little fundamental change in American schools, it
did initiate and spawn the perception of American educational failure and its impending crisis.
This has resulted in lasting political implications as A Nation at Risk prompted 4 decades of
political attempts at school reform. Goals 2000, the Improving America’s Schools Act, No Child
Left Behind, and the Race to the Top have followed the 1983 report in their attempts to provide a
magic bullet to “fix” America’s failing educational system (Glover, 2013). Glover (2012) has
indicated that since the publication of A Nation at Risk, “. . . the advocates for universal
achievement expectations based on curriculum standards and standardized testing began to get
the upper hand over those who championed meeting individual students needs based upon their
unique characteristics” (para. 1).
Goals 2000: Educate America Act
During the administration of President George H. W. Bush, the National Governors
Association held an education summit in the fall of 1989. Chaired by Arkansas Governor Bill
Clinton, the governors authored national education goals and concurred that all states would
commit to raising academic achievement and standards and improve accountability. These six
national education goals were established to create world-class academic standards and a
national standardized assessment to measure the attainment of such standards; however,
President Bush was unable to gain the necessary support from Congress for ratification (Webb,
2006).

40
Bill Clinton entered the Presidency in 1992 touting calls for reform that were reminiscent
of the 1980s: educational excellence and accountability. In 1994 he gained the political backing
necessary to sign Goals 2000: Educate America Act. The Act codified in law the original six
education goals crafted by the National Governors Association in 1989 and included two new
goals. The intent of the Act was to provide states and communities with the necessary funding
and resources to ensure that schools set high expectations for all students and that all students
reached their fullest potential. It initiated a structure for comprehensive, standards-based
educational reform that would impact all students (North Central Regional Educational
Laboratory, 1994; U.S. Department of Education, 1995; Webb, 2006). The National Education
Goals as stated in Goals 2000: Educate America Act (1994) are the following:
1. School Readiness. By the year 2000, all children in America will start school ready
to learn.
2. High School Completion. By the year 2000, the high school graduation rate will
increase to at least 90 percent.
3. Student Achievement and Citizenship. By the year 2000, all students will leave
Grades 4, 8, and 12 having demonstrated competency over challenging subject matter
including English, mathematics, science, foreign languages, civics and government,
economics, arts, history, and geography, and every school in the United States will
ensure that all students learn to use their minds well, so they may be prepared for
responsible citizenship, future learning, and productive employment in our Nation’s
modern economy.
4. Teacher Education and Professional Development. By the year 2000, the Nation’s
teaching force will have access to programs for the continued improvement of their
41
professional skills and the opportunity to acquire the knowledge and skills needed to
instruct and prepare all American students for the next century.
5. Mathematics and Science. By the year 2000, United States students will be first in
the world in mathematics and science achievement.
6. Adult Literacy and Lifelong Learning. By the year 2000, every adult American will
be literate and will possess the knowledge and skills necessary to compete in a global
economy and exercise the rights and responsibilities of citizenship.
7. Safe, Disciplined, and Alcohol- and Drug-Free Schools. By the year 2000, every
school in the United States will be free of drugs, violence, and the unauthorized
presence of firearms and alcohol, and will offer a disciplined environment conducive
to learning.
8. Parental Participation. By the year 2000, every school will promote partnerships
that will increase parental involvement and participation in promoting the social,
emotional, and academic growth in children (Sec. 102).
The adoption of Goals 2000 denoted a defining moment in the direction of federal
education policy. Goertz (2001) remarked, “Emphasis shifted from educational inputs to
educational outcomes and from procedural accountability to educational accountability. Equity
was re-conceptualized as ensuring all students access to high-quality educational programs rather
than providing supplemental and often compensatory services” (p. 62).
The Improving America’s Schools Act (IASA)
The Improving America’s Schools Act of 1994 was the law that reauthorized the
Elementary and Secondary Education Act of 1965. It was included under the Goals 2000 reform

42
umbrella. IASA’s initiatives were designed for implementation at the state and local level and
fostered a comprehensive approach to reform that was directed at building states’ capacity in
order to meet national goals (Goertz, 2001; Webb, 2006). In 1995 the U.S. Department of
Education examined four key factors that were critical to comprehensive educational
improvement efforts. The first factor involved setting high expectations for all students by
focusing on a core of challenging state standards. All school efforts were integrated; school
leadership, school improvement, professional development, curriculum, instruction, and
accountability were all aligned to enhance instructional effectiveness. Second, professional
education and experiences were discernible, high-quality opportunities that prepared teachers to
teach to higher state standards. The third factor included flexibility that encouraged reform at the
local level and was combined with accountability measures to quantify the results. This
provided schools districts with the autonomy to consolidate federal funding to provide school-
wide programming that integrated services, strategies, and resources to reform the entire
instructional plan for all students, especially the disadvantaged. Finally, improvement efforts
were to be marked by close partnerships between schools, families, and communities. This
emphasized the link between a child’s achievement of a high-quality education and family
involvement. Additionally, it allowed school districts the flexibility to provide services specific
to their needs; these services often included comprehensive health and social programs, school
safety plans, and collaboration with community agencies.
Several major provisions resulted from the Act. States, with the assistance of local
districts, were required to develop improvement plans that used challenging standards,
assessment to measure student growth, and school accountability models. As a result IASA
initiated federal support for high-stakes testing and its associated accountability. As such, states
43
were required to develop comprehensive, state-wide, standardized assessments in reading and
language arts and math that aligned with curriculum standards. Further, the data that were
obtained was disaggregated in order to determine if disadvantaged students were making
adequate yearly progress in meeting the standards. IASA synthesized decades of ambitious
reform; however, states’ levels of compliance varied, government sanctions were uncommon,
and in less than a decade fewer than half of the states were in full compliance with the Act
(Goertz, 2001: U.S. Department of Education, 1995; Webb, 2006).
The No Child Left Behind Act (NCLB)
The capstone of President George W. Bush’s education program was the 2001
reauthorization of the Elementary and Secondary Education Act entitled the No Child Left
Behind Act (NCLB). The law, passed with bipartisan support from Congress, contained the most
changes to the Elementary and Secondary Education Act since it was passed in 1965. NCLB
presented a dramatic shift and enhanced level of involvement regarding the evolutionary role of
the federal government in education. Further it vastly enlarged the regulatory role for states and
local school districts as a national pull to centralize, formalize, and standardize public schools
swept America. The goal of NCLB was for all American students to achieve grade-level
proficiency by the year 2014. Federal funding was aimed at the promotion of higher
achievement of low-income and minority students while also holding schools accountable for the
progress of all students. NCLB also offered greater schooling options for parents through
parental choice and improved the flexibility of local school districts in directing federal funding
to their specific areas of greatest need. NCLB recognized that educational reform could not be
driven by funding and regulations alone. For the first time in American educational history, the
44
Act established public accountability for individual student learning. The engine that drove this
accountability was high-stakes, standardized testing (Center for Public Education, 2006; Hoy &
Miskel, 2008; Jorgensen & Hoffman, 2003; McDonnell, 2005; Rush & Scherff, 2012; Spring,
2006; Webb, 2006).
McDonnell (2005) suggested that No Child Left Behind could be perceived as a direct
descendant of and an attempt to repair the shortcomings of its legislative predecessors. NCLB
became the obvious subsequent step for a nation that was historically grounded in the
commitment to educational fairness and excellence. It punctuated the power of assessment and
created clarity for the value, use, and importance of high-stakes testing while simultaneously
attaching important consequences to high-stakes, standardized test scores. Funding became
directly tied to accountability expectations and public schools were charged with the task of
ensuring that all students learn the essential skills and knowledge defined by the state using
standards and benchmarks (Guilfoyle, 2006; Jorgensen & Hoffman, 2003; Nichols & Berliner,
2008).
The evolving role and reformed direction of the federal government in education
established by NCLB was evident in at least four defining areas. First, NCLB embodied the “big
picture” in education. Unlike previous educational legislation, which was often directed to
specific purposes or populations, NCLB included all students (Rush & Scherff, 2012; Webb,
2006). Webb (2006) commented, “NCLB was directed at every student and every teacher in
every public school in the country: All children in Grades 3 through 8 would be tested; all
students would be grade level proficient; and all teachers would be ‘highly qualified’” (p. 360-
361). Secondly the principal involvement of the federal government in education was no longer
procured to provide supplementary services; instead its singular priority was to raise students’

45
academic achievement by focusing on proven, research-based teaching methodologies and
instruction. Third stronger accountability was driven by reliance on high-stakes testing. Test
scores would be used as indicators of academic achievement. Additionally test scores would
become the determining factor of adequate yearly progress (AYP), or making specific gains in
achievement during a particular school year. Finally for the first time in the history of American
education, the federal government became involved in the determination of appropriate
qualifications of instructional personnel; this was coined as “highly-qualified” (Guilfoyle, 2006;
Hoy & Miskel, 2008; Rush & Scherff, 2012; Spring, 2006; U.S. Department of Education,
2002b; Webb, 2006).
The No Child Left Behind Act used a three-prong approach to accountability as it
mandated schedules and targeted populations, devised methodology for high-stakes testing and
academic standards, and required sanctions for continued poor performance by offering school
choice and supplemental service options to students (Hoy & Miskel, 2008; Spring 2006; U.S.
Department of Education, 2002b; Webb, 2006). According to Spring (2006) NCLB required the
following:
1. By 2002-2003, states must provide annual report cards containing
a. Student achievement scores
b. Performance by school district
2. By 2002-2003, school districts must provide annual report cards containing
a. District-wide scores
b. School-by-school scores
3. In 2002-2003, biennial assessments [must] begin using the National Assessment of
Educational Progress for fourth and eighth grade reading and mathematics
46
4. By 2005-2006, each state [must] have academic standards in mathematics, reading,
and language arts for all public elementary and secondary school children; and
standards in other subjects selected by the state
5. Beginning in 2005-2006, each state [must] have academic standards in science for all
public school children
6. By 2005-2006, states must begin administering annual statewide tests in reading and
mathematics for Grades 3 through 8
7. By 2007-2008, states must implement science tests once during elementary, middle,
and high school (p. 195-196).
The No Child Left Behind Act of 2001 generated a great deal of political publicity when it
was enacted. It was met with mixed reactions in 2002 and this trend has continued well over the
past decade. Ratvich (2009) asserted that results from the multibillion dollar Act have been
disappointing at best. According to NAEP’s long-term-trend-report, gains in academic
achievement have been meager at best. Further, NCLB’s sanctions for failing schools and
students have also proved inadequate. Research indicated that failing schools continued to fail
even after the entire staff had been dismissed and total restructuring had occurred through federal
sanctions. Ratvich (2009) further remarked that the unrealistic expectation that all students
would reach grade-level proficiency by the year 2014 was the most detrimental part of NCLB
indicating that no other nation or state had ever met such a lofty goal. The attempt to meet such
a goal has resulted in states adopting very low proficiency levels; states endorsed low standards
in order to inflate their standardized test scores to meet NCLB’s requirements. Tennessee, for
example, reported in 2008 that 90% of its fourth grade students were proficient in reading but
federal testing by NAEP indicated that only 27% of Tennessee’s fourth graders were proficient.

47
Guilfoyle (2006) conceded that only multiple measures of achievement could provide an
accurate picture of student learning and school success and stated, “In an NCLB-driven world,
the list of what’s not measured far exceeds any list of what is measured” (p. 12). Standardized
assessments can only provide a snapshot of data to help teachers improve student performance
and diagnose academic weaknesses. Popham (2006a) cautioned that most standardized
assessments under NCLB are “. . . unable to detect even striking instructional improvements
when such improvements occur” (p. 82). While the transparency that the Act has brought to the
educational area is positive, this transparency could be better used by gathering multiple sources
of data to create a more accurate picture of the achievement of both students and schools
(Guilfoyle, 2006).
The Race to the Top
On July 29, 2009 President Barack Obama proclaimed:
America will not succeed in the 21st century unless we do a far better job of educating our
sons and daughters. . . And the race starts today. I am issuing a challenge to our nation’s
governors and school boards, principals and teachers, businesses and non-profits, parents
and students: if you set and enforce rigorous and challenging standards and assessments;
if you put outstanding teachers at the front of the classroom; if you turn around failing
schools—your state can wind a Race to the Top grant that will not only help students
outcompete workers around the world, but let them fulfill their God-given potential. (The
White House Office of the Press Secretary, 2009, p. 1)
In February 2009 President Obama signed into law the American Recovery and Reinvestment Act
of 2009 (ARRA). This momentous legislation, aptly coined “the stimulus bill,” was designed to
48
invigorate the sluggish economy, support job growth and creation, and advance critical
government sectors, including education. The ED Recovery Act, part of ARRA, set the
foundation for education reform by reinforcing investments in groundbreaking, innovative
strategies that would likely lead to improved student achievement, long-term gains in educational
capacity, and overall increased productivity and effectiveness in the educational sector. The
ARRA and ED Recovery Act supplied 4.35 billion dollars to the United States Department of
Education for the Race to the Top fund. Race to the Top was a competitive grant program in
which states could apply for funds to implement education reform efforts. United States
Secretary of Education Arne Duncan sought to devise a program that would encourage and
reward states that were creating the conditions in which education innovation and reform would
thrive, including making substantial gains in student outcomes and achievements. Specifically
reform efforts were directed at closing achievement gaps, improving high school graduation
rates, and ensuring students preparation for success in college and careers (Peterson & Rothstein,
2010; U.S. Department of Education, 2009). The Race to the Top emphasized the following
reform areas:
1. Designing and implementing rigorous standards and high quality assessments, by
encouraging states to work jointly toward a system of common academic standards
that builds toward college and career readiness, and that includes improved
assessments designed to measure critical knowledge and higher-order thinking skills;
2. Attracting and keeping great teachers and leaders in America’s classrooms, by
expanding effective support to teachers and principals; reforming and improving
teacher preparation; revising teacher evaluation, compensation, and retention policies
49
to encourage and reward effectiveness; and working to ensure that our most talented
teachers are placed in the schools and subjects where they are needed the most;
3. Supporting data systems that inform decisions and improve instruction by fully
implementing a statewide longitudinal data system, assessing and using data to drive
instruction, and making data more accessible to key stakeholders;
4. Using innovative and effective approaches to turn-around struggling schools, by
asking states to prioritize and transform persistently low-performing schools;
5. Demonstrating and sustaining education reform, by promoting collaborations between
business leaders, educators, and other stakeholders to raise student achievement and
close achievement gaps, and by expanding support for high-performing public charter
schools, reinvigorating math and science education, and promoting other conditions
favorable to innovation and reform. (The White House Office of the Press Secretary,
2009, p. 1-2)
Forty states and the District of Columbia applied for Race to the Top funds. Five outside
panelists reviewed the applications, interviewed delegations from the states of finalists, and
awarded points for states’ compliance with policies promoted by Secretary of Education Arne
Duncan. Eleven states and the District of Columbia were awarded funds in two rounds.
Delaware and Tennessee were the only two winners of the first round of funding and each state’s
award was substantial. Delaware received over 100 million dollars (or approximately 800
dollars per pupil) and Tennessee received over 500 million dollars (or approximately 500 dollars
per pupil). In both states the award represented about 7% of the total expenditures for
elementary and secondary education (Peterson & Rothstein, 2010; U.S. Department of
Education, 2011).

50
Fletcher (2010) suggested that the Race to the Top would have widespread implications
for all school districts, not only those that were awarded Race to the Top funds. The Race to the
Top bolstered support for the Common Core State Standards Initiative, which was already
gaining momentum. Further, new standards would be attached to a new generation of tests that
would provide formative and summative assessments across multiple grades and the curriculum.
United States Secretary of Education Arne Duncan stated that the new assessments would
account for more complex levels of student learning and would
. . . better measure the higher-order thinking skills so vital to success in the global
economy of the 21st century and the future of American prosperity. To be on track today
for college and careers, students need to show that they can analyze and solve complex
problems, communicate clearly, synthesize information, apply knowledge, and generalize
learning to other settings.” (U.S. Department of Education, 2011, p. 17)
Duncan also advised that state assessments would for the first time require the use of smart
technology that would provide students with realistic, sophisticated performance-based tasks;
immediate feedback; and computer adaptive testing while incorporating accommodations for a
range of students. New standards and advanced technological requirements would certainly
impact the nation’s schools at large.
It was widely recognized that the Obama administration intended Race to the Top to be
the model for a new approach to the distributions of federal education funds and set the stage for
the reauthorization of the Elementary and Secondary Education Act. Race to the Top would use
the distribution of the funding as a “carrot” to spur policy change at the state level and its
priorities offered a template for much of the Obama administration’s educational agenda. Four
assurances were required for the Race to the Top funding: improving teacher effectiveness and

51
distribution, ensuring rigorous collection and use of student and classroom-level data, turning
around the lowest performing schools, and bolstering academic standards and student
assessments. These priorities would form the foundation for the United States Department of
Education’s reauthorization of the Elementary and Secondary Education Act named A Blueprint
for Educational Reform.
Tennessee’s First to the Top
In 2010 the state of Tennessee was awarded over 501 million dollars from the federal
government’s Race to the Top competition. This provided Tennessee’s Department of Education
the resources to embark on unparalleled opportunities to comprehensively reform education
across the state. Tennessee’s plan for educational reform was designed to capitalize on its assets
that included a rich pool of data; a solid plan for revamped standards and assessments;
involvement of science, technology, engineering, and mathematics (STEM) industries and other
local and national organizations; an expanded charter school law that would bolster educational
innovation; and the full support of every local education agency, countless state organizations,
the state teachers union, and governor (Tennessee Department of Education, 2010c, 2010e). The
Tennessee Department of Education (2010a) stated:
At the heart of improving student achievement is a focus on three main student
performance goals: young students’ academic readiness, high school graduates readiness
for college and careers, and higher rates of graduates enrolling and succeeding in post-
secondary education. Amongst these initiatives, Tennessee has a renewed focus on
developing and improving great teachers and leaders in Tennessee classrooms.
Tennessee’s First to the Top plan has given the state unique resources and financial
52
opportunities—placing renewed focus on the classroom teacher and a more dedicated
focus on encouraging student achievement. (para. 2)
United States Secretary of Education Arne Duncan announced that one of the determining
factors in Tennessee’s selection as a recipient (along with Delaware) was statewide support for
comprehensive school reform plans and newly enacted laws to support their policies. According
to Duncan Tennessee had demonstrated the courage, capacity, and commitment to turn its ideas
into practices in order to improve achievement outcomes for all students (Holland, 2010). Late
in his tenure as Tennessee’s governor, Phil Bredesen declared,
This is a landmark opportunity for Tennessee. Our success in Race to the Top speaks to
the commitment we [have] made to meaningful and significant improvement in public
education, and the funds provided by the grant will carry us forward in a dramatic and
positive direction. (Nashville City Paper, 2010, para. 3)
Tennessee’s vision for First to the Top was to lead the nation in the development of
human capital. The goal was to create a skilled workforce to be educated and trained by world-
class teachers, leaders, and schools. First to the Top was a comprehensive roadmap for
transformational reform for the entire state; over 50% of the awarded funds went directly to local
education agencies. The distribution of funding was represented in the core principles. These
principles included effective instruction, strong data systems, refining what works and discarding
what does not, and bipartisan political will. The overarching goal of First to the Top involved
college- and career readiness for all students through increased rates of proficiency on state and
national assessments, decreased achievement gaps, improved teacher effectiveness, increased
graduation rates, and higher rates of college enrollment and success (Tennessee Department of
Education, 2010a, 2010f).

53
First to the Top required that student achievement data be central to all human capital
decisions (Nixon, 2011). Through Race to the Top funding, Tennessee’s First to the Top would:
. . . create an intensive focus on the power of human capital: recruiting, developing,
evaluation, and compensating the best talent Tennessee can find for its schools;
equipping them with the tools they need to succeed, such as standards and data; defining
expectations and setting the bar high for student, teacher, and principal success;
rethinking old and out-of-date practices that keep great teachers and leaders from
succeeding; and harnessing the power of external organizations, foundations, and
committed partners to help Tennessee achieve its specific goals and targets. (Tennessee
Department of Education, 2010e, p.1)
Human capital is fundamental to First to the Top’s theory of change—teachers are the heart of
boosting student achievement. Along with finding and supporting the best possible talent for
Tennessee schools, the state plan would focus on other critical elements (Tennessee Department
of Education, 2010f).
Standards and Assessments. Tennessee’s commitment to rigorous standards and
assessments resulted in the implementation of college- and career-ready, internationally
benchmarked standards known as the Common Core State Standards (CCSS) initiative.
Common Core State Standards touted fewer, clear, higher standards designed for rigor and
relevance. Balanced assessments were also embraced as Tennessee participated in a national
consortium to plan for formative, summative, and end-of-course assessments (Tennessee
Department of Education, 2010c, 2010f).
Data to Inform Instruction. Tennessee has the nation’s richest data system and has
expanded its use to reach its student achievement goals. All teachers were granted access to

54
educational data. Further, the longitudinal data system plan called for a 360 degree view of the
child in order for educators to see the full set of supports and challenges that a student faces that
affect that student’s learning. The objective aimed at understanding the numerous factors that
influenced a child’s ability to learn and having a complete picture of the influences would
provide teachers with early indicators regarding the factors that may impede or improve student
learning (Tennessee Department of Education, 2010c, 2010d, 2010f).
Great Teachers and Leaders. Tennessee declared that it would find and support the best
possible talent for its schools. There were multiple avenues to achieving this goal. These
avenues included: multiple-measures effectiveness evaluation system to inform local decision
making; expanding alternative licensure routes; the integration of data to improve instruction;
teacher access to classroom-specific value-added data and training on its use; teacher and
principal professional development; teacher residency programs; support for differentiated
compensation; and, improvement of preservice training (Derringer, 2010; Tennessee Department
of Education, 2010c, 2010f).
Teacher and Principal Evaluation. A Teacher Evaluation Advisory Committee (TEAC)
was formed to create a new teacher and principal evaluation framework that was adopted by the
State Board of Education. This new system required annual evaluation of all teachers and
principals and that personnel decisions, including promotion, retention, tenure, and
compensation, be based in part on evaluations. Further, 50% of the evaluation measure must be
based on student achievement data. Other criteria to be included were review of prior
evaluations; personal conferences regarding individual strengths, weaknesses, and remediation;
classroom or position observations followed by written assessments; and, any other additional
55
criteria pursuant to employment contracts. Evaluations would also be used as a measure to
inform tenure-granting decisions (Tennessee Department of Education, 2010c, 2010d, 2010f).
Investment in Professional Development. Tennessee supported teachers and principals
for success with high-quality experiences through the best professional development resources in
the country. The state has expanded its Electronic Learning Center to support relevant and
timely professional development. Key areas of focus included training on standards and
assessment, data, evaluation, best practices, and STEM. Tennessee is devoted to ongoing
research and continuous evaluation of what is working across the state (Tennessee Department of
Education, 2010c, 2010d, 2010f).
Turnaround Schools. Tennessee has dedicated resources that will re-engineer its
accountability system to focus on low achieving schools and will put every school on a path to
succeed. This was accomplished by changing the way funding had been leveraged to accomplish
goals, providing supports to keep struggling schools from falling further behind, and ensuring
governance changes for the lowest-performing schools (Tennessee Department of Education,
2010c, 2010d, 2010f).
STEM. Tennessee has worked diligently to become a national leader in STEM education
by ensuring that the political and policy environment is conducive to ongoing innovation. The
state has realized that STEM skills are critical to economic development and has created the
Tennessee STEM Innovation Network designed to bring together assets to share and learn in
partnership with key STEM organizations. This network will facilitate the creation and
expansion of STEM platform schools and STEM regional hubs across the state in an effort to
maximize the effectiveness of valuable public and private partnerships (Tennessee Department
of Education, 2010c, 2010d, 2010f).
56
One year after the Race to Top award in Tennessee, First to the Top had resulted in great
progress for the state of Tennessee even though stakeholders recognized the significance of the
work that remained for the children of Tennessee. Newly elected Tennessee governor Bill
Haslam indicated that Race to the Top had made Tennessee the focal point of educational reform
in the United States. The first year of First to the Top was a combination of planning and
success amongst several key reform initiatives:
� Re-engineering Tennessee’s educational accountability system by revamping tenure
expectations in connection with a new teacher and principal evaluation system as well
as refocusing educational opportunities through revisions to charter schools;
� Establishing and highlighting STEM (science, technology, engineering, and math)
education through the focus of the STEM Innovation Network;
� Renewing the impetus on the classroom teacher and placing more emphasis on
student achievement;
� Building support and creating success for students through increased professional
development opportunities for educators such as Value-Added Data Specialists,
formative assessment practices training, and online course availability; and,
� Providing all stakeholders with the feedback and support they need to remain
successful through increased engagement and collaboration (State of Tennessee,
2011).
Governor Haslam continued:
We all understand that we are still near the starting point of the process, and as we go
forward, it is our responsibility to make certain we are moving toward better outcomes
for students. Tennessee’s best long-term job growth strategy is to improve the education

57
we offer Tennesseans and ensure they are prepared to compete in the 21st Century
workforce” (State of Tennessee, 2011, para. 4).
A Blueprint for Educational Reform
In November 2009 as the United States Department of Education was rolling out the
Race to the Top initiative President Obama announced, “It’s time to stop just talking about
education reform and start actually doing it. It’s time to make education America’s national
mission” (U.S. Department of Education, 2009, p. 2). The next year, in March 2010, the Obama
administration released its report, A Blueprint for Educational Reform, outlining its vision of the
federal role in American education. It included principles and strategies to guide the upcoming
reauthorization of the Elementary and Secondary Education Act (ESEA) currently known as the
No Child Left Behind Act. The Blueprint continued to place impetus on many of the core
principles of NCLB including support for a strong accountability system that held states and local
districts to rigorous standards requiring targeted interventions for low-performing schools. In
reaction to the increasing criticism of NCLB the Blueprint also referred to the previous Act’s
numerous flaws and ensured change (Berry & Herrington, 2011; U.S. Department of Education,
2010). A Blueprint for Educational Reform promised to reward success instead of targeting
failure; to identify progress and growth over time rather than periodic snapshots of performance;
to “. . . better recruit, develop, support, retain, and reward . . .” (U.S. Department of Education,
2010, p. 10) outstanding teachers, and to encourage collaboration among families, communities,
and schools (Berry & Herrington, 2011; U.S. Department of Education, 2010). In 2010,
President Obama declared:

58
We must do better. Together we must achieve a new goal, that by 2020, the United
States will once again lead the world in college completion. We must raise the
expectations for our students, our schools, and for ourselves—this must be a national
priority. We must ensure that every student graduates from high school well prepared for
college and a career. . . . My Administration’s blueprint for reauthorization of the
Elementary and Secondary Education Act is not only a plan to renovate a flawed law, but
also an outline for a re-envisioned federal role in education. This is a framework to guide
our deliberations and shared work—with parents, students, educators, business and
community leaders, elected officials and other partners—to strengthen America’s public
education system. (U.S. Department of Education, 2010, p. 1-2)
A Blueprint for Educational Reform was based upon four key areas of reform. The first
area of reform required the cultivation of teacher and leader effectiveness to ensure that every
classroom has a great teacher and every school has a great leader. The second area involved
communicating information to families to help them evaluate and improve their children’s
schools and providing information to educators to help them improve their students’ learning.
Third, schools must implement college- and career-ready standards and develop improved
assessments aligned with those standards. Finally, schools are obligated to improve student
learning and achievement in America’s lowest performing schools by providing intensive
support and effective interventions (U.S. Department of Education, 2010). Five key priorities
emerged from these areas of reform: college and career-ready students, great teachers and leaders
in every school, equity and opportunity for all students, raising the bar and rewarding excellence,
and promoting innovation and continuous improvement. Among these priorities several critical
components existed. College- and career-readiness involved rigorous standards for all students,

59
better assessments, and a well-rounded, complete education. This rigorous approach to fair
accountability sought to reward progress and success while providing assistance to the lowest
performing schools. Additionally, in order to raise the bar and reward excellence, a Race to the
Top was fostered to provide incentives for excellence that involved systematic, bold, and
comprehensive reform that changed policies and practices to improve outcomes for students
(U.S. Department of Education, 2010).
Through the Blueprint’s priorities the Obama administration proposed replacing the
NCLB goal of 100% proficiency with the goal that by the year 2020 all students will graduate
from high school prepared for college and a career. Adequate yearly progress (AYP) would be
replaced by a system that would measure individual student growth over time as opposed to
measuring the aggregate performance of a whole group of students against fixed achievement
targets. Further the Obama administration, which favored the movement toward common state
standards, proposed that states must adopt standards common to a significant number of states by
the year 2015. In regard to accountability the Blueprint suggested a shift from the failure-based
NCLB accountability system to a system that rewards success, targets a smaller amount of
schools for sanctions, and provides more flexibility to states. The administration’s competitive
Race to the Top grants that were part of the economic stimulus legislation compensated districts
that evaluated teachers based partially on student test results. Accordingly, states would receive
federal funding to develop statewide descriptors for effective results (Jennings, 2011; U.S.
Department of Education, 2010).

60
Tennessee Comprehensive Assessment Program (TCAP)
Each spring students in grades 3-8 across the state of Tennessee take achievements tests
that are part of the Tennessee Comprehensive Assessment Program, or TCAP. The TCAP
achievement tests are state-mandated, timed, multiple-choice, criterion-referenced tests that have
“fresh, non-redundant test items . . . customized yearly to measure academic skills and
knowledge in reading and language arts, mathematics, science, and social studies” (Tennessee
Department of Education, 2010b, p. 4). As a criterion-referenced measure the TCAP tests
measure students’ performance against specific state content standards and criteria rather than
the performance of other test takers. The scores generated by TCAP achievement tests provide
an annual snapshot of students’ current level of academic achievement (Tennessee Department
of Education, 2010b).
Three types of test make up the TCAP Achievement Program: the Achievement Test; the
Modified Academic Achievement Standards Assessment (MAAS); and, the English
Linguistically Simplified Assessment (ELSA). The Achievement Test is the general assessment
for Grades 3-8. The MAAS is an assessment provided for some special education students
whose disabilities have prevented them from achieving grade-level proficiency in a particular
subject area. A student’s eligibility is determined by the Individual Education Program (IEP)
team based on state generated criteria. The MAAS is based on grade-level content standards, yet
it differs from the regular achievement test in several ways. The MAAS is a shorter test with
fewer answer choices; contains shorter reading passages; uses more simplified language and
print styles; has fewer passages and items on each page; and includes less complex charts,
graphs, and tables. The ELSA is the final type of achievement test that is provided for students
who are eligible to receive English as a Second Language (ESL) services. The purpose of the

61
ELSA is to help measure the intended knowledge or skills while also decreasing wordiness,
using common words and simple verb forms, avoiding multiple-meaning and abstract words, and
simplifying context and sentence structure. Multiple reports are generated for each of the test
type that provides information concerning student performance on content-specific objectives as
well as a description of student performance on academic skills based on the grade span
standards (Tennessee Department of Education, 2010b).
Tennessee’s Value-Added Assessment System (TVAAS)
Each year the Tennessee Department of Education analyzes the year-by-year increase in
student TCAP scores through a statistical process known as the Tennessee Value-Added
Assessment System (TVAAS). According to the Tennessee Department of Education (2013a)
TVAAS measures the impact that schools and teachers provide on their students’ academic
progress by analyzing the factors affecting student achievement that the school can control, such
as their students’ academic progress during the school year. Teachers, schools, and districts are
not held accountable for factors that they cannot change such as previous achievement, ethnicity,
or socioeconomic status. (However it is important to note that some educators have disagreed
with the premise of TVAAS asserting that external factors such as socioeconomic status and
previous achievement directly impact student progress and schools and teachers ultimately
cannot control these factors.) “TVAAS is a powerful tool because it measures how much
students grow in a year, and shines more light on student progress than solely considering their
score on an end of year test” (Tennessee Department of Education, 2013b, para. 1). TVAAS
centers consideration on students’ achievement based upon their score on the end of the year
62
assessment as well as students’ growth based upon the progress students make year to year
(Tennessee Department of Education, 2013b).
Tennessee’s valued-added assessment model has been in place since the early 1990s
when it was created by a statistician at the University of Tennessee, William “Bill” Sanders
(Hershberg, 2004; Sanders, 1998). Hershberg (2005) suggested that value-added assessment is
often confused with simple growth because the terminology lends itself to the definition that
“value” is “added” to student academic progress over the last academic school year. However
Sanders used TVAAS as a means to isolate the impact of instruction on learning. TVAAS’s
supreme advantage, according to Hershberg (2005), is its ability to differentiate the yearly
academic growth of students into two quantities: student growth attributed to the student and
student growth attributed to the classroom, school, and district. This occurs as individual
students, as opposed to cohorts of students, are traced longitudinally resulting in each student
serving as his or her own baseline measure or control. This removes virtually all of the influence
of unvarying characteristics such as ethnicity and family background.
TVAAS is unlike any other state-wide accountability measure as it provides information
to parents, teachers, and the public about how well schools are helping each student make
academic gains each school year (Shearon, n.d.). TVAAS assesses the influence of schooling on
academic progress and is a useful tool to help schools make data-driven decisions. Based upon
TVAAS analysis schools can determine a reliable estimate of student progress and the
effectiveness of instruction over time. Value-added information for groups of students provides
an indication of the effectiveness of teachers and schools instead of inferring teacher’s and
school’s effectiveness levels by examining static school performance data. As such TVAAS
assists educators in monitoring the progress of all students, from low-achieving to high-

63
achieving, and ensures growth opportunities for all students. Further, it measures the impact of
educational practices and helps data-driven decision making about where to focus resources to
facilitate greater student progress and performance at higher levels (Tennessee Department of
Education, 2013a, 2013b).
The TVAAS system uses value-added scores to generate profiles of academic growth for
students over time. By statistically aggregating these data researchers can determine the impact
of a school system, a school, and a teacher on student’s learning (Holloway, 2000). However,
value-added measures are not without controversy given the complicated statistical analysis on
which they inevitably rest. Even so, researchers have concluded that the effects of individual
teachers on student achievement are real, the effect can be very large, and the effect can persist
beyond the year in which it was first evident. Further, researchers have asserted that value-added
models might provide less biased and more precise assessments of teacher effect than other
existing test-based assessments and that value-added models should be given serious
consideration even in light of its limitations (Hershberg, 2005).
Sanders and Horn (1998) have suggested that even though the driving force for the
conception of TVAAS was for summative evaluation purposes the real influence of the process
lies in its ability to function as a data source for formative evaluation, educational research, and
curricular planning. However, value-added assessment alone does not improve student
achievement. Educators must understand and use what they learn from value-added measures to
guide instruction (Di Carlo, 2012; Hershberg, 2004). As with so many other educational
endeavors, educators must examine all variables that influence academic achievement to ensure
that the conclusions are sound (Sanders, 1998).

64
Formative Assessment
Greenstein (2010) urged the educational world to recognize that the word assessment is
derived from the Latin root assidere that means “to sit beside another.” The most productive
assessment experiences for learners have reflected the word’s roots keenly. In order to help a
learner move forward, a teacher supports the learner by gathering individualized information to
uncover and understand what the student already knows in order to differentiate the student’s
best learning path. Succinctly stated that is the ultimate goal of and process for formative
assessment.
The literature base regarding the use of formative assessment is formidable and the
presence of a plethora of empirical evidence that documents the improvement of educational
outcomes by way of formative assessment is considered conventional wisdom in academia.
Research has long touted that formative assessment as a pedagogical practice has accelerated
improvements in instructional practices, helped to isolate curricular gaps, and contributed to
increased student achievement. However, as pressure mounts in this high-stakes accountability
era, recent empirical research about formative assessment in the traditional classroom setting is
becoming scarce, the definition of formative assessment is often ambiguous, and its adoption as
an instructional process is inconsistent at best (Dorn, 2010; Dunn & Mulvenon, 2009).
Furthermore, Heritage (2007) reported that the stress of accountability has resulted in a loss of
the reciprocal relationship between the teaching and learning cycle and assessment causing
educators to view assessment as an entity in competition with teaching and learning rather that
an integral component of teaching and learning.

65
The History of Formative Assessment
Educators have employed strategies such as the Socratic method in addition to many
other forms of meaningful questioning throughout the history of education. However, the term
“formative assessment” is a fairly new one in the educational arena. Scholars have traced its
contemporary use to Michael Scriven’s 1967 groundbreaking essay about educational evaluation
in which he contrasted “formative” and “summative” to indicate the differences in goals for
collecting evaluation information and how that information is used. Scriven (1967) described
formative evaluation as a continuing, malleable educational program. Two years later in 1969
Benjamin Bloom attempted to transfer the term formative from educational evaluation to
educational assessment. This helped to form the foundations for the concept of mastery learning
(Bloom, 1969; Bloom, Hastings, & Madaus, 1971). In the decade that followed as formative
assessment was becoming more and more widely explored, Bloom (1977) continued his
theoretical work and identified two essential elements of formative learning: feedback for
students and corrective conditions for all components of learning (Burke, 2010; Dunn &
Mulvenon, 2009; Greenstein, 2010; Popham, 2008).
The greatest advance in the endorsement of formative assessment occurred in 1998 when
British researchers Paul Black and Dylan Wiliam published a meta-analysis that extensively
reviewed more than 250 empirical research studies focused on classroom assessment. Their
findings suggested that formative assessment when employed properly in the classroom setting
helped students learn to a substantially better degree (Black & Wiliam, 1998b). The authors
concluded that achievement gains in learning elicited by formative assessment “. . . [showed]
conclusively that formative assessment does improve learning” and the gains were “. . . amongst
the largest ever reported for educational interventions” (Black & Wiliam, 1998a, p. 61). Further
66
the authors purported that “. . . improved formative assessment [helped] low achievers more than
other students—and so [reduced] the range of achievement while raising achievement overall”
(Black & Wiliam, 1998b, p. 141).
Defining Formative Assessment
As the emphasis on formative assessment has grown since Black and Wiliam sparked its
worldwide interest in 1998, Leung and Mohan (2004) have indicated that formative assessment
has remained an enigma in recent educational literature. “Formative assessment’s status as an
ethereal construct has further been perpetuated in the literature due to the lack of an agreed upon
definition” (Dunn & Mulvenon, 2009, p. 2). Dunn and Mulvenon (2009) have further suggested
that the overall vagueness of the constructive and operational definition of formative assessment
has directly contributed to the impotence of recent related research and scarcity of recent
empirical evidence that has identified best practices for formative assessment. In 2010
Greenstein suggested:
It is clear that formative assessment is far more than another theory to add to the already
confusing mix; rather, it is a point at which many current ideas about education actually
converge. It’s a crossroads, so to speak, where educational routes that are based on the
belief that all students can learn—just in different ways and with different outcomes and,
therefore, using different strategies and different measures—all come together. (p. 133-
134)
Based upon Greenstein’s (2010) perspective, it may behoove educational scholars to expand
their view and widen their perspective in order to identify the relevant crossroads that will
ultimately assist in meeting the goal of improving student achievement. “If we are finally to

67
connect assessment to school improvement in meaningful ways, we must come to see assessment
through new eyes” (Stiggens, 2002, p. 758).
According to educational scholars there are multiple working definitions of formative
assessment. Burke (2010) purported that the tendency in education today is to regard formative
assessment in general as assessment for learning because it informs students and teachers about
the learning process. Echoing this concept Chappuis and Stiggins (2002) proposed that
formative assessments are designed to monitor student progress during the learning process as
assessment for learning.
At the onset of the formative assessment explosion, Black and Wiliam (1998a) defined
formative assessment as “all those activities undertaken by teachers, and/or by their students,
which provide information to be used as feedback to modify the teaching and learning activities
in which they are engaged” (p. 10). Furthermore, formative assessments serve innumerable
feedback related purposes including diagnosis, prediction, as well as evaluation of teacher and
student performance (Black & Wiliam, 1998a). However, the Council of Chief State School
Officers (CCSSO) differently defined formative assessment per the specifications designed by
one of its departments, Formative Assessment for Students and Teachers (FAST). In 2006
CCSSO’s FAST defined formative assessment as a process used during instruction to provide
feedback in order to adjust ongoing teaching and learning for the purposes of improving student
achievement as related to instructional objectives (Dunn & Mulvenon, 2009; Popham, 2008). In
2006 educational scholar W. James Popham stated that an assessment is formative to the extent
that the information collected from the assessment is used during the assessed instruction period
to improve the instruction to meet the needs of the assessed students. In 2008 Popham’s
definition expanded to include formative assessment as a planned process during which the

68
teacher or students use assessment-based evidence to adjust ongoing instructional and learning
processes. Additionally Popham (2008) recommended that formative assessment involved a
series of carefully deliberated, distinguishable acts on the part of teachers, students, and/or both.
Some of these components of formative assessment involved assessments, but the assessments
played a role in the process instead of existing as the process alone. Furthermore, Stiggens and
DuFour (2009) stated that teachers should use formative assessments to clarify student learning
goals, improve the pedagogy of teachers, and create opportunities to remediate struggling
students. Crumrine and Demers (2007) further advised that regular, ongoing assessment that
informs instructional practices can help students develop deeper understanding and result in
more active participation in their own learning. Teachers must develop and use formative
assessment to shape their teaching and maximize efforts to support struggling learners in order to
impact student learning and achievement (Bakula, 2010). As Dorn (2010) has suggested,
formative assessment results in organizing a school year differently; it involves planning around
instructional decisions instead of distinct chunks of time devoted to curricular coverage.
Functions and Elements of Formative Assessment
In the book Leaders of Learning Richard DuFour and Robert Marzano briefly examined
formative assessment. DuFour and Marzano (2011) proposed:
If the potential of formative assessment is to be realized, students, teachers, and
administrators must undergo a conceptual shift in their approach to assessment. Instead
of viewing assessment as an absolute measure of students’ proficiency, individual
assessments must be considered snapshots taken at a point in time of students’ progress
toward a specific goal (p. 119)

69
Formative assessment must be viewed as a cyclical progression and one of its primary functions
is to inform instruction. First, standards, objectives, and goals must be identified. Second,
targeted instruction is delivered, and third, data are gathered. Next, the data are analyzed.
Finally, the teacher and learner collaborate to respond to the data. The cycle is continued as
those responses help establish new learning standards, objectives, and goals (Greenstein, 2010).
Greenstein (2010) also described how this cyclical routine affected the traditional classroom.
Formative assessment functioned to:
� Help focus instruction on informed priorities;
� Allow for customized learning, helping to build both basic skills and high-level
learning in a way that is relevant and responsive to all learners;
� Encourage teachers and students to work together toward achievement;
� Increase student engagement and motivation;
� Ensure grades accurately reflect students’ progress toward standards; and,
� Increase coherence between curriculum, instruction, and assessment. (p. 7)
While the definitions of formative assessment vary, there are multiple common threads.
The majority of scholars agreed that there are critical central elements required for the successful
employment of formative assessment as a valuable instructional tool. These elements included:
� Formative assessment is a planned, deliberate process, not any particular test.
� Formative assessment is student-centered but is used by both students and teachers.
� Formative assessment takes place during instruction.
� Formative assessment provides assessment- and outcome-based feedback to students
and teachers.
� Formative assessment is instructionally informative and serves multiple purposes.

70
� Formative assessment helps students and teachers make adjustments that will improve
students’ achievement of intended curricular aims and learning progressions
(Greenstein, 2010; Heritage, 2007; Popham, 2008; Stiggins & DuFour, 2009).
The functions and elements of formative assessment are critical to the ongoing instructional
procedures required to improve student learning and achievement. Popham (2008) revealed that
the expanded use of formative assessment is supported by not only instructional logic but also by
the conclusions of well-conceived meta-analysis of research.
Political Policy and Formative Assessment
Dorn (2010) has suggested that the most undervalued achievement of the No Child Left
Behind Act is the expansion of formative assessment. However, no refereed study since the
passage of NCLB has described the nationwide use of structured formative assessment
implementation. Further, a review of research proposed that the implementation of formative
assessment most often depended on local district initiatives driven by student services
supervisors and/or special educators (Dorn, 2010; Stecker, Fuchs, & Fuchs, 2005).
In 2010 Kay Burke identified formative assessment as a critical component of the education
reform movement shifting from the NCLB approach to the college- and career-readiness
paradigm designed to make all students successful by challenging the whole child and preparing
all students to meet the requirements of the 21st century. Formative assessment was the outcome
of several established psychological theories and a strategic, fundamental element of effective
learning systems; however, despite the increasing political momentum in American education,
the large-scale implementation of formative assessment still remains a distant prospect (Clark,
2010).

71
As formative assessment remains a topic of discussion within the reauthorization of the
No Child Left Behind and Elementary and Secondary Education Act, structured formative
assessment was at the forefront of the discussions about response-to-intervention (RTI)
frameworks for general and special education intervention services (Dorn, 2010). Fuchs, Fuchs,
and Stecker (2010) purported that the most crucial concern for RTI was choosing the appropriate
tier of services for a student based on a decision about where a student was in the learning
process, providing interventions to help the student overcome challenges or boost that student’s
progress, and so on in a cyclical manner. Essentially the success of RTI was dependent on the
implementation of structured formative assessment in which the individual student’s intervention
intensity was the primary target. As a result, this shift in providing academic interventions for
struggling learners during the learning process was politically driven; state departments of
education began to define RTI assessment procedures and defined their relationship to specific
learning disabilities 5 years after the IDEA of 2006 regulations had been published.
Hoover (2009) indicated that the assessment of struggling learners used to occur while “. . .
attempting to identify potential ‘deficits’ within the learner while simultaneously assuming that
lack of progress toward academic or social-emotional benchmarks or objectives was
predominately due to something going on ‘within’ the learner” (p.24). Under this deficit-driven
model learners could potentially struggle for 2 to 3 years before concentrated efforts were
delivered to identify their needs. Currently, however, under the RTI model there is “. . . an
emphasis on proper instruction first along with frequent assessments or progress monitoring”
(Hoover, 2009, p. 25). As formative assessment provides ongoing assessment of student
progress, it coincides with this shift in emphasis to intervene often and early (Burke, 2010;
Hoover, 2009).
72
Benchmark Assessments as Formative Assessment
The educational climate of the early 21st century has been stamped by the political
demand for accountability of student learning. Therefore, benchmark assessments are being used
as tools to measure student progress in an ongoing, formative fashion in order to improve
performance on accountability measures. Benchmark assessments are considered formative
assessments, as assessments for learning. Their purpose is to provide interim feedback to
teachers about students’ progress toward meeting standards that will be measured and assessed
on high-stakes summative state tests (Burke, 2010; Popham, 2008). In a corresponding manner,
formative assessment supports benchmarking, the process of comparing learning outcomes goals
to selected standards for the purpose of overall improvement. Insight into whole-class and
individual progress gained through continually measuring understanding helps both the teacher
and students identify strengths, points of confusion, and the additional skill and knowledge
development that will further progress toward mastery (Greenstein, 2010). Typically
standardized benchmark assessments are given periodically, from three times a year to as often
as once a month; focused on reading and mathematics skills, requiring about 1 hour per content
area; reflected state academic standards; and, measured students’ progress through the
curriculum on the material covered in state exams. Regular use of benchmark assessments,
particularly those aligned to state standards, are widely perceived as having the potential to
improve student performance. According to a survey of school superintendents in 2005,
approximately 70% of school districts used benchmark tests as a component of their assessment
programming (Olson, 2005).
Benchmark assessments are one component of a balanced assessment system that is
designed to provide explicit, ongoing data required by school leaders and teachers to serve
73
district, school, classroom, and individual student needs (Herman, Osmundson, & Dietel, 2010).
The National Research Council (2001) defines a quality balanced assessment system as one that
is coherent, comprehensive, and continuous.
While annual state assessments provide a general indicator of how students are doing
relative to annual learning standards, and while formative assessment is embedded in ongoing
classroom instruction to inform immediate teaching and learning goals, benchmark assessments
occupy a middle position strategically located and administered outside daily classroom use but
inside the school and or district curriculum. Often uniform in timing and content across
classrooms and schools, benchmark assessment results can be aggregated at the classroom,
grade, school, and district levels to school and district decision-makers, as well as to teachers.
This interim indication of how well students are learning can fuel action, where needed, and
accelerate progress toward annual goals (Herman et al., 2010, p. 2).
Benchmark assessments often serve four interrelated yet distinct purposes. First,
benchmark assessments communicate expectations for learning: the knowledge that is
important, the skills that are valued, and the way learning will be measured. Second, benchmark
assessments serve instructional curriculum and planning purposes by providing educators the
information required to develop and adjust curriculum and instruction to meet individual student
learning needs. As a result benchmark assessments must be aligned with state content standards
for the period being assessed as well as provide feedback about students’ strengths and
weaknesses relative to those standards. Third, benchmark assessments can be used for
monitoring and evaluation purposes by providing stakeholders with information about how well
programs, curriculum, or other resources are being implemented to support student achievement.
Benchmark data can also be used to assess patterns and trends in school as well as teacher

74
performance. Fourth, school leaders and teachers can use benchmark assessment data to predict
the performance of schools, classes, and students regarding specific year-end goals and
proficiency levels on end-of-the-year state assessments (Herman et al., 2010; Popham, 2010).
Additionally, there are several criteria and principles that schools should consider when
selecting or developing benchmark tools. Validity is the all-encompassing concept that defines
the quality of an educational measurement. It defines the extent to which an assessment
measures what it is intended to measure and provides comprehensive information supporting the
purposes for which it is being used. Consequently benchmark assessments themselves are not
valid or invalid, instead the validity rests in the underlying evidence for the benchmark
assessment’s specific use (Herman et al., 2010). As a result, Herman et al. concluded that:
� Benchmark assessments must “be aligned with district and school learning goals and
intended purposes” (p.6). Alignment refers to the extent that what is being assessed
complements what is being taught. Aligned assessments should capture both the
depth and breadth of learning standards, signify the most important concepts and
skills being taught, reflect the consistency and sequence of the local and state
curriculum (Herman et al., 2010; Popham, 2010).
� Benchmark assessments must “provide reliable information for intended score
interpretations and uses” (Herman et al., 2010, p. 6). Reliability is an indication of
how consistently an assessment measures its intended aim and the extent to which the
scores are reasonably free from error. Consistency in machine-scored benchmark
multiple-choice items is rarely problematic for reliability (Herman et al., 2010;
Popham, 2010).

75
� Benchmark assessments must “be fair, unbiased, and accessible” (Herman et al.,
2010, p. 6). A fair benchmark assessment is accessible and allows all students to
demonstrate their knowledge; it should not provide some students with advantages
over other students. Further a benchmark that is unbiased does not impede students’
ability to demonstrate their knowledge or skill based upon race, ethnicity, language,
culture, gender, or disability. In other words, all subgroups with the same knowledge
and skills should perform consistently on the benchmark assessment (Herman et al.,
2010; Popham, 2010).
� Benchmark assessments must “be instructionally sensitive” (Herman et al., 2010, p.
6). Instructional sensitivity denotes the degree to which students’ performance on the
benchmark assessment accurately reflects the quality of instruction that has been
received as well as the students’ learning. If instructional sensitivity is deficient,
schools and districts must meticulously review the alignment between assessment
items and the curriculum to ensure that the benchmark assessment focuses on
concepts that are central to learning goals, outcomes, and standards. Assessment
items that are designed to confuse students or enable students to answer correctly
without the appropriate content knowledge affect instructional sensitivity (Herman et
al., 2010; Popham, 2010).
� Benchmark assessments must “have high utility” (Herman et al., 2010, p. 6). Utility
determines whether the assessment will be useful in accomplishing the intended
purposes. As such, benchmark assessments must be user-friendly as well as practical
and timely in administration, scoring, and interpretation (Herman et al., 2010;
Popham, 2010).
76
� Benchmark assessments must “provide useful reporting for intended users and
purposes” (Herman et al., 2010, p. 6). Benchmark data are only useful when they are
reported in a timely and efficient manner. This requires reports that summarize
student performance at different levels of the system: student, classroom, school, and
district. Scoring metrics and reporting categories must be consistent with state
proficiency levels and should allow flexibility for customized local reports. Further
user-friendly reports with multiple representations such as text, graphs, and tables
will help convey benchmark assessment data to diverse audiences (Herman et al.,
2010; Popham, 2010).
Proponents of benchmark assessments have claimed that these assessments have the
potential to provide specific feedback on the academic content areas in which students require
the most support. Advocates also have suggested that adequately aligned benchmark
assessments enable teachers to more accurately predict students’ performance against local and
state standards (Burke, 2010; Coffey, n.d.; Olson, 2005). However, critics of high-stakes
benchmark assessments have submitted that these tests merely encourage educators to teach to
the test and that there is no evidence to support that periodic assessments are educationally
beneficial (Coffey, n.d.; Popham, 2008; Zehr, 2006). Chappuis and Chappuis (2007/2008) advise
that benchmark assessments will produce no formative instructional benefits if teachers
administer the test, report the results, and then continue with instruction as formerly planned.
This can easily occur when teachers are expected to cover a substantial amount of curriculum in
a short amount of time. Burke (2010) has added that the critical key to the use of benchmark
assessments to improve student achievement involves educators taking the time to analyze the

77
results and target those academic areas in which individual students or groups of students scored
poorly.
Pearson Benchmark
Pearson Benchmark is a comprehensive, customizable, Web-based district-level
formative assessment testing system and reporting tool. It enables districts, schools, and
classrooms to manage, measure, and maximize student achievement through testing, reporting,
and analytics. Pearson Benchmark provides formative assessment through multiple measures of
student performance against standards at any point throughout the school year. It also provides
opportunities to monitor student progress against standards and recheck mastery with student
performance results collected over time (Pearson, 2013a, 2013b).
Test development and test administration processes are automated with tools that allow
districts to align assessments with state content standards. Districts create, deliver, score, and
report on standards-based tests online, offline, or through a combination of both. Test creators
can select questions from a suite of item banking solutions to fit the individual district’s needs.
Students may take the assessments either online in a secured testing environment or on paper.
Pearson Benchmark supports scanning tools for tests that are administered on paper. Further raw
score test results for both delivery modes are available instantaneously while additional test
results, including test scores and mastery of standards, are available the following day for online
analysis and reporting (Pearson, 2013a, 2013b).

78
CHAPTER 3
METHODOLOGY
Introduction
Quantitative research is described as a means of testing objective theories by
investigating the relationships among variables (Creswell, 2009). The purpose of this
quantitative research study was to examine the relationship of the Pearson Benchmark
assessment scores in reading and language arts and math and Tennessee Comprehensive
Assessment Program (TCAP) scores in reading and language arts and math for third, fourth,
fifth, and sixth grade students. The objective was to examine the relationship between the TCAP
test and the Pearson Benchmark assessment. Chapter 3 includes the quantitative methodology
and procedures used in this study. This chapter is organized into the following sections: research
design, population, procedures, instrumentation, research questions and null hypotheses, data
analysis, and a summary of the chapter.
Research Design
A nonexperimental, exploratory, quantitative, correlational research design was used for
this study. This research design was selected and conducted because the independent variables
were not manipulated nor was treatment or intervention provided for the study participants. The
data collection tools were two criterion-referenced tests, the Pearson Benchmark assessment and
the TCAP. These tests were completed by third, fourth, fifth, and sixth grade students using the
paper-pencil testing format in reading and language arts and math from the 2011-2012 school

79
year. The researcher obtained permission from a school district in northeastern Tennessee to
conduct this analysis.
Population
This study was conducted in one school district in northeastern Tennessee. The school
district is comprised of five elementary schools serving 2,689 students in pre-Kindergarten
through sixth grade, one middle school serving 588 students in seventh and eighth grades, and
one high school serving 1,102 students in 9th through 12th grades. Two of the five elementary
schools as well as the middle and high school qualify for Title I funding because approximately
44% of the student population is economically disadvantaged as defined by participation in the
free-or-reduced priced meals program. The school district’s ethnic diversity is characterized by
91.3% White, 5.2% African American, 1.9% Hispanic, 0.9% Asian or Pacific Islander and 0.2%
Native American.
The population for this study included third, fourth, fifth, and sixth grade students who
took the Pearson Benchmark assessment for reading and language arts and math in the fall,
winter, and spring of the 2011-2012 academic school year and the TCAP in reading and
language arts and math in the spring of the 2011-2012 academic school year. The criterion for
inclusion in the population was that students had participated in three Benchmark (fall, winter,
spring) tests and the TCAP test (spring) during the 2011-2012 school year. Students in these
grade levels who did not complete the fall, winter, and spring Benchmark tests and the TCAP
test were eliminated from the study. One thousand two hundred thirteen third, fourth, fifth, and
sixth grade students were tested and 1,069 took all four tests.
80
Data were gathered with permission of the participating school district and did not
require student participation beyond testing that is normally required as a part of the regular
academic program. Variables included in this study comprised the following:
� Gender;
� Grade level;
� Socioeconomic status as determined by free and reduced-price meal benefits;
� Title I school status;
� Pearson Benchmark assessments (fall, winter, and spring);
� TCAP test in spring of the 2011-2012 academic year.
Procedures
An exempt status was acquired from East Tennessee State University’s Institutional
Review Board prior to the onset of this research project. Additionally, permission to conduct
this study using data from the aforementioned school district was received from the Director of
Schools (see Appendix A).
The researcher collaborated with the district’s Supervisor of Accountability and School
Improvement to retrieve standardized test reports through Pearson Access and Pearson
Limelight. These cross-platform systems provide functionality and performance while
generating reports for tests given in each of the five elementary schools. The reports included
gender and socioeconomic status of each student in addition to test scores for the Pearson
Benchmark assessment as well as the TCAP. Student anonymity was maintained as names were
not released to the researcher by the school district. To ensure that each student’s identity was

81
protected the Supervisor of Accountability and School Improvement omitted names from the
reports and students were assigned a number.
Instrumentation
The researcher used the Tennessee Comprehensive Assessment Program (TCAP)
Achievement test and Pearson Benchmark assessment to gather third, fourth, fifth, and sixth
grade student’s academic performance data in reading and language arts and mathematics. The
TCAP is a criterion-referenced, timed, multiple choice assessment based on Tennessee content
standards. The TCAP tests were published by Pearson Education, Inc., and are required to be
administered during a state-mandated testing window each spring. The Pearson Benchmark
assessment is a criterion-referenced, timed, multiple choice assessment that is based on
Tennessee content standards. The Pearson Benchmark assessment, which is also published by
Pearson Education, Inc., is given to students during the fall, winter, and spring of the academic
school year. The percentage correct scores of each of the three Pearson Benchmark assessments
(fall, winter, and spring) were combined by average to provide a summative, cumulative
measure.
Research Questions and Hypotheses
The following research questions guided this study:
Research Question 1: Are there significant relationships between the percentage correct
scores on the Tennessee Comprehensive Assessment Program (TCAP) in reading and language
arts and the percentage correct scores on the Pearson Benchmark assessment in reading and
language arts for students in grade 3, grade 4, grade 5, and grade 6? This research question was
82
addressed using the Pearson product-moment correlation coefficients of the TCAP and the
Pearson Benchmark assessment percentage correct scores for students in grades 3, 4, 5, and 6 in
reading and language arts. The following null hypotheses were tested:
H011: There is no significant relationship between the TCAP in reading and language
arts and the Pearson Benchmark assessment in reading and language arts among
third graders.
H012: There is no significant relationship between the TCAP in reading and language
arts and the Pearson Benchmark assessment in reading and language arts among
fourth graders.
H013: There is no significant relationship between the TCAP in reading and language
arts and the Pearson Benchmark assessment in reading and language arts among
fifth graders.
H014: There is no significant relationship between the TCAP in reading and language arts
and the Pearson Benchmark assessment in reading and language arts among sixth
graders.
Research Question 2: Are there significant relationships between the percentage correct
scores on the Tennessee Comprehensive Assessment Program (TCAP) in math and the
percentage correct scores on the Pearson Benchmark assessment in math for students in grade 3,
grade 4, grade 5, and grade 6? This research question was addressed using the Pearson product-
moment correlation coefficients of the TCAP and the Pearson Benchmark assessment percentage
correct scores for students in grades 3, 4, 5, and 6 in math. The following null hypotheses were
tested:
83
H021: There is no significant relationship between the TCAP in math and the Pearson
Benchmark assessment in math among third graders.
H022: There is no significant relationship between the TCAP in math and the Pearson
Benchmark assessment in math among fourth graders.
H023: There is no significant relationship between the TCAP in math and the Pearson
Benchmark assessment in math among fifth graders.
H024: There is no significant relationship between the TCAP in math and the Pearson
Benchmark assessment in math among sixth graders.
Research Question 3: Are there significant differences in the mean percentage correct
scores on the Tennessee Comprehensive Assessment Program (TCAP) in reading and language
arts between male and female students for each grade? This research question was addressed
using the t test for independent samples. The following null hypotheses were tested:
H031: There is not a significant difference on the TCAP in reading and language arts
between male and female students in third grade.
H032: There is not a significant difference on the TCAP in reading and language arts
between male and female students in fourth grade.
H033: There is not a significant difference on the TCAP in reading and language arts
between male and female students in fifth grade.
H034: There is not a significant difference on the TCAP in reading and language arts
between male and female students in sixth grade.
Research Question 4: Are there significant differences in the mean percentage correct
scores on the Tennessee Comprehensive Assessment Program (TCAP) in math between male

84
and female students for each grade? This research question was addressed using the t test for
independent samples. The following null hypotheses were tested:
H041: There is not a significant difference on the TCAP in math between male and
female students in third grade.
H042: There is not a significant difference on the TCAP in math between male and
female students in fourth grade.
H043: There is not a significant difference on the TCAP in math between male and
female students in fifth grade.
H044: There is not a significant difference on the TCAP in math between male and
female students in sixth grade.
Research Question 5: Are there significant differences in the mean percentage correct
scores on the Pearson Benchmark assessment in reading and language arts between male and
female students for each grade? This research question was addressed using the t test for
independent samples. The following null hypotheses were tested:
H051: There is not a significant difference on the Pearson Benchmark assessment in
reading and language arts between male and female students in third grade.
H052: There is not a significant difference on the Pearson Benchmark assessment in
reading and language arts between male and female students in fourth grade.
H053: There is not a significant difference on the Pearson Benchmark assessment in
reading and language arts between male and female students in fifth grade.
H054: There is not a significant difference on the Pearson Benchmark assessment in
reading and language arts between male and female students in sixth grade.
85
Research Question 6: Are there significant differences in the mean percentage correct
scores on the Pearson Benchmark assessment in math between male and female students for each
grade? This research question was addressed using the t test for independent samples. The
following null hypotheses were tested:
H061: There is not a significant difference on the Pearson Benchmark assessment in
math between male and female students in third grade.
H062: There is not a significant difference on the Pearson Benchmark assessment in
math between male and female students in fourth grade.
H063: There is not a significant difference on the Pearson Benchmark assessment in
math between male and female students in fifth grade.
H064: There is not a significant difference on the Pearson Benchmark assessment in
math between male and female students in sixth grade.
Research Question 7: Are there significant differences between students who are
attending Title I and non-Title I schools and the percentage correct scores on the Tennessee
Comprehensive Assessment Program (TCAP) in reading and language arts and the percentage
correct scores on the Pearson Benchmark assessment in reading and language arts for each
grade? This research question was addressed using the multivariate analysis of variance
(MANOVA) to account for differences in a set of two dependent variables, percentage correct
scores on the Tennessee Comprehensive Assessment Program (TCAP) and the percentage
correct scores on the Pearson Benchmark assessment. The following null hypotheses were
tested:
H071: There is no significant difference between third grade students who are attending
Title I and non-Title I schools and the percentage correct scores on the TCAP in

86
reading and language arts and the percentage correct scores on the Pearson
Benchmark assessment in reading and language arts.
H072: There is no significant difference between fourth grade students who are
attending Title I and non-Title I schools and the percentage correct scores on the
TCAP in reading and language arts and the percentage correct scores on the
Pearson Benchmark assessment in reading and language arts.
H073: There is no significant difference between fifth grade students who are attending
Title I and non-Title I schools and the percentage correct scores on the TCAP in
reading and language arts and the percentage correct scores on the Pearson
Benchmark assessment in reading and language arts.
H074: There is no significant difference between sixth grade students who are attending
Title I and non-Title I schools and the percentage correct scores on the TCAP in
reading and language arts and the percentage correct scores on the Pearson
Benchmark assessment in reading and language arts.
Research Question 8: Are there significant differences between students who are
attending Title I and non-Title I schools and the percentage correct scores on the Tennessee
Comprehensive Assessment Program (TCAP) in math and the percentage correct scores on the
Pearson Benchmark assessment in math for each grade? This research question was addressed
using the multivariate analysis of variance (MANOVA) to account for differences in a set of two
dependent variables, percentage correct scores on the Tennessee Comprehensive Assessment
Program (TCAP) and the percentage correct scores on the Pearson Benchmark assessment. The
following null hypotheses were tested:

87
H081: There is no significant difference between third grade students who are attending
Title I and non-Title I schools and the percentage correct scores on the TCAP in
math and the percentage correct scores on the Pearson Benchmark assessment in
math.
H082: There is no significant difference between fourth grade students who are attending
Title I and non-Title I schools and the percentage correct scores on the TCAP in
math and the percentage correct scores on the Pearson Benchmark assessment in
math.
H083: There is no significant difference between fifth grade students who are attending
Title I and non-Title I schools and the percentage correct scores on the TCAP in
math and the percentage correct scores on the Pearson Benchmark assessment in
math.
H084: There is no significant difference between sixth grade students who are attending
Title I and non-Title I schools and the percentage correct scores on the TCAP in
math and the percentage correct scores on the Pearson Benchmark assessment in
math.
Research Question 9: Are there significant relationships between students’
socioeconomic status (as measured by free and reduced-price meal benefits) and the percentage
correct scores on the Tennessee Comprehensive Assessment Program (TCAP) in reading and
language arts and the percentage correct scores on the Pearson Benchmark assessment in reading
and language arts for each grade? This research question was addressed using the multivariate
analysis of variance (MANOVA) to account for differences in a set of two dependent variables,
percentage correct scores on the Tennessee Comprehensive Assessment Program (TCAP) and

88
the percentage correct scores on the Pearson Benchmark assessment. The following null
hypotheses were tested:
H091: There is no significant relationship between third grade students who are receiving
free and reduced- price meal benefits and students who are not receiving free and
reduced-price meal benefits and the percentage correct scores on the TCAP in
reading and language arts and the percentage correct scores on the Pearson
Benchmark assessment in reading and language arts.
H092: There is no significant relationship between fourth grade students who are
receiving free and reduced-price meal benefits and students who are not receiving
free and reduced-price meal benefits and the percentage correct scores on the
TCAP in reading and language arts and the percentage correct scores on the
Pearson Benchmark assessment in reading and language arts.
H093: There is no significant relationship between fifth grade students who are receiving
free and reduced- price meal benefits and students who are not receiving free and
reduced-price meal benefits and the percentage correct scores on the TCAP in
reading and language arts and the percentage correct scores on the Pearson
Benchmark assessment in reading and language arts.
H094: There is no significant relationship between sixth grade students who are
receiving free and reduced-price meal benefits and students who are not receiving
free and reduced-price meal benefits and the percentage correct scores on the
TCAP in reading and language arts and the percentage correct scores on the
Pearson Benchmark assessment in reading and language arts.

89
Research Question 10: Are there significant relationships between students’
socioeconomic status (as measured by free and reduced-price meal benefits) and the percentage
correct scores on the Tennessee Comprehensive Assessment Program (TCAP) in math and the
percentage correct scores on the Pearson Benchmark assessment in math for each grade? This
research question was addressed using the multivariate analysis of variance (MANOVA) to
account for differences in a set of two dependent variables, percentage correct scores on the
Tennessee Comprehensive Assessment Program (TCAP) and the percentage correct scores on
the Pearson Benchmark assessment. The following null hypotheses were tested:
H0101: There is no significant relationship between third grade students who are receiving
free and reduced-price meal benefits and students who are not receiving free and
reduced-price meal benefits and the percentage correct scores on the TCAP and
the percentage correct scores on the Pearson Benchmark assessment in math.
H0102: There is no significant relationship between fourth grade students who are
receiving free and reduced- price meal benefits and students who are not receiving
free and reduced-price meal benefits and the percentage correct scores on the
TCAP and the percentage correct scores on the Pearson Benchmark assessment in
math.
H0103: There is no significant relationship between fifth grade students who are receiving
free and reduced- price meal benefits and students who are not receiving free and
reduced-price meal benefits and the percentage correct scores on the TCAP and
the percentage correct scores on the Pearson Benchmark assessment in math.
H0104: There is no significant relationship between sixth grade students who are
90
receiving free and reduced-price meal benefits and students who are not receiving
free and reduced-price meal benefits and the percentage correct scores on the
TCAP and the percentage correct scores on the Pearson Benchmark assessment in
math.
Data Analysis
Descriptive and inferential statistics were used in this study. Data collected for this study
were entered into an Excel data file for analysis using IBM-SPSS. The research questions were
examined using the Pearson product-moment correlation coefficients, the t test for independent
samples, and the multivariate analysis of variance (MANOVA) to account for differences in a set
of two dependent variables. These tests were conducted to examine the relationship of the
Pearson Benchmark assessment scores in reading and language arts and math and TCAP scores
in reading and language arts and math for third, fourth, fifth, and sixth grade students. The
objective was to examine the relationship between the TCAP test and the Pearson Benchmark
assessment. The criterion for establishing the statistical significance was set at an alpha level of
.05.
Summary
This chapter presented the research design, population, data collection, instrumentation,
data analysis, and research questions and null hypotheses used in this study. This study’s results
were obtained from quantitative data derived from the Pearson Benchmark assessment scores
and TCAP scores of third, fourth, fifth, and sixth grade students in a northeastern Tennessee
school district. Furthermore, the instruments used for testing, the Pearson Benchmark

91
assessment and TCAP, were explored and explained. Research questions and null hypotheses
were identified along with the subsequent statistical test. Chapter 4 contains the results from the
analysis.
92
CHAPTER 4
DATA ANALYSIS
Introduction
The research questions introduced in Chapter 1 and the hypotheses presented in Chapter
3 are addressed in this chapter. The purpose of this study was to determine if there is a
relationship between the Tennessee Comprehensive Assessment Program (TCAP) test and the
Pearson Benchmark assessment in elementary students’ reading and language arts and math
performance in a northeastern Tennessee school district. This study involved third, fourth, fifth,
and sixth grade students in the content areas of reading and language arts and math. Test scores
of students taking the Pearson Benchmark assessment in the fall, winter, and spring of the 2011-
2012 academic school year and the TCAP in the spring of the 2012 academic school year were
compared. Test scores were collected from five elementary schools. The study was guided by
10 research questions and the corresponding null hypotheses.
Demographics
Demographic information of the population included gender, Title I school status, and
socioeconomic status as determined by free and reduced-price meal benefits. Data from 291
(27.2%) third grade students, 252 (23.6%) fourth grade students, 254 (23.8%) fifth grade
students, and 272 (25.4%) sixth grade students in an urban school district in northeastern
Tennessee were used in this study. This study included all students in the district in Grades 3, 4,
5, and 6 who had taken all of the Pearson Benchmark assessments during the 2011-2012
academic school year as well as the TCAP in the spring of the 2012 academic school year. The
Pearson Benchmark assessments were administered during a 2-week testing window in the fall,

93
winter, and spring and the TCAP was administered during April of 2012. Due to student
absences and or student transiency, some students did not have test scores for all four
assessments in each subject area, reading and languages and math.
Gender
In third grade the population consisted of 144 (49.5%) males and 147 (50.5%) females.
There were 130 (51.6%) males and 122 (48.4%) females in the fourth grade. The fifth grade
population included 133 (52.4%) males and 121 (47.6%) females. The sixth grade population
comprised 147 (54%) males and 125 (46%) females. Altogether there were 554 (51.8%) males
and 515 (48.2%) females included in the study.
Title I School Status
The third grade population included 116 (39.9%) students who attended a Title I school
and 175 (60.1%) students who attended a school without Title I status. In fourth grade, 93
(36.9%) students attended a Title I school and 159 (63.1%) attended a non-Title I school. There
were 83 (32.7%) fifth grade students who attended a Title I school and 171 (67.3%) fifth grade
students who attended a school without Title I status. The sixth grade population comprised 101
(37.1%) students who attended a Title I school and 171 (62.9%) students who did not attend a
Title I school. Overall 393 (36.8%) students in this study attended a Title I school and 676
(63.2%) students attend a non-Title I school.

94
Socioeconomic Status
Socioeconomic status for the population was determined by free and reduced-price meal
benefits. In third grade 165 (56.7%) students received free and reduced-price meal benefits and
126 (43.4%) students did not. The fourth grade population was comprised of 129 (51.2%)
students who received free and reduced price meal benefits and 123 (48.8%) who did not receive
meal benefits. For fifth grade 128 (50.4%) students were recipients of meal benefits and 126
(49.6%) students were not recipients of meal benefits. In sixth grade 136 (50%) students
received free and reduced-price meal benefits and 136 (50%) students did not receive meal
benefits. As a whole 558 (52.2%) students in this study received free and reduced-price meal
benefits and 511 (47.8%) students in this study did not receive meal benefits.
Analysis of Research Questions
Data for this study were compiled from the results of the 2011-2012 Pearson Benchmark
assessments in reading and language arts and math as well as the 2012 TCAP tests in reading and
language arts and math. The remaining portions of this chapter are organized in the order of the
research questions previously presented in Chapters 1 and 3.
Research Question #1
Are there significant relationships between the percentage correct scores on the
Tennessee Comprehensive Assessment Program (TCAP) in reading and language arts and the
percentage correct scores on the Pearson Benchmark assessment in reading and language arts for
students in grade 3, grade 4, grade 5, and grade 6? This research question was addressed using
the Pearson product-moment correlation coefficients of the TCAP and the Pearson Benchmark

95
assessment percentage correct scores for students in grades 3, 4, 5, and 6 in reading and language
arts. The following null hypotheses were tested:
H011: There is no significant relationship between the TCAP in reading and language
arts and the Pearson Benchmark assessment in reading and language arts among
third graders.
H012: There is no significant relationship between the TCAP in reading and language
arts and the Pearson Benchmark assessment in reading and language arts among
fourth graders.
H013: There is no significant relationship between the TCAP in reading and language
arts and the Pearson Benchmark assessment in reading and language arts among
fifth graders.
H014: There is no significant relationship between the TCAP in reading and language arts
and the Pearson Benchmark assessment in reading and language arts among sixth
graders.
Table 1 displays the results for the correlations for the Pearson Benchmark assessment
scores and TCAP scores for reading and language arts in grade 3, grade 4, grade 5, and grade 6.
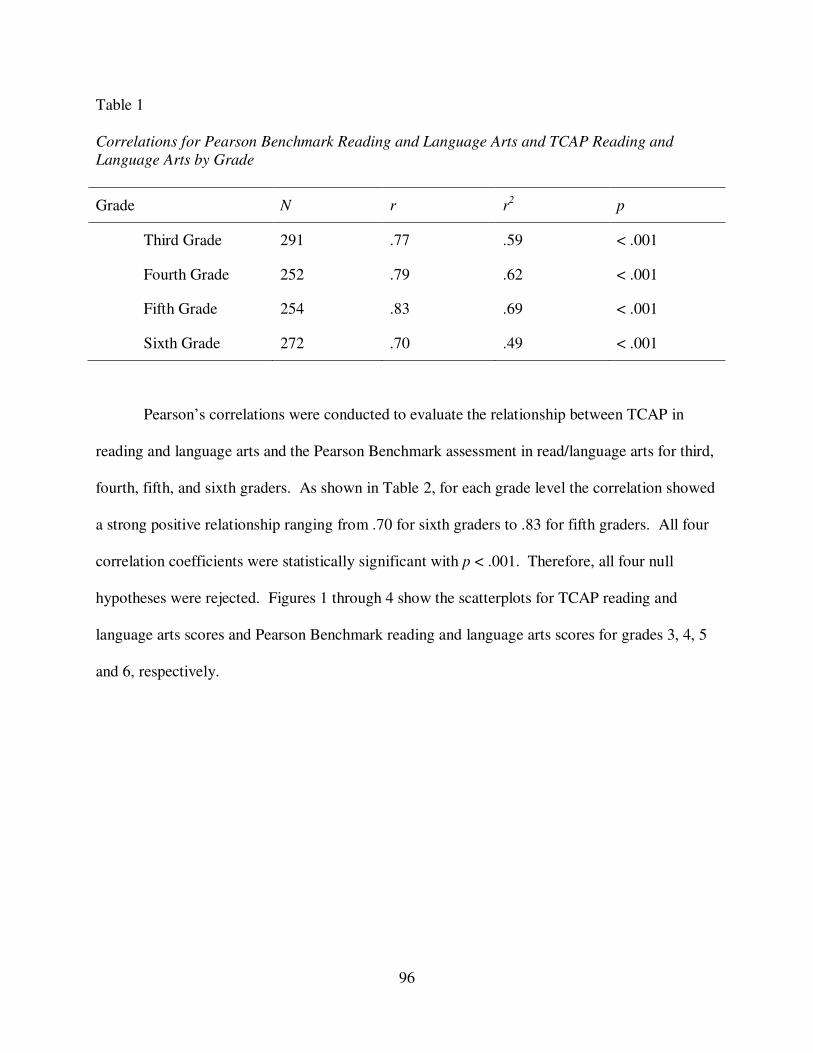
96
Table 1
Correlations for Pearson Benchmark Reading and Language Arts and TCAP Reading and
Language Arts by Grade
Grade N r r2
p
Third Grade 291 .77 .59 < .001
Fourth Grade 252 .79 .62 < .001
Fifth Grade 254 .83 .69 < .001
Sixth Grade 272 .70 .49 < .001
Pearson’s correlations were conducted to evaluate the relationship between TCAP in
reading and language arts and the Pearson Benchmark assessment in read/language arts for third,
fourth, fifth, and sixth graders. As shown in Table 2, for each grade level the correlation showed
a strong positive relationship ranging from .70 for sixth graders to .83 for fifth graders. All four
correlation coefficients were statistically significant with p < .001. Therefore, all four null
hypotheses were rejected. Figures 1 through 4 show the scatterplots for TCAP reading and
language arts scores and Pearson Benchmark reading and language arts scores for grades 3, 4, 5
and 6, respectively.

97
Figure 1. Scatterplot for TCAP Reading and Language Arts and Pearson Benchmark Reading
and language Arts for the Third Grade
Figure 2. Scatterplot for TCAP Reading and Language Arts and Pearson Benchmark Reading
and Language Arts for the Fourth Grade
Third Grade Reading
Pearson Benchmark Reading
10090807060504030
TC
AP
Re
ad
ing
- L
an
gu
ag
e A
rts
100
80
60
40
20
0
Fourth Grade Reading
Pearson Benchmark Reading
10090807060504030
TC
AP
Readin
g -
Language A
rts
100
80
60
40
20
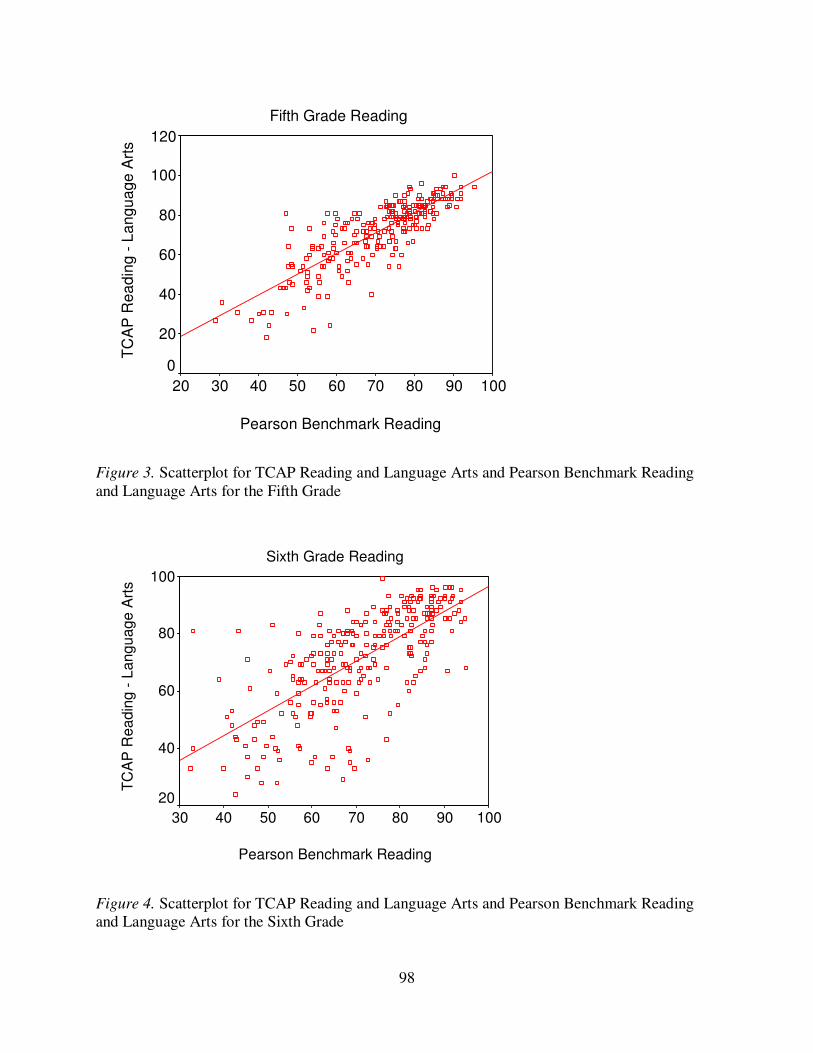
98
Figure 3. Scatterplot for TCAP Reading and Language Arts and Pearson Benchmark Reading
and Language Arts for the Fifth Grade
Figure 4. Scatterplot for TCAP Reading and Language Arts and Pearson Benchmark Reading
and Language Arts for the Sixth Grade
Fifth Grade Reading
Pearson Benchmark Reading
1009080706050403020
TC
AP
Re
ad
ing
- L
an
gu
ag
e A
rts
120
100
80
60
40
20
0
Sixth Grade Reading
Pearson Benchmark Reading
10090807060504030
TC
AP
Re
ad
ing
- L
an
gu
ag
e A
rts
100
80
60
40
20

99
Research Question #2
Are there significant relationships between the percentage correct scores on the
Tennessee Comprehensive Assessment Program (TCAP) in math and the percentage correct
scores on the Pearson Benchmark assessment in math for students in grade 3, grade 4, grade 5,
and grade 6? This research question was addressed using the Pearson product-moment
correlation coefficients of the TCAP and the Pearson Benchmark assessment percentage correct
scores for students in grades 3, 4, 5, and 6 in math. The following null hypotheses were tested:
H021: There is no significant relationship between the TCAP in math and the Pearson
Benchmark assessment in math among third graders.
H022: There is no significant relationship between the TCAP in math and the Pearson
Benchmark assessment in math among fourth graders.
H023: There is no significant relationship between the TCAP in math and the Pearson
Benchmark assessment in math among fifth graders.
H024: There is no significant relationship between the TCAP in math and the Pearson
Benchmark assessment in math among sixth graders.
Table 2 displays the results for the correlations for the Pearson Benchmark assessment
scores and TCAP scores for math in grade 3, grade 4, grade 5, and grade 6.
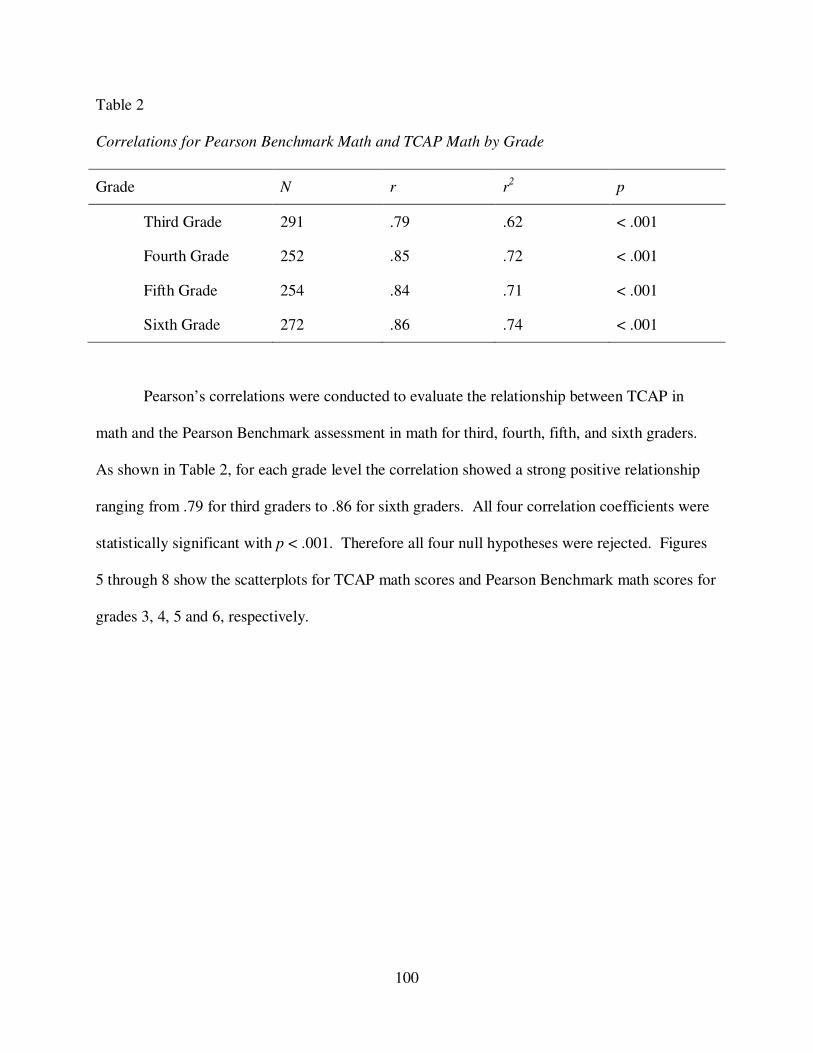
100
Table 2
Correlations for Pearson Benchmark Math and TCAP Math by Grade
Grade N r r2
p
Third Grade 291 .79 .62 < .001
Fourth Grade 252 .85 .72 < .001
Fifth Grade 254 .84 .71 < .001
Sixth Grade 272 .86 .74 < .001
Pearson’s correlations were conducted to evaluate the relationship between TCAP in
math and the Pearson Benchmark assessment in math for third, fourth, fifth, and sixth graders.
As shown in Table 2, for each grade level the correlation showed a strong positive relationship
ranging from .79 for third graders to .86 for sixth graders. All four correlation coefficients were
statistically significant with p < .001. Therefore all four null hypotheses were rejected. Figures
5 through 8 show the scatterplots for TCAP math scores and Pearson Benchmark math scores for
grades 3, 4, 5 and 6, respectively.

101
Figure 5. Scatterplot for TCAP Math and Pearson Benchmark Math for the Third Grade
Figure 6. Scatterplot for TCAP Math and Pearson Benchmark Math for the Fourth Grade
Third Grade Math
Pearson Benchmark Math
100806040200
TC
AP
Ma
th120
100
80
60
40
20
Fourth Grade Math
Pearson Benchmark Math
1009080706050403020
TC
AP
Ma
th
120
100
80
60
40
20

102
Figure 7. Scatterplot for TCAP Math and Pearson Benchmark Math for the Fifth Grade
Figure 8. Scatterplot for TCAP Math and Pearson Benchmark Math for the Sixth Grade
Fifth Grade Math
Pearson Benchmark Math
10080604020
TC
AP
Math
120
100
80
60
40
20
0
Sixth Grade Math
Pearson Benchmark Math
12010080604020
TC
AP
Ma
th
120
100
80
60
40
20
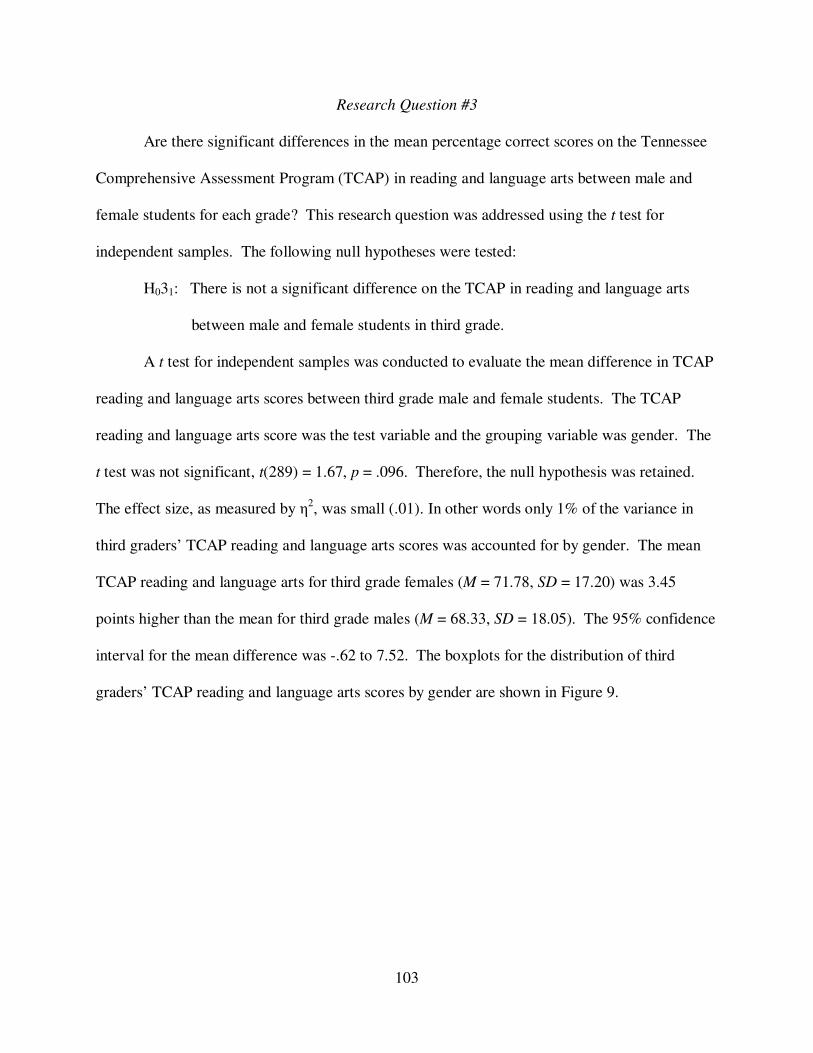
103
Research Question #3
Are there significant differences in the mean percentage correct scores on the Tennessee
Comprehensive Assessment Program (TCAP) in reading and language arts between male and
female students for each grade? This research question was addressed using the t test for
independent samples. The following null hypotheses were tested:
H031: There is not a significant difference on the TCAP in reading and language arts
between male and female students in third grade.
A t test for independent samples was conducted to evaluate the mean difference in TCAP
reading and language arts scores between third grade male and female students. The TCAP
reading and language arts score was the test variable and the grouping variable was gender. The
t test was not significant, t(289) = 1.67, p = .096. Therefore, the null hypothesis was retained.
The effect size, as measured by η2, was small (.01). In other words only 1% of the variance in
third graders’ TCAP reading and language arts scores was accounted for by gender. The mean
TCAP reading and language arts for third grade females (M = 71.78, SD = 17.20) was 3.45
points higher than the mean for third grade males (M = 68.33, SD = 18.05). The 95% confidence
interval for the mean difference was -.62 to 7.52. The boxplots for the distribution of third
graders’ TCAP reading and language arts scores by gender are shown in Figure 9.
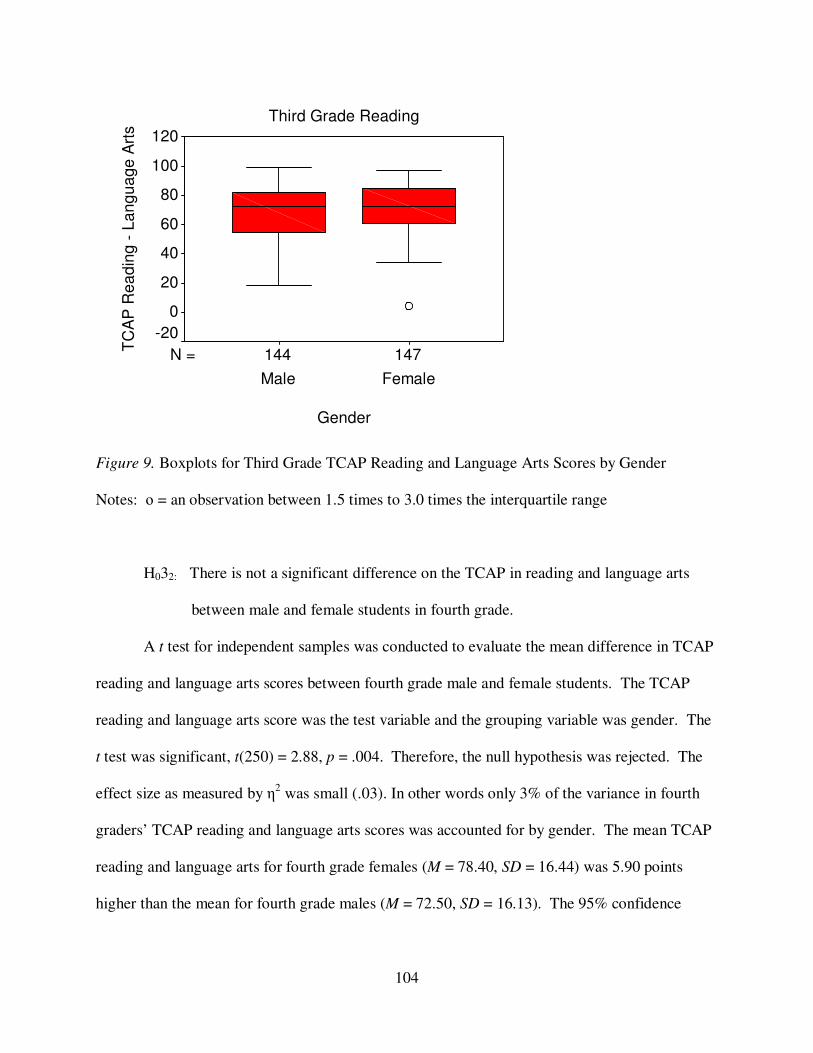
104
Figure 9. Boxplots for Third Grade TCAP Reading and Language Arts Scores by Gender
Notes: ο = an observation between 1.5 times to 3.0 times the interquartile range
H032: There is not a significant difference on the TCAP in reading and language arts
between male and female students in fourth grade.
A t test for independent samples was conducted to evaluate the mean difference in TCAP
reading and language arts scores between fourth grade male and female students. The TCAP
reading and language arts score was the test variable and the grouping variable was gender. The
t test was significant, t(250) = 2.88, p = .004. Therefore, the null hypothesis was rejected. The
effect size as measured by η2 was small (.03). In other words only 3% of the variance in fourth
graders’ TCAP reading and language arts scores was accounted for by gender. The mean TCAP
reading and language arts for fourth grade females (M = 78.40, SD = 16.44) was 5.90 points
higher than the mean for fourth grade males (M = 72.50, SD = 16.13). The 95% confidence
147144N =
Third Grade Reading
Gender
FemaleMale
TC
AP
Re
ad
ing
- L
an
gu
ag
e A
rts 120
100
80
60
40
20
0
-20

105
interval for the mean difference was 1.86 to 9.94. The boxplots for the distribution of fourth
graders’ TCAP reading and language arts scores by gender are shown in Figure 10.
Figure 10. Boxplots for Fourth Grade TCAP Reading and Language Arts Scores by Gender
Notes: ο = an observation between 1.5 times to 3.0 times the interquartile range
H033: There is not a significant difference on the TCAP in reading and language arts
between male and female students in fifth grade.
A t test for independent samples was conducted to evaluate the mean difference in TCAP
reading and language arts scores between fifth grade male and female students. The TCAP
reading and language arts score was the test variable and the grouping variable was gender. The
t test was not significant, t(252) = 1.65, p = .101. Therefore, the null hypothesis was retained.
The effect size as measured by η2 was small (.01). In other words only 1% of the variance in fifth
graders’ TCAP reading and language arts scores was accounted for by gender. The mean TCAP
122130N =
Fourth Grade Reading
Gender
FemaleMale
TC
AP
Readin
g -
Language A
rts 120
100
80
60
40
20

106
reading and language arts for fifth grade females (M = 73.15, SD = 15.49) was 3.41 points higher
than the mean for fifth grade males (M = 69.74, SD = 17.34). The 95% confidence interval for
the mean difference was -.67 to 7.49. The boxplots for the distribution of fifth graders’ TCAP
reading and language arts scores by gender are shown in Figure 11.
Figure 11. Boxplots for Fifth Grade TCAP Reading and Language Arts Scores by Gender
Notes: ο = an observation between 1.5 times to 3.0 times the interquartile range
H034: There is not a significant difference on the TCAP in reading and language arts
between male and female students in sixth grade.
A t test for independent samples was conducted to evaluate the mean difference in TCAP
reading and language arts scores between sixth grade male and female students. The TCAP
reading and language arts score was the test variable and the grouping variable was gender. The
t test was significant, t(270) = 3.282, p = .001. Therefore, the null hypothesis was rejected. The
121133N =
Fifth Grade Reading
Gender
FemaleMale
TC
AP
Re
ad
ing
- L
an
gu
ag
e A
rts 120
100
80
60
40
20
0
107
effect size as measured by η2 was small (.04). In other words only 4% of the variance in sixth
graders’ TCAP reading and language arts scores was accounted for by gender. The mean TCAP
reading and language arts for sixth grade females (M = 74.68, SD = 15.80) was 6.82 points
higher than the mean for sixth grade males (M = 67.86, SD = 18.07). The 95% confidence
interval for the mean difference was 2.73 to 10.90. The boxplots for the distribution of sixth
graders’ TCAP reading and language arts scores by gender are shown in Figure 12.
Figure 12. Boxplots for Sixth Grade TCAP Reading and Language Arts Scores by Gender
Research Question #4
Are there significant differences in the mean percentage correct scores on the Tennessee
Comprehensive Assessment Program (TCAP) in math between male and female students for
each grade? This research question was addressed using the t test for independent samples. The
following null hypotheses were tested:
125147N =
Sixth Grade Reading
Gender
FemaleMale
TC
AP
Readin
g -
Language A
rts 120
100
80
60
40
20
0

108
H041: There is not a significant difference on the TCAP in math between male and
female students in third grade.
A t test for independent samples was conducted to evaluate the mean difference in TCAP
math scores between third grade male and female students. The TCAP math score was the test
variable and the grouping variable was gender. The t test was not significant, t(289) = 1.34, p =
.183. Therefore the null hypothesis was retained. The effect size as measured by η2 was small
(.01). In other words only 1% of the variance in third graders’ TCAP math scores was accounted
for by gender. The mean TCAP math for third grade males (M = 78.57, SD = 17.00) was 2.64
points higher than the mean for third grade females (M = 75.90, SD = 17.04). The 95%
confidence interval for the mean difference was -1.26 to 6.59. The boxplots for the distribution
of third graders’ TCAP math scores by gender are shown in Figure 13.
Figure 13. Boxplots for Third Grade TCAP Math Scores by Gender
Notes: ο = an observation between 1.5 times to 3.0 times the interquartile range
147144N =
Third Grade Math
Gender
FemaleMale
TC
AP
Ma
th
120
100
80
60
40
20
0
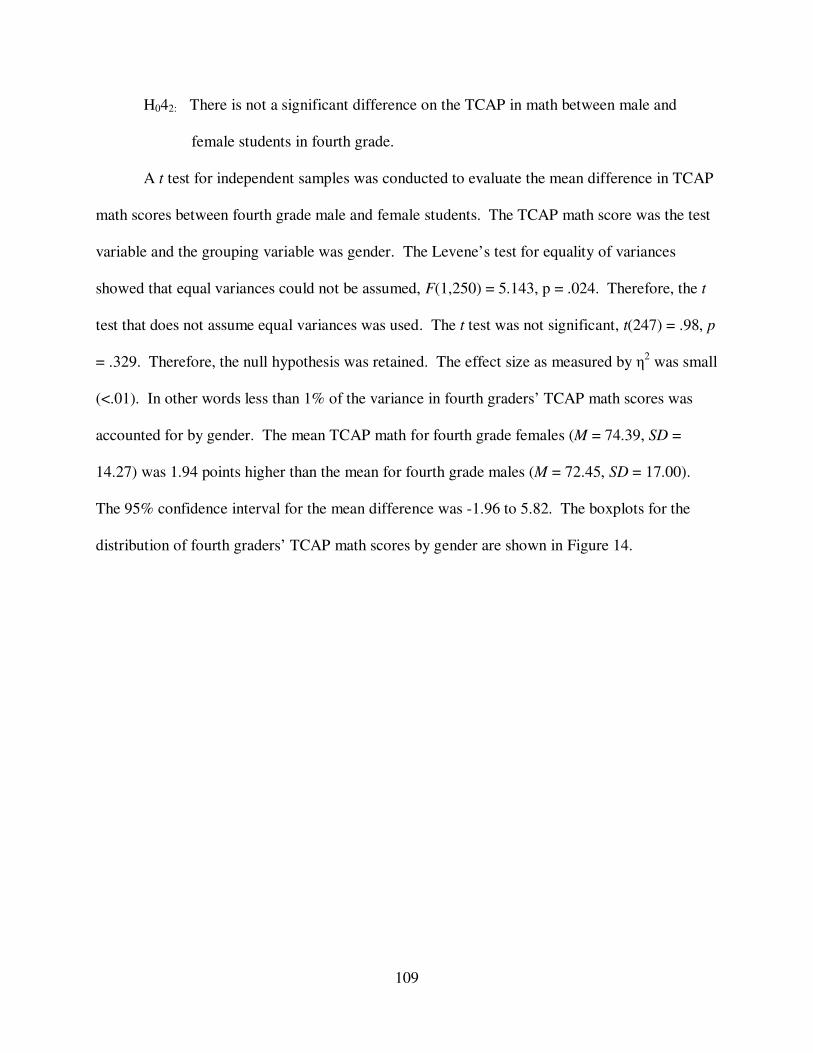
109
H042: There is not a significant difference on the TCAP in math between male and
female students in fourth grade.
A t test for independent samples was conducted to evaluate the mean difference in TCAP
math scores between fourth grade male and female students. The TCAP math score was the test
variable and the grouping variable was gender. The Levene’s test for equality of variances
showed that equal variances could not be assumed, F(1,250) = 5.143, p = .024. Therefore, the t
test that does not assume equal variances was used. The t test was not significant, t(247) = .98, p
= .329. Therefore, the null hypothesis was retained. The effect size as measured by η2 was small
(<.01). In other words less than 1% of the variance in fourth graders’ TCAP math scores was
accounted for by gender. The mean TCAP math for fourth grade females (M = 74.39, SD =
14.27) was 1.94 points higher than the mean for fourth grade males (M = 72.45, SD = 17.00).
The 95% confidence interval for the mean difference was -1.96 to 5.82. The boxplots for the
distribution of fourth graders’ TCAP math scores by gender are shown in Figure 14.
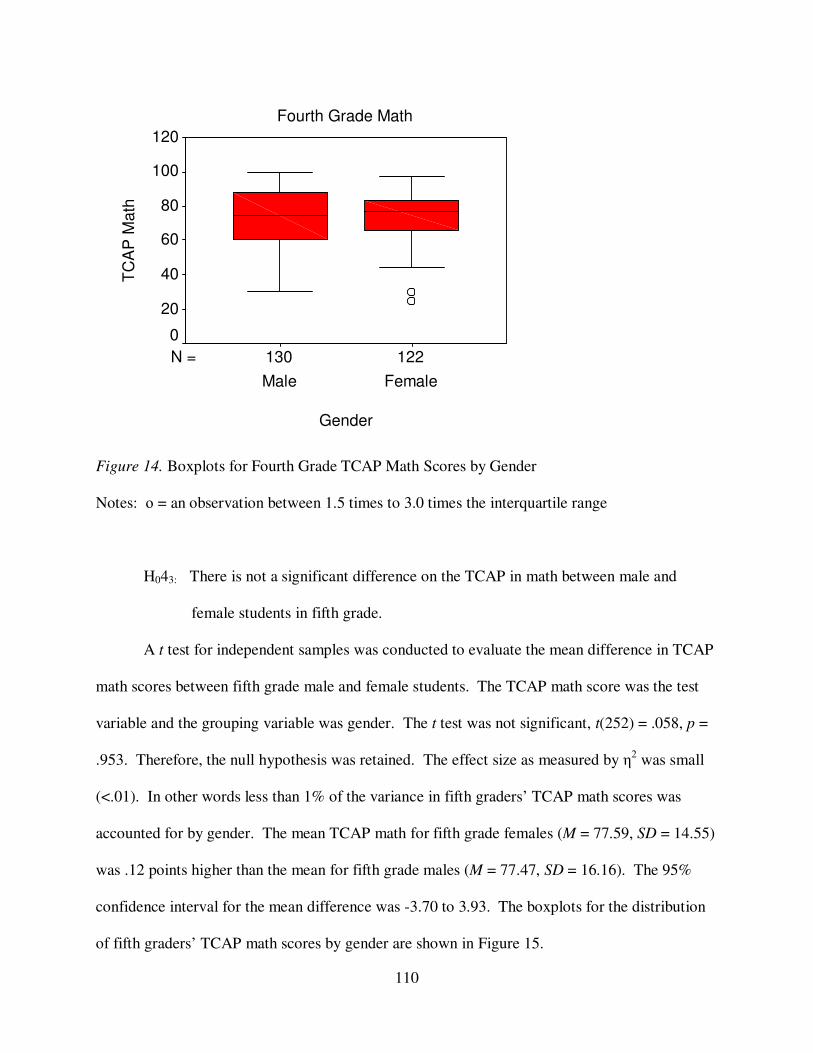
110
Figure 14. Boxplots for Fourth Grade TCAP Math Scores by Gender
Notes: ο = an observation between 1.5 times to 3.0 times the interquartile range
H043: There is not a significant difference on the TCAP in math between male and
female students in fifth grade.
A t test for independent samples was conducted to evaluate the mean difference in TCAP
math scores between fifth grade male and female students. The TCAP math score was the test
variable and the grouping variable was gender. The t test was not significant, t(252) = .058, p =
.953. Therefore, the null hypothesis was retained. The effect size as measured by η2 was small
(<.01). In other words less than 1% of the variance in fifth graders’ TCAP math scores was
accounted for by gender. The mean TCAP math for fifth grade females (M = 77.59, SD = 14.55)
was .12 points higher than the mean for fifth grade males (M = 77.47, SD = 16.16). The 95%
confidence interval for the mean difference was -3.70 to 3.93. The boxplots for the distribution
of fifth graders’ TCAP math scores by gender are shown in Figure 15.
122130N =
Fourth Grade Math
Gender
FemaleMale
TC
AP
Ma
th120
100
80
60
40
20
0
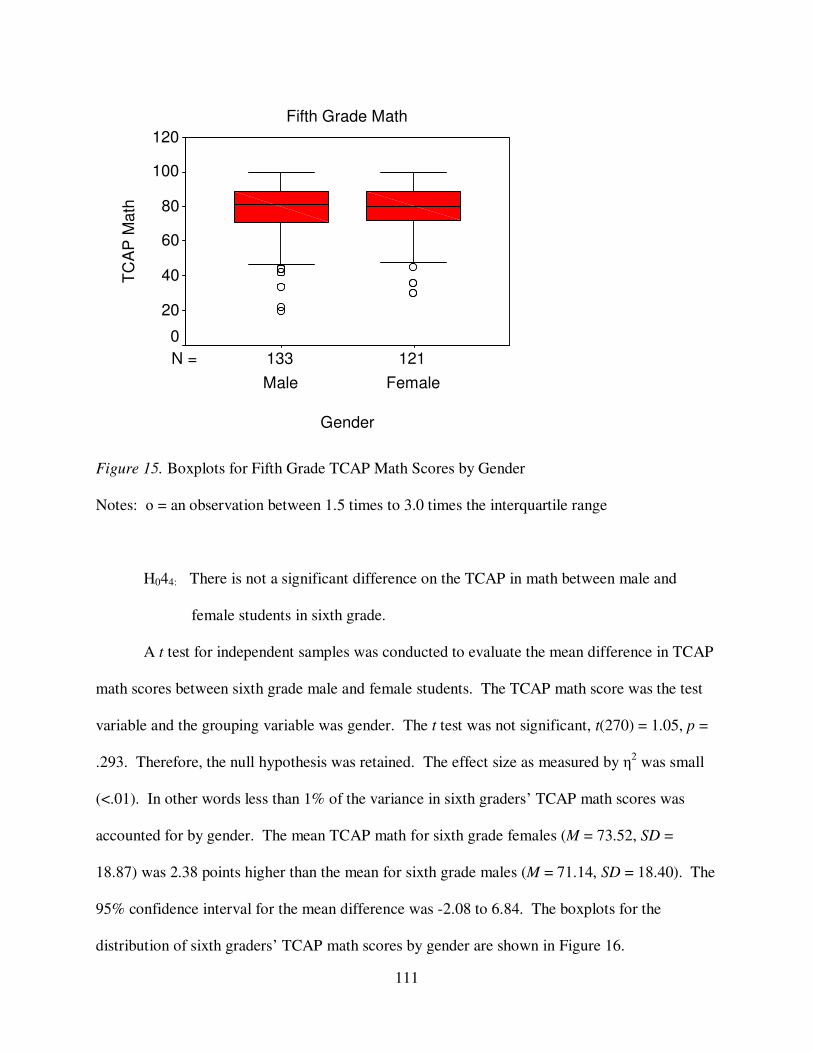
111
Figure 15. Boxplots for Fifth Grade TCAP Math Scores by Gender
Notes: ο = an observation between 1.5 times to 3.0 times the interquartile range
H044: There is not a significant difference on the TCAP in math between male and
female students in sixth grade.
A t test for independent samples was conducted to evaluate the mean difference in TCAP
math scores between sixth grade male and female students. The TCAP math score was the test
variable and the grouping variable was gender. The t test was not significant, t(270) = 1.05, p =
.293. Therefore, the null hypothesis was retained. The effect size as measured by η2 was small
(<.01). In other words less than 1% of the variance in sixth graders’ TCAP math scores was
accounted for by gender. The mean TCAP math for sixth grade females (M = 73.52, SD =
18.87) was 2.38 points higher than the mean for sixth grade males (M = 71.14, SD = 18.40). The
95% confidence interval for the mean difference was -2.08 to 6.84. The boxplots for the
distribution of sixth graders’ TCAP math scores by gender are shown in Figure 16.
121133N =
Fifth Grade Math
Gender
FemaleMale
TC
AP
Ma
th120
100
80
60
40
20
0
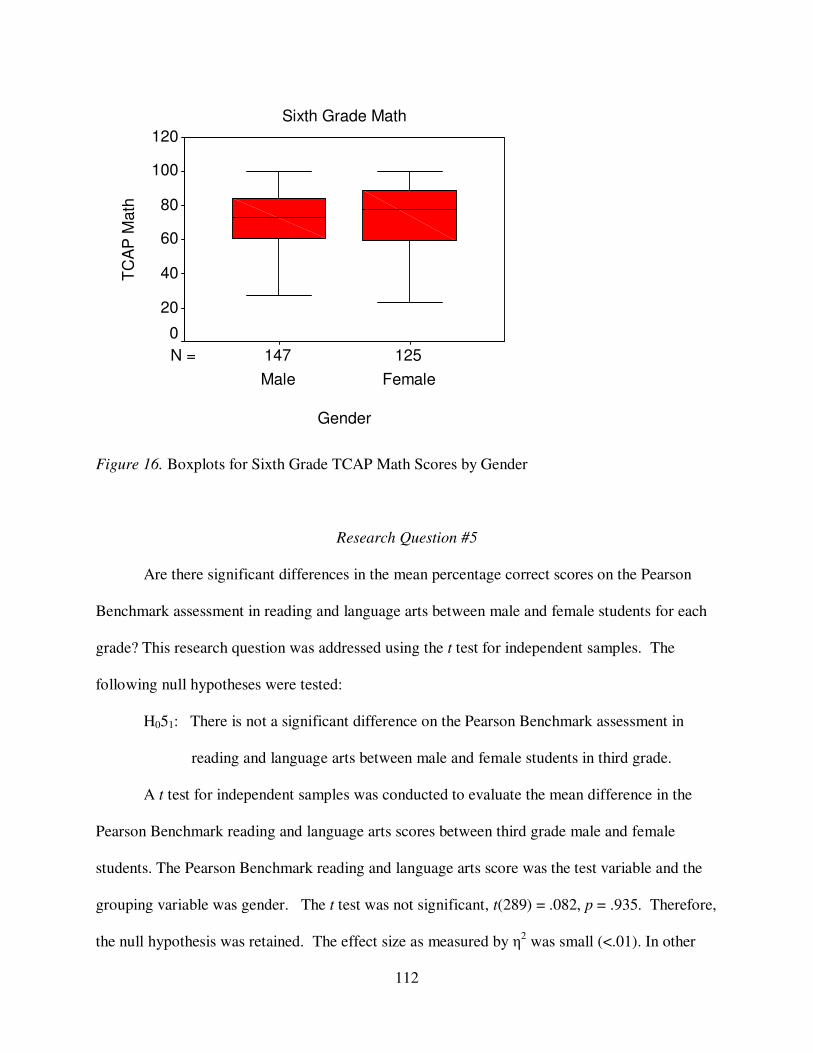
112
Figure 16. Boxplots for Sixth Grade TCAP Math Scores by Gender
Research Question #5
Are there significant differences in the mean percentage correct scores on the Pearson
Benchmark assessment in reading and language arts between male and female students for each
grade? This research question was addressed using the t test for independent samples. The
following null hypotheses were tested:
H051: There is not a significant difference on the Pearson Benchmark assessment in
reading and language arts between male and female students in third grade.
A t test for independent samples was conducted to evaluate the mean difference in the
Pearson Benchmark reading and language arts scores between third grade male and female
students. The Pearson Benchmark reading and language arts score was the test variable and the
grouping variable was gender. The t test was not significant, t(289) = .082, p = .935. Therefore,
the null hypothesis was retained. The effect size as measured by η2 was small (<.01). In other
125147N =
Sixth Grade Math
Gender
FemaleMale
TC
AP
Ma
th120
100
80
60
40
20
0

113
words less than 1% of the variance in third graders’ Pearson Benchmark reading and language
arts scores was accounted for by gender. The mean Pearson Benchmark reading and language
arts for third grade females (M = 62.44, SD = 11.41) was .11 points higher than the mean for
third grade males (M = 62.33, SD = 11.24). The 95% confidence interval for the mean difference
was 2.50 to -2.72. The boxplots for the distribution of third graders’ Pearson Benchmark
reading and language arts scores by gender are shown in Figure 17.
Figure 17. Boxplots for Third Grade Pearson Benchmark Reading and Language Arts Scores by
Gender
H052: There is not a significant difference on the Pearson Benchmark assessment in
reading and language arts between male and female students in fourth grade.
A t test for independent samples was conducted to evaluate the mean difference in the
Pearson Benchmark reading and language arts scores between fourth grade male and female
147144N =
Third Grade Reading
Gender
FemaleMale
Pears
on B
enchm
ark
Readin
g 90
80
70
60
50
40
30

114
students. The Pearson Benchmark reading and language arts score was the test variable and the
grouping variable was gender. The Levene’s test for equality of variances showed that equal
variances could not be assumed, F(1,250) = 6.13, p = .014. Therefore the t test that did not
assume equal variances was used. The t test was significant, t (248) = -2.16, p = .010.
Therefore, the null hypothesis was rejected. The effect size as measured by η2 was small (.03).
In other words only 3% of the variance in fourth graders’ Pearson Benchmark reading and
language arts scores was accounted for by gender. The mean Pearson Benchmark reading and
language arts for fourth grade females (M = 72.63, SD = 12.38) was 4.44 points higher than the
mean for fourth grade males (M = 68.19, SD = 14.63). The 95% confidence interval for the
mean difference was -7.80 to -1.09. The boxplots for the distribution of fourth graders’ Pearson
Benchmark reading and language arts scores by gender are shown in Figure 18.
Figure 18. Boxplots for Fourth Grade Pearson Benchmark Reading and Language Arts Scores by
Gender
122130N =
Fourth Grade Reading
Gender
FemaleMale
Pe
ars
on
Be
nch
ma
rk R
ea
din
g 120
100
80
60
40
20
115
H053: There is not a significant difference on the Pearson Benchmark assessment in
reading and language arts between male and female students in fifth grade.
A t test for independent samples was conducted to evaluate the mean difference in the
Pearson Benchmark reading and language arts scores between fifth grade male and female
students. The Pearson Benchmark reading and language arts score was the test variable and the
grouping variable was gender. The t test was not significant, t (252) = .861, p = .390.
Therefore, the null hypothesis was retained. The effect size as measured by η2 was small (<.01).
In other words less than 1% of the variance in fifth graders’ Pearson Benchmark reading and
language arts scores was accounted for by gender. The mean Pearson Benchmark reading and
language arts for fifth grade females (M = 71.19, SD = 12.11) was 3.41 points higher than the
mean for fifth grade males (M = 67.78, SD = 13.92). The 95% confidence interval for the mean
difference was -1.82 to 4.65. The boxplots for the distribution of fifth graders’ Pearson
Benchmark reading and language arts scores by gender are shown in Figure 19.

116
Figure 19. Boxplots for Fifth Grade Pearson Benchmark Reading and Language Arts Scores by
Gender
H054: There is not a significant difference on the Pearson Benchmark assessment in
reading and language arts between male and female students in sixth grade.
A t test for independent samples was conducted to evaluate the mean difference in the
Pearson Benchmark reading and language arts scores between sixth grade male and female
students. The Pearson Benchmark reading and language arts score was the test variable and the
grouping variable was gender. The t test was significant, t(270) = 2.29, p = .023. Therefore, the
null hypothesis was rejected. The effect size as measured by η2 was small (.02). In other words
only 2% of the variance in sixth graders’ Pearson Benchmark reading and language arts scores
was accounted for by gender. The mean Pearson Benchmark reading and language arts for sixth
grade females (M = 72.69, SD = 13.14) was 3.86 points higher than the mean for sixth grade
males (M = 68.83, SD = 14.48). The 95% confidence interval for the mean difference was .53 to
121133N =
Fifth Grade Reading
Gender
FemaleMale
Pears
on B
enchm
ark
Readin
g 120
100
80
60
40
20

117
7.18. The boxplots for the distribution of sixth graders’ Pearson Benchmark reading and
language arts scores by gender are shown in Figure 20.
Figure 20. Boxplots for Sixth Grade Pearson Benchmark Reading and Language Arts Scores by
Gender
Notes: ο = an observation between 1.5 times to 3.0 times the interquartile range
Research Question #6
Are there significant differences in the mean percentage correct scores on the Pearson
Benchmark assessment in math between male and female students for each grade? This research
question was addressed using the t test for independent samples. The following null hypotheses
were tested:
H061: There is not a significant difference on the Pearson Benchmark assessment in
math between male and female students in third grade.
125147N =
Sixth Grade Reading
Gender
FemaleMale
Pears
on B
enchm
ark
Readin
g 100
90
80
70
60
50
40
3020

118
A t test for independent samples was conducted to evaluate the mean difference in the
Pearson Benchmark math scores between third grade male and female students. The Pearson
Benchmark math score was the test variable and the grouping variable was gender. The t test
was not significant, t(289) = 1.56, p = .121. Therefore, the null hypothesis was retained. The
effect size as measured by η2 was small (.01). In other words only 1% of the variance in third
graders’ Pearson Benchmark math scores was accounted for by gender. The mean Pearson
Benchmark math for third grade males (M = 68.89, SD = 15.37) was 2.82 points higher than the
mean for third grade females (M = 66.07, SD = 15.50). The 95% confidence interval for the
mean difference was -.75 to 6.38. The boxplots for the distribution of third graders’ Pearson
Benchmark math scores by gender are shown in Figure 21.
Figure 21. Boxplots for Third Grade Pearson Benchmark Math Scores by Gender
Notes: ο = an observation between 1.5 times to 3.0 times the interquartile range
147144N =
Third Grade Math
Gender
FemaleMale
Pe
ars
on
Be
nch
ma
rk M
ath
120
100
80
60
40
20
0
119
H062: There is not a significant difference on the Pearson Benchmark assessment in
math between male and female students in fourth grade.
A t test for independent samples was conducted to evaluate the mean difference in the
Pearson Benchmark math scores between fourth grade male and female students. The Pearson
Benchmark math score was the test variable and the grouping variable was gender. The
Levene’s test for equality of variances showed that equal variances could not be assumed,
F(1,250) = 8.58, p = .004. Therefore, the t test that did not assume equal variances was used.
The t test was not significant, t(246) = -1.72, p = .085. Therefore, the null hypothesis was
retained. The effect size as measured by η2 was small (.01). In other words only 1% of the
variance in fourth graders’ Pearson Benchmark math scores was accounted for by gender. The
mean Pearson Benchmark math for fourth grade females (M = 72.23, SD = 14.55) was 3.54
points higher than the mean for fourth grade males (M = 68.69, SD = 17.81). The 95%
confidence interval for the mean difference was -7.59 to .51. The boxplots for the distribution of
fourth graders’ Pearson Benchmark math scores by gender are shown in Figure 22.

120
Figure 22. Boxplots for Fourth Grade Pearson Benchmark Math Scores by Gender
Notes: ο = an observation between 1.5 times to 3.0 times the interquartile range
H063: There is not a significant difference on the Pearson Benchmark assessment in
math between male and female students in fifth grade.
A t test for independent samples was conducted to evaluate the mean difference in the
Pearson Benchmark math scores between fifth grade male and female students. The Pearson
Benchmark math score was the test variable and the grouping variable was gender. The t test
was not significant, t(252) = .335, p = .738. Therefore, the null hypothesis was retained. The
effect size as measured by η2 was small (<.01). In other words less than 1% of the variance in
fifth graders’ Pearson Benchmark math scores was accounted for by gender. The mean Pearson
Benchmark math for fifth grade females (M = 70.32, SD = 14.32) was .65 points higher than the
mean for fifth grade males (M = 69.67, SD = 16.50). The 95% confidence interval for the mean
122130N =
Fourth Grade Math
Gender
FemaleMale
Pears
on B
enchm
ark
Math
120
100
80
60
40
20

121
difference was -3.18 to 4.49. The boxplots for the distribution of fifth graders’ Pearson
Benchmark math scores by gender are shown in Figure 23.
Figure 23. Boxplots for Fifth Grade Pearson Benchmark Math Scores by Gender
Notes: ο = an observation between 1.5 times to 3.0 times the interquartile range
H064: There is not a significant difference on the Pearson Benchmark assessment in
math between male and female students in sixth grade.
A t test for independent samples was conducted to evaluate the mean difference in the
Pearson Benchmark math scores between sixth grade male and female students. The Pearson
Benchmark math score was the test variable and the grouping variable was gender. The t test
was not significant, t(270) = -1.40, p = .136. Therefore, the null hypothesis was retained. The
effect size as measured by η2 was small (.01). In other words only 1% of the variance in sixth
121133N =
Fifth Grade Math
Gender
FemaleMale
Pears
on B
enchm
ark
Math
120
100
80
60
40
20
0
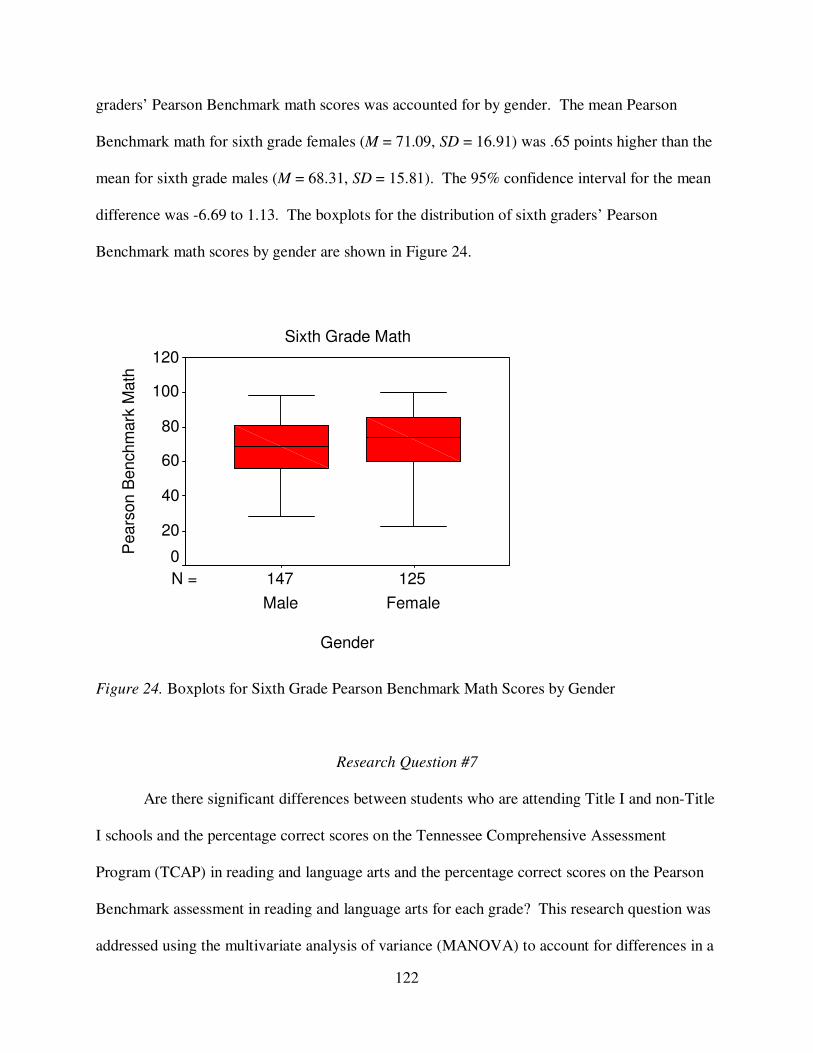
122
graders’ Pearson Benchmark math scores was accounted for by gender. The mean Pearson
Benchmark math for sixth grade females (M = 71.09, SD = 16.91) was .65 points higher than the
mean for sixth grade males (M = 68.31, SD = 15.81). The 95% confidence interval for the mean
difference was -6.69 to 1.13. The boxplots for the distribution of sixth graders’ Pearson
Benchmark math scores by gender are shown in Figure 24.
Figure 24. Boxplots for Sixth Grade Pearson Benchmark Math Scores by Gender
Research Question #7
Are there significant differences between students who are attending Title I and non-Title
I schools and the percentage correct scores on the Tennessee Comprehensive Assessment
Program (TCAP) in reading and language arts and the percentage correct scores on the Pearson
Benchmark assessment in reading and language arts for each grade? This research question was
addressed using the multivariate analysis of variance (MANOVA) to account for differences in a
125147N =
Sixth Grade Math
Gender
FemaleMale
Pears
on B
enchm
ark
Math
120
100
80
60
40
20
0
123
set of two dependent variables, percentage correct scores on the Tennessee Comprehensive
Assessment Program (TCAP) and the percentage correct scores on the Pearson Benchmark
assessment. The following null hypotheses were tested:
H071: There is no significant difference between third grade students who are attending
Title I and non-Title I schools and the percentage correct scores on the TCAP in
reading and language arts and the percentage correct scores on the Pearson
Benchmark assessment in reading and language arts.
A one-way multivariate analysis of variance test (MANOVA) was conducted to
determine if third grade students in Title I schools and non-Title I schools were different on two
types of reading and language arts tests, the TCAP and Pearson Benchmark. The MANOVA
showed there was a significant difference between students in Title I schools and non-Title I
schools on the two reading and language arts tests, Wilks’ Λ = .98, F(2, 288) = 3.43, p = .034, η2
= .02. Table 3 shows the means and standard deviations for third graders’ TCAP reading and
language arts and Pearson Benchmark reading and language arts by Title I status of the school.
Analyses of variances (ANOVA) were conducted on each reading and language arts test
as follow-up tests to the significant MANOVA. Each ANOVA was evaluated at the .025 level
(.05/2) using the Bonferroni method. The ANOVA for TCAP reading and language arts was not
significant, F(1, 289) = .19, p = .661, η2 = .001. The ANOVA for Pearson Benchmark reading
and language arts was not significant, F(1, 289) = 1.68, p = .197, η2 = .006.
As shown in Table 3, the means for Title I and non-Title I students were similar on both
reading and language arts tests. The effect size was small, p < .01. The results of this analysis
should be viewed with caution because the MANOVA yielded a significant finding; however,
both of the follow-up ANOVAs were found not to be significant. The boxplots for the
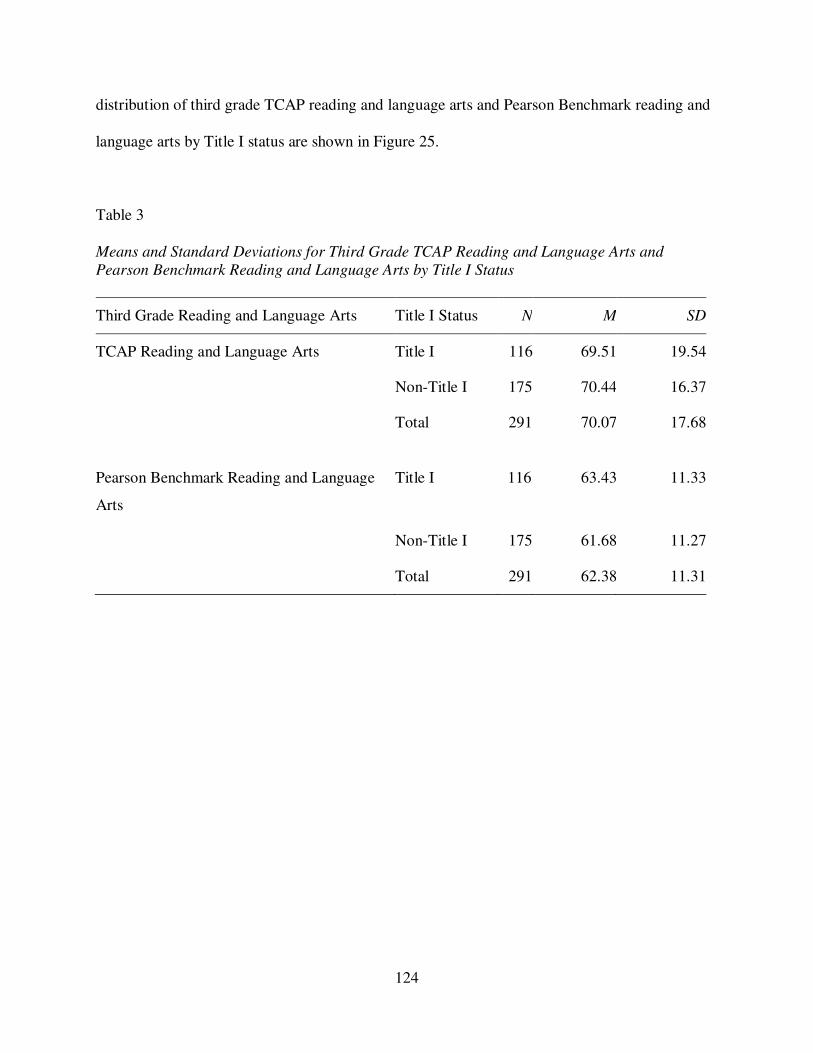
124
distribution of third grade TCAP reading and language arts and Pearson Benchmark reading and
language arts by Title I status are shown in Figure 25.
Table 3
Means and Standard Deviations for Third Grade TCAP Reading and Language Arts and
Pearson Benchmark Reading and Language Arts by Title I Status
Third Grade Reading and Language Arts Title I Status N M SD
TCAP Reading and Language Arts Title I 116 69.51 19.54
Non-Title I 175 70.44 16.37
Total 291 70.07 17.68
Pearson Benchmark Reading and Language
Arts
Title I 116 63.43 11.33
Non-Title I 175 61.68 11.27
Total 291 62.38 11.31
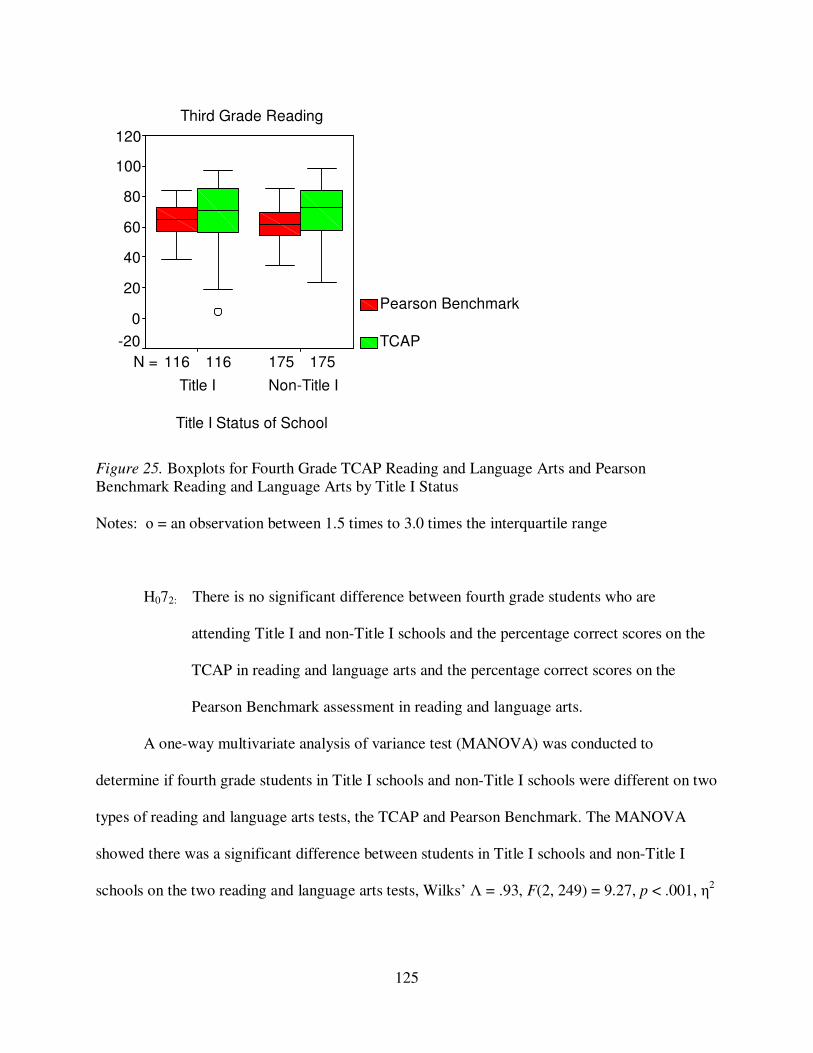
125
Figure 25. Boxplots for Fourth Grade TCAP Reading and Language Arts and Pearson
Benchmark Reading and Language Arts by Title I Status
Notes: ο = an observation between 1.5 times to 3.0 times the interquartile range
H072: There is no significant difference between fourth grade students who are
attending Title I and non-Title I schools and the percentage correct scores on the
TCAP in reading and language arts and the percentage correct scores on the
Pearson Benchmark assessment in reading and language arts.
A one-way multivariate analysis of variance test (MANOVA) was conducted to
determine if fourth grade students in Title I schools and non-Title I schools were different on two
types of reading and language arts tests, the TCAP and Pearson Benchmark. The MANOVA
showed there was a significant difference between students in Title I schools and non-Title I
schools on the two reading and language arts tests, Wilks’ Λ = .93, F(2, 249) = 9.27, p < .001, η2
175116 175116N =
Third Grade Reading
Title I Status of School
Non-Title ITitle I
120
100
80
60
40
20
0
-20
Pearson Benchmark
TCAP
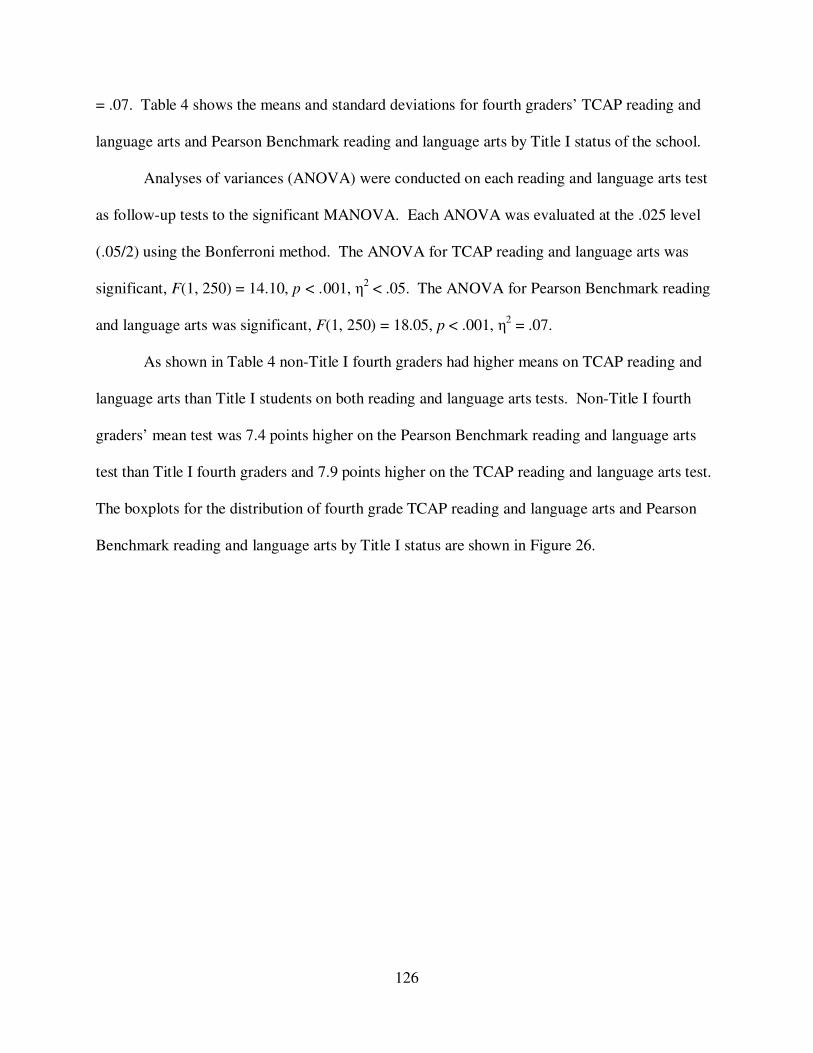
126
= .07. Table 4 shows the means and standard deviations for fourth graders’ TCAP reading and
language arts and Pearson Benchmark reading and language arts by Title I status of the school.
Analyses of variances (ANOVA) were conducted on each reading and language arts test
as follow-up tests to the significant MANOVA. Each ANOVA was evaluated at the .025 level
(.05/2) using the Bonferroni method. The ANOVA for TCAP reading and language arts was
significant, F(1, 250) = 14.10, p < .001, η2 < .05. The ANOVA for Pearson Benchmark reading
and language arts was significant, F(1, 250) = 18.05, p < .001, η2 = .07.
As shown in Table 4 non-Title I fourth graders had higher means on TCAP reading and
language arts than Title I students on both reading and language arts tests. Non-Title I fourth
graders’ mean test was 7.4 points higher on the Pearson Benchmark reading and language arts
test than Title I fourth graders and 7.9 points higher on the TCAP reading and language arts test.
The boxplots for the distribution of fourth grade TCAP reading and language arts and Pearson
Benchmark reading and language arts by Title I status are shown in Figure 26.
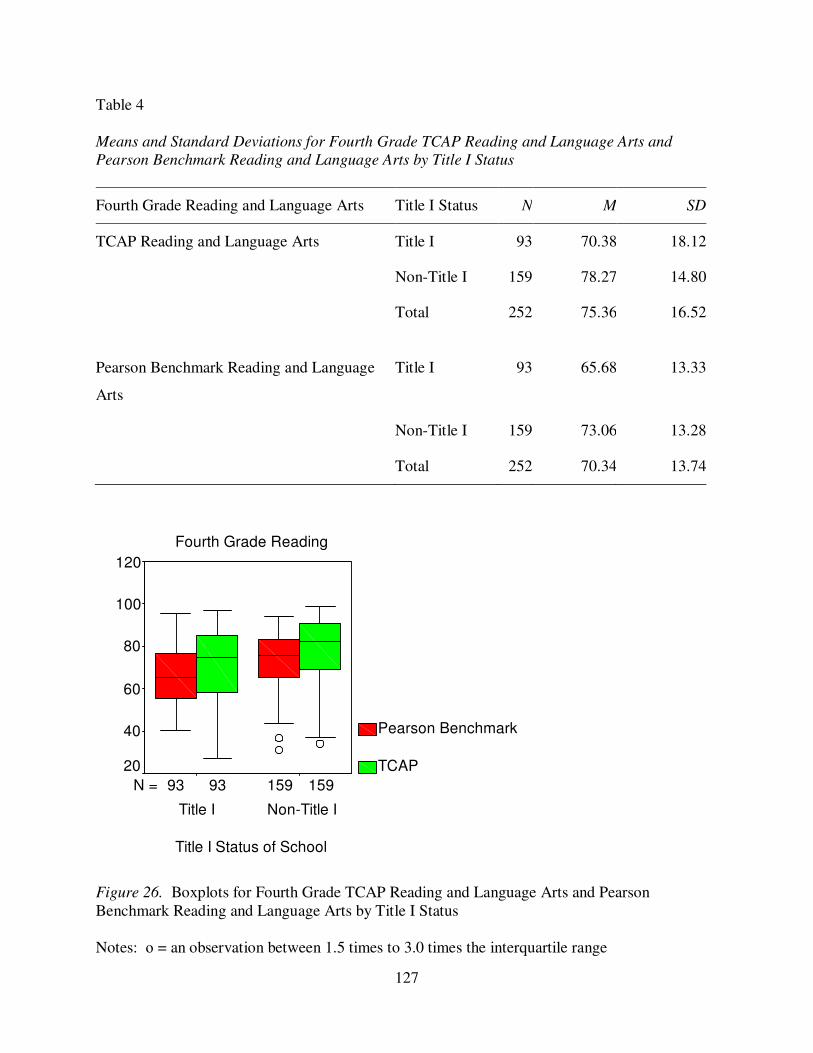
127
Table 4
Means and Standard Deviations for Fourth Grade TCAP Reading and Language Arts and
Pearson Benchmark Reading and Language Arts by Title I Status
Fourth Grade Reading and Language Arts Title I Status N M SD
TCAP Reading and Language Arts Title I 93 70.38 18.12
Non-Title I 159 78.27 14.80
Total 252 75.36 16.52
Pearson Benchmark Reading and Language
Arts
Title I 93 65.68 13.33
Non-Title I 159 73.06 13.28
Total 252 70.34 13.74
Figure 26. Boxplots for Fourth Grade TCAP Reading and Language Arts and Pearson
Benchmark Reading and Language Arts by Title I Status
Notes: ο = an observation between 1.5 times to 3.0 times the interquartile range
15993 15993N =
Fourth Grade Reading
Title I Status of School
Non-Title ITitle I
120
100
80
60
40
20
Pearson Benchmark
TCAP

128
H073: There is no significant difference between fifth grade students who are attending
Title I and non-Title I schools and the percentage correct scores on the TCAP in
reading and language arts and the percentage correct scores on the Pearson
Benchmark assessment in reading and language arts.
A one-way multivariate analysis of variance test (MANOVA) was conducted to
determine if fifth grade students in Title I schools and non-Title I schools were different on two
types of reading and language arts tests, the TCAP and Pearson Benchmark. The MANOVA
showed there was a significant difference between students in Title I schools and non-Title I
schools on the two reading and language arts tests, Wilks’ Λ = .89, F(2, 251) = 19.13, p < .001,
η2 = .13. Table 5 shows the means and standard deviations for fifth graders’ TCAP reading and
language arts and Pearson Benchmark reading and language arts by Title I status of the school.
Analyses of variances (ANOVA) were conducted on each reading and language arts test
as follow-up tests to the significant MANOVA. Each ANOVA was evaluated at the .025 level
(.05/2) using the Bonferroni method. The ANOVA for TCAP reading and language arts was
significant, F(1, 252) = 38.02, p < .001, η2 = .13. The ANOVA for Pearson Benchmark reading
and language arts was significant, F(1, 252) = 28.53, p < .001, η2 = .10.
As shown in Table 5 non-Title I fifth graders had higher means on TCAP reading and
language arts than Title I students on both reading and language arts tests. Non-Title I fifth
graders’ mean test was 8.9 points higher on the Pearson Benchmark reading and language arts
test than Title I fifth graders and 12.8 points higher on the TCAP reading and language arts test.
The boxplots for the distribution of fifth grade TCAP reading and language arts and Pearson
Benchmark reading and language arts by Title I status are shown in Figure 27.
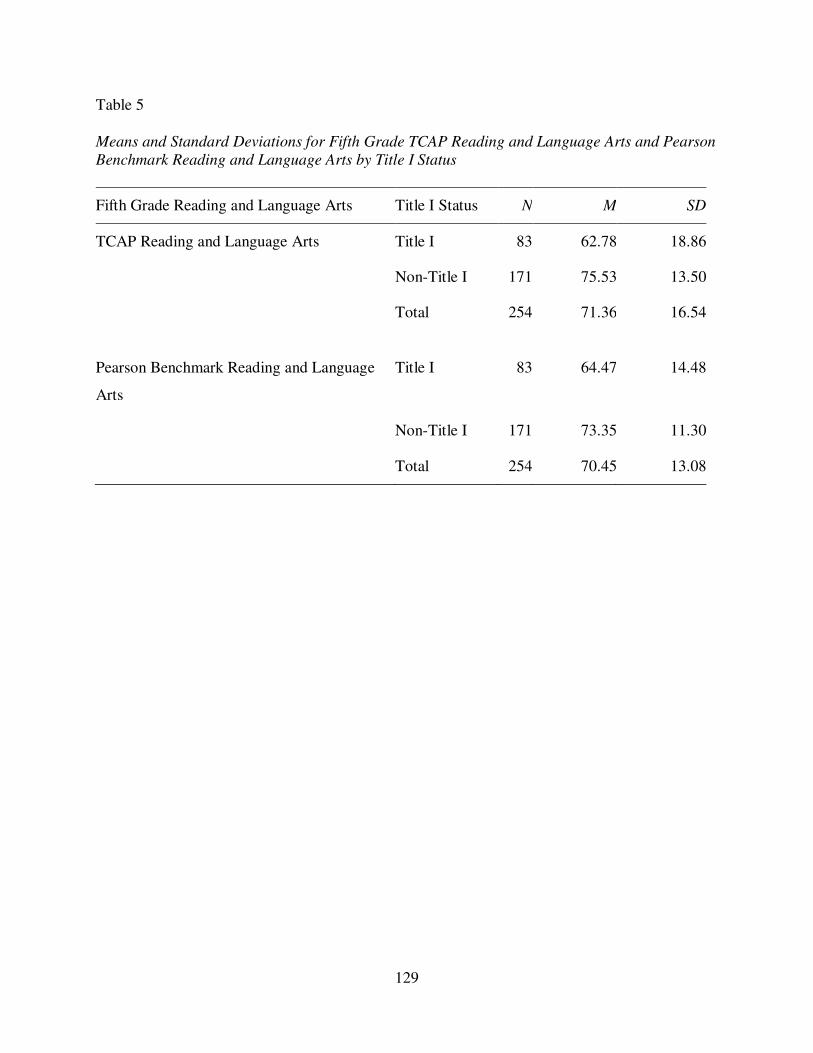
129
Table 5
Means and Standard Deviations for Fifth Grade TCAP Reading and Language Arts and Pearson
Benchmark Reading and Language Arts by Title I Status
Fifth Grade Reading and Language Arts Title I Status N M SD
TCAP Reading and Language Arts Title I 83 62.78 18.86
Non-Title I 171 75.53 13.50
Total 254 71.36 16.54
Pearson Benchmark Reading and Language
Arts
Title I 83 64.47 14.48
Non-Title I 171 73.35 11.30
Total 254 70.45 13.08

130
Figure 27. Boxplots for Fifth Grade TCAP Reading and Language Arts and Pearson Benchmark
Reading and Language Arts by Title I Status
Notes: ο = an observation between 1.5 times to 3.0 times the interquartile range
H074: There is no significant difference between sixth grade students who are attending
Title I and non-Title I schools and the percentage correct scores on the TCAP in
reading and language arts and the percentage correct scores on the Pearson
Benchmark assessment in reading and language arts.
A one-way multivariate analysis of variance test (MANOVA) was conducted to
determine if sixth grade students in Title I schools and non-Title I schools were different on two
types of reading and language arts tests, the TCAP and Pearson Benchmark. The MANOVA
showed there was a significant difference between students in Title I schools and non-Title I
schools on the two reading and language arts tests, Wilks’ Λ = .95, F(2, 269) = 6.44, p = .002, η2
17183 17183N =
Fifth Grade Reading
Title I Status of School
Non-Title ITitle I
120
100
80
60
40
20
0
Pearson Benchmark
TCAP

131
= .05. Table 6 shows the means and standard deviations for sixth graders’ TCAP reading and
language arts and Pearson Benchmark reading and language arts by Title I status of the school.
Analyses of variances (ANOVA) were conducted on each reading and language arts test
as follow-up tests to the significant MANOVA. Each ANOVA was evaluated at the .025 level
(.05/2) using the Bonferroni method. The ANOVA for TCAP reading and language arts was
significant, F(1, 270) = 12.79, p < .001, η2 = .05. The ANOVA for Pearson Benchmark reading
and language arts was significant, F (1, 270) = 7.48, p = .007, η2 = .03.
As shown in Table 6 non-Title I sixth graders had higher means on TCAP reading and
language arts than Title I students on both reading and language arts tests. Non-Title I sixth
graders’ mean test was 4.8 points higher on the Pearson Benchmark reading and language arts
test than Title I sixth graders and 7.6 points higher on the TCAP reading and language arts test.
The boxplots for the distribution of sixth grade TCAP reading and language arts and Pearson
Benchmark reading and language arts by Title I status are shown in Figure 28.
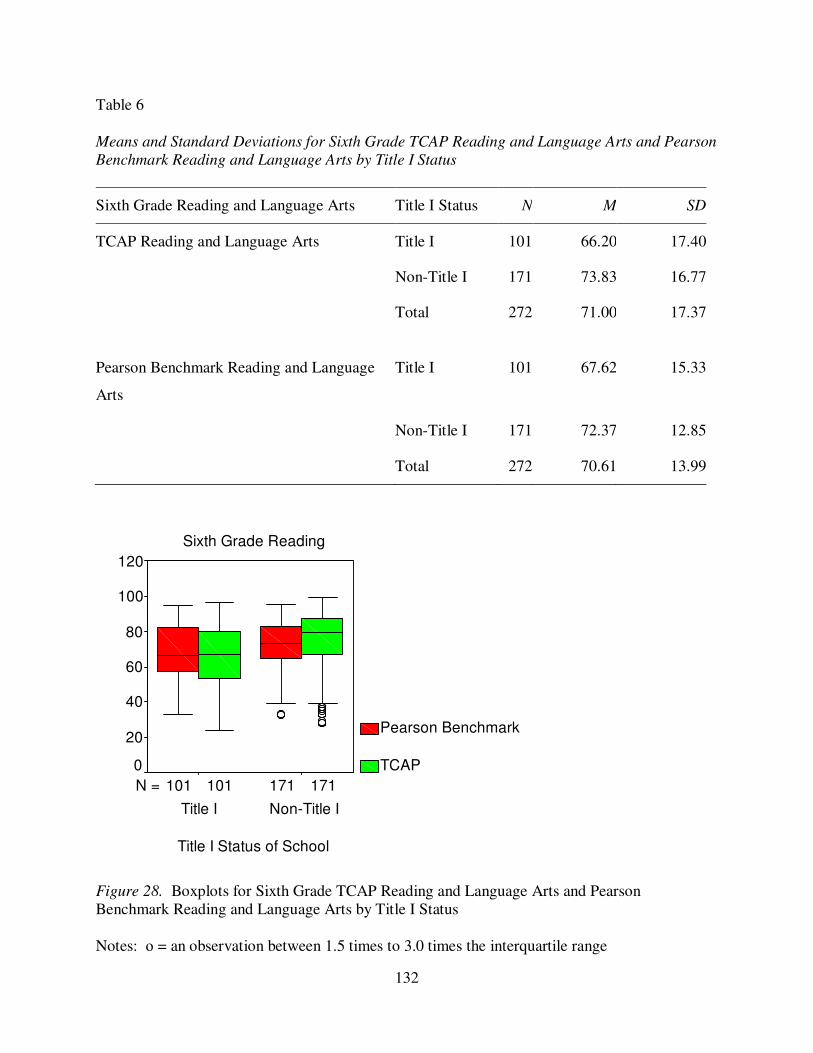
132
Table 6
Means and Standard Deviations for Sixth Grade TCAP Reading and Language Arts and Pearson
Benchmark Reading and Language Arts by Title I Status
Sixth Grade Reading and Language Arts Title I Status N M SD
TCAP Reading and Language Arts Title I 101 66.20 17.40
Non-Title I 171 73.83 16.77
Total 272 71.00 17.37
Pearson Benchmark Reading and Language
Arts
Title I 101 67.62 15.33
Non-Title I 171 72.37 12.85
Total 272 70.61 13.99
Figure 28. Boxplots for Sixth Grade TCAP Reading and Language Arts and Pearson
Benchmark Reading and Language Arts by Title I Status
Notes: ο = an observation between 1.5 times to 3.0 times the interquartile range
171101 171101N =
Sixth Grade Reading
Title I Status of School
Non-Title ITitle I
120
100
80
60
40
20
0
Pearson Benchmark
TCAP

133
Research Question #8
Are there significant differences between students who are attending Title I and non-Title
I schools and the percentage correct scores on the Tennessee Comprehensive Assessment
Program (TCAP) in math and the percentage correct scores on the Pearson Benchmark
assessment in math for each grade? This research question was addressed using the multivariate
analysis of variance (MANOVA) to account for differences in a set of two dependent variables,
percentage correct scores on the Tennessee Comprehensive Assessment Program (TCAP) and
the percentage correct scores on the Pearson Benchmark assessment. The following null
hypotheses were tested:
H081: There is no significant difference between third grade students who are attending
Title I and non-Title I schools and the percentage correct scores on the TCAP in
math and the percentage correct scores on the Pearson Benchmark assessment in
math.
A one-way multivariate analysis of variance test (MANOVA) was conducted to
determine if third grade students in Title I schools and non-Title I schools were different on two
types of math tests, the TCAP and Pearson Benchmark. The MANOVA showed there was not a
significant difference between students in Title I schools and non-Title I schools on the two math
tests, Wilks’ Λ = .99, F(2, 288) = .16, p = .85, η2 = .001. Table 7 shows the means and standard
deviations for third graders’ TCAP math and Pearson Benchmark math by Title I status of the
school.
As shown in Table 7, the means for Title I and non-Title I students were similar on both
math tests. The effect size was small, p < .01. The boxplots for the distribution of third grade
TCAP math and Pearson Benchmark math by Title I status are shown in Figure 29.

134
Table 7
Means and Standard Deviations for Third Grade TCAP Math and Pearson Benchmark Math by
Title I Status
Third Grade Math Title I Status N M SD
TCAP Math Title I 116 69.51 19.54
Non-Title I 175 70.44 16.37
Total 291 70.07 17.68
Pearson Benchmark Math Title I 116 66.84 17.12
Non-Title I 175 67.89 14.32
Total 291 67.47 15.47
Figure 29. Boxplots for Third Grade TCAP Math and Pearson Benchmark Math by Title I
Status
Notes: ο = an observation between 1.5 times to 3.0 times the interquartile range
175116 175116N =
Third Grade Math
Title I Status of School
Non-Title ITitle I
120
100
80
60
40
20
0
-20
Pearson Benchmark
TCAP

135
H082: There is no significant difference between fourth grade students who are attending
Title I and non-Title I schools and the percentage correct scores on the TCAP in
math and the percentage correct scores on the Pearson Benchmark assessment in
math.
A one-way multivariate analysis of variance test (MANOVA) was conducted to
determine if fourth grade students in Title I schools and non-Title I schools were different on two
types of math tests, the TCAP and Pearson Benchmark. The MANOVA showed there was a
significant difference between students in Title I schools and non-Title I schools on the two math
tests, Wilks’ Λ = .94, F(2, 249) = 8.46, p < .001, η2 = .06. Table 8 shows the means and standard
deviations for fourth graders’ TCAP math and Pearson Benchmark math by Title I status of the
school.
Analyses of variances (ANOVA) were conducted on each math test as follow-up tests to
the significant MANOVA. Each ANOVA was evaluated at the .025 level (.05/2) using the
Bonferroni method. The ANOVA for TCAP math was significant, F(1, 250) = 14.10, p < .001,
η2 = .05. The ANOVA for Pearson Benchmark math was significant, F(1, 250) = 14.39, p <
.001, η2 = .05.
As shown in Table 8 non-Title I fourth graders had higher means on TCAP math than
Title I students on both math tests. Non-Title I fourth graders’ mean test was 7.9 points higher
on the Pearson Benchmark math test than Title I fourth graders and 7.9 points higher on the
TCAP math test. The boxplots for the distribution of fourth grade TCAP math and Pearson
Benchmark math by Title I status are shown in Figure 30.

136
Table 8
Means and Standard Deviations for Fourth Grade TCAP Math and Pearson Benchmark Math by
Title I Status
Fourth Grade Math Title I Status N M SD
TCAP Math Title I 93 70.38 18.12
Non-Title I 159 78.27 14.80
Total 252 75.36 16.52
Pearson Benchmark Math Title I 93 65.42 17.61
Non-Title I 159 73.32 14.92
Total 252 70.41 16.38
Figure 30. Boxplots for Fourth Grade TCAP Math and Pearson Benchmark Math by Title I
Status
Notes: ο = an observation between 1.5 times to 3.0 times the interquartile range
15993 15993N =
Fourth Grade Math
Title I Status of School
Non-Title ITitle I
120
100
80
60
40
20
Pearson Benchmark
TCAP
137
H083: There is no significant difference between fifth grade students who are attending
Title I and non-Title I schools and the percentage correct scores on the TCAP in
math and the percentage correct scores on the Pearson Benchmark assessment in
math.
A one-way multivariate analysis of variance test (MANOVA) was conducted to
determine if fifth grade students in Title I schools and non-Title I schools were different on two
types of math tests, the TCAP and Pearson Benchmark. The MANOVA showed there was a
significant difference between students in Title I schools and non-Title I schools on the two math
tests, Wilks’ Λ = .84, F(2, 251) = 23.22, p < .001, η2 = .16. Table 9 shows the means and
standard deviations for fifth graders’ TCAP math and Pearson Benchmark math by Title I status
of the school.
Analyses of variances (ANOVA) were conducted on each math test as follow-up tests to
the significant MANOVA. Each ANOVA was evaluated at the .025 level (.05/2) using the
Bonferroni method. The ANOVA for TCAP math was significant, F(1, 252) = 38.02, p < .001,
η2 = .13. The ANOVA for Pearson Benchmark math was significant, F(1, 252) = 39.56, p <
.001, η2 = .17.
As shown in Table 9 non-Title I fifth graders had higher means on TCAP math than Title
I students on both math tests. Non-Title I fifth graders’ mean test was 12.1 points higher on the
Pearson Benchmark math test than Title I fifth graders and 12.8 points higher on the TCAP math
test. The boxplots for the distribution of fifth grade TCAP math and Pearson Benchmark math
by Title I status are shown in Figure 31.

138
Table 9
Means and Standard Deviations for Fifth Grade TCAP Math and Pearson Benchmark Math by
Title I Status
Fifth Grade Math Title I Status N M SD
TCAP Math Title I 83 62.78 18.86
Non-Title I 171 75.53 13.50
Total 254 71.36 16.54
Pearson Benchmark Math Title I 83 61.82 17.02
Non-Title I 171 73.94 12.97
Total 254 69.98 15.47
Figure 31. Boxplots for Fifth Grade TCAP Math and Pearson Benchmark Math by Title I Status
Notes: ο = an observation between 1.5 times to 3.0 times the interquartile range
17183 17183N =
Fifth Grade Math
Title I Status of School
Non-Title ITitle I
120
100
80
60
40
20
0
Pearson Benchmark
TCAP

139
H084: There is no significant difference between sixth grade students who are attending
Title I and non-Title I schools and the percentage correct scores on the TCAP in
math and the percentage correct scores on the Pearson Benchmark assessment in
math.
A one-way multivariate analysis of variance test (MANOVA) was conducted to
determine if sixth grade students in Title I schools and non-Title I schools were different on two
types of math tests, the TCAP and Pearson Benchmark. The MANOVA showed there was a
significant difference between students in Title I schools and non-Title I schools on the two math
tests, Wilks’ Λ = .90, F(2, 269) = 14.74, p < .001, η2 = .10. Table 10 shows the means and
standard deviations for sixth graders’ TCAP math and Pearson Benchmark math by Title I status
of the school.
Analyses of variances (ANOVA) were conducted on each math test as follow-up tests to
the significant MANOVA. Each ANOVA was evaluated at the .025 level (.05/2) using the
Bonferroni method. The ANOVA for TCAP math was significant, F(1, 270) = 12.79, p < .001,
η2 = .05. The ANOVA for Pearson Benchmark math was not significant, F(1, 270) = .21, p =
.651, η2 = .001.
As shown in Table 10 non-Title I sixth graders had higher means on TCAP math than
Title I students on both math tests. Non-Title I sixth graders’ mean test was .9 points lower on
the Pearson Benchmark math test than Title I sixth graders and 7.6 points higher on the TCAP
math test. The boxplots for the distribution of sixth grade TCAP math and Pearson Benchmark
math by Title I status are shown in Figure 32.

140
Table 10
Means and Standard Deviations for Sixth Grade TCAP Math and Pearson Benchmark Math by
Title I Status
Sixth Grade Math Title I Status N M SD
TCAP Math Title I 101 66.20 17.40
Non-Title I 171 73.83 16.77
Total 272 71.00 17.37
Pearson Benchmark Math Title I 101 70.17 15.95
Non-Title I 171 69.24 16.62
Total 272 69.59 16.35
Figure 32. Boxplots for Sixth Grade TCAP Math and Pearson Benchmark Math by Title I Status
Notes: ο = an observation between 1.5 times to 3.0 times the interquartile range
171101 171101N =
Sixth Grade Math
Title I Status of School
Non-Title ITitle I
120
100
80
60
40
20
0
Pearson Benchmark
TCAP

141
Research Question #9
Are there significant relationships between students’ socioeconomic status (as measured
by free and reduced-price meal benefits) and the percentage correct scores on the Tennessee
Comprehensive Assessment Program (TCAP) in reading and language arts and the percentage
correct scores on the Pearson Benchmark assessment in reading and language arts for each
grade? This research question was addressed using the multivariate analysis of variance
(MANOVA) to account for differences in a set of two dependent variables, percentage correct
scores on the Tennessee Comprehensive Assessment Program (TCAP) and the percentage
correct scores on the Pearson Benchmark assessment. The following null hypotheses were
tested:
H091: There is no significant relationship between third grade students who are receiving
free and reduced-price meal benefits and students who are not receiving free and
reduced-price meal benefits and the percentage correct scores on the TCAP in
reading and language arts and the percentage correct scores on the Pearson
Benchmark assessment in reading and language arts.
A one-way multivariate analysis of variance test (MANOVA) was conducted to
determine if third grade students who are receiving free and reduced-price meal benefits and
third grade students who are not receiving free and reduced-price meal benefits were different on
two types of reading and language arts tests, the TCAP and Pearson Benchmark. The MANOVA
showed there was a significant difference between students who are receiving free and reduced-
price meal benefits and students who are not receiving free and reduced-price meal benefits on
the two reading and language arts tests, Wilks’ Λ = .89, F(2, 288) = 17.84, p < .001, η2 = .11.
Table 11 shows the means and standard deviations for third graders’ TCAP reading and language

142
arts and Pearson Benchmark reading and language arts by socioeconomic status, as measured by
free and reduced-price meal benefits.
Analyses of variances (ANOVA) were conducted on each reading and language arts test
as follow-up tests to the significant MANOVA. Each ANOVA was evaluated at the .025 level
(.05/2) using the Bonferroni method. The ANOVA for TCAP reading and language arts was
significant, F(1, 289) = 35.48, p < .001, η2 = .11. The ANOVA for Pearson Benchmark reading
and language arts was significant, F(1, 289) = 16.97, p < .001, η2 = .06.
As shown in Table 11 third graders not receiving free and reduced-price meal benefits
had higher means on TCAP reading and language arts than third grade students receiving free
and reduced-price meal benefits on both reading and language arts tests. Third graders not
receiving free and reduced-price meal benefits had a mean test score that was 5.4 points higher
on the Pearson Benchmark reading and language arts test than third graders receiving free and
reduced-price meal benefits and 11.8 points higher on the TCAP reading and language arts test.
The boxplots for the distribution of third grade TCAP reading and language arts and Pearson
Benchmark reading and language arts by socioeconomic status are shown in Figure 33.

143
Table 11
Means and Standard Deviations for Third Grade TCAP Reading and Language Arts and
Pearson Benchmark Reading and Language Arts by Socioeconomic Status as Measured by Free
and Reduced-Price Meal Benefits
Third Grade Reading and Language Arts SES N M SD
TCAP Reading and Language Arts Meal Benefits 165 64.97 18.39
No Meal Benefits 126 76.75 14.21
Total 291 70.07 17.68
Pearson Benchmark Reading and Language
Arts
Meal Benefits 165 60.06 11.12
No Meal Benefits 126 65.42 10.86
Total 291 62.38 11.31
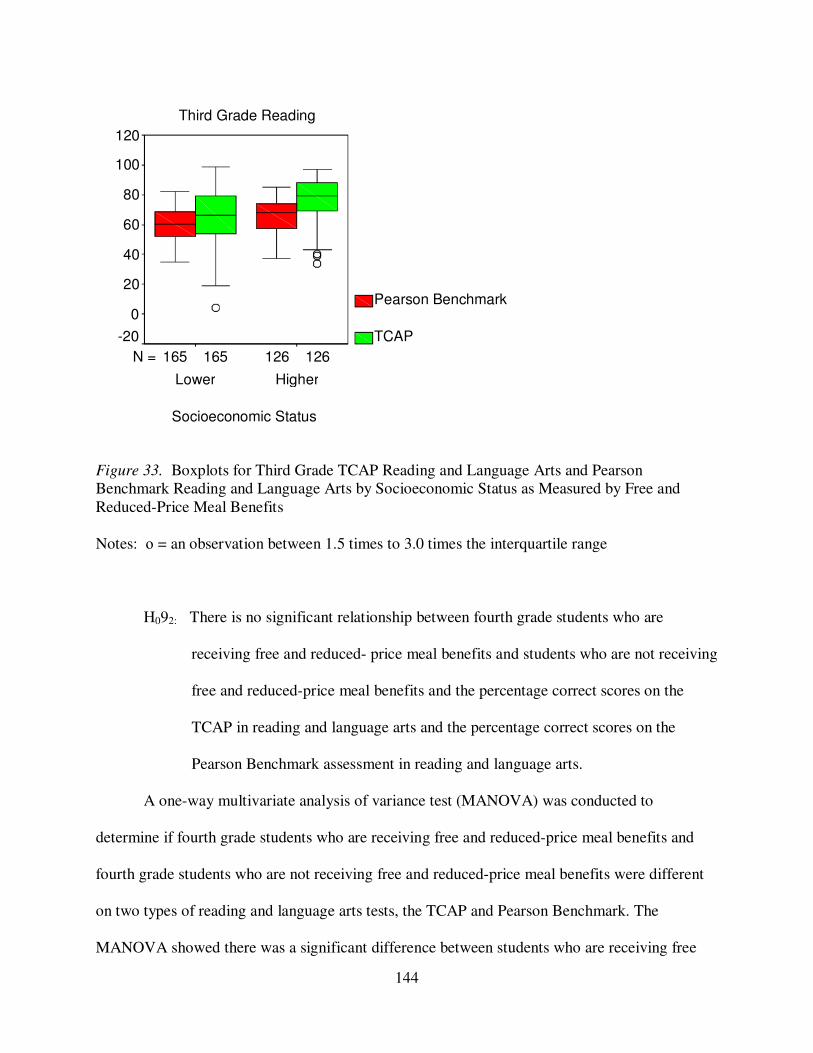
144
Figure 33. Boxplots for Third Grade TCAP Reading and Language Arts and Pearson
Benchmark Reading and Language Arts by Socioeconomic Status as Measured by Free and
Reduced-Price Meal Benefits
Notes: ο = an observation between 1.5 times to 3.0 times the interquartile range
H092: There is no significant relationship between fourth grade students who are
receiving free and reduced- price meal benefits and students who are not receiving
free and reduced-price meal benefits and the percentage correct scores on the
TCAP in reading and language arts and the percentage correct scores on the
Pearson Benchmark assessment in reading and language arts.
A one-way multivariate analysis of variance test (MANOVA) was conducted to
determine if fourth grade students who are receiving free and reduced-price meal benefits and
fourth grade students who are not receiving free and reduced-price meal benefits were different
on two types of reading and language arts tests, the TCAP and Pearson Benchmark. The
MANOVA showed there was a significant difference between students who are receiving free
126 165 126 165N =
Third Grade Reading
Socioeconomic Status
HigherLower
120
100
80
60
40
20
0
-20
Pearson Benchmark
TCAP

145
and reduced-price meal benefits and students who are not receiving free and reduced-price meal
benefits on the two reading and language arts tests, Wilks’ Λ = .85, F(2, 249) = 21.99, p < .001,
η2 = .15. Table 12 shows the means and standard deviations for fourth graders’ TCAP reading
and language arts and Pearson Benchmark reading and language arts by socioeconomic status, as
measured by free and reduced-price meal benefits.
Analyses of variances (ANOVA) were conducted on each reading and language arts test
as follow-up tests to the significant MANOVA. Each ANOVA was evaluated at the .025 level
(.05/2) using the Bonferroni method. The ANOVA for TCAP reading and language arts was
significant, F(1, 250) = 30.04, p < .001, η2 = .11. The ANOVA for Pearson Benchmark reading
and language arts was significant, F(1, 250) = 43.58, p < .001, η2 = .15.
As shown in Table 12 fourth graders not receiving free and reduced-price meal benefits
had higher means on TCAP reading and language arts than fourth grade students receiving free
and reduced-price meal benefits on both reading and language arts tests. Fourth graders not
receiving free and reduced-price meal benefits had a mean test score that was 10.6 points higher
on the Pearson Benchmark reading and language arts test than fourth graders receiving free and
reduced-price meal benefits and 10.81 points higher on the TCAP reading and language arts test.
The boxplots for the distribution of fourth grade TCAP reading and language arts and Pearson
Benchmark reading and language arts by socioeconomic status are shown in Figure 34.
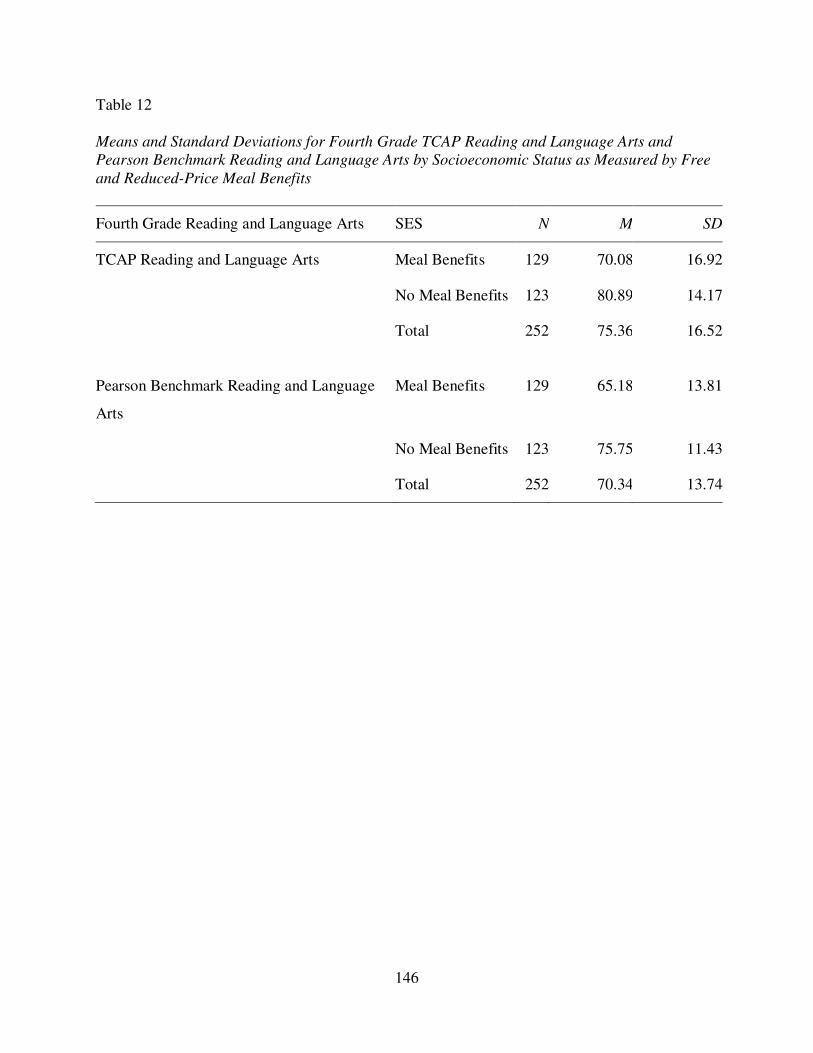
146
Table 12
Means and Standard Deviations for Fourth Grade TCAP Reading and Language Arts and
Pearson Benchmark Reading and Language Arts by Socioeconomic Status as Measured by Free
and Reduced-Price Meal Benefits
Fourth Grade Reading and Language Arts SES N M SD
TCAP Reading and Language Arts Meal Benefits 129 70.08 16.92
No Meal Benefits 123 80.89 14.17
Total 252 75.36 16.52
Pearson Benchmark Reading and Language
Arts
Meal Benefits 129 65.18 13.81
No Meal Benefits 123 75.75 11.43
Total 252 70.34 13.74
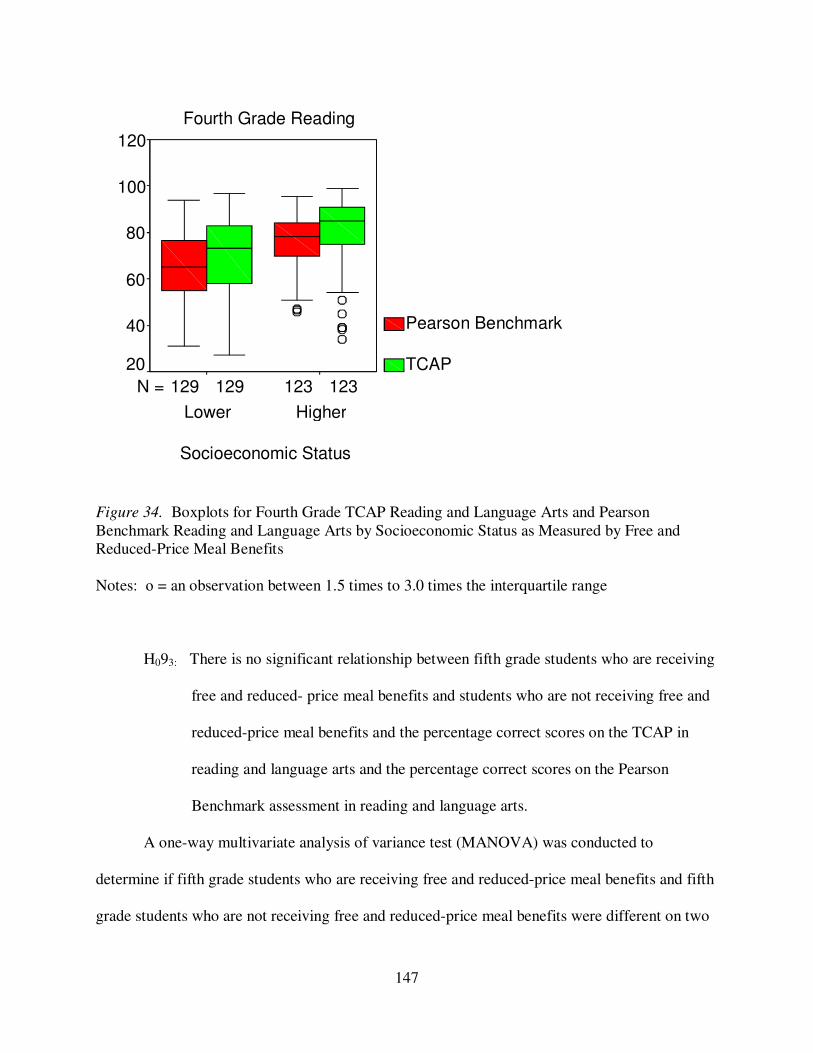
147
Figure 34. Boxplots for Fourth Grade TCAP Reading and Language Arts and Pearson
Benchmark Reading and Language Arts by Socioeconomic Status as Measured by Free and
Reduced-Price Meal Benefits
Notes: ο = an observation between 1.5 times to 3.0 times the interquartile range
H093: There is no significant relationship between fifth grade students who are receiving
free and reduced- price meal benefits and students who are not receiving free and
reduced-price meal benefits and the percentage correct scores on the TCAP in
reading and language arts and the percentage correct scores on the Pearson
Benchmark assessment in reading and language arts.
A one-way multivariate analysis of variance test (MANOVA) was conducted to
determine if fifth grade students who are receiving free and reduced-price meal benefits and fifth
grade students who are not receiving free and reduced-price meal benefits were different on two
123 129 123129N =
Fourth Grade Reading
Socioeconomic Status
HigherLower
120
100
80
60
40
20
Pearson Benchmark
TCAP

148
types of reading and language arts tests, the TCAP and Pearson Benchmark. The MANOVA
showed there was a significant difference between students who are receiving free and reduced-
price meal benefits and students who are not receiving free and reduced-price meal benefits on
the two reading and language arts tests, Wilks’ Λ = .87, F(2, 251) = 18.45, p < .001, η2 = .13.
Table 13 shows the means and standard deviations for fifth graders’ TCAP reading and language
arts and Pearson Benchmark reading and language arts by socioeconomic status, as measured by
free and reduced-price meal benefits.
Analyses of variances (ANOVA) were conducted on each reading and language arts test
as follow-up tests to the significant MANOVA. Each ANOVA was evaluated at the .025 level
(.05/2) using the Bonferroni method. The ANOVA for TCAP reading and language arts was
significant, F(1, 252) = 34.60, p < .001, η2 = .12. The ANOVA for Pearson Benchmark reading
and language arts was significant, F(1, 252) = 32.06, p < .001, η2 = .11.
As shown in Table 13 fifth graders not receiving free and reduced-price meal benefits had
higher means on TCAP reading and language arts than fifth grade students receiving free and
reduced-price meal benefits on both reading and language arts tests. Fifth graders not receiving
free and reduced-price meal benefits had a mean test score that was 8.7 points higher on the
Pearson Benchmark reading and language arts test than fifth graders receiving free and reduced-
price meal benefits and 11.5 points higher on the TCAP reading and language arts test. The
boxplots for the distribution of fifth grade TCAP reading and language arts and Pearson
Benchmark reading and language arts by socioeconomic status are shown in Figure 35.

149
Table 13
Means and Standard Deviations for Fifth Grade TCAP Reading and Language Arts and Pearson
Benchmark Reading and Language Arts by Socioeconomic Status as Measured by Free and
Reduced-Price Meal Benefits
Fifth Grade Reading and Language Arts SES N M SD
TCAP Reading and Language Arts Meal Benefits 128 65.67 18.20
No Meal Benefits 126 77.14 12.26
Total 254 71.36 16.54
Pearson Benchmark Reading and Language
Arts
Meal Benefits 128 66.10 13.62
No Meal Benefits 126 74.80 10.91
Total 254 70.45 13.08

150
Figure 35. Boxplots for Fifth Grade TCAP Reading and Language Arts and Pearson Benchmark
Reading and Language Arts by Socioeconomic Status as Measured by Free and Reduced-Price
Meal Benefits
Notes: ο = an observation between 1.5 times to 3.0 times the interquartile range
H094: There is no significant relationship between sixth grade students who are
receiving free and reduced- price meal benefits and students who are not receiving
free and reduced-price meal benefits and the percentage correct scores on the
TCAP in reading and language arts and the percentage correct scores on the
Pearson Benchmark assessment in reading and language arts.
A one-way multivariate analysis of variance test (MANOVA) was conducted to
determine if sixth grade students who are receiving free and reduced-price meal benefits and
sixth grade students who are not receiving free and reduced-price meal benefits were different on
two types of reading and language arts tests, the TCAP and Pearson Benchmark. The MANOVA
126128 126 128N =
Fifth Grade Reading
Socioeconomic Status
HigherLower
120
100
80
60
40
20
0
Pearson Benchmark
TCAP

151
showed there was a significant difference between students who are receiving free and reduced-
price meal benefits and students who are not receiving free and reduced-price meal benefits on
the two reading and language arts tests, Wilks’ Λ = .87, F(2, 269) = 19.73, p < .001, η2 = .13.
Table 14 shows the means and standard deviations for sixth graders’ TCAP reading and language
arts and Pearson Benchmark reading and language arts by socioeconomic status, as measured by
free and reduced-price meal benefits.
Analyses of variances (ANOVA) were conducted on each reading and language arts test
as follow-up tests to the significant MANOVA. Each ANOVA was evaluated at the .025 level
(.05/2) using the Bonferroni method. The ANOVA for TCAP reading and language arts was
significant, F(1, 270) = 38.43, p < .001, η2 = .13. The ANOVA for Pearson Benchmark reading
and language arts was significant, F(1, 270) = 24.31, p < .001, η2 = .08.
As shown in Table 14 sixth graders not receiving free and reduced-price meal benefits
had higher means on TCAP reading and language arts than sixth grade students receiving free
and reduced-price meal benefits on both reading and language arts tests. Sixth graders not
receiving free and reduced-price meal benefits had a mean test score that was 8.0 points higher
on the Pearson Benchmark reading and language arts test than sixth graders receiving free and
reduced-price meal benefits and 12.2 points higher on the TCAP reading and language arts test.
The boxplots for the distribution of sixth grade TCAP reading and language arts and Pearson
Benchmark reading and language arts by socioeconomic status are shown in Figure 36.
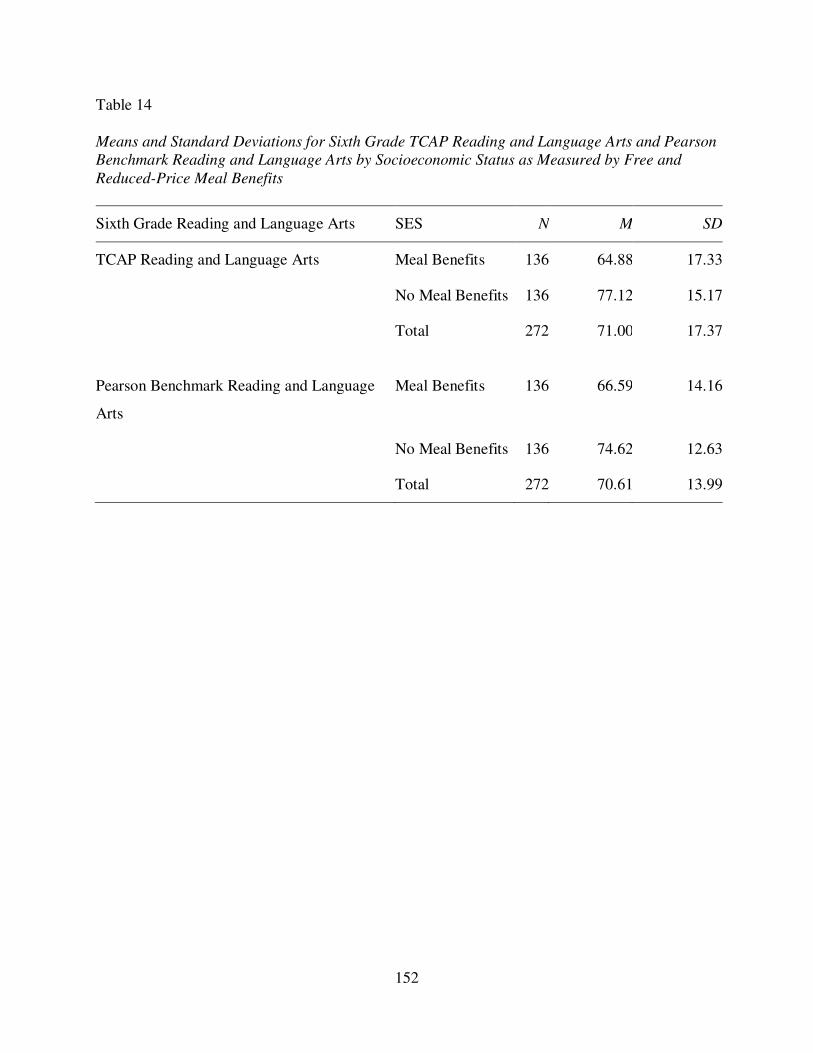
152
Table 14
Means and Standard Deviations for Sixth Grade TCAP Reading and Language Arts and Pearson
Benchmark Reading and Language Arts by Socioeconomic Status as Measured by Free and
Reduced-Price Meal Benefits
Sixth Grade Reading and Language Arts SES N M SD
TCAP Reading and Language Arts Meal Benefits 136 64.88 17.33
No Meal Benefits 136 77.12 15.17
Total 272 71.00 17.37
Pearson Benchmark Reading and Language
Arts
Meal Benefits 136 66.59 14.16
No Meal Benefits 136 74.62 12.63
Total 272 70.61 13.99

153
Figure 36. Boxplots for Sixth Grade TCAP Reading and Language Arts and Pearson
Benchmark Reading and Language Arts by Socioeconomic Status as Measured by Free and
Reduced-Price Meal Benefits
Notes: ο = an observation between 1.5 times to 3.0 times the interquartile range
Research Question #10
Are there significant relationships between students’ socioeconomic status (as measured
by free and reduced-price meal benefits) and the percentage correct scores on the Tennessee
Comprehensive Assessment Program (TCAP) in math and the percentage correct scores on the
Pearson Benchmark assessment in math? This research question was addressed using the
multivariate analysis of variance (MANOVA) to account for differences in a set of two
dependent variables, percentage correct scores on the Tennessee Comprehensive Assessment
Program (TCAP) and the percentage correct scores on the Pearson Benchmark assessment. The
following null hypotheses were tested:
136 136 136136 N =
Sixth Grade Reading
Socioeconomic Status
HigherLower
120
100
80
60
40
20
0
Pearson Benchmark
TCAP
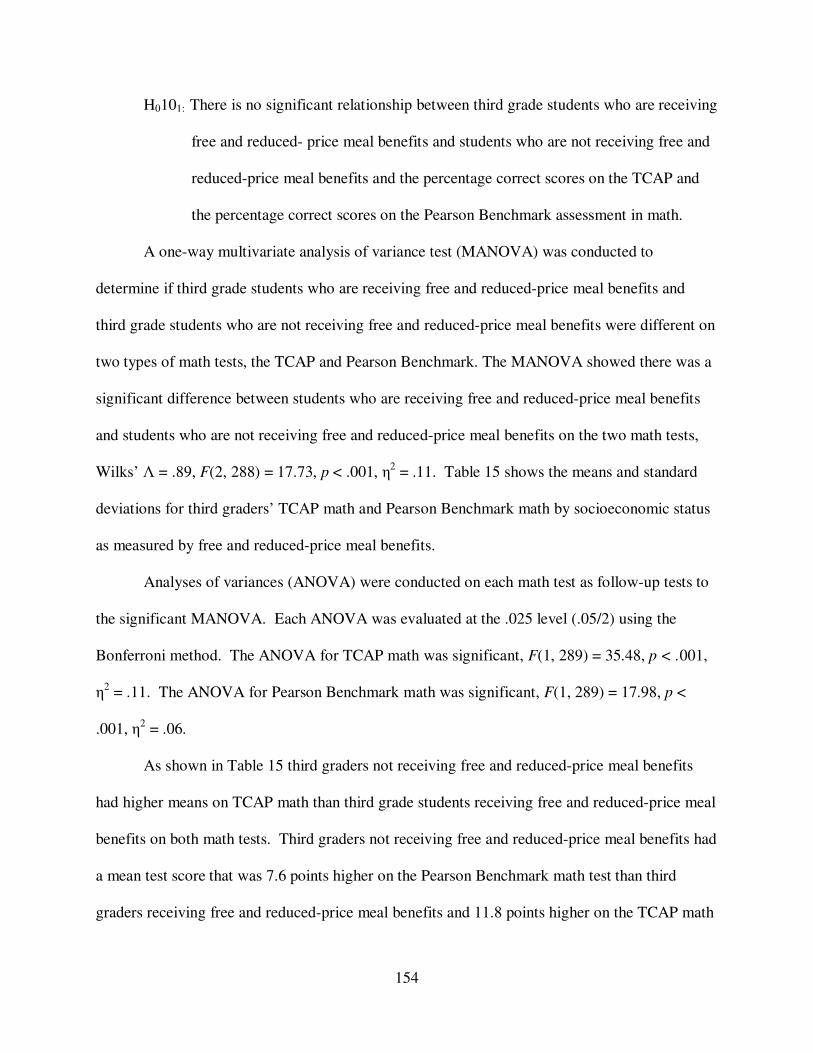
154
H0101: There is no significant relationship between third grade students who are receiving
free and reduced- price meal benefits and students who are not receiving free and
reduced-price meal benefits and the percentage correct scores on the TCAP and
the percentage correct scores on the Pearson Benchmark assessment in math.
A one-way multivariate analysis of variance test (MANOVA) was conducted to
determine if third grade students who are receiving free and reduced-price meal benefits and
third grade students who are not receiving free and reduced-price meal benefits were different on
two types of math tests, the TCAP and Pearson Benchmark. The MANOVA showed there was a
significant difference between students who are receiving free and reduced-price meal benefits
and students who are not receiving free and reduced-price meal benefits on the two math tests,
Wilks’ Λ = .89, F(2, 288) = 17.73, p < .001, η2 = .11. Table 15 shows the means and standard
deviations for third graders’ TCAP math and Pearson Benchmark math by socioeconomic status
as measured by free and reduced-price meal benefits.
Analyses of variances (ANOVA) were conducted on each math test as follow-up tests to
the significant MANOVA. Each ANOVA was evaluated at the .025 level (.05/2) using the
Bonferroni method. The ANOVA for TCAP math was significant, F(1, 289) = 35.48, p < .001,
η2 = .11. The ANOVA for Pearson Benchmark math was significant, F(1, 289) = 17.98, p <
.001, η2 = .06.
As shown in Table 15 third graders not receiving free and reduced-price meal benefits
had higher means on TCAP math than third grade students receiving free and reduced-price meal
benefits on both math tests. Third graders not receiving free and reduced-price meal benefits had
a mean test score that was 7.6 points higher on the Pearson Benchmark math test than third
graders receiving free and reduced-price meal benefits and 11.8 points higher on the TCAP math

155
test. The boxplots for the distribution of third grade TCAP math and Pearson Benchmark math
by socioeconomic status are shown in Figure 37.
Table 15
Means and Standard Deviations for Third Grade TCAP Math and Pearson Benchmark Math by
Socioeconomic Status as Measured by Free and Reduced-Price Meal Benefits
Third Grade Math SES N M SD
TCAP Math Meal Benefits 165 64.97 18.39
No Meal Benefits 126 76.75 14.21
Total 291 70.07 17.68
Pearson Benchmark Math Meal Benefits 165 64.20 15.95
No Meal Benefits 126 71.75 13.75
Total 291 67.47 15.47

156
Figure 37. Boxplots for Third Grade TCAP Math and Pearson Benchmark Math by
Socioeconomic Status as Measured by Free and Reduced-Price Meal Benefits
Notes: ο = an observation between 1.5 times to 3.0 times the interquartile range
H0102: There is no significant relationship between fourth grade students who are
receiving free and reduced- price meal benefits and students who are not receiving
free and reduced-price meal benefits and the percentage correct scores on the
TCAP and the percentage correct scores on the Pearson Benchmark assessment in
math.
A one-way multivariate analysis of variance test (MANOVA) was conducted to
determine if fourth grade students who are receiving free and reduced-price meal benefits and
fourth grade students who are not receiving free and reduced-price meal benefits were different
on two types of math tests, the TCAP and Pearson Benchmark. The MANOVA showed there
was a significant difference between students who are receiving free and reduced-price meal
126 165 126 165N =
Third Grade Math
Socioeconomic Status
Higher Lower
120
100
80
60
40
20
0
-20
Pearson Benchmark
TCAP

157
benefits and students who are not receiving free and reduced-price meal benefits on the two math
tests, Wilks’ Λ = .88, F(2, 249) = 17.07, p < .001, η2 = .12. Table 16 shows the means and
standard deviations for fourth graders’ TCAP math and Pearson Benchmark math by
socioeconomic status, as measured by free and reduced-price meal benefits.
Analyses of variances (ANOVA) were conducted on each math test as follow-up tests to
the significant MANOVA. Each ANOVA was evaluated at the .025 level (.05/2) using the
Bonferroni method. The ANOVA for TCAP math was significant, F(1, 250) = 30.04, p < .001,
η2 = .11. The ANOVA for Pearson Benchmark math was significant, F(1, 250) = 26.64, p <
.001, η2 = .10.
As shown in Table 16 fourth graders not receiving free and reduced-price meal benefits
had higher means on TCAP math than fourth grade students receiving free and reduced-price
meal benefits on both math tests. Fourth graders not receiving free and reduced-price meal
benefits had a mean test score that was 10.2 points higher on the Pearson Benchmark math test
than fourth graders receiving free and reduced-price meal benefits and 10.8 points higher on the
TCAP math test. The boxplots for the distribution of fourth grade TCAP math and Pearson
Benchmark math by socioeconomic status are shown in Figure 38.

158
Table 16
Means and Standard Deviations for Fourth Grade TCAP Math and Pearson Benchmark Math by
Socioeconomic Status as Measured by Free and Reduced-Price Meal Benefits
Fourth Grade Math SES N M SD
TCAP Math Meal Benefits 129 70.09 16.92
No Meal Benefits 123 80.89 14.17
Total 252 75.36 16.52
Pearson Benchmark Math Meal Benefits 129 65.45 15.70
No Meal Benefits 123 75.60 15.50
Total 252 70.41 16.38
Figure 38. Boxplots for Fourth Grade TCAP Math and Pearson Benchmark Math by
Socioeconomic Status as Measured by Free and Reduced-Price Meal Benefits
Notes: ο = an observation between 1.5 times to 3.0 times the interquartile range
123129 123129 N =
Fourth Grade Math
Socioeconomic Status
HigherLower
120
100
80
60
40
20
Pearson Benchmark
TCAP

159
H0103: There is no significant relationship between fifth grade students who are receiving
free and reduced-price meal benefits and students who are not receiving free and
reduced-price meal benefits and the percentage correct scores on the TCAP and
the percentage correct scores on the Pearson Benchmark assessment in math.
A one-way multivariate analysis of variance test (MANOVA) was conducted to
determine if fifth grade students who are receiving free and reduced-price meal benefits and fifth
grade students who are not receiving free and reduced-price meal benefits were different on two
types of math tests, the TCAP and Pearson Benchmark. The MANOVA showed there was a
significant difference between students who are receiving free and reduced-price meal benefits
and students who are not receiving free and reduced-price meal benefits on the two math tests,
Wilks’ Λ = .87, F(2, 251) = 19.08, p < .001, η2 = .13. Table 17 shows the means and standard
deviations for fifth graders’ TCAP math and Pearson Benchmark math by socioeconomic status,
as measured by free and reduced-price meal benefits.
Analyses of variances (ANOVA) were conducted on each math test as follow-up tests to
the significant MANOVA. Each ANOVA was evaluated at the .025 level (.05/2) using the
Bonferroni method. The ANOVA for TCAP math was significant, F(1, 252) = 34.60, p < .001,
η2 = .12. The ANOVA for Pearson Benchmark math was significant, F(1, 252) = 28.98, p <
.001, η2 = .10.
As shown in Table 17 fifth graders not receiving free and reduced-price meal benefits had
higher means on TCAP math than fifth grade students receiving free and reduced-price meal
benefits on both math tests. Fifth graders not receiving free and reduced-price meal benefits had
a mean test score that was 9.9 points higher on the Pearson Benchmark math test than fifth

160
graders receiving free and reduced-price meal benefits and 11.5 points higher on the TCAP math
test. The boxplots for the distribution of fifth grade TCAP math and Pearson Benchmark math
by socioeconomic status are shown in Figure 39.
Table 17
Means and Standard Deviations for Fifth Grade TCAP Math and Pearson Benchmark Math by
Socioeconomic Status as Measured by Free and Reduced-Price Meal Benefits
Fifth Grade Math SES N M SD
TCAP Math Meal Benefits 128 65.67 18.20
No Meal Benefits 126 77.14 12.26
Total 254 71.36 16.54
Pearson Benchmark Math Meal Benefits 128 65.06 16.40
No Meal Benefits 126 74.98 12.70
Total 254 69.98 15.47
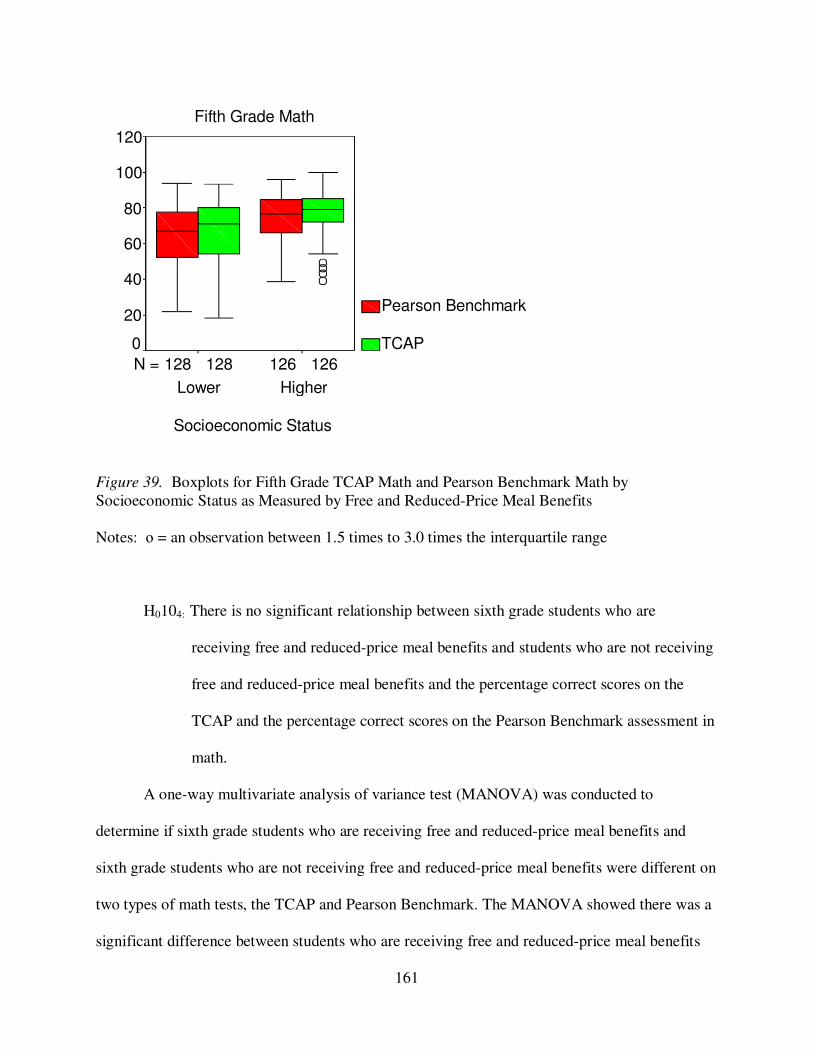
161
Figure 39. Boxplots for Fifth Grade TCAP Math and Pearson Benchmark Math by
Socioeconomic Status as Measured by Free and Reduced-Price Meal Benefits
Notes: ο = an observation between 1.5 times to 3.0 times the interquartile range
H0104: There is no significant relationship between sixth grade students who are
receiving free and reduced-price meal benefits and students who are not receiving
free and reduced-price meal benefits and the percentage correct scores on the
TCAP and the percentage correct scores on the Pearson Benchmark assessment in
math.
A one-way multivariate analysis of variance test (MANOVA) was conducted to
determine if sixth grade students who are receiving free and reduced-price meal benefits and
sixth grade students who are not receiving free and reduced-price meal benefits were different on
two types of math tests, the TCAP and Pearson Benchmark. The MANOVA showed there was a
significant difference between students who are receiving free and reduced-price meal benefits
126 128 126128 N =
Fifth Grade Math
Socioeconomic Status
HigherLower
120
100
80
60
40
20
0
Pearson Benchmark
TCAP

162
and students who are not receiving free and reduced-price meal benefits on the two math tests,
Wilks’ Λ = .87, F(2, 269) = 19.48, p < .001, η2 = .13. Table 18 shows the means and standard
deviations for sixth graders’ TCAP math and Pearson Benchmark math by socioeconomic status,
as measured by free and reduced-price meal benefits.
Analyses of variances (ANOVA) were conducted on each math test as follow-up tests to
the significant MANOVA. Each ANOVA was evaluated at the .025 level (.05/2) using the
Bonferroni method. The ANOVA for TCAP math was significant, F(1, 270) = 38.43, p < .001,
η2 = .13. The ANOVA for Pearson Benchmark math was significant, F(1, 270) = 21.28, p <
.001, η2 = .07.
As shown in Table 18 sixth graders not receiving free and reduced-price meal benefits
had higher means on TCAP math than sixth grade students receiving free and reduced-price meal
benefits on both math tests. Sixth graders not receiving free and reduced-price meal benefits had
a mean test score that was 8.8 points higher on the Pearson Benchmark math test than sixth
graders receiving free and reduced-price meal benefits and 12.2 points higher on the TCAP math
test. The boxplots for the distribution of sixth grade TCAP math and Pearson Benchmark math
by socioeconomic status are shown in Figure 40.
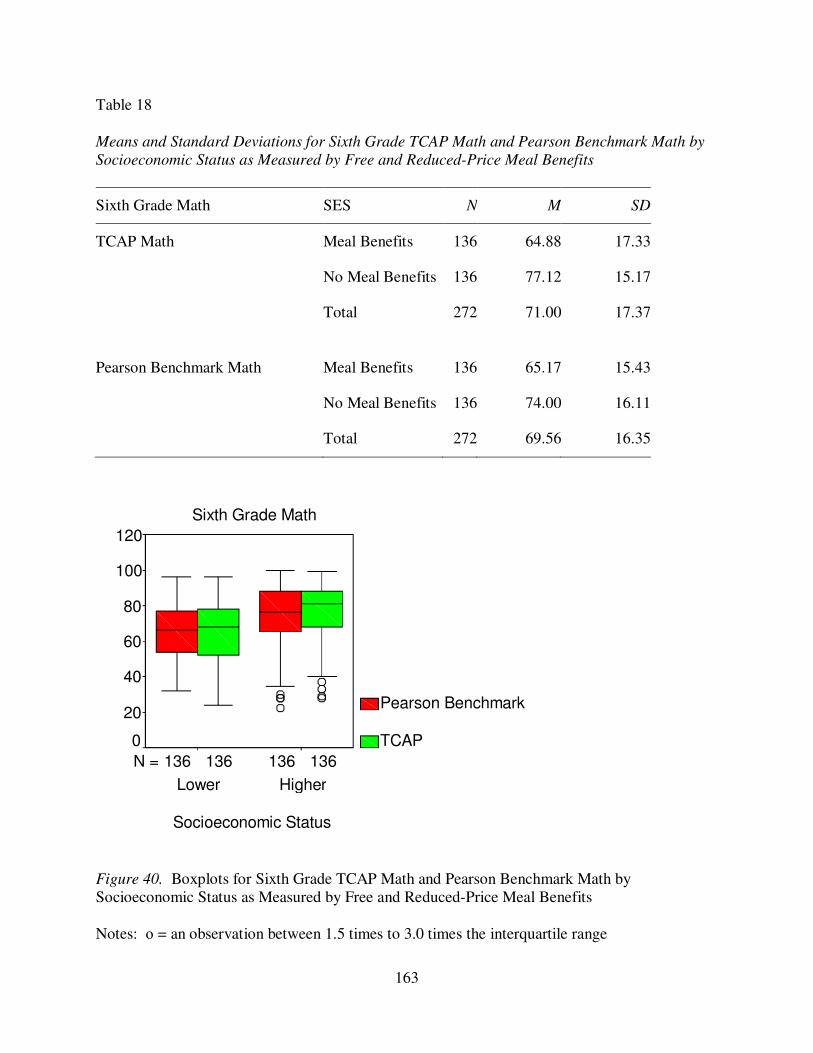
163
Table 18
Means and Standard Deviations for Sixth Grade TCAP Math and Pearson Benchmark Math by
Socioeconomic Status as Measured by Free and Reduced-Price Meal Benefits
Sixth Grade Math SES N M SD
TCAP Math Meal Benefits 136 64.88 17.33
No Meal Benefits 136 77.12 15.17
Total 272 71.00 17.37
Pearson Benchmark Math Meal Benefits 136 65.17 15.43
No Meal Benefits 136 74.00 16.11
Total 272 69.56 16.35
Figure 40. Boxplots for Sixth Grade TCAP Math and Pearson Benchmark Math by
Socioeconomic Status as Measured by Free and Reduced-Price Meal Benefits
Notes: ο = an observation between 1.5 times to 3.0 times the interquartile range
136136 136 136 N =
Sixth Grade Math
Socioeconomic Status
HigherLower
120
100
80
60
40
20
0
Pearson Benchmark
TCAP
164
CHAPTER 5
SUMMARY OF FINDINGS, CONCLUSIONS, AND RECOMMENDATIONS
Introduction
The purpose of this study was to determine if there is a relationship between the TCAP
test and Pearson Benchmark assessment in elementary students’ reading and language arts and
math performance in a northeastern Tennessee school district. This study indicated third, fourth,
fifth, and sixth grade students in the content areas of reading and language arts and math who
had taken the fall, spring, and winter Pearson Benchmark assessments during the 2011-2012
school year and the TCAP test in the spring of the 2012 school year. The study focused on the
following subgroups: gender, Title I school status, and socioeconomic status as determined by
free and reduced-price meal benefits.
Summary of Findings
The analysis focused on 10 research questions. The data collection tools included the
TCAP, a criterion-referenced, paper and pencil test that is completed by third, fourth, fifth, and
sixth grade students and the Pearson Benchmark assessment, a criterion-referenced, paper and
pencil test. The population included 291 third grade students, 252 fourth grade students, 254
fifth grade students, and 272 sixth grade students. A total of 1,069 students were included in this
study. This study included all students in the district in Grades 3, 4, 5, and 6 who had taken all
of the Pearson Benchmark assessments (fall, winter, and spring) during 2011-2012 academic
school year as well as the TCAP in the spring of the 2012 academic school year. The Pearson
Benchmark assessments were administered during a 2-week testing window in the fall, winter,
and spring and the TCAP was administered during April of 2012. Due to student absences

165
and/or student transiency, some students did not have test scores for all four assessments in each
subject area, reading and language arts and math. Demographic information of the population
included gender, Title I school status, and socioeconomic status as determined by free and
reduced-price meal benefits.
Data collected for this study were entered into an Excel data file for analysis using IBM-
SPSS. The research questions were examined using the Pearson Product-moment Correlation
Coefficients, the t test for independent samples, and the multivariate analysis of variance
(MANOVA) to account for differences in a set of two dependent variables. These tests were
conducted to examine the relationship of the TCAP scores in reading and language arts and math
and Pearson Benchmark assessment scores in reading and language arts and math for third,
fourth, fifth, and sixth grade students. The objective was to examine the relationship between the
TCAP test and the Pearson Benchmark assessment. The criterion for establishing the statistical
significance was set at an alpha level of .05.
Research Question #1
Are there significant relationships between the percentage correct scores on the
Tennessee Comprehensive Assessment Program (TCAP) in reading and language arts and the
percentage correct scores on the Pearson Benchmark assessment in reading and language arts for
students in grade 3, grade 4, grade 5, and grade 6?
Pearson Product-moment Correlation statistics were used to analyze the relationship
between TCAP and Pearson Benchmark percentage correct scores in reading and language arts
for third grade, fourth grade, fifth grade, and sixth grade. The results indicate a strong to very
strong positive relationship between the percentage correct scores for both assessments. All
166
correlations were significant at the .001 level and all null hypotheses were rejected. The
relationships ranged from a low of .70 in sixth grade to a high of .83 in fifth grade. The strongest
relationship was found among fifth graders.
Research Question #2
Are there significant relationships between the percentage correct scores on the
Tennessee Comprehensive Assessment Program (TCAP) in math and the percentage correct
scores on the Pearson Benchmark assessment in math for students in grade 3, grade 4, grade 5,
and grade 6?
Pearson Product-moment Correlation statistics were used to analyze the relationship
between TCAP and Pearson Benchmark percentage correct scores in math for third grade, fourth
grade, fifth grade, and sixth grade. The results indicate a strong to very strong positive
relationship between the percentage correct scores for both assessments. All correlations were
significant at the .001 level and all null hypotheses were rejected. The relationships ranged from
a low of .79 in third grade to a high of .86 in sixth grade. The strongest relationship was found
among sixth graders.
Research Question #3
Are there significant differences in the mean percentage correct scores on the Tennessee
Comprehensive Assessment Program (TCAP) in reading and language arts between male and
female students for each grade?
A t test for independent samples was conducted to evaluate the mean difference in TCAP
reading and language arts scores between male and female students in the third grade, fourth

167
grade, fifth grade, and sixth grade. The difference in percentage correct scores was significant
for fourth grade male and female students and sixth grade male and female students. Gender
accounted for 3% of the variance in scores for fourth graders; the mean percentage correct score
on TCAP reading and language arts test for fourth grade females was higher than the mean
percentage correct score for fourth grade males. Gender also accounted for 4% of the variance in
scores for sixth graders; the mean percentage correct score on TCAP reading and language arts
test for sixth grade females was higher than the mean percentage correct score for sixth grade
males.
Research Question #4
Are there significant differences in the mean percentage correct scores on the Tennessee
Comprehensive Assessment Program (TCAP) in math between male and female students for
each grade?
A t test for independent samples was conducted to evaluate the mean difference in TCAP
math scores between male and female students in the third grade, fourth grade, fifth grade, and
sixth grade. The difference in percentage correct scores was not significant at any grade level;
gender accounted for less than 1% of the variance in scores at each grade level and all null
hypotheses were retained.
Research Question #5
Are there significant differences in the mean percentage correct scores on the Pearson
Benchmark assessment in reading and language arts between male and female students for each
grade?
168
A t test for independent samples was conducted to evaluate the mean difference in
Pearson Benchmark reading and language arts scores between male and female students in the
third grade, fourth grade, fifth grade, and sixth grade. The difference in percentage correct
scores was significant for fourth grade male and female students as well as sixth grade male and
female students. Gender accounted for 3% of the variance in scores for fourth graders; the mean
percentage correct score on the Pearson Benchmark assessment in reading and language arts for
fourth grade females was higher than the mean percentage correct score for fourth grade males.
Gender also accounted for 2% of the variance in scores for sixth graders; the mean percentage
correct score on the Pearson Benchmark assessment in reading and language arts for sixth grade
females was higher than the mean percentage correct score for sixth grade males.
Research Question #6
Are there significant differences in the mean percentage correct scores on the Pearson
Benchmark assessment in math between male and female students for each grade?
A t test for independent samples was conducted to evaluate the mean difference in
Pearson Benchmark math scores between male and female students in the third grade, fourth
grade, fifth grade, and sixth grade. The difference in percentage correct scores was not
significant at any grade level; gender accounted for less than 1% of the variance in scores at each
grade level and all null hypotheses were retained.
Research Question #7
Are there significant differences between students who are attending Title I and non-Title
I schools and the percentage correct scores on the Tennessee Comprehensive Assessment

169
Program (TCAP) in reading and language arts and the percentage correct scores on the Pearson
Benchmark assessment in reading and language arts for each grade?
A one-way multivariate analysis of variance test (MANOVA) was used to determine if
third grade, fourth grade, fifth grade, and sixth grade students in Title I schools and non-Title I
schools were different on two types of reading and language arts tests, the TCAP and Pearson
Benchmark. The MANOVA showed that there was a significant difference between Title I and
non-Title I students at all grade levels. The follow-up analysis of variance (ANOVA) tests for
TCAP reading and language arts and Pearson Benchmark reading and language arts were
significant for fourth, fifth, and sixth grade students. Non-Title I students had higher mean
percentage correct scores on both the TCAP test and Pearson Benchmark assessment in reading
and language arts at the fourth, fifth, and sixth grades. The follow-up ANOVA tests for TCAP
reading and language arts and Pearson Benchmark reading and language arts were not significant
for third grade students; therefore, the results of the third grade analysis should be viewed with
caution as the MANOVA yielded a significant finding but the follow-up ANOVAs were not
found to be significant.
Research Question #8
Are there significant differences between students who are attending Title I and non-Title
I schools and the percentage correct scores on the Tennessee Comprehensive Assessment
Program (TCAP) in math and the percentage correct scores on the Pearson Benchmark
assessment in math for each grade?
A one-way multivariate analysis of variance test (MANOVA) was used to determine if third
grade, fourth grade, fifth grade, and sixth grade students in Title I schools and non-Title I schools
170
were different on two types of math tests, the TCAP and Pearson Benchmark. The MANOVA
showed that there was a significant difference between Title I and non-Title I students in fourth
grade, fifth grade, and sixth grade. The follow-up analysis of variance (ANOVA) tests for TCAP
math and Pearson Benchmark math were significant for fourth and fifth grade students; non-Title
I students had higher mean percentage correct scores on both math assessments for fourth and
fifth grades. The follow-up ANOVA test for sixth grade students’ TCAP math test was
significant; non-Title I students had higher mean percentage correct scores. The follow-up
ANOVA for sixth grade students’ Pearson Benchmark math test was not significant.
Research Question #9
Are there significant relationships between students’ socioeconomic status (as measured
by free and reduced-price meal benefits) and the percentage correct scores on the Tennessee
Comprehensive Assessment Program (TCAP) in reading and language arts and the percentage
correct scores on the Pearson Benchmark assessment in reading and language arts for each
grade?
A one-way multivariate analysis of variance test (MANOVA) was conducted to
determine if students who are receiving free and reduced-price meal benefits and students who
are not receiving free and reduced-price meal benefits were different on two types of reading and
language arts tests, the TCAP and Pearson Benchmark. The MANOVA showed there was a
significant difference between third, fourth, fifth, and sixth students who are receiving free and
reduced-price meal benefits and students who are not receiving free and reduced-price meal
benefits. The follow-up analysis of variance (ANOVA) tests for TCAP reading and language
arts and Pearson Benchmark reading and language arts were significant for all grade levels.
171
Students not receiving free and reduced-price meal benefits had higher mean percentage correct
scores on both the TCAP test and Pearson Benchmark assessment in reading and language arts at
all grade levels.
Research Question #10
Are there significant relationships between students’ socioeconomic status (as measured
by free and reduced-price meal benefits) and the percentage correct scores on the Tennessee
Comprehensive Assessment Program (TCAP) in math and the percentage correct scores on the
Pearson Benchmark assessment in math for each grade?
A one-way multivariate analysis of variance test (MANOVA) was conducted to
determine if students who are receiving free and reduced-price meal benefits and students who
are not receiving free and reduced-price meal benefits were different on two types of math tests,
the TCAP and Pearson Benchmark. The MANOVA showed there was a significant difference
between third, fourth, fifth, and sixth students who are receiving free and reduced-price meal
benefits and students who are not receiving free and reduced-price meal benefits. The follow-up
analysis of variance (ANOVA) tests for TCAP math and Pearson Benchmark math were
significant for all grade levels. Students not receiving free and reduced-price meal benefits had
higher mean percentage correct scores on both the TCAPtest and Pearson Benchmark assessment
in math at all grade levels.

172
Conclusions
The following conclusions emerged from this study:
Conclusion #1
Based on the findings in this study, there appears to be a strong to very strong positive
relationship between the TCAP and Pearson Benchmark percentage correct scores in reading and
language arts and math for students in the third, fourth, fifth, and sixth grade.
Conclusion #2
Based on the findings in this study, it appears that there is not a significant difference in
the TCAP and Pearson Benchmark mean percentage correct math scores for male and female
students in the third, fourth, fifth, and sixth grade.
Conclusion #3
Based on the findings in this study, it appears that there is a significant difference in the
TCAP and Pearson Benchmark mean percentage correct reading and language arts scores for
male and female students in the fourth grade and sixth grade. Fourth and sixth grade females had
higher mean percentage correct scores than fourth and sixth grade males.
Conclusion #4
Based on the findings in this study, there appears to be a significant difference between
fourth, fifth, and sixth grade students who are attending Title I and non-Title I schools and the
percentage correct scores on the TCAP test and Pearson Benchmark assessment in reading and
language arts and math. Fourth, fifth, and sixth grade students attending non-Title I schools had

173
higher percentage correct scores on the TCAP test and Pearson Benchmark assessment in
reading and language arts. Fourth and fifth grade students attending non-Title I schools had
higher percentage correct scores on the TCAP test and Pearson Benchmark assessment in math.
Sixth grade students attending non-Title I schools had higher percentage correct scores on the
TCAP test in math.
Conclusion #5
Based on the findings in this study, there appears to be a significant difference between
third, fourth, fifth, and sixth grade students’ socioeconomic status (as measured by free and
reduced-price meal benefits) and the percentage correct scores on the TCAP test and Pearson
Benchmark assessment in reading and language arts and math. Students not receiving free and
reduced-price meal benefits had higher mean percentage correct scores on both the TCAP test
and Pearson Benchmark assessment in reading and language arts and math.
Concluding Summary
Based on the analyses and findings of this study, there appears to be a positive
relationship between the TCAP test and Pearson Benchmark assessment in elementary students’
reading and language arts and math performance in a northeastern Tennessee school district.
This relationship extended across students’ gender, Title I school status, and socioeconomic
status as determined by free and reduced-price meal benefits. As a result benchmark assessments
should be considered for use to enhance the teaching and learning cycle in order to improve
instruction prior to high-stakes, summative, standardized tests. Moreover, if benchmark
assessments can provide sufficient information regarding student learning and achievement of

174
the mandated curriculum, these formative benchmark assessments could eventually replace high-
stakes, summative, standardized tests.
Recommendations for Practice
In an era marked by educational accountability school effectiveness dedicated to
improving students’ academic achievement is paramount. And in an era currently pronounced
by political goals aimed at educational reform, excellence in education is most often equated to
good standardized test scores (Spring, 2006; Webb 2006; Zhao, 2009). Further, the educational
climate of the early 21st Century has been stamped by the political demand for accountability of
student learning as measured by test scores. Therefore, benchmark assessments are being used
as a tool to measure student progress in an ongoing, formative fashion in order to improve
performance on standards- and test-based accountability measures. Benchmark assessments are
considered formative assessments, as assessments for learning. Their purpose is to provide
interim feedback to teachers about students’ progress toward meeting standards that are
measured and assessed on high-stakes summative state tests (Burke, 2010; Popham, 2008). In a
corresponding manner, formative assessment supports benchmarking, the process of comparing
learning outcomes goals to selected standards for the purpose of overall improvement of student
learning and achievement (Greenstein, 2010). Consequently, the following are recommendations
for practice.
School districts should strongly consider using formative assessment benchmark tools,
such as Pearson Benchmark, as one potential measure to generate timely data aimed at the
improvement of student learning and achievement (Greenstein, 2010). Concurrently, school
districts should evaluate the resources used to accommodate benchmark testing processes to
175
determine overall effectiveness. Specifically, schools should track the time spent on benchmark
testing and carefully evaluate whether this is the optimal use of student academic time.
Additionally, school districts should analyze the use of formative assessment and the
relationship to teacher growth and development. Educators should receive training on multiple
measures of formative assessment as opposed to formative assessment benchmark tools alone.
Instructional leadership in the classroom should also focus on informal formative assessment
practices that provide data directed at assessing and advancing students throughout the daily
instructional process. Further formative assessment measures should be evaluated to ensure that
they take into consideration individual differences in cultural and ethnic backgrounds, learning
rates and styles, and other crucial factors in the lives of students (Armstrong, 2006).
Finally, in an era of accountability with heightened emphasis on test scores, school
districts should consider the development of the whole child as opposed to strictly focusing on
quantitative academic measures to define student success. Becoming a whole human being is
one of the most important aspects of learning and evaluating such growth is a meaningful,
ongoing, and qualitative process (Armstrong, 2006). Commensurate with this recommendation
for practice federal and state educational evaluation policymakers should consider the
advantages suggested by the results of this study of substituting high-quality formative
assessments in lieu of high-stakes, standardized, summative assessments.
Recommendations for Further Research
In order to augment the growing body of research about formative benchmark assessment
practices aimed at improved student achievement, the following are recommendations for further
research:

176
1. A replication of this study should be used in another school district within the state of
Tennessee that is more reflective of the state’s demographic population.
2. A replication of this study should be conducted using a larger population and
generating an analysis of more than 1 year of data.
3. A qualitative research approach should be used to examine students’, teachers’,
parents’, and administrators’ perceptions of the Pearson Benchmark Assessment and
its relationship to the Tennessee Comprehensive Assessment Program (TCAP).
4. A research study should be implemented that examines how districts and schools
have used benchmark student achievement data to inform instructional practice(s).
5. A research study should be employed to examine how formative benchmark
assessment data are used to influence daily classroom instructional practices.
6. This study was limited to students in grades three, four, five, and six; therefore, a
study should be implemented that examines middle school and high school students
to increase the generalizability of the population.
7. This study was limited to the content areas of reading and language arts and
mathematics; therefore, a study should be conducted that includes science and social
studies to reflect the overall curriculum.
8. A study should be conducted to examine the relationship of computer-based
benchmark assessments and computer-based state testing assessments. This could be
implemented during the 2014-2015 academic school year as the state of Tennessee
transitions from the paper-pencil Tennessee Comprehensive Assessment Program
(TCAP) to the computer-based Partnership for the Assessment of College and Career
Readiness Assessment (PARCC).

177
9. A comparative study should be implemented to examine multiple benchmark
assessments tools and determine their strengths and weaknesses.
10. A mixed-methods study should be conducted to examine the relationship between
teacher perceptions of students’ academic achievement based on informal formative
assessment and data collected through formal benchmark assessments.
11. A study should be employed to determine if benchmark assessment data affects
student performance outcomes on state achievement tests.
12. A comparative study should be conducted to examine states and districts using only
high-quality formative assessments to measure student achievement and states and
districts using high-stakes, standardized, summative assessments to measure student
achievement. Both assessment strategies could be compared and analyzed using
results from the National Assessment of Educational Progress (NAEP).
Summary
In the modern educational climate marked by accountability for student learning
accountability is derived by test scores. Therefore, benchmark assessments are being used as a
tool to improve student performance on these critical academic test measures. Benchmark
assessments, as formative assessments for learning, can assist educators as they attempt to
compare learning outcomes and goals to chosen standards with the intent of improving student
achievement. However, it would also behoove educators to consider their responsibility to
students as they travel along the tricky path toward improvement for the sake of accountability.
Glover (2012) imparts:
The problem with school accountability is that teachers are defined as workers. But,
teachers must be more than accountable workers. Teachers must, like parents, also be
178
responsible agents. For teachers to function successfully, they must have authority that
extends beyond the areas of accountability. Good teachers have the knowledge, skills,
and wisdom to develop unique human beings. They know the present state will change
and that they are responsible for enabling their students to be able to successfully adapt
and contribute to what might come. (para. 8)
179
REFERENCES
Ansary, T. (2007). Education at risk: Fallout from a flawed report. Edutopia. Retrieved
November 26, 2013 from http://www.edutopia.org/landmark-education-report-nation-risk
Armstrong, T. (2006). The best schools: How human development research should inform
educational practice. Alexandria, VA: Association for Curriculum and Development.
Bakula, N. (2010). The benefits of formative assessments for teaching and learning. Sci Scope,
34(1), 37-43.
Berliner, D., & Biddle, B. (1995). The manufactured crisis: Myths, frauds, and attacks on
America’s public schools. Reading, MA: Addison Wesley.
Berry, K.S., & Herrington, C.D. (2011). States and their struggles with NCLB: Does the Obama
blueprint get it right? Peabody Journal of Education, 86, 272-290.
doi:10.1080/0161956X.2011.578982
Black, P., Harrison, C., Lee, C., Marshall, B., & Wiliam, D. (2004). Working inside the black
box: Assessment for learning in the classroom. Phi Delta Kappan, 86(1), 9-21.
Black, P., & Wiliam, D. (1998a). Assessment and classroom learning. Assessment in Education:
Principles, Policy and Practice, 5(1), 7-73.
Black, P., & Wiliam, D. (1998b). Inside the black box: Raising standards through classroom
assessment. Phi Delta Kappan, 80(2), 139-149.
Bloom, B.S. (1969). Some theoretical issues relating to educational evaluation. In R.W. Taylor
(Ed.), Educational evaluation: New roles, new means: The 68th
yearbook of the National
Society for the Study of Education, Part II (pp. 26-50). Chicago: University of Chicago
Press.
Bloom, B.S. (1977). Favorable learning conditions for all. Teacher, 95(3), 22-28.
Bloom, B.S., Hastings, J.T., & Madaus, G.F. (Eds.). (1971). Handbook on formative and
summative evaluation of student learning. New York, NY: McGraw-Hill.
Brown vs. Board of Education, 347 U.S. 463 (1954).
Brown, R.S., & Coughlin, E. (2007). The predictive validity of selected benchmark assessments
use in the Mid-Atlantic Region. Retrieved September 20, 2012 from:
http://www.mhkids.com/media/articles/pdfs/resources/PredictiveValidity.pdf
Burke, K. (2010). Balanced assessment: From formative to summative. Bloomington, IN:
Solution Tree Press.
Carnoy, M., & Loeb, S. (2002). Does external accountability affect student outcomes? A cross
state analysis. Educational Evaluation and Policy Analysis, 24(4), 305-331.

180
Center for Public Education. (2006). A guide to the no child left behind act. Retrieved September
20, 2012 from:
http://www.centerforpubliceducation.org/Main-Menu/Policies/A-guide-to-the-No-Child-
Left-Behind-Act-
Chappuis, S., & Chappuis, J. (2007/2008). The best value in formative assessment. Educational
Leadership, 65(4), 14-18.
Chappuis, S., & Stiggens, R. (2002). Classroom assessment for learning. Educational
Leadership, 60(1), 40-43.
Clark, I. (2010). Formative assessments: ‘There is nothing so good as practical theory.’
Australian Journal of Education, 54(3), 341-352.
Coffey, H. (n.d.). Benchmark assessments. Chapel Hill, NC: Learn NC, The University of North
Carolina at Chapel Hill. Retrieved February 18, 2012 from:
http://www.learnnc.org/lp/pages/5317?style=print
Creswell, J. W. (2009). Research design: Qualitative, quantitative, and mixed methods
approaches (3rd
ed.). Lincoln, NE: University of Nebraska.
Crumrine, T., & Demers, C. (2007). Formative assessment: Redirecting the plan. The Science
Teacher, 74(6), 28-32.
Daggett, W.R. (2010). Jobs and the skills gap. Rexford, NY: International Center for Leadership
in Education.
Derringer, P. (2010). RTT in Tennessee: Assessment done right. Retrieved September 20, 2012
from: http://www.schoolcio.com/article/rtt-in-tennessee/51385
Di Carlo, M. (2012). How to use value-added measures right. Educational Leadership, 70(3), 38-
42.
Dorn, S. (2010). The political dilemmas of formative assessment. Exceptional Child, 76(3), 325-
337.
Dufour, R., & Marzano, R.J. (2011). Leaders of learning: How district, school, and classroom
leaders improve student achievement. Bloomington, IN: Solution Tree Press.
Dunn, K., & Mulvenon, S.W. (2009). A critical review of research on formative assessment: the
limited scientific evidence of the impact of formative assessment in education. Practical
Assessment, Research & Evaluation, 14(7), 1-11.
Fletcher, G.H. (2010). Race to the top: No district left behind. T.H.E. Journal, 37(10), 17-18.
Fuchs, D., Fuchs, L. S., & Stecker, P. M. (2010). The “blurring” of special education in a new
continuum of general education placements and services. Exceptional Children, 76(3),
301-323.
Fuhrman, S.H. (1999). The new accountability. CPRE Policy Brief No. RB-27. Philadelphia, PA:
University of Philadelphia, Consortium for Policy Research in Education.
181
Glover, E. (2012, December 18). Accountable or responsible: An old frame for a new future.
[Guest blog for Peter DeWitt’s On Common Ground.] Education Week. Retrieved
November 26, 2013 from:
http://blogs.edweek.org/edweek/finding_common_ground/2012/12/accountable_or_respo
nsible_an_old_frame_for_a_new_future.html
Glover, E. (2013). The myth of accountability: What don’t we know? Lanham, MD: Rowman &
Littlefield Education.
Greenstein, L. (2010). What teachers really need to know about formative assessment.
Alexandria, VA: Association for Supervision and Curriculum Development.
Goals 2000: Educate America Act, H.R. 1804, S. 102. (1994).
Goertz, M.E. (2001). Redefining government roles in an era of standards-based reforms. Phi
Delta Kappan, 83, 62-66.
Guilfoyle, C. (2006). NCLB: Is there life beyond testing? Educational Leadership,64(3), 8-13.
Harvey, L. (2004-2013). Analytic quality glossary, Quality Research International. Retrieved
October 31, 2013 from: http://qualityresearchinternational.com/glossary/
Heritage, M. (2007). Formative assessment: What do teachers need to know and do? Phi Delta
Kappan, 89(2), 140-145.
Herman, J.L., Osmundson, E., & Dietel, R. (2010). Benchmark assessment for improved learning
(AACC Report). Los Angeles, CA: University of California.
Hershberg, T. (2005, February). Value-added assessment and systematic reform: A response to
America’s human capital development challenge. Paper presented at Aspen Institute’s
Congressional Institute, Cancun, Mexico.
Hershberg, T., Simon, V.A., & Lea-Kruger, B. (2004). The revelations of value-added. The
School Administrator, 61, 10-14.
Holland, S. (2010, March 30). Tennessee, Delaware schools to get race to the top funds. CNN.
Retrieved from http://edition.cnn.com/2010/US/03/29/schools.funding/
Holloway, J.H. (2000). A value-added view of pupil performance. Educational Leadership,
57(5), 84-85.
Hoover, J.J. (2009). RTI: Assessment essentials for struggling learners. Thousand Oaks, CA:
Corwin Press.
Hoy, W.K., & Miskel, C.G.(2008). Educational administration: Theory, research, and practice.
(8th
ed.). Boston, MA: McGraw Hill.
Jennings, J. (2011). The policy and politics of rewriting the nation’s main education law. Phi
Delta Kappan, 92(4), 44-49.

182
Jorgensen, M.A., & Hoffman, J. (2003). Assessment report: History of NCLB. San Antonio, TX:
Pearson Education, Inc.
Klein, A. (2010). Race to top sets stage for ESEA. Education Week, 29(21), 18.
Leung, C., & Mohan, B. (2004). Teacher formative assessment to support student learning in
classroom contexts: Assessment as discourse and assessment of discourse. Language
Testing, 21(3), 335-359.
McDonnell, L.M. (2005). No child left behind and the federal role in education: Evolution or
Revolution. Peabody Journal of Education, 80(2), 19-38.
McMillan, J.H., & Schumacher, S. (2006). Research in education: Evidence based inquiry (6th
ed.). Boston, MA: Pearson Education, Inc.
Murphy, J. (Ed.) (1990). The education reform movement of the 1980s: Perspectives and cases.
Richmond, VA: McCutchan.
Nashville City Paper. (2010, March 29). Tennessee one of two states to receive race to the top
funds. Retrieved from http://nashvillecitypaper.com/content/city-news/tennessee-one-
two-states-receive-race-top-funds
National Commission on Excellence in Education. (1983). A nation at risk: The imperative for
educational reform. Washington, DC: U.S. Government Printing Office.
National Research Council. (2001). Knowing what students know: The science and design of
educational assessment. Washington, D.C.: National Academy of Science.
Nichols, S.L., & Berliner, D.C. (2008). Why has high-stakes testing so easily slipped into
contemporary American life? Phi Delta Kappan, 89(9), 672-676.
Nixon, G. (2011). Tennessee first to the top: Beginning the journey to college- and career-ready
graduates. Boston, MA: Pearson Education, Inc.
North Central Regional Educational Laboratory. (1994). Summary of goals 2000: Educate
America Act. Retrieved September 20, 2012, from
http://www.ncrel.org/sdrs/areas/issues/envrnmnt/stw/sw0goals.htm
Olson, L. (2005). Benchmark assessments offer regular checkups on student achievement.
Education Week, 25(13), 13-14.
Pearson Assessments. (2013a). Pearson benchmark. Retrieved October 5, 2013 from
http://www.pearsonassessments.com/Pearson Assessments. (2013b).
Pearson access: basic overview. Retrieved October 5, 2013 from
http://www.pearsonassessments.com/
Peterson, W., & Rothstein, R. (2010). Let’s do the numbers: Department of education’s “race to
the top” program offers only a muddled path to the finish line. Washington D.C.:
Economic Policy Institute.
183
Popham, W.J. (2006a). Assessment for learning: An endangered species? Educational
Leadership, 63(5), 82-83.
Popham, W.J. (2006b). Defining and enhancing formative assessment. Paper presented at the
Annual Large-Scale Assessment Conference, Council of Chief State School Officers, San
Francisco, CA.
Popham, W.J. (2008). Transformative assessment. Alexandria, VA: Association for Supervision
and Curriculum Development.
Popham, W.J. (2010). Everything school leaders need to know about assessment. Thousand
Oaks, CA: Corwin Press.
Ravitch, D. (2009). Time to kill ‘no child left behind.’ Education Week, 28(33), 30, 36.
Rush, L.S., & Scherff, L. (2012). Opening the conversation: NCLB 10 years later. English
Education, 44(2), 91-101.
Sanders, W. (1998). Value-added assessment. School Administrator, 55(11), 24-28.
Sanders, W., & Horn, S.P. (1998). Research findings from the Tennessee value-added
assessment system (TVAAS) database: Implications for educational evaluation and
research. Journal of Personnel Evaluation in Education, 12(3), 247-256.
Scriven, M. (1967). The methodology of evaluation. In R.W. Tyler, R.M. Gagne, and M. Scriven
(Eds.), Perspectives of curriculum evaluation, Volume I (pp. 39-83). Chicago: Rand
McNally.
Shearon, D. (n.d.) The Tennessee value-added assessment system. Retrieved February 22, 2012
from http://www.sas.com/govedu/edu/ed_eval.pdf
Smith, G. (2007). How does student performance on formative assessments relate to learning
assessed by exams? Journal of College Science Teaching, 36(7), 28-34.
Spring, J. (2006). American education (12th
ed.). Boston: McGraw Hill.
Standerfer, L. (2006). Before NCLB: The history of ESEA. Principal Leadership, 6(8), 26-27.
State of Tennessee. (2011). Tennessee celebrates first year of race to the top. Retrieved
September 20, 2012 from http://news.tn.gov/node/6918
Stecker, P. M., Fuchs, L.S., & Fuchs, D. (2005). Using curriculum-based measurement to
improve student achievement: Review of research. Psychology in the Schools, 42, 795-
819.
Stiggens. R. (2002). Assessment crisis: The absence of assessment FOR learning. Phi Delta
Kappan, 83(10), 758-765.
Stiggens, R. (2005). From formative assessment to assessment FOR learning: A path to success
in standards-based schools. Phi Delta Kappan, 87(4), 324-328.
184
Stiggens, R., & DuFour, R. (2009). Maximizing the power of formative assessments. Phi Delta
Kappan, 90(9), 640-644.
Tennessee Department of Education. (2010a). About Tennessee first to the top. Retrieved
September 20, 2012 from http://tn.gov/firsttothetop/about.html
Tennessee Department of Education. (2010b). Spring 2010 TCAP achievement test guide to test
report interpretation. Retrieved February 22, 2012 from
http://www.tn.gov/education/assessment/doc/ACHEdu_Guide_test_interp.pdf
Tennessee Department of Education. (2010c). Tennessee first to the top. Retrieved September
20, 2012 from http://tn.gov/firsttothetop/resources.html
Tennessee Department of Education. (2010d). Tennessee first to the top: Educators Guide.
Retrieved September 20, 2012 from http://tn.gov/firsttothetop/resources.html
Tennessee Department of Education. (2010e). Tennessee first to the top: Executive summary.
Retrieved September 20, 2012 from http://tn.gov/firsttothetop/resources.html
Tennessee Department of Education. (2010f, July). Tennessee first to the top: What is first to the
top designed to achieve? PowerPoint presentation at the meeting of the Tennessee
Department of Education, Nashville. Retrieved September 20, 2012 from
http://tn.gov/firsttothetop/resources.html
Tennessee Department of Education. (2013a). TVAAS Tennessee value-added assessment system.
Retrieved October 5, 2013 from
http://www.tn.gov/education/assessment/doc/TVAAS_Fact_Sheet.pdf
Tennessee Department of Education. (2013b). Understanding TVAAS: It’s all about growth.
Retrieved October 5, 2013 from
http://www.tn.gov/education/assessment/test_results.shtml
The White House Office of the Press Secretary. (2009). Fact sheet: The race to the top.
Retrieved November 5, 2012 from http://www.whitehouse.gov/the-press-office/fact-
sheet-race-top?utm_source=wh.gov&utm_medium=shorturl&utm_campaign=shorturl
U.S. Department of Education. (1995). The improving America’s schools act of 1994:
Reauthorization of the elementary and secondary education act. Washington D.C.: U.S.
Government Printing Office.
U.S. Department of Education. (2002a). Closing the achievement gap in America’s public
schools. Retrieved August 15, 2012 from
http://www2.ed.gov/nclb/overview/welcome/closing/edlite-slide001.html
U.S. Department of Education. (2002b). No child left behind. EdGov Website. Retrieved
September 12, 2012, from http://www2.ed.gov/nclb/overview/intro/execsumm.html
U.S. Department of Education. (2003). The condition of education 2003. Washington, D.C.:
National Center for Education Statistics.
185
U.S. Department of Education. (2009). Race to the top program executive summary. Washington
D.C.: U.S. Government Printing Office.
U.S. Department of Education. (2010). A blueprint for reform: The reauthorization of the
elementary and secondary education act. Retrieved September 12, 2012, from
http://www2.ed.gov/policy/elsec/leg/blueprint/blueprint.pdf
U.S. Department of Education. (2011). Race to the top program review guide. Retrieved
November 5, 2012, from https://www2.ed.gov/programs/racetothetop-assessment/review-
guide.pdf
Webb, L.D. (2006). The history of American education: A great American experiment. Upper
Saddle River: Pearson.
Witte, R.S., & Witte, J.S. (2007). Statistics (8th ed.). Hoboken, NJ: Wiley & Sons, Inc.
Zehr, M.A. (2006). Monthly checkups. Education Week, 25(35), 36-37.
Zhao, Y. (2009). Catching up or leading the way: American education in the age of
globalization. Alexandria, VA: Association for Supervision and Curriculum
Development.

186
APPENDICES
Appendix A
Director of Schools’ Letter
November 18, 2013
XXXXXXX, Director of Schools
XXXXXXXXXXXXXXXXXXX
XXXXXXXXXXXXXXXXXXX
XXXXXXXXXXXXXXXXXXX
Dear Director of Schools:
I am writing this letter to request your permission to use XXXXXXXXXXX Schools’ test data.
I am completing a doctoral dissertation at East Tennessee State University in the Educational
Leadership and Policy Analysis program. The objective of this study is to determine if there is a
relationship between the Pearson Benchmark assessment and the Tennessee Comprehensive
Assessment Program.
I am asking your permission to collect Pearson Benchmark test scores as well as Tennessee
Comprehensive Assessment Program (TCAP) scores from the 2011-2012 school year. This
study will include third, fourth, fifth, and sixth grade student data for reading and language arts
and mathematics. The confidentiality of individual student scores will be protected. I have
attached a copy of my proposed research questions for your reference.
If these arrangements meet your approval, please sign the letter where indicated below. Thank
you very much for your time and continued support of this project. It is my hope that the
information gleaned from this research study will benefit the school district.
Sincerely,
Cherith A. Dugger-Roberts
Permission granted for the use requested above:
___________________________________________________
XXXXXXXXX, Director of Schools
___________________________________________________
Date
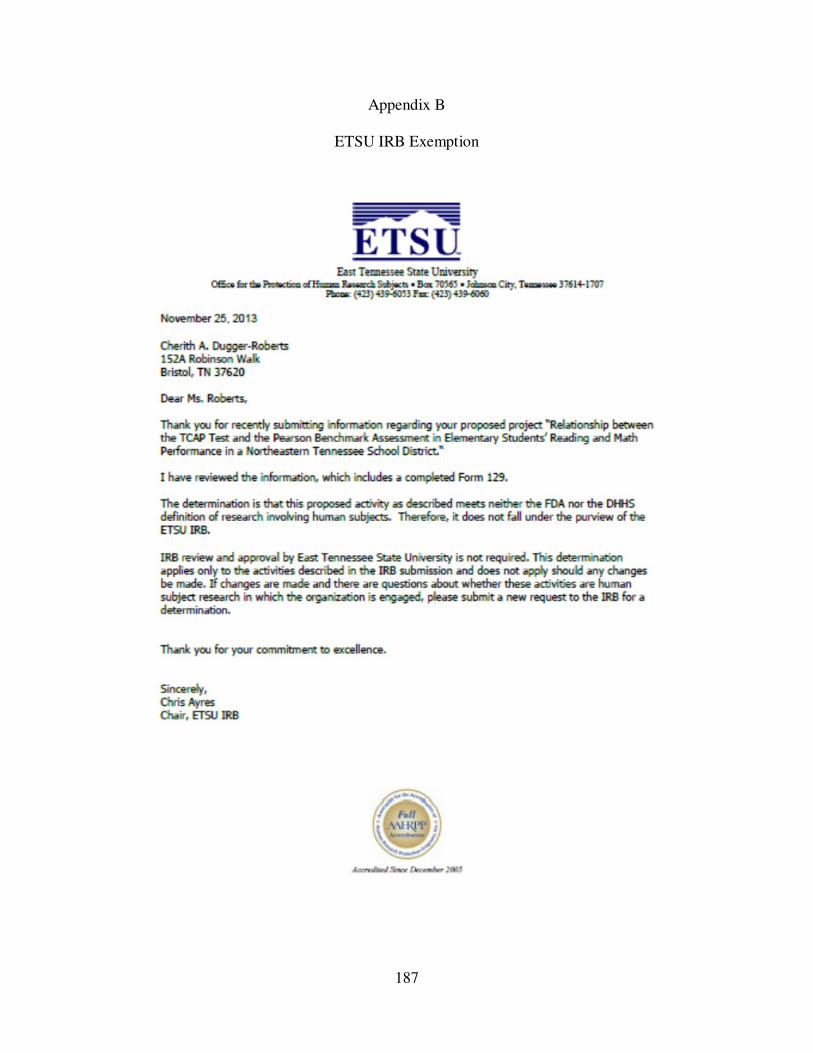
187
Appendix B
ETSU IRB Exemption

188
VITA
CHERITH A. DUGGER-ROBERTS
Education: Bristol Virginia Public Schools, 1985 – 1998
B. S. Elementary Education, King College, Bristol, Tennessee, 2002
M. Ed. Educational Leadership, East Tennessee State University, Johnson
City, Tennessee, 2006
Ed. D. School Leadership, East Tennessee State University, Johnson City,
Tennessee, 2014
Professional
Experience: Teacher, Bristol Tennessee City Schools, Bristol, Tennessee,
2002 – 2007
Elementary Summer School Principal, Bristol Tennessee City Schools,
Bristol, Tennessee, 2007-2008
Interim Elementary School Principal, Bristol Tennessee City Schools,
Bristol, Tennessee, October 2007 – May 2008
Elementary Program Assistant and Assistant Principal, Bristol Tennessee
City Schools, Bristol, Tennessee, 2007 - Present