relationship between stock market capitalization and
TRANSCRIPT
RELATIONSHIP BETWEEN STOCK MARKET CAPITALIZATION
AND ECONOMIC GROWTH IN KENYA
BY
JACKLINE CHEPKOECH
D61/74344/2014
A RESEARCH PROJECT PRESENTED IN PARTIAL
FULFILMENT OF THE REQUIREMENTS OF THE AWARD OF
MASTER OF BUSINESS ADMINISTRATION, SCHOOL OF
BUSINESS, UNIVERSITY OF NAIROBI
NOVEMBER, 2017

ii
DECLARATION
This research project is my original work and it has not been presented to any other
higher learning institution or university:
Signed ……………………………………… Date ……………………………
Jackline Chepkoech D61/74344/2014
This research is presented for examination with my approval as an approved university
supervisor:
Signed ……………………………………… Date ……………………………
Dr. Cyrus Iraya,
Lecturer,
Department of Finance and Accounting,
School of Business, University of Nairobi.

iii
DEDICATION
I dedicate this piece research study to my loving mother Ms. Peterline C. Kerich for the
support, encouragement towards my academic journals.

iv
ACKNOWLEDGEMENT This work has gone to a fruitful culmination because of a mix of endeavors, diligent work
and material help of a few people. Most importantly, I am extremely thankful to my
mother and Mr. Henry Ouma (Henkel Kenya) for their understanding, guide and
consolation. I express gratitude toward them for the most part to take his opportunity to
mention vital objective fact and rectifications.
In a similar express my gratefulness to my lecturers Dr. Cyrus Iraya and Dr. Mirie
Mwangi among others whose names may not be said here for unavoidable reason of room
however have affected emphatically on us over the span of this program.
Similarly, I wish to express my significant gratefulness to the Capital Market Authority
for facilitating data collection.
To God be the Glory!

v
TABLE OF CONTENTS
DECLARATION............................................................................................................... ii
DEDICATION.................................................................................................................. iii
ACKNOWLEDGEMENT ............................................................................................... iv
LIST OF TABLES .......................................................................................................... vii
LIST OF FIGURES ....................................................................................................... viii
ABBREVIATIONS .......................................................................................................... ix
ABSTRACT ....................................................................................................................... x
CHAPTER ONE: INTRODUCTION ............................................................................. 1
1.1 Background to the Study ............................................................................................... 1
1.1.1 Stock Market Capitalization ............................................................................. 2
1.1.2 Economic Growth ............................................................................................. 2
1.1.3 Relationship between Stock Market Capitalization and Economic Growth .... 3
1.1.4 Economic Growth in Kenya ............................................................................. 4
1.2 Research Problem .................................................................................................... 5
1.3 Research Objective .................................................................................................. 7
1.4 Value of the Study ................................................................................................... 7
CHAPTER TWO: LITERATURE REVIEW ................................................................ 9
2.1 Introduction ................................................................................................................... 9
2.2.1 Efficient Markets Hypothesis ................................................................................. 9
2.2.2 Endogenous Growth Theory ................................................................................ 10
2.2.3 Exogenous Growth Theory .................................................................................. 11
2.3 Determinants of Economic Growth ............................................................................ 11
2.3.1 Financial Development ........................................................................................ 12
2.3.2 Higher Education Development ........................................................................... 12
2.3.3 Foreign Direct Investment .................................................................................... 13
2.3.4 Financial Inclusion ............................................................................................... 14
2.3.5 Macroeconomic Variables.................................................................................... 15
2.3.6 Market Capitalization ........................................................................................... 15
2.4 Empirical Review........................................................................................................ 16

vi
2.5 Conceptual Framework ............................................................................................... 20
2.6 Summary of Literature Review ................................................................................... 20
CHAPTER THREE: RESEARCH METHODOLOGY ............................................. 22
3.1 Introduction ................................................................................................................. 22
3.2 Research Design.......................................................................................................... 22
3.4 Data Collection ........................................................................................................... 22
3.5 Validity and Reliability ............................................................................................... 23
3.6 Data Analysis .............................................................................................................. 23
3.6.1 Analytical Model .................................................................................................. 23
CHAPTER FOUR: DATA ANALYSIS, RESULTS AND DISCUSSION ................ 25
4.1 Introduction ................................................................................................................. 25
4.2 Descriptive Statistics ................................................................................................... 25
4.5 Correlation Analysis ................................................................................................... 28
4.6 Regression Analysis and Hypotheses Testing ............................................................ 29
CHAPTER FIVE: SUMMARY, CONCLUSSION AND RECOMMENDATION .. 35
5.1 Introduction ................................................................................................................. 35
5.2 Summary of the findings ............................................................................................. 35
5.3 Conclusion .................................................................................................................. 36
5.4 Recommendations ....................................................................................................... 37
5.5 Limitations of the Study.............................................................................................. 39
5.6 Suggestions for Further Research ............................................................................... 40
REFERENCES ................................................................................................................ 41
APPENDIX:..................................................................................................................... 44

vii
LIST OF TABLES
Table 4.1: Descriptive Statistics ………………………………………………………...26
Table 4.2: Correlation results ……………………………………………………….. 29
Table 4.3: Regression results ………………………………………………………..29
Table 4.4: Regression statistics ………………………………………………………. 31

viii
LIST OF FIGURES
Figure 2.1: Conceptual Framework ……………………………………………………..20
Figure 4.1: Economic Growth in Kenya 2005-2015…………………………………… 28

ix
ABBREVIATIONS
FDI : Foreign direct investment
GDP : Gross Domestic Product
NSE : Nairobi Securities Exchange
CMA: Capital Market Authority
KNBS: Kenya National Bureau of Statistics
CBK: Central Bank of Kenya

x
ABSTRACT
The investigation was done on firms recorded on the Nairobi Securities Trade (NSE) with
the goal of discovering how monetary development was influenced by the advancements
in the level of market capitalization. This was out of the way that most investigates
harped such a great amount on the connection between showcase capitalization and Gross
domestic product. Regression display was utilized to examine the connection between
financial development, stock market capitalization increase and the control variables. The
two key variables were measured by rate monetary development rate and market
capitalization separately. The information utilized was gathered from the Capital Market
Authority for 11 year period from 2005. The information for financial development for a
similar period was got from the database Kenya National Bureau of Statistics and Central
Bank of Kenya. Examination of the information uncovered that there was a 0.000356186
relationship between the two factors showing that the two co-moved. The relapse
investigation found a powerless positive association with the level of development rate
that is autonomous of market capitalization being 5.085%. The variable part had a variety
coefficient of 0.00683283266 which is certain.
1
CHAPTER ONE: INTRODUCTION
1.1 Background to the Study
Economic growth remains a paramount goal for governments the world over; with the
aim being to advance their economies and the living standards of their respective
populace. Among the avenues to achieve economic growth are stock markets (Maranga,
2013). According to efficient markets theory (Fama, 1970), stock markets play a crucial
role of efficient and effective resource allocation in the economy. As such, governments,
households and corporations being resource demanders often turn to these stock markets
for scarce financial resources to be deployed into productive uses. In this perspective,
stock markets aid countries towards economic growth. However stock markets’ perceived
positive role is often questioned due to their vulnerability to market failure, which is
often noticeable in the volatile nature of stock markets, especially in developing and
emerging countries (Omoke, 2010).
The financial system is multifaceted in structure and functioning globally (Mishkin,
2004). It also remains unsettled whether stock markets (a subset of the capital market)
spur economic growth especially in the context of emerging market economies (Naik and
Padhi, 2015). A few components of securities exchanges, for example, instability and
nearness of theoretical financial specialists are probably going to detrimentally affect a
nation's long haul improvement. The research study sought to investigate the relationship
between stock market capitalization and economic growth in the context of Kenya.
2
1.1.1 Stock Market Capitalization
The stock market is a public market where issuing and trading of equities, bonds and
other sorts of securities takes place, either through organized security exchanges or over-
the-counter market. A stock trade encourages stock dealers to exchange organization
stocks and different securities. Participants in stock markets include governments,
corporate institutions, individuals, mortgage firms, and so on. Households are net
investors in the stock markets; while firms and the government are net users (Mishkin &
Eakins, 2012).
Stock market being where securities are traded, their development entail increase in
volumes handled, and hence market capitalization, and their sustainability (Omoke,
2010). The improvement of the securities exchanges is imperative component of
monetary segment advancement and supplements the part of the managing an account
framework in financial advancement. Enhanced securities exchanges encourage in
productive through value disclosure, liquidity arrangement, decrease in exchange
expenses, and hazard exchange. Market capitalization can be assessed in terms of
changes in the market index or volumes traded. Improved market capitalization also acts
as barometer of funds flow in the economy and improved resource allocation from
unproductive to productive areas.
1.1.2 Economic Growth
Economic growth is among the primary goals of monetary policy; and is an important
macroeconomic objective for any country (Otieno, 2015). Mosiori (2014) characterizes

3
financial development as an expansion in the generation and utilization of merchandise
and enterprises in an economy. A country can stimulate economic growth by
implementing policies that encourage accumulation of funds for investment by firms and
increase individuals’ savings (Mishkin, 2004).
Monetary development is the expansion of per capita total national output (GDP) or other
measure of total wage. It is frequently measured as the rate of progress in GDP. Monetary
development alludes just to the amount of merchandise and enterprises created and it can
be either positive or negative (Omoke, 2010). Economic growth improvement has many
benefits to various stakeholders in an economy: the citizenry obtain gainful employment,
improved living standards and firms easily obtain effective markets for their produce,
among others.
1.1.3 Relationship between Stock Market Capitalization and Economic Growth
Stock markets administer channeling of surplus funds to investors with a shortage
principally affecting economic growth. Market capitalization stems from changes in stock
markets growth, backed by apt and adequate regulation and legal framework it assists
drive and sustain economic growth (Mishkin, 2012). The said regulations create a
conducive environment for economic growth. Endogenous growth theory supports this
perspective of market capitalization and economic growth relationship.

4
Securities exchanges are basic in supporting more noteworthy monetary proficiency by
exchanging reserves from financial specialists with surplus to those with beneficial
utilize. Where the inflows of funds into the markets outweigh the outflows, market
capitalization improves and the reverse holds, also. Therefore market capitalization is
largely affected by activities in stock markets, which then have direct impact metrics of
economic growth such as individual wealth, the performance of firms and consumers, and
the cyclical performance of the economy. Low market capitalization stemming from
underdeveloped stock markets lead to low states of economic development and economic
growth; efficient flow of funds at low costs is hindered (Mishkin, 2004).
1.1.4 Economic Growth in Kenya
Kenya has made noteworthy auxiliary and financial changes that have added to supported
monetary development over the past decade. Kenya’s economic growth rose to 5.9% in
2016 and projected to increase by 6.1 % in 2017 based on infrastructure investments,
decreased pressure on domestic interest rates and increase in credit uptake by the private
sector (World Bank, 2016).
Kenya’s GDP increased by 5.6 per cent in 2015 compared to 5.3 per cent growth in 2014;
this growth was as a result of growth in some key sectors among them financial markets
(KNBS, 2016). The stock market capitalization is around Kenya shillings 2.5 trillion; this
figure is less than 50% of the gross national product. The stock markets are well
positioned to support Kenya’s long-term financial and economic growth (CMA, 2016).

5
1.2 Research Problem
Stock markets are predisposed to a number of vulnerabilities among them market failures
and unpredictable volatility, as well as low ratio of market participants relative to general
population. These forces and market metrics influence market capitalization. As a result,
the traditional growth schools of thought argue that there is no relationship between
business sectors capitalization and financial development because of the existence of
level effect (Omoke, 2010). However according to efficient markets hypothesis (Fama,
1970) stock markets are efficient thus all securities prices reflect all available information
at all times, thus optimum market capitalization level. This implies efficiency if resource
allocation occurs throughout an economy; from surplus unit to deficit but productive
units, this supposes a positive connotation on economic growth.
Kenya’s organized stock markets commenced operation in the 1950s with the inception
of the then Nairobi stock exchange; there has been growth registered in the stock markets
over the years in terms of number of firms listed in the exchange as well as the variety of
products and services offered. Currently, listed firms number over sixty firms (CMA,
2016). The country’s annual economic growth rates have been fluctuating over the period
since organized stock markets inception.
A number of studies have in the past been undertaken to establish the effect of the market
capitalization on economic growth. Boopen, Shalini and Sawkut (2009) find that
6
financial development has a positive contribution on economic growth. Mahdi (2008)
finds that higher education has a positive effect on the economic growth over the short
and long run.
Dorko (2012) however finds there is a frail positive relativity with the level of
development rate and market capitalization. Maranga (2013) there is a weak negative
correlation between gross domestic product growth and stock market returns; there is a
negative connection between interbank loaning financing cost and the monetary
development (Otieno, 2015). Stock market indices impact significantly on economic
growth (Sambu, 2014). Mosiori (2014) found that foreign direct investment and exchange
rates positively affect economic growth while inflation and interest rates have an inverse
relationship with economic growth.
From the empirical studies reviewed, foreign studies are in agreement that market
capitalization and its related metrics have compelling effect on economic growth.
However local studies post mixed results: there is a weak negative correlation between
gross domestic product growth and interest rate and stock market returns (Maranga,
2013; Otieno, 2015); stock market indices impact significantly on economic growth
(Sambu, 2014; Mosiori, 2014). This indicates that the relationship between market
capitalization and economic growth remains unsettled, especially for an emerging
economy such as Kenya’s. Thus the research question: What is the relationship between
market capitalization and economic growth in Kenya?
7
1.3 Research Objective
The objective of the study was to investigate the relationship between stock market
capitalization and economic growth in Kenya.
1.4 Value of the Study
The study is of value to different stakeholders in the Kenyan economy, among them other
researchers, government officials, stock markets officials and managers, legislators,
financial analysts, among others. Government officials shall find the study insightful as
the relationship between market capitalization and economic growth was studied. These
officials mainly aim for positive economic growth; as such, they put in place policy drafts
and guidelines that aim at the said target. With input from the study, such policy drafts
and guidelines shall be of better quality and relevance.
Other scholars shall also find this study relevant to them; they might use the study
findings as point of reference in the future and or as a basis for further research. This
essentially shall also add to the breadth and quality of their research works and
publications. Other researchers might also use the findings from the study to just further
their knowledge base on the study parameters.
Stock markets officials and managers and Legislators could also draw input from the
study while undertaking their policy drafting as well as policy amendment duties. Better
policy drafts and regulatory framework shall be made thereby assuring or adding to the

8
quality of the legislations and policies therefrom. The study could also form a reference
point while undertaking these policy related duties.
Financial analysts often undertake due diligence assignments as well as background
checks on investment targets. These individuals might therefore draw invaluable insights
from the study and thus build on their client advises as well as recommendations made.
Also financial analysts often undertake in-house research studies; with input from the
study, such researches are better enhanced.
9
CHAPTER TWO: LITERATURE REVIEW
2.1 Introduction
This chapter discusses the literature review. It covers theories and past empirical studies
relevant to the study area, as well as the other determinants of economic growth.
2.2 Theoretical Review
This section presents and discusses theories relevant to the study area: efficient markets
theory, endogenous growth theory and exogenous growth theory.
2.2.1 Efficient Markets Hypothesis
The efficient markets theory (Fama, 1970) establishes that securities prices in the stock
market fully reflect all available information. It is based on the assumptions that
information is freely available to all market participants at negligible costs and this
information trickles in randomly, thus prices are rightly priced always (where mispricing
exists, arbitrage activities quickly adjust the price to the right level). The market players
are also assumed to be rational and seek to maximize their returns; thus, the stock
markets allocate funds from surplus units to deficit units in an efficient and effective
manner.
The efficient stock markets theory provides a good explanation on the role stock markets,
especially market capitalization, play on promoting economic growth in a country. Since
resources are efficiently allocated, wasteful use is minimized in the economy; where such

10
efficient allocation and use of the scarce resources occur, economic growth is positively
impacted. However, some proponents argue that stock markets are prone to a number of
inefficiencies in practice (information may not be freely available, investors might often
behave irrationally) (Ross, Westerfield, Jordan, 2013); these inefficiencies hamper
efficient allocation of resources in the economy thereby adversely affecting economic
growth.
2.2.2 Endogenous Growth Theory
Endogenous development hypothesis (Romer,1986) hypothesizes that monetary
development originates from factors inward to an economy and not from outside powers.
Factors of production such as labour can be managed internally and improved within an
economy so as to foster economic growth. The theory thus argues from a closed market
economy perspective. According to endogenous growth theory, therefore, stock markets
development and hence capitalization causes higher economic growth through influence
on level of investment and productivity.
Stock markets will assist mobilize savings and encourage investments and thus enhanced
economic growth rates (Dorko, 2012). Stock markets being part of the overall financial
system assist to mobilize and bulk financial resources from the surplus supply units in the
economy and such funds are then channeled efficiently and efficiently to the deficit
supply units. Resources are thus efficiently channeled into most productive areas and
over time such efficiency results in positive influence on economic growth, ceteris
paribus.
11
2.2.3 Exogenous Growth Theory
Exogenous growth model (Solow, 1956) is a theory that explains how economic growth
results over the long-run. Unlike the endogenous theory, economic growth under
exogenous growth theory is assumed to stem from external factors. The theory supposes
that economic growth is a function of three items: capital accumulation, population
(labour), and technological improvement (productivity), and that labour and capital are
subject to the law of diminishing returns.
Capital accumulation is affected in part by the savings rate. The theory thus postulates
that a country with a higher national savings rate will realize faster growth relative to
those with lower savings rate. Sustained capital accumulation, managing population
growth to a low level, and enhancing investments through higher savings, are thus
anticipated to drive economic growth (Solow, 1996).
2.3 Determinants of Economic Growth
Market capitalization affects country’s economic growth. However there exist other
factors that influence economic growth of a country. These other factors (financial
development, higher education development, financial inclusion, foreign direct
investment, among others) are presented and discussed below:

12
2.3.1 Financial Development
Financial development is broader than stock markets development and affects economic
growth. Financial development comprises improvement of the banking sector, stock
markets, and other financial intermediaries (Andrianaivo & Yartey, 2010). Stock markets
are a subset of financial development. A domain of a solid lawful framework, accounting
standards and adequate government direction, among others, bolsters money related
improvement in a nation and decidedly helps monetary development (Mishkin & Eakins,
2004).
According to Sehrawat and Giri (2015) there are three schools of thought on the
relationship between economic growth and financial development. To begin with, money
related improvement is a precondition for monetary development; this contention bolsters
the supply driving idea. Second, genuine monetary development leads budgetary
improvement (that is the request following point of view). The third conclusion keeps up
that there exists bidirectional interconnection between monetary development and
financial development.
2.3.2 Higher Education Development
Higher education also plays a consequential role in economic growth of a country. It
affects and shapes the quantity and quality of skilled personnel supplied into the society
over time. It also drives and directly supports economic growth through innovation,
research and development activities, providing knowledge diffusion to the populace, and
13
providing a resource to manage the production factors in an economy (Khorasgani,
2008).
Cumulative investment in education assists to stimulate domestic demand and spur
economic growth (Hongyi & Huang, 2010). Higher education development provides a
basis and or a platform to boost economic growth and development. An education
populace assist improve efficient and effective allocation of productive resources in the
economy to areas of most need. Thereby overtime innovation, efficiency, and other
benefits pool towards economic growth and development.
2.3.3 Foreign Direct Investment
Foreign direct investment (FDI) represents funds flow from international markets into
local economy in form of foreign currency. This flow is accompanied by knowledge
transfers, as well as improved balance of trade; the trickle effect is on economic growth.
The connection between FDI and economic development is however complex. FDI
assists create employment; improve productivity, competiveness, and technology
transfer, at the country level. Enhanced FDI drives exports, enhances access to global
markets and foreign currencies. FDI also promotes the competitiveness of local economy.
Thereby facilitating economic growth, directly and or indirectly (Denisia, 2010).
Mosiori (2014) asserts that foreign direct investments drive investments which then
drives production and consumption of goods and services in given country; FDI assists

14
build up physical assets, widen employment opportunities, develop productive capability,
and enhance local skills through transfer of technology. FDI provides the wherewithal to
foster these aspects of the economy; thus supporting creates an environment conducive
for economic growth.
2.3.4 Financial Inclusion
Financial inclusion encompasses various dimensions such as availability and penetration
of banking services, as well as usage of the same. Financial inclusion plays a significant
role in developing a strong and an efficient financial structure, which then aids the
growth of an economy. There is a positive relativity between economic growth and the
various aspects of financial inclusion such as banking penetration and outreach (Sharma,
2016).
Financial inclusion could be achieved in terms of wider reach of the overall populace
through provision of more relevant products and services that attract more players into
the financial system (Sharma, 2016). Financial inclusion however is impacted by a
number of key variables such as level of financial literacy in the economy, availability of
technological knowhow and appropriate infrastructural developments. Once a
considerable of financial inclusion is realized, economic growth is positively aided.

15
2.3.5 Macroeconomic Variables
Macroeconomic variables shape the national economic environment of a nation; they
define and influence the volatility and turbulence of the said environment.
Macroeconomic variables such as exchange rates, have significant impact on economic
growth (Naik & Padhi, 2015). Otieno (2015) asserts that macroeconomic variables,
especially interest rates, are one of the most key drivers of economy growth; they
influence financial markets. A stable macroeconomic environment is essential for
economic growth.
A country’s exchange rate management influences its economic growth; currency
undervaluation assists spur economic growth, while an overvaluation might result in
adverse balance of payment, and inhibit economic growth. High inflation rates always
lead to macroeconomic volatility which then reduces economic growth in a country as
households tighten their consumption and find it hard to make savings and investments
(Naik & Padhi, 2015).
2.3.6 Market Capitalization
Market capitalization is the aggregate individual firms’ market value. It is based on the
number of shares issued as well as the daily market prices. Market capitalization amount
could be used as a barometer of economic performance in the country. Investors in the
stock markets are premised to make investment out of savings derived from incomes.
More investments shall be made where incomes allow for savings by individuals and
households (Mishkin & Eakins, 2012).

16
Higher incomes therefore imply higher economic growth; higher growth also might
imply higher incomes. Market capitalization is also a factor of foreign direct investors’
actions in the markets; net positive inflows from these investors serves to drive prices up,
hence higher market capitalization. Foreign direct investments also affects balance of
payments; positive net funds inflow has a positive impact on the balance of payments and
in effect economic growth (Denisia, 2010).
2.4 Empirical Review
Under this section relevant past studies that have been undertaken on the study area are
reviewed. The section begins with foreign studies review, and then ends with a review of
local studies.
Boopen, Shalini and Sawkut (2009) undertook a research study to investigate whether
there is a relationship between financial development and economic growth in island
economies in the world using a descriptive research design. The population comprised all
island economies and a sample of 20 countries used data obtained covered 1980 to 2002.
The study obtained secondary data which was analyzed using regression analysis. The
study found that financial development has a positive contribution on the economic
growth of the islands.

17
Mahdi (2008) also in study to establish the role higher education plays in economic
growth in Iran used a descriptive research design. Secondary data was sourced from
Statistic Center of Iran and the Central Bank of Iran covering the period 1959-2005 and
analysis done using an autoregressive distributed lag model. The research study found
that higher education has a positive effect on the economic growth of Iran over the short
and long run.
Naik and Padhi (2015) in a study examined the impact of stock market development on
the economic growth using a descriptive research study. The 27 emerging economies
were sampled and secondary data obtained covering 1995 to 2012. Data obtained were
analyzed using regression analysis and heterogeneous panel causality test. The research
study found that stock market development significantly contributes to economic growth.
The researchers also observe that macroeconomic variables such as exchange rates have
significant impact on economic growth.
Sehrawat and Giri (2015) in a study to examine the relationship between financial
development and economic growth in India used descriptive research. The study relied on
secondary annual data of the country covering period 1982 to 2012. Data were analyzed
using autoregressive distributed lag method and found that there exists a long-run
relationship in financial development and economic growth for India and that the Indian
financial sector has the potential for economic growth through credit transmission.

18
Masoud and Hardaker (2012) undertook a research study to investigate the relationship
between financial development and economic growth for emerging markets. The study
used a descriptive research design and secondary data covering 1995 to 2006. Population
target as all countries in the emerging markets and sampled only those with stock
exchanges. Data analysis was by regression analysis. The examination found that
securities exchange improvement significantly affects financial development and that
there is a steady, long haul balance connection between the advancement of money
markets and the development of the economy.
Dorko (2012) undertook a study with the objective to find out how economic growth is
affected by the developments in the level of market capitalization at the Nairobi
Securities Exchange. The descriptive research design based study used a population
comprising all listed firms and a sample of only consistently listed firms studied. The
study also used secondary data obtained from the NSE and United Nations covering 2000
to 2011. Regression analysis was undertaken and established that there is a weak positive
relationship of the stock market capitalization on level of economic growth rate.
Maranga (2013) also undertook a study to establish the relationship between the
economic growth and the stock market returns using a causal research design. The
researcher focused on the Nairobi Securities Exchange 20 share index and gross domestic
product and covered 1982 to 2012 study period. Secondary data was collected and
analysed using descriptive statistics, correlation and regression analyses. The study shows

19
that there is a weak negative correlation between gross domestic product growth and
stock market returns.
Mosiori (2014) in a study sought to determine the relationship between foreign direct
investment and economic growth in Kenya. A descriptive survey research design was
used as well as secondary data obtained from the Central Bank of Kenya and World Bank
covering period 1994-2014. Using regression analysis the study established that foreign
direct investment and an exchange rate positively affect economic growth while inflation
and interest rates have an inverse relationship with economic growth and recommends the
government to push reform agenda so as to attract more foreign direct investment in the
Kenyan economy.
Otieno (2015) investigated the effects of interest rate on the general economic growth in
in Kenya using a causal research design and secondary data obtained from the
publications of Kenya national bureau of statistics and the Central bank of Kenya for a 15
year period covering 2000 to 2014. Data obtained were then analyzed using regression
analysis; the study established that there is a negative relationship between interbank
lending interest rate and the economic growth and recommends that the government
ought to put policies in place to control interest rates movements.
Sambu (2014) undertook a study to examine the relationship between Kenyan stock
markets development and economic growth over the period 1990 to 2011. The study used
secondary data and analysis done using regression analysis and tests of significance via
20
the R tests and F-statistics. The research study findings indicate that stock market indices
impact significantly on economic growth.
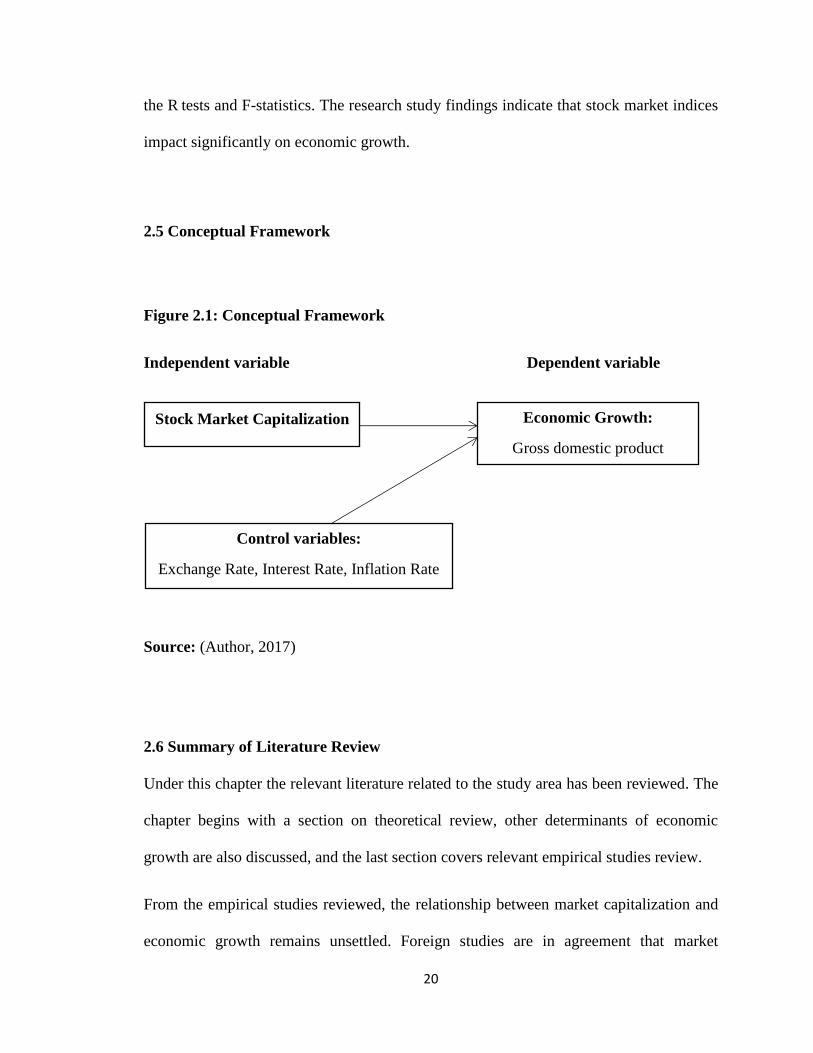
2.5 Conceptual Framework
Figure 2.1: Conceptual Framework
Independent variable Dependent variable
Source: (Author, 2017)
2.6 Summary of Literature Review
Under this chapter the relevant literature related to the study area has been reviewed. The
chapter begins with a section on theoretical review, other determinants of economic
growth are also discussed, and the last section covers relevant empirical studies review.
From the empirical studies reviewed, the relationship between market capitalization and
economic growth remains unsettled. Foreign studies are in agreement that market
Economic Growth:
Gross domestic product
Stock Market Capitalization
Control variables:
Exchange Rate, Interest Rate, Inflation Rate

21
capitalization and its related metrics have a positive significant effect on |Economic
growth, (Masoud & Hardaker, 2012; Boopen, Shalini & Sawkut, 2009; Mahdi, 2008).
However local studies post mixed results: there is a weak negative correlation between
gross domestic product growth and interest rate and stock market returns (Maranga,
2013; Otieno, 2015); stock market indices impact significantly on economic growth
(Sambu, 2014; Mosiori, 2014).
22
CHAPTER THREE: RESEARCH METHODOLOGY
3.1 Introduction
This chapter explains the research methodology that the research study followed. It
explains the research design, data collection, and the data analysis.
3.2 Research Design
A research design is the theoretical structure within which a research study is undertaken;
it guides the collection as well as measurement and analysis of data (Kothari, 2004). The
study adopted a case study research design. The major aim of descriptive research is to
describe characteristics of the study targets as they are (Zikmund et al., 2010). Musebe
(2015) used a descriptive survey design while undertaking a similar research study. The
study sought to identify and describe the relationship between market capitalization and
economic growth in Kenya.
3.4 Data Collection
The study primarily relied on secondary data on market capitalization and economic
growth over the period 2005 to 2015 quarterly. Dorko (2012) while undertaking a similar
research study also used secondary data. The data was be sourced from publications by
the Kenya National Bureau of Statistics as well as stock markets statistics by the Stock
markets Authority.
23
3.5 Validity and Reliability
This section explains the validity and reliability of the data collection instrument. A
sound data collection instrument must meet the checks of validity and reliability. Validity
shows the extent to which an instrument measures what it is expected to measure. One
dimension of validity is content validity (extent to which a measuring instrument
provides adequate handling of study target). A measuring instrument is reliable if it
delivers steady outcomes. Reliability aids validity, (Kothari, 2004).
Only one data collection instrument was used to collect the data require; this assisted on
the reliability aspect as this way, data was collected uniformly thus consistent
administration. On content validity, the study sought to investigate the impact of stock
markets on economic growth; therefore, the data collection instrument sought to
adequately obtain data related to the study parameters alone.
3.6 Data Analysis
The collected data was tabulated, checked for errors and edited appropriately where
necessary. Descriptive statistics such as the mean, standard deviation were calculated to
summarize the obtained data. Regression analysis and tests of significance were then
undertaken to establish the relationship between market capitalization and economic
growth in Kenya. The specific model is as below:
3.6.1 Analytical Model
Ye = β0 + β1Mc + β2Ir + β3Int + β4Exch + ε
Where: Ye = economic growth as measured by percentage change in periodic gross
24
domestic product levels.
β0 = the intercept, that is, the amount of economic growth at zero market
capitalization.
βi = the beta coefficients for the respective independent and control variables, that
is, the change in economic growth following a unit change in the said variables.
Mc = Market Capitalization as measured by the periodic formal stock market
Capitalization change; market capitalization being the sum of
Individual firm issued shares multiplied by closing price.
Ir = Inflation Rate, measured by the consumer price index
Int = Interest rate, measured by the average periodic lending interest rate
Exch = Exchange rate, measured by the average periodic exchange rate against
the
US dollar.
ε = the error term

25
CHAPTER FOUR: DATA ANALYSIS, RESULTS AND DISCUSSION
4.1 Introduction
This section clarifies the examination of the data used for this examination. The segment
is dealt with to such a degree, to the point that the underlying portion gives the
presentation of the data to the extent the case of the examination, data aggregation, the
reasonable estimations of the data used, and the backslide examination. The examination
found the association between money related advancement and market capitalization no
doubt yet feeble.
4.2 Descriptive Statistics
The estimations of each of the organizations' accounted for showcase capitalization in a
particular quarter were added to locate the aggregate capitalization in that quarter. This
gave 44 sets of examination of the needy factors to be regressed with the adjustment in
Gross domestic product rates. The graphic measurements of the arrangements of
information were ascertained and are abridged in the table underneath. There were forty
four perceptions for every factor mentioning up forty finish objective facts for the
regression analysis.

26
Table 4.1 Descriptive Statistics Summary
The highest value of market capitalization increase was achieved in 2015 Q2, when the
reported total market value of the firms whose data were available was 2444.829. The
mean of the market capitalization was 1173.824682 with a standard deviation of
594.1160838. The distribution had a kurtosis of -0.556127127779688 which shows it was
a platykurtic distribution. The skewness was 0.787463150916588 showing the
distribution was symmetric.
The highest value of inflation rates was achieved in 2008 when the reported total market
value of the firms whose data were available was 19.18703715. The mean inflation rate
was 8.457321986 with a standard deviation of 4.570210415. The distribution had a
Ye MC Ir Int Ex
Mean 5.054545455 1173.824682 8.457321986 9.392045455 80.67490909
Standard Error 0.262880743 89.56636964 0.688985144 0.42113164 1.499930552
Median 5.2 977.692 7.014534786 8.75 80.74
Mode 6.1 #N/A #N/A 8.5 #N/A
Standard Deviation 1.743753576 594.1160838 4.570210415 2.793471275 9.949413704
Sample Variance 3.040676533 352973.9211 20.88682324 7.803481765 98.99083306
Kurtosis -0.151214455 -0.556127128 -0.39713596 4.404543604 -0.120342548
Skewness -0.29499703 0.787463151 0.887631498 1.961207909 0.324987777
Range 7 2117.905 16.47345175 12 41.972
Minimum 1.4 326.924 2.713585404 6 63.303
Maximum 8.4 2444.829 19.18703715 18 105.275
Sum 222.4 51648.286 372.1221674 413.25 3549.696
Count 44 44 44 44 44
Confidence Level(95.0%) 0.530149543 180.627799 1.389470965 0.849292893 3.024898243

27
kurtosis of -0.39713596 which shows it was a platykurtic distribution. The skewness was
0.887631498 showing the distribution was moderately skewed.
The highest value of interest rate was achieved in 2012 at 18%. The mean of the interest
rate was 9.392045455 with a standard deviation of 2.793471275. The distribution had a
kurtosis of 4.404543604 which shows it was a leptokurtic distribution. The distribution
was highly skewed at 1.961207909.
The highest exchange rate realized was 105.275 in Q3 2015. The average exchange rate
was 80.67490909 with a standard deviation of 9.949413704. The distribution had a
kurtosis of -0.120342548 which shows it was a platykutic distribution. The skewness was
0.324987777 showing the distribution was symmetric.
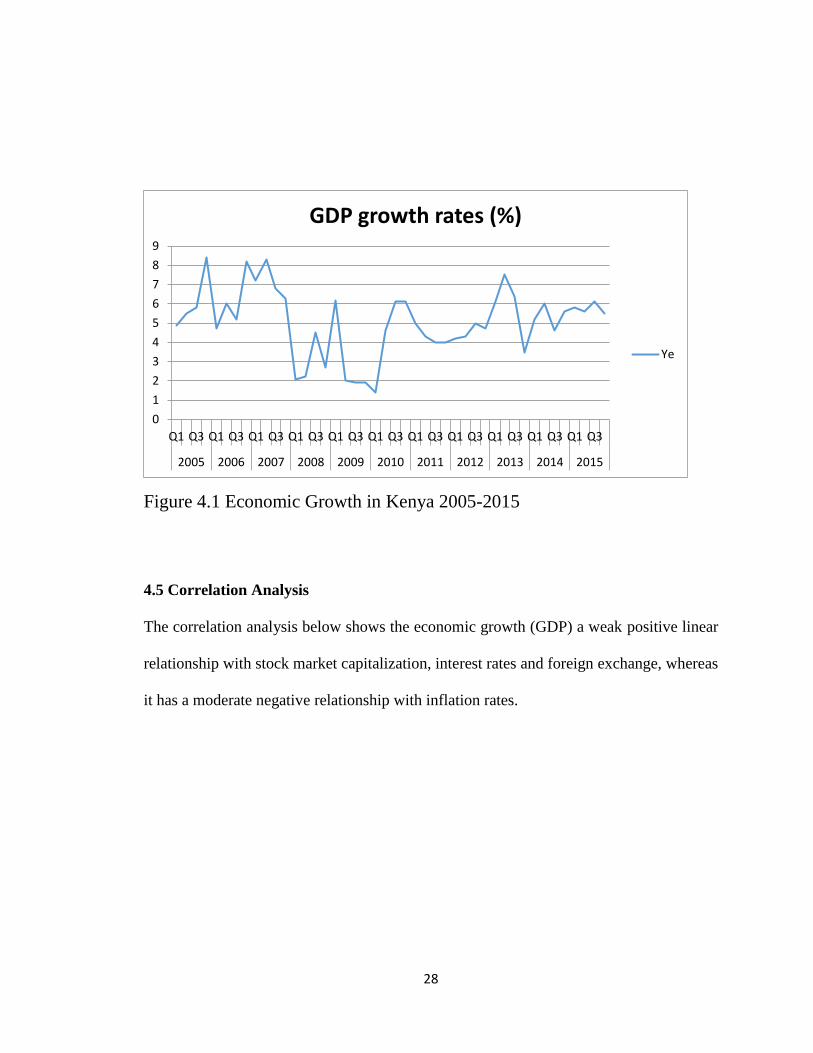
The highest level of GDP growth was 8.4 achieved in 4th quarter 2005. The arithmetic
average growth rate was 5.0545454558 with a standard deviation of 1.743753576 The
kurtosis of the GDPs was -0.151214455 indicating a platykurtic distribution. The
skewness was -0.29499703 which indicated negative skewness.
The financial development rate has additionally been on the upward pattern as appeared
by the graph underneath. The most minimal development rate was 1.4 in Q1 2010. The
most elevated rate was 8.4 in Q4 2005. It is critical that financial development rate hit
nearby essentials between Q1 2008 and Q1 2010.
28
Figure 4.1 Economic Growth in Kenya 2005-2015
4.5 Correlation Analysis
The correlation analysis below shows the economic growth (GDP) a weak positive linear
relationship with stock market capitalization, interest rates and foreign exchange, whereas
it has a moderate negative relationship with inflation rates.
0
1
2
3
4
5
6
7
8
9
Q1 Q3 Q1 Q3 Q1 Q3 Q1 Q3 Q1 Q3 Q1 Q3 Q1 Q3 Q1 Q3 Q1 Q3 Q1 Q3 Q1 Q3
2005 2006 2007 2008 2009 2010 2011 2012 2013 2014 2015
GDP growth rates (%)
Ye

29
Table 4.2 Correlation Results
Ye MC Ir Int Ex
Ye 1
MC 0.068328366 1
Ir -0.49628075 0.252952342 1
Int 0.020196268 0.079547859 0.345723034 1
Ex 0.00982914 0.696435209 ⃰ 0.008601594 0.109711462 1
Significant at 0.05
4.6 Regression Analysis and Hypotheses Testing
The regression was done with the GDP development rates as the needy variable and the stock
market capitalization change, inflation rates, interest rates and exchange rates against US
dollar as the autonomous variable. The table underneath which is additionally in the index
gives an outline of the consequences of the regression. The steady term speaking to the GDP
development rate that is free of the market capitalization was 5.085194149.
Table 4.3 Regression Results
The constant term is 5.085194149 with standard error of 2.319668067.
Coefficients Standard Error t Stat P-value Lower 95% Upper 95%
Intercept 5.085194149 2.319668067 2.192207678 0.034398359 0.393222611 9.777166
MC -0.000356186 0.000608624 -0.585232027 0.561762853 -0.001587245 0.000875
Ir -0.228515786 0.057434704 -3.978705753 0.000291845 -0.34468844 -0.11234
Int 0.131425053 0.090769144 1.447904516 0.155635694 -0.05217287 0.315023
Ex 0.013458128 0.03553126 0.378768658 0.706913916 -0.05841063 0.085327

30
The T-statistic was 2.192207678 (p = 0.034398359). The stock market capitalization
coefficient of the regression was -0.000356186 with a standard error of 0.000608624.
The T value was -0.585232027 (p= 0.561762853) which was insignificant as the p-value
was greater than 0.05. The inflation rates coefficient of the regression was -
0.22851515786 with a standard error of 0.057434704. The T value was -3.97870553 (p=
0.000291845) which was significant as the p-value was less than 0.05.
The interest rates coefficient of the regression was 0.131425053 with a standard error of
0.090769144. The T value was 1.447904516 (p= 0.155635694) which was insignificant as
the p-value was greater than 0.05.
The exchange rate capitalization coefficient of the regression was 0.013458128 with a
standard error of 0.013458128. The T value was 0.378768658 (p= 0.706913916) which
was also insignificant as the p-value was greater than 0.05.
The model was then found to be:
Ye= 5.085194149+0.228515786Ir+e
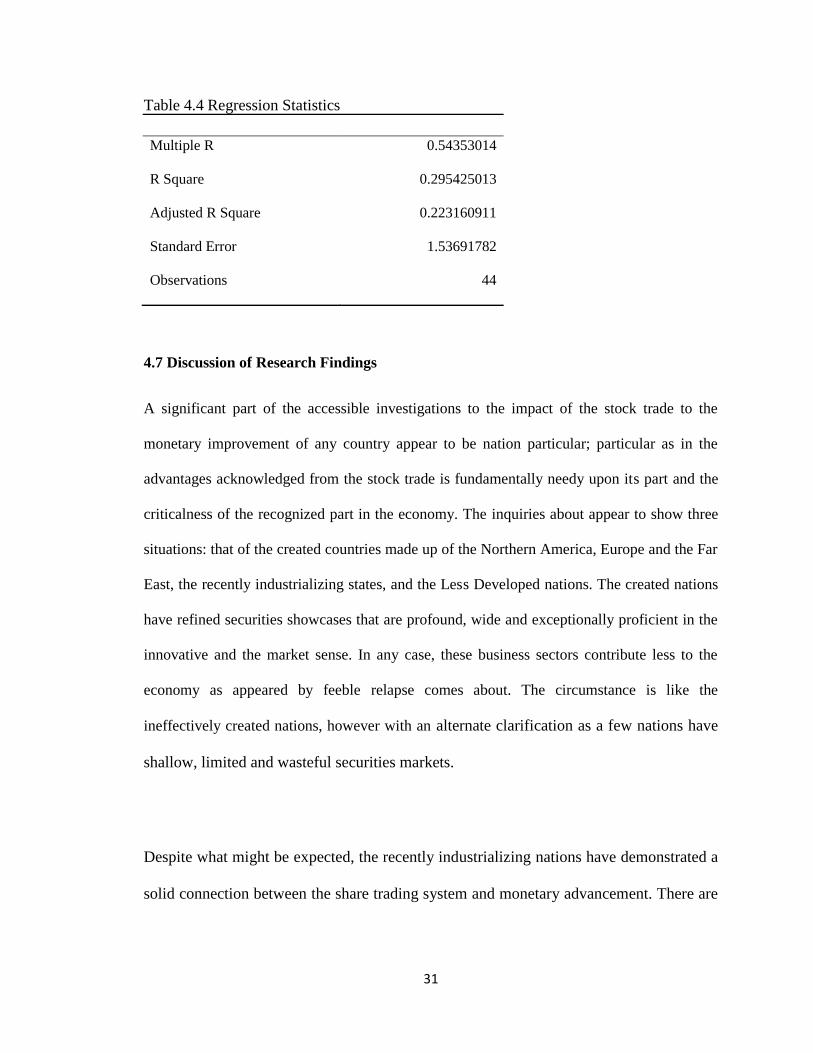
The table below presents the statistics of the regression. The was 29.5425013% which is
an indication that though having an impact the variation in market capitalization did not
explain the full variation in the GDP growth rates-it only explained 29.5425013 %. The
adjusted R square gave a value of22.3160911 %.
31
Table 4.4 Regression Statistics
Multiple R 0.54353014
R Square 0.295425013
Adjusted R Square 0.223160911
Standard Error 1.53691782
Observations 44
4.7 Discussion of Research Findings
A significant part of the accessible investigations to the impact of the stock trade to the
monetary improvement of any country appear to be nation particular; particular as in the
advantages acknowledged from the stock trade is fundamentally needy upon its part and the
criticalness of the recognized part in the economy. The inquiries about appear to show three
situations: that of the created countries made up of the Northern America, Europe and the Far
East, the recently industrializing states, and the Less Developed nations. The created nations
have refined securities showcases that are profound, wide and exceptionally proficient in the
innovative and the market sense. In any case, these business sectors contribute less to the
economy as appeared by feeble relapse comes about. The circumstance is like the
ineffectively created nations, however with an alternate clarification as a few nations have
shallow, limited and wasteful securities markets.
Despite what might be expected, the recently industrializing nations have demonstrated a
solid connection between the share trading system and monetary advancement. There are

32
looks into that show solid relationships and unequivocally critical relapse comes about.
This meant the securities exchanges are noteworthy drivers in such economies.
The target of this examination is to decide the connection between stock market
improvement and financial development in Kenya. The stock market advancement idea
was operationalized by the aggregate stock market capitalization on quarterly basis
recorded. The rate of financial development was caught by the rate of progress in GDP. It
was in this manner accepted that improvement of the stock market is appropriately caught
by increment in the estimation of market capitalization.
In this exploration the relationship between stock market capitalization and GDP
development rate was observed to be 0.000356186 which is not exceptionally solid. This
is inferable from the reality the GDP of a nation is an aftereffect of many factor in a
nation and not simply showcase capitalization. Further, the market capitalization itself is
a consequence of many elements including the inflation rates, exchange rates, interest
rates and others. The capitalization detailed depends on stock costs at the time records are
being readied. Nonetheless, the discoveries demonstrate that there is a co- development
between stock market advancement and monetary development as measured by rate
change in GDP.
In the regression, the consistent term was 5.085194148625 %. This alludes to that level
of monetary development that is achievable in spite of the level of capitalization of the

33
stock, conceivably, may shift because of some different elements not some portion of the
relapse demonstrate utilized for investigation. This esteem had a T-measurement of
2.192207678 of financial development that is autonomous of the market capitalization
variable. It is the (p = 0.034398359) demonstrating that the esteem is measurably critical.
The coefficient term of the regression was -0.000356186 with a T-estimation of -
0.585232027(p=0.561762853). This esteem indicated the amount of monetary
development rate is straightforwardly influenced by the expansion in the estimation of
market capitalization. The criticalness of this term is that it shows that market
capitalization is a noteworthy supporter of the advancement of the country through
financial development. On account of this examination, the commitment is sure. Stock
market is in this manner a supporter of the advancement of the Kenyan economy.
This examination was finished remembering that there were varieties in how monetary
development identifies with advertise capitalization among various nations of the world.
Among the rich countries, the relationship was frail demonstrating the reduced
significance of the securities exchanges in spite of their advanced nature. The less created
nations indicated comparable outcomes, yet with various conceivable clarifications
regarding why that was so. This uncertainty emerges because of a bunch of reasons
including poor record keeping and market wastefulness among different components. The
other classification of nations indicated positive connections between showcase
capitalization and financial development. This was because of the expanded significance
of money markets as a road of monetary development and improvement.

34
This examination has legitimately demonstrated the idea of the connection between the
improvement of the capital market and the level of financial development rate in Kenya
throughout the previous ten years. The outcome is that there is a powerless positive
connection between Market capitalization and financial improvement in Kenya. The
finding of this examination is in compatibility with Omoke (2010), Dorko (2011) and
Ndung'u (2011) who found a powerless connection amongst GDP and Market
Capitalization in Kenya.
As indicated by the information that was gathered, there were two fundamental
wellsprings of increment in the market capitalization: one, the expansion in the quantity
of exchanged stocks in type of new issues and in type of new postings and two, the
increment in the costs of the exceptional stocks. These two gave that there was an
expansion in the sums Kenyans were putting resources into the buy of stocks at the NSE.
The more cash Kenyans contribute on the Nairobi Securities Exchange by buying shares,
the higher the impelled level of financial development rate.
It is however unrealistic to finish up from the investigation whether there is a precisely
characterized circumstances and end results connection between showcase capitalization
and financial development. This is a direct result of the undeniable nature that financial
development is an aftereffect of such a significant number of variables whose causal
consequences for monetary development have not been resolved.

35
CHAPTER FIVE: SUMMARY, CONCLUSSION AND
RECOMMENDATION
5.1 Introduction
This section gives the summary of the discoveries in light of the information
investigation, feature the impediments in the examination and propose suggestion.
5.2 Summary of the findings
This examination was done on firms recorded on the Nairobi Securities Exchange (NSE)
with the expectation of discovering how monetary development was influenced by the
advancements in the level of market capitalization. This exploration was done out of the
hole left by most inquiries about on Kenya that harped such a great amount on the
connection between advertise capitalization, exchanging volume, share costs and Gross
domestic product and the blended finding of comparable looks into that had a tendency to
be nation particular.
The exploration display that was utilized was a relapse investigation that would relate
monetary development and securities exchange advancement. The two factors were
operationalized as a rate with Gross domestic product development rate as an
intermediary for financial development rate and market capitalization as an intermediary
for capital market improvement. The information utilized were gathered from the Nairobi
Securities Trade for the period traversing eleven years from 2005.The invalidate

36
estimation of a recorded association's capitalization was taken as detailed in the money
related records and such esteems added to get the aggregate capitalization for that year.
Examination of the information uncovered that there was a feeble positive connection
between monetary development and Market capitalization. This showed the improvement
of the Kenyan securities advertise as for showcase capitalization had little effect on the
economy. The improvement of this market has experienced posting of more firms,
officially recorded firms assembling reserves through the NSE and financial specialist
enthusiasm for exchanging shares as a technique for putting bringing about higher stock
costs.
5.3 Conclusion
The investigation set up that the improvement of the NSE as measured by Market
Capitalization has a feeble positive relationship on monetary development rate measured
by Gross domestic product development rate. It isn't just a mobilizer of assets for
organizations, yet that, it additionally goads monetary development. This conclusion is
drawn out of the way that there is an expansion in financial development if the estimation
of firms on the Nairobi Securities Exchange increments. As examined before, there are
two primary wellsprings of increment in showcase capitalization, specifically, increment
in the costs of stocks and new postings. Whichever is the source, the importance is that as
more individuals put resources into the recorded firms, so does the financial development

37
rate increments. There could be a solid connection between the exercises of the recorded
firms and financial advancement.
The examination shows that the recorded firms are a piece of the drivers of monetary
development in Kenya. The consolation of all the more posting of firms as an
improvement technique is by all accounts proving to be fruitful as the greater part of the
biggest firms in Kenya are recorded. Different firms that were initially possessed by the
administration of Kenya have additionally been recorded. All the substantial banks,
insurances, pension, large manufacturing firms in Kenya are key players in the stock.
It can likewise be presumed that if more supports are created through the Nairobi
Securities Trade, there could be larger amounts of monetary development. At the point
when the level of market capitalization was low similar to in 2000, so was the financial
development rate. As the level of market capitalization expanded, a sign of its
advancement, the financial development reacted decidedly by additionally expanding.
5.4 Recommendations
It has been contended in this examination that the significance of the stock market can't
be disregarded for it is a noteworthy goad of financial development. This investigation, in
this way, wishes to make the accompanying proposals. Instruments ought to be set up to
strengthen the necessity that the recorded firms work professionally and effectively for
they give an association between the stock market and financial development.

38
The stock market ought to be a very much watched asset dealt with nurture it assembles
assets that drive advancement in Kenya through the recorded firms. Facilitate it ought to
be enhanced to end up noticeably more effective. Like the created securities exchanges,
there is have to put more in innovation that will enhance the working inside the NSE as
an association and one that will prompt more exact and quick spread of data concerning
firms. This will guarantee that assets are activated and assigned in the most proficient
ways.
There ought to be consolation of more firms to come up and list their offers on the
Nairobi Securities Exchange. The examination found that the expansion in advertise
capitalization was, to some degree, because of more firms posting on the Nairobi
Securities Exchange. The Nairobi Securities Trade requests abnormal state of
administration execution and conditions for a firm to stay recorded. The organizations
that are recorded will have a tendency to understand this sort of change as an advantage
of being enlisted. Notwithstanding, those that are not maintaining such measures will
have no other choice than being wiped out. All things considered the assets of the
speculators will be coordinated towards better oversaw firms that will in the end goad
monetary development.

39
To spur stock market capitalization, international investors should be encouraged to
actively participate in the market through technological innovation in regard automated
trading, electronic fund clearance and enhanced stable political environment.
There is moreover need to encourage confidence in the NSE by the CMA through
ensuring transparency and sensible trading trade and overseeing in the stock exchange.
5.5 Limitations of the Study
It is difficult to tell from the investigation whether really the stocks trading system
specifically influences the financial development rate of the nation. What the
investigation basically demonstrates is that the two were moving a similar way amid the
time of concentrate yet has missed the mark regarding demonstrating the association. The
research identified that other economic parameters such as inflation, interest rates and
exchange rates have a significant influence on the economic development. The model
focused on a unilateral direction and not the possibility of a vicious cycle between the
variables under study. This model and the investigation conclusively do not provide
settlement to these issues.
The time of study traverses only eleven years beginning 2005. Amid this period there was
a general upward pattern in both market capitalization and monetary development. It is
not known whether really the connection given by the regression model would be the
same if the period was stretched out to wider period.
40
By the way that a day's cost is utilized to gauge the market estimation of stocks. In fact
the market estimation of stocks continues changing on daily and hourly premise.
5.6 Suggestions for Further Research
Market capitalization changes on daily and on hourly basis. The information used to
record capitalization is the historical data stored by the Capital market Authority on
quarterly releases.
The investigation does not answer the topic of what might be the discoveries if more
regular information through presentation of firm’s financial reports to market players was
utilized to influence the stock market capitalization.
There is need to establish if the relationship between stock market capitalization is causal
and to what extent the association can be quantified.

41
REFERENCES
Andrianaivo, M and Yartey, C.A. (2010). Understanding the growth of African financial
markets. African Development Review, 22(3), 394-418.
Boopen, S, Shalini, T and Sawkut, R. (2009). Financial development and economic
Growth. Journal of Economic Studies, 36(2), 124-134.
CMA. (2016). Cmaorke. Retrieved 28th August, 2016, from
http://www.cma.or.ke/index.php?option=com_content
Denisia, V. (2010). Foreign direct investment theories: An overview of the main FDI
Theories. European Journal of Interdisciplinary Studies, 2(2), 104-110.
Dorko, K. (2012). Relationship between Stock market Development and Economic
Growth in Kenya. An unpublished MBA project, university of Nairobi.
Fama, E. (1970). Efficient Stock markets: A Review of theory and empirical Work.
Journal of Finance, 25, 383-416.
Hongyi, L and Huang, L. (2010). Health, education, and economic growth in East Asia.
Journal of Chinese Economic and Foreign Trade Studies, 3(2), 110-131.
Jorgenson, D.W. (2005). Growth accounting, in handbook of economic growth. Eds.: P.
Aghion and S. Durlauf, Amsterdam: North-Holland Elsevier Publishers.
Khorasgani, M.F. (2008). Higher education development and economic growth in Iran.
Education, Business and Society: Contemporary Middle Eastern Issues, 1(3),
162-174.

42
KNBS. (2016). Knbsorke. Retrieved 26th August, 2016, from
www.knbs.or.ke/index.php?...economic...economic...
Kothari, C. (2004). Research Methodology: Methods and Techniques (2nd Ed.). New
Delhi: New Age Publishers.
Kuznets, S. (1955). Toward a theory of economic growth, national policy for economic
welfare at home and abroad, R. Lekachman, ed. Garden City, Doubleday and Co.
Levine, R. and S. Zervos, (1996), ‘Stock Market Development and Long-Run
Growth,’ World Bank Economic Review, Vol 10(2), pp 323-339.
Mahdi, F.K. (2008). Higher education development and economic growth in Iran.
Education, Business and Society: Contemporary Middle Eastern Issues, 1(3),
162-174.
Maranga, G. (2013). The Relationship between Stock market Returns and Economic
Growth in Kenya. An unpublished MSc Finance project, university of Nairobi.
Masoud, N and Hardaker, G. (2012). The Impact of financial development on economic
growth. Studies in Economics and Finance, 29(3), 148-173.
Mishkin, F. (2004). The Economics of Money, Banking, and Financial Markets (7th Ed).
Boston: The Addison-Wesley Publishers.
Mishkin, F and Eakins, S. (2012). Financial Markets and Institutions (7th Ed.). Boston:
Pearson Education, Inc.
Musebe, C. (2015). Effect of Firms’ Market Capitalization on Stock Market Volatility of
Companies Listed at the Nairobi Securities Exchange. An unpublished MBA

43
project, university of Nairobi.
Naik, P.K & Padhi, P. (2015). On the Linkage between stock market development and
economic growth in emerging market economies. Review of Accounting and
Finance, 14(4), 363-381.
Omoke, J. (2010). The Relationship between Stock market Development And
Economic Growth in Kenya. An unpublished MBA project, university of Nairobi.
Ross, S, Westerfield, R, and Jordan, B. (2013). Fundamentals of Corporate Finance (10th
Ed.). New York: McGraw Hill Irwin.
Sehrawat, M & Giri, A.K. (2015). Financial development and economic growth:
Empirical Evidence from India. Studies in Economics and Finance, 32(3), 340-
356.
Sharma, D. (2016). Nexus between financial inclusion and economic growth. Journal of
Financial Economic Policy, 8(1), 13-36.
WorldBank. (2016). Worldbankorg. Retrieved 26th August, 2016, from
http://www.worldbank.org/en/country/kenya/overview
Zikmund, W, Babin, J, Carr, J and Griffin, M. (2010). Business Research Methods (8th
Ed.). USA: South Western College Publishers.
44
APPENDIX:
DATA COLLECTION SUMMARY
Year Quarter Ye MC Ir Int Ex
2005 Q1 4.9 326.924 14.319847 10 74.803
Q2 5.5 420.729 14.206284 10 76.681
Q3 5.8 449.795 7.5491612 8.75 74.103
Q4 8.4 462.475 4.4252262 9.75 73.107
2006 Q1 4.7 484.176 8.429678 9.75 72.281
Q2 6 623.204 4.3276357 9.75 73.405
Q3 5.2 726.971 4.876222 10 72.866
Q4 8.2 791.58 6.5867967 10 69.627
2007 Q1 7.2 696.917 3.3521541 10 69.293
Q2 8.3 743.906 2.7135854 8.5 66.575
Q3 6.8 791.66 5.3447417 8.75 67.024
Q4 6.3 851.133 5.6317592 8.75 63.303
2008 Q1 2.1 797.281 10.488606 8.75 64.924
Q2 2.2 1230.677 17.437408 9 63.783
Q3 4.5 972.267 15.880101 9 71.409
Q4 2.7 853.88 16.573286 8.25 78.04
2009 Q1 6.2 689.045 14.135656 8 80.261
Q2 2 821.762 10.603761 8.25 77.851
Q3 1.9 771.612 9.7564248 7.75 75.605
Q4 1.9 834.165 7.9788065 7 75.431
2010 Q1 1.4 983.117 5.5350311 6.75 76.947
Q2 4.6 1108.654 3.6741751 6.75 81.018
Q3 6.1 1173.698 3.3294584 6 80.912
Q4 6.1 1166.992 3.8433801 6 80.568
2011 Q1 5 1090.212 7.049091 6 84.206
Q2 4.3 1121.44 13.162907 6.25 89.049
Q3 4 885.571 16.512499 7 96.357
Q4 4 868.241 19.187037 18 86.663
2012 Q1 4.2 940.796 16.857365 18 82.897
Q2 4.3 1048.717 11.765479 18 84.789
Q3 5 1155.988 6.3727404 13 84.613
Q4 4.7 1272.002 3.5257315 11 85.994
2013 Q1 6.1 1599.798 4.078618 9.5 85.818
Q2 7.5 1618.27 4.3668514 8.5 85.488

45
Q3 6.4 1790.854 6.9956242 8.5 87.413
Q4 3.5 1920.718 7.4223963 8.5 86.309
2014 Q1 5.2 2000.473 6.7756996 8.5 86.489
Q2 6 2106.691 7.0334453 8.5 87.612
Q3 4.6 2295.95 7.53679 8.5 88.836
Q4 5.6 2300.054 6.1764718 8.5 90.444
2015 Q1 5.8 2444.829 5.8166511 8.5 91.727
Q2 5.6 2301.879 6.9943212 10 97.705
Q3 6.1 2063.644 6.1420532 11.5 105.275
Q4 5.5 2049.539 7.3512101 11.5 102.195
Descriptive Statistics
N Range Minimum Maximum Sum Mean
Statistic Statistic Statistic Statistic Statistic Statistic Std. Error
Ye 44 7 1 8 223 5.07 .263
MC 44 2118 327 2445 51651 1173.89 89.572
Ir 44 16 3 19 372 8.45 .691
Int 44 12 6 18 412 9.36 .430
Ex 44 42 63 105 3549 80.66 1.496
Valid N (listwise) 44

46
Descriptive Statistics
Std. Deviation Variance Skewness Kurtosis
Statistic Statistic Statistic Std. Error Statistic Std. Error
Ye 1.744 3.042 -.467 .357 -.103 .702
MC 594.153 353017.359 .787 .357 -.556 .702
Ir 4.582 20.998 .879 .357 -.409 .702
Int 2.854 8.144 1.872 .357 3.896 .702
Ex 9.923 98.462 .313 .357 -.149 .702
Valid N (listwise)
Regression
Variables Entered/Removeda
Model Variables
Entered
Variables
Removed
Method
1 Ex, Ir, Int, MCb . Enter
a. Dependent Variable: Ye
b. All requested variables entered.
Model Summary
Model R R Square Adjusted R
Square
Std. Error of the
Estimate
1 .559a .312 .242 1.519
a. Predictors: (Constant), Ex, Ir, Int, MC

47
ANOVAa
Model Sum of Squares df Mean Square F Sig.
1
Regression 40.865 4 10.216 4.431 .005b
Residual 89.930 39 2.306
Total 130.795 43
a. Dependent Variable: Ye
b. Predictors: (Constant), Ex, Ir, Int, MC
Coefficients
Model Unstandardized Coefficients Standardized
Coefficients
t Sig.
B Std. Error Beta
1
(Constant) 4.542 2.291 1.982 .055
MC .000 .001 -.105 -.509 .614
Ir -.230 .056 -.603 -4.097 .000
Int .104 .088 .170 1.186 .243
Ex .023 .036 .131 .648 .521
a. Dependent Variable: Ye

48
Tests of Normality
Kolmogorov-Smirnova Shapiro-Wilk
Statistic df Sig. Statistic df Sig.
Ye .181 44 .001 .922 44 .006
MC .182 44 .001 .892 44 .001
Ir .221 44 .000 .874 44 .000
Int .253 44 .000 .784 44 .000
Ex .078 44 .200* .978 44 .551