relationship- based...
TRANSCRIPT

RELATIONSHIP-
BASED
MONITORING
Douglas Stevenson CAMS

1 | P a g e
CONTENTS
Introduction……………………………………………………………………………………………………..2
Section 1 – Current Profile of Transaction Monitoring Systems and Why They Are
Ineffective…………………………………………………………………………………………….............4
Section 2 – Bad Data Kills Compliance……………………………………………………………….6
Section 3 – The Transactions Are Trying to Tell You a Story. Are You Listening?...8
Section 4 - Getting to A "Relationship View"……………………………………………………10
Section 5 - Wholesale Changes to Monitoring Vendor Landscape…………………….15
Section 6 – Benefits of Relationship-Based Monitoring……………………………………16
Conclusion………………………………………………………………………………………………………17
2 | P a g e
Relationship-Based Monitoring
Introduction
It is no secret that our global financial institutions are being used to launder money. The scale of
how much money is being laundered is sobering: In 2009 The United Nations Office on Drugs and
Crime (UNODC) conducted a study to determine the magnitude of illicit funds generated by drug
trafficking and organised crimes and to investigate to what extent these funds are laundered.
The report estimated that criminal proceeds amounted to 3.6 percent of global GDP, with 2.7
percent (or $1.6 trillion) being laundered. (Forbes Insight "DON’T BLAME THE TRANSACTION
MONITORING SYSTEMS", 2017, p. 3) That was 8 years ago. The numbers are likely more
depressing today in 2017.
When you consider the beneficiaries of successful money laundering are drug lords, organized
crime, weapons dealers, terrorists and human traffickers… in essence the worst of the worst
people in our society… there has to be a recognition that we as an industry can do better. We
need to do better.
In the same UNDOC study it was suggested that roughly “70% of illicit finance flows through
legitimate financial institutions and that less than 1% is seized and frozen”. (Forbes Insight
"DON’T BLAME THE TRANSACTION MONITORING SYSTEMS", 2017, p. 3) Again… sobering.
Suspicious Activity Reports/Suspicious Transaction Reports (SAR/STR) are intended to arm law
enforcement with the initial alarm bell that something does not seem right. Using the UNDOC
statistics that suggest that less than 1 percent of illegal funds are seized and frozen is it fair to
suggest that the SARs/STRs being generated are ineffective? Is the information being shared with
law enforcement incomplete/ineffective? Are the SAR narratives too benign and do not contain
enough compelling information to invite further inspection?
SARs/STRs are written as a result of an investigation of an alert triggered by a financial
institution’s transaction monitoring system (TMS). Traditional TMS are rule-based and take into
consideration things that are known or have been seen in the past. The issue with this is that the
bad actors know what the typologies are (what’s being monitored for) and adjust their behavior
accordingly. It is a constant game of cat-and-mouse, much like highway patrolmen and speeders
with radar detectors. Simply put, the TMS’ biggest limitation is that it only takes into
consideration a moment in time… the transaction …with no broader context of what other
entities might be related to the transaction.
The intent of this paper is to explore how Relationship-Based Monitoring can improve the
effectiveness of our financial institutions’ efforts in IDENTIFYING AND REPORTING on behavior
that exposes a broader set of relationships involved in money laundering. In preparing this paper
there were a total of 9 financial institutions interviewed: 5 global systemically important banks

3 | P a g e
(GSIB), 2 broker dealers, 1 super-regional bank and 1 regional bank. The author of this paper is a
is a Certified Anti-Money Laundering Specialist (CAMS) with more than 15 years of experience in
the industry serving the banking, capital markets and asset management companies in the areas
of AML, enterprise compliance, quantitative strategies and fraud management. In his current role
he leads a team of professionals to address the challenges in financial crimes and compliance
providing both business and technology guidance.
4 | P a g e
Section 1 – Current Profile of Transaction Monitoring Systems and Why They Are
Ineffective.
Traditional transaction monitoring systems (TMS) are ineffective. There,
I said it.
Inflammatory statement? Yes. Defensible? Yes.
The majority of financial institutions interviewed have their TMS’s configured as account centric
monitoring. There are many reasons why this is the case however the most common reason given
is that an accurate holistic view of the customer does not exist so they are forced to monitor at
the account level. The issue with account centric monitoring is that it simply does not tell the
entire story.
What do today’s TMS’s do well? Time.
TIME: TMS’s look at a moment in time, the transaction, and compare it against a list of pre-set
rules. The majority of financial institutions monitor on an account-centric basis which means that
the alerting behavior of the TMS will only fire off when an account “breaks a rule.” A good
example is rapid movement of funds in an account: Account 123456 has a credit of $15,000 and
almost immediately has 8 different debits that total the same $15,000. That scenario would
trigger an alert and would likely yield an investigation.
What do today’s TMS’s do poorly? Patterns and Context.
PATTERNS: Using a similar example, let’s look at the same $15,000. Instead of one $15,000
transaction, there are 15 bank customers who all wire $1,000 to the same external entity. In an
account-centric view, this behavior would be missed. The TMS would simply see an individual
transaction of $1,000 and not alert. Should you know what this external entity is? Probably. In
the context of this $15,000 scenario, the external entity has a relationship with 15 of your
customers.
As Rob Mara stated in his interview with Forbes Insight, “Being able to use analytics to start to
identify patterns in a broader sense, or understand interactions. Recognizing splitting or merging
type behaviors that’s an indication that something unusual may be happening. You can say, ‘Hey,
15 of my customers all transferred money to the same external entity outside my bank –what do
I know about that entity?’” (Forbes Insight "DON’T BLAME THE TRANSACTION MONITORING
SYSTEMS", 2017, pp. 14-15)
CONTEXT: In the above $15,000 scenario a pattern has been detected and a common point, or
“common nexus” has been identified. What today’s TMS will not provide is context about that
particular nexus. The presence of a nexus does not necessarily indicate suspicious activity
however it is interesting and should be looked at. There may be a viable reason for the nexus to

5 | P a g e
exist however a TMS is unlikely to identify it because of the limitations of an (1) account-centric
view on (2) a moment in time.
Having proper context about what is going on is key to any investigation, especially when this
particular $15,000 scenario could be high volume deposits into a funnel account. Human
trafficking? Maybe. Suffice it to say that this scenario would absolutely warrant further
investigation because the detected pattern does not pass the “reasonableness test.” The point
here is that without visibility into the patterns, you would not be prompted to look for context.
This entire $15,000 scenario would have been missed entirely.
6 | P a g e
Section 2 – Bad Data Kills Compliance.
Data Quality continues to be the main reason for killing compliance. “Bad
data kills compliance” – ACAMS survey 2015
Nearly 100 percent of the financial institutions interviewed shared that poor data quality was
one of the key reasons cited for (1) inefficient monitoring systems and (2) high operating costs
across the Financial Crimes and Compliance (FCC) operating model. When taking into
consideration that bad actors know how to evade detection by hiding their identity and behavior,
and combining this with the pre-existing poor data quality issues faced by the banks, what’s left
is a breeding ground of opportunity for money launderers. Bad data kills compliance but it does
not have to!
Poor data quality is the root cause cited for banks that do not have a holistic view of their
customers. Not having a holistic view has operational impacts, such as high rates of false positive
alerts and false negative scenarios. Richard Stocks, Global Chief Technology Officer of Financial
Crimes at Pitney Bowes, was quoted in a recent Forbes Insight interview as saying “the lack of
holistic customer view (account centric monitoring) has two limitations:
“One is that bad behavior is simply missed. This is referred to as a false negative. EXAMPLE:
money laundering or terrorist financing happened and the bank’s systems, processes and
controls didn’t catch it. For example, a single party transferring money through several accounts,
even legitimately generates multiple alerts. If money laundering transactions appear legitimate
and aren’t obviously related, the subsequent investigations may give them a pass because they
missed the bigger picture. That’s when the banks are open to regulatory fines because they’re
now out of compliance.”
“The second thing is the rate of false positives 95%-98%. That means that for every 100,000 alerts
that are generated, roughly 95,000 are benign, wasteful and wasting investigator’s time.” (Forbes
Insight "DON’T BLAME THE TRANSACTION MONITORING SYSTEMS", 2017, p. 4)
Viewed through a different lens: consider that there are 8 working hours in a day. That equates
to 480 working minutes in a day. When you run the math that means that 456 minutes are wasted
every day. How many investigators does your bank have? Apply a little more math and the
numbers get depressing.
An interview with a U.K.-based global systemically important bank suggested that the lack of a
holistic customer view and the resulting account-centric monitoring had negative impacts on
both Qualitative (compliance) and Quantitative (operating expense).
Qualitative: Because the bank does not have a holistic view of the customer, they do not
have the ability to look at aggregate behavior. Because of this, the bank is forced to set

7 | P a g e
TMS thresholds low to defend against false negatives. The bank’s monitors view this as a
negative and therefore the bank low marks with respect to the qualitative measure of its
monitoring program. The result of this has been multiple MRAs and consent orders.
Quantitative: When the bank protects itself against false negatives, the TMS thresholds
are set low. The result is a higher instance of false positives… which means more
investigations… which means more investigators… which means more operational
expense.
If a lack of a holistic view of your customer is forcing you into account-centric monitoring, you
are broken both qualitatively and quantitatively. Given that, I would submit that your TMS is
ineffective as currently deployed.
8 | P a g e
Section 3 - The Transactions Are Trying to Tell You a Story. Are You Listening?
What’s your story?
Data that flows through a financial institution on a daily basis is loaded with useful information,
however it is almost never used. Transactions tend to hold the most relevant and recent
information, especially when we are ultimately trying to get to a relationship view. In addition to
transactions, there is a treasure chest of entity information flowing through financial institutions
in the form of:
o details in a wire transfer
o scans of passport
o front and back of check images
o driver’s license images
o mortgage apps
o subpoenas
o etc...
This information not only provides context about an entity but also exposes a broader set of
relationships. For example: information contained in free-form text in the memo section of the
wire where Party A is the originator, Party B is the receiver and in the notes field it states that the
funds are for the “beneficiary called Party C.” In the past accessing this data and making it useable
was not possible however there is now technology available that can extract this information,
normalize/standardize it and make it ready for use by FCC professionals.
Operationally having this capability has impacts beyond compliance. Banks purchase massive
amounts of referential data to help enrich customer profiles without first looking internally. This
is likely due to a combination of lack of time and resources. However if there were efforts to
properly mine the “free data” first, the costs savings would be massive.
To reiterate an earlier point, having usable data is a key component when identifying the “long
tail” of PII. It is this long tail of information that exposes relationships and networks of individuals.
Bad actors seldom work alone. Shell companies, funnel accounts, intermediaries, fraud rings…
they all can be exposed through looking at the long tail of entity information. It starts with
accessing the data from within your own walls, standardizing/normalizing the data, applying
matching algorithms, putting it into a graph database and viewing the results. The transactions
and the data within your organization are truly trying to tell you a story… are you listening?

10 | P a g e
Section 4 - Getting to A "Relationship View"
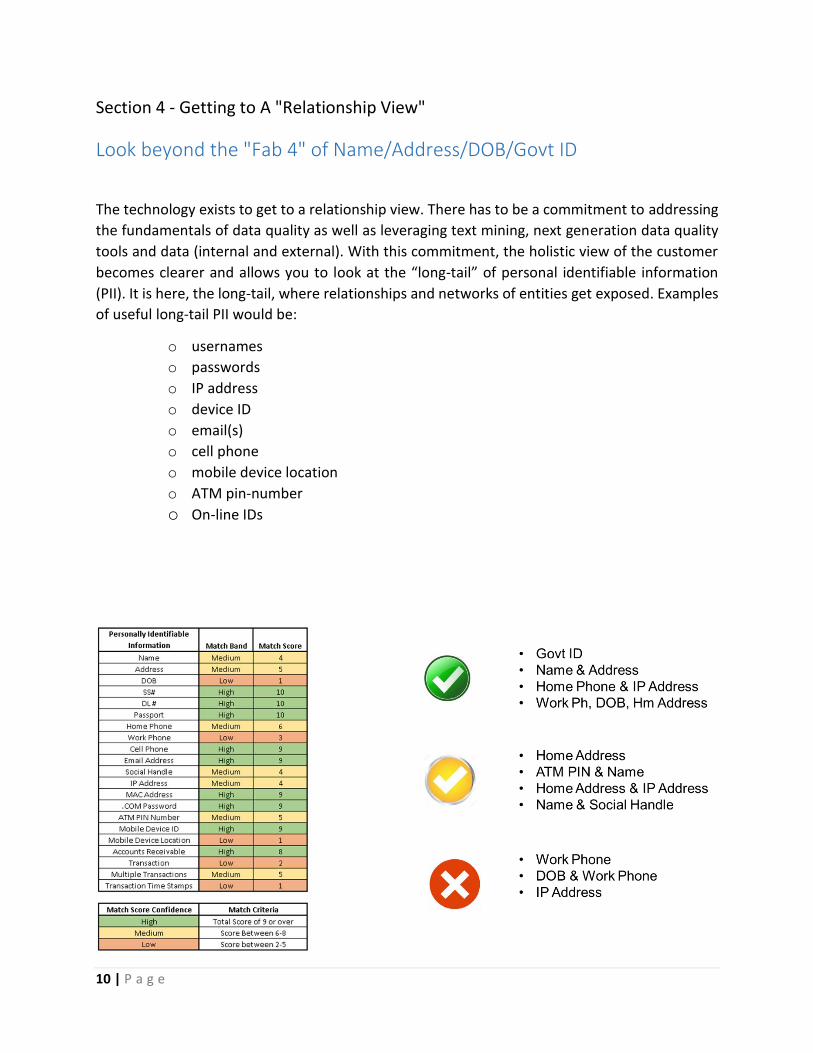
Look beyond the "Fab 4" of Name/Address/DOB/Govt ID
The technology exists to get to a relationship view. There has to be a commitment to addressing
the fundamentals of data quality as well as leveraging text mining, next generation data quality
tools and data (internal and external). With this commitment, the holistic view of the customer
becomes clearer and allows you to look at the “long-tail” of personal identifiable information
(PII). It is here, the long-tail, where relationships and networks of entities get exposed. Examples
of useful long-tail PII would be:
o usernames
o passwords
o IP address
o device ID
o email(s)
o cell phone
o mobile device location
o ATM pin-number
o On-line IDs

11 | P a g e
To date most financial institutions we interviewed do not have this relationship view because (1)
the data quality is too poor and (2) the systems that contain the long tail information weren’t
designed to communicate. As previously stated, there is technology available that can overcome
these hurdles that include:
Matching technology plays a key role in solving for the relationship view. In order to maximize
the efficacy of matching there needs to be focus on the quality of data that flows into a matching
engine. The observations made during interviews is that data quality and entity resolution are
“old concepts” and should be handled by internal IT. Given that every bank, every conference,
every webinar, every industry expert still talks about how data quality continues to kill
compliance, I don’t think this is an “old concept” at all. I would submit that the technology
landscape has evolved to where today the capabilities exist to account for the deficiencies of the
data stored in source systems and perform data quality, entity resolution and entity enrichment
on the fly such that it has the look and feel of an appliance purpose built for the intended use
case. In this instance, the intended use case is creating a Global Network ID (GNID), meaning that
I have grouped entities together and assigned that group an ID (GNID) for inspection later in the
monitoring process.
Deliberate obfuscation of an identity is incredibly difficult for most organizations to deal with. 80
percent of the world’s data has been created in the last two years! Banks need to get smarter at
how they use the data available to link commonalities. Solutions exist out there and there are
some very smart technologies. People are getting smart at how to get around these linkages but
technology is far smarter; let’s use it to help us.
The one thing that relationships and networks of entities can’t hide from is their commonality.
There is always a connection, albeit difficult to find. It is the obfuscation and the recognition that
the banks don’t deal well with this, where the bad actors manifest in the form of synthetic ID’s,
fraudsters, Ponzi schemes, crooked employees, shell companies, etc… Today there are financial
institutions who have deployed new technologies such as graph databases, advanced matching
algorithms, machine learning and next generation data quality tools to solve for the challenge of
the relationship view.
12 | P a g e

13 | P a g e
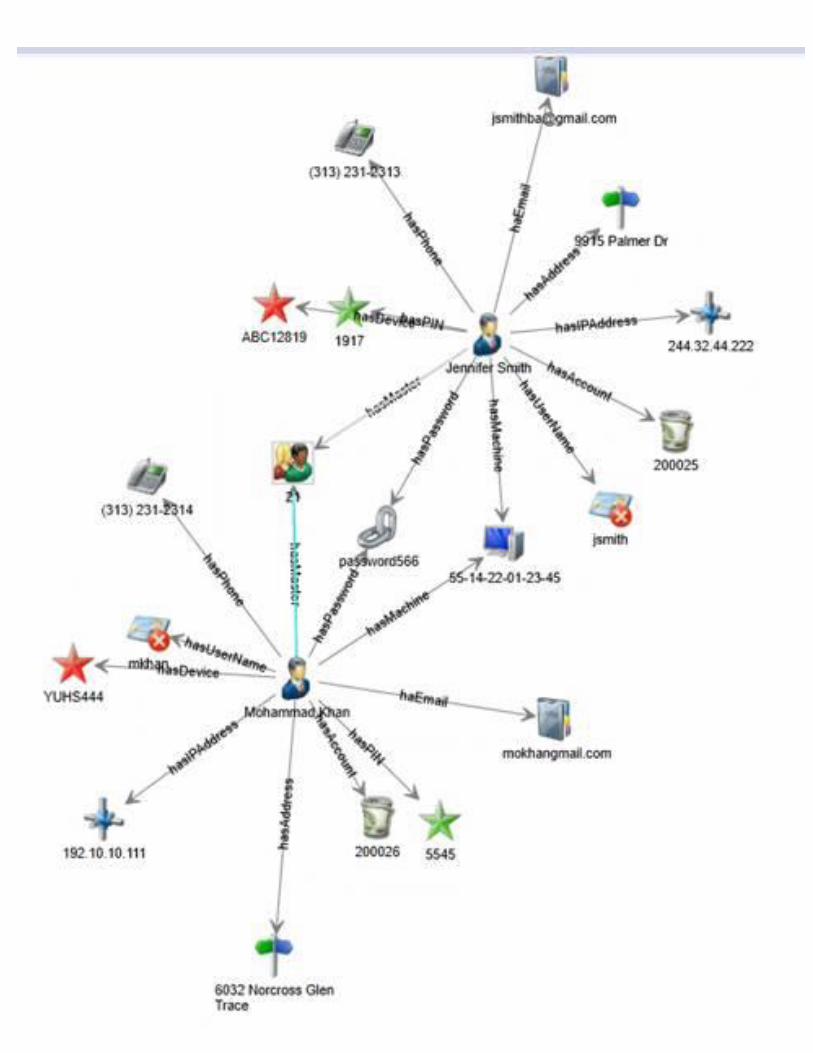
The figure above helps demonstrate why the use of additional data within our corporations is so
pivotal to improving the way we monitor our business. As previously highlighted, understanding
relationships and identifying common nexus points is required, but how do we get there? For
years IT departments have understood the need to use data more broadly however because of
technology constraints these needs have been largely disregarded. The trend that seems to be
emerging based on interviews for this paper is for financial institutions to create data lakes where
all the transaction, client and account data reside… the issue is that they don’t know how to use
it. Today we have the ability to use technology and analytics to understand both the structure
and context of this data allowing for comparisons to be derived, meaning that previous
constraints can be overcome.
This example shows how the use of data points such as IP addresses and passwords can be used
to draw links between two entities that were originally considered independent. By using this
data it is now clear these two entities are actually the same which allows us to begin to build this
common nexus. It also helps to understand the patterns of transactions now that we know this
is the same entity.
14 | P a g e
Section 5 - Wholesales Changes to Monitoring Vendor Landscape
“I can’t hear what you are saying because your actions speak too loudly”
We have already made the point that traditional rules-based transaction monitoring tools are
incapable of delivering the type of relationship monitoring that has been presented in this paper.
What is needed is a wholesale change to the monitoring landscape and how banks think about
their surveillance techniques.
One financial institution we interviewed is using an approach called “Common Nexus.” Common
Nexus is a technique where a graph database is being used to identify and visualize nexus points
that were previously unknown using quantitative techniques such as distance, between-ness and
centrality to determine where outliers exist in any given portfolio. Essentially what is taking place
is that there is no TMS and there are no rules. The entire transaction portfolio and holistic
customer view portfolio is loaded into a graph database. The graph will visually represent the
relationships (obvious and non-obvious) and identify nexus points that are unlike the statistical
norm of the population.
A useful analogy here would be to think of Capital Markets and an equities-based basket-
momentum day trading application. This application would watch a portfolio of instruments for
the first few hours of the day and allow it to define its own statistical “normal” based on volume
weighted average price (VWAP) and time weighted average price (TWAP). By leveraging Bollinger
Bands (upper and lower-based on moving averages) a buy/sell signal gets generated when any of
the instruments deviates from its own normal and crosses the bans. Simply put, I only care about
this portfolio when any of its instruments deviates from normal. What does this mean? It means
that because I know what good looks like and I only want to be alerted on the bad.
Another less sophisticated analogy would be looking at your own children and their potentially
suspicious behavior. I have two daughters aged 20 and 18… I know when they are up to no good
simply by watching their body language and the way they walk through the house. They don’t
have to say a word. I know this because I have a deep appreciation of their “normal.” When you
know what good looks like, bad sticks out like a bright star at night.
Imagine a next generation TMS that has no rules or thresholds. You simply look at a portfolio and
let it define its own “statistical normal” based on the behavior of the entities. At the same time,
because you have done the work of creating a holistic view of your client base, relationships will
be detected. These relationships (networks) can now be monitored with this next generation
TMS by establishing a statistical norm and alerting when deviations occur.
Rules-based TMS’s don’t give you the visibility you need. They are too binary and contain no
context. Let the behavior of your customer, taken in a broader context, define what is their

15 | P a g e
unique “norm.” As the old saying goes, “I can’t hear what you are saying because your actions
speak too loudly.”
16 | P a g e
Section 6 – Benefits of Relationship Based Monitoring
As discussed earlier in this paper, the simplest way to explain the benefits of relationship-based
monitoring is to break into two primary areas: (1) Qualitative and (2) Quantitative.
Qualitative – Put in its simplest form, the better visibility you have into a given portfolio, the
more precise you can be with your monitoring activities. When looking at a relationship
view, it allows you to get out ahead of previously difficult typologies and become proactive.
Using the analogy of driving a vehicle, traditional monitoring forces you to always look in the
rearview mirror. You only see things that have happened in the past. Using a relationship-
based approach allows you to look through the windshield at what is out in front of you. You
will know what your customers’ Bollinger Bands are and when they are trending toward a
deviation from normal.
With the emergence of machine learning and artificial intelligence tools, there is an
opportunity to enhance the analytics being applied to support the identification of:
o funnel accounts
o Human Trafficking
o CFT
o Ponzi schemes
o crooked employees
o fraud
o shell Companies
Quantitative – Using a relationship-based approach will see reductions in operational costs
across the entire FCC operating model, most dramatic will be in the investigative unit.
Context is what is missing with a traditional transaction monitoring alert. It takes an
investigator time to collect the relevant data points to provide the context in support of
his/her investigation. Having a relationship view provides the context and helps tell the
broader story around an alert. This would translate into less time spent during an
investigation and getting to a file/don’t file decision faster. Additionally, a relationship view
provides the ability to group like alerts which translates into less investigations. EXAMPLE:
If I can group 6 alerts together because I know they are part of the same set of transactions,
I can feed this grouping into case management where it can be routed to 1 investigator
rather than potentially 6.
17 | P a g e
Conclusion
Don’t blame your TMS. The real issue is with the poor quality of the data that is flowing
into monitoring platforms. This is not a new issue yet it continues to be pushed onto the
back burner and is the root cause for compliance challenges.
Think in terms of relationships, not transactions. Transactions provide the foundation of
a good story however they are incapable of telling the entire story.
The information flowing through our financial institutions contains the information that
is needed to identify the bad actors in our society… the ones who are filling our streets
with drugs, arming our criminals with guns, trafficking innocent people and who are trying
to kill us. We, as a brotherhood/sisterhood of FCC, owe it to society to do better. We can
do better. We must do better.