rejuvenation of traditional pottery making by applying … 2007-39.pdf · technology systems...
TRANSCRIPT

DEPARTMENT OF SCIENCE AND TECHNOLOGY
TECHNOLOGY SYSTEMS DEVELOPMENT PROGRAM
PROJECT PROGRESS REPORT
DST File No : DST/ TSG/ TC/ 2007/ 39
Title: Rejuvenation of Traditional Pottery making by
applying Advanced Biotechniques
Submitted by
Dr.A.J.A.RANJITSINGH
PRINCIPAL
Department of Zoology,
Sri Paramakalyani College,
Alwarkurichi, Tamilnadu – 627412
Email: [email protected]

CONTENTS
1. Project format 1
2. Objectives Met Details 2
3. OBJECTIVES -I 3
A. Brief Account of objective
B. Details of Achievement
B1. Models of Earthernware storage system
B2. Structure of Earthernware designed for storage
4. OBJECTIVES -II 11
4.1 Biochemical characteristics
4.2 Organoleptic qualities
4.3 Physiological weight changes
4.4 Microbiological studies
5. OBJECTIVES – III 43
Analysis of various elements in the soil used to prepare pottery products
6. OBJECTIVE –IV 48
Isolation and identification of microbes in soil used to make pottery
products
7. OBJECTIVE – V 53
Incorporation of herbal powder and microbes in pottery products
8. Mile stones fixed and achieved 56
9. Deviation if any 56
10. Conclusion summarizing the achievements and indications of
scope for future
56
11. Science and technology benefit accured 58
1. List of publication
2. Manpower trained
3. Patents taken
4. Replication potential
5. Linkages developed

1
PROJECT COMPLETION REPORT
1. DST File No : DST/ TSG/ TC/ 2007/ 39
2. Project Title : Rejuvenation of traditional pottery making
by applying advanced biotechniques
3. Principal Investigator : Dr.A.J.A.Ranjit Singh
4. Date of commencement : 01.12.2008.
5. Planned date of completion : 01.12.2010.
6. Actual date of completion : 31.03.2011.
7. Implementing Institution : Sri Paramakalyani College
8. Objectives stated in the proposal and met:
Objectives Objectives met
1. Development of different prototype models for zero
energy cooling chambers, (EPCC) and other utensils.
2. Evaluation of Organoleptic, biochemical analysis and
shelf life period of consumables kept at the prototype
EPCC.
3. Analysis of various elements in the soil to test their
qualities.
4. Isolation of microbes in different soils to process soil and
to make Varieties of pots.
5. Incorporation of effective microbes in herbal product and
pottery product, training to the artisans

2
OBJECTIVES MET DETAILS
A. BRIEF ACCOUNT
Development of different prototype models for zero energy coolly chamber and
other utensils
Low cost earthenware
storage chambers
1. Zero energy cool chambers to store vegetables and fruits for
kitchen use were developed. Five types of storage chambers
were developed and their efficacy to store different fruits
and vegetables were tested.
2. Organoleptic qualities, Biochemical qualities and shelf-life
period were tested over time for the various stored products
and these characteristics were compared with refrigeration.
3. Earthenware storage chamber that retained the expected
results were promoted for bulk production by pottery
artisans in the nearby places.
Production of value
added kitchen utensils
By using a different methods for clay preparation
Micro-oven usable clay pottery products were developed so
as to use them in modern kitchen. (Bowls, pots). The fuel
efficiency was tested with other micro oven usable vessels.
Frying pans, idly pans, dosa taa, tea cups, attractive water
storage bottles, mugs, table water pots (12 items) were
prepared and their qualities were tested. To prepare these
products black pottery technology was developed and used.
As these products have good market value, we have trained
the artisans to manufacture these products to earn a good
income.
Ornamental / cosmetic
products designing
and development.
To earn a good income from a small amount of clay,
technologies were developed to prepare several ornamental
items like neck chain, ear studs, bracelets etc. The local women
potters were trained. These products have a good demand and
an avenue for bulk selling is looked into.
Alternative to
conventional items –
Novel products from
clay were designed
and developed so as to
sell them for good
price.
Decorative bells-Vasthu bells making different sounds.
Clay distillation units.
Magic clay kettle.
Clay religious products.
Light shades.
Music instruments (Racho).

3
B. DETAIL OF ACHIEVEMENT OF OBJECTIVE – I
1. DESIGN AND DEVELOPMENT OF EARTHENWARE ZERO
ENERGY STORAGE SYSTEM (EWSS)
1.B.1 INTRODUCTION
Storage of post-harvested products at a mass scale or home hold level till it decorates
table, become necessary to avoid spoilage. Microbial spoilage paves way for much food-
borne illness. Further deterioration of biochemical and Organoleptic qualities in fruits and
vegetables due to improper preservation lead to poor taste and consumer’s rejection. All
home makers feel happy and get rid of kitchen stress if they get fruits and vegetables afresh
every day. As getting time is difficult to go for shopping at every day morning for employed
couples, weekly purchase and storage of fruits and vegetables has become an order of the
day. To store the fruits and vegetables for a week, refrigerators or minicold storages are used.
All these gadgets consume electricity and emit pollutants like climate change threatening
chlorofluorocarbon (CFC).
Hence it has become necessary to develop eco-friendly, economic and, none
electrically operated system to store the products. With these concern efforts has been made
to rejuvenate the dying art of pottery making by giving a new avenue to develop earthenware
storage systems. Before the advent of electricity and refrigerator, people used traditional
system of storage using pots. Hence in the present study a clay pottery making technologies
are to be used to develop a earthenware storage systems /pots that can be used in lieu of
refrigerators.
1.B.2 MODELS OF EARTHENWARE STORAGE SYSTEMS
These are simple designs of evaporative coolers developed by Abba, 2006. This
can be used in the household storage. This ingenious technique that requires no external
energy supply to preserve fruits and vegetables and other perishables in hot, arid
climates. (Fig 2.3 a.)
This innovative cooling system consists of two earthenware pots of different
diameters, one placed inside the other. The space between the two pots is filled with
water and soil that is kept constantly moist, thereby keeping both pots damp. Fruits and
vegetables and other items such as soft drinks are put in the smaller inner pot, which is
covered with a lid with some holes for ventilation to the fruits and vegetables. The
phenomenon that occurs is based on a simple principle of physics: The water contained

4
between the two pots evaporates towards the outer surface of the larger pot where the
drier outside air is circulating. By virtue of the laws of thermodynamics, the evaporation
process automatically causes a drop in temperature of several degrees, cooling the inner
container, destroying harmful microorganisms and preserving the perishable foods
inside. The inside of the smaller pot cools due to evaporation of the water and the
temperature inside the pot is 5–6ºC compared to the ambient temperature outside during
a dry hot day. The inner pot stores food that is kept cool.
We have developed a clay refrigerator.
This clay refrigerator is a lidded earthenware pot fitted
inside a large pot with an insulating layer of sand in
Between.
This sand layer is kept cool by adding water at regular
intervals (twice a day). This ceramic refrigerator
has proved very successful and it has been tested with a
number of different vegetables. In this refrigerator tomatoes were kept fresh for 3 weeks
We have developed an evaporative cool chamber with the help of baked bricks
and riverbed sand. Inside the chamber the temperature was about 10-15 0 C lower than
outside temperature and inside humidity was about 30-40% higher than ambient
condition. It has been recorded that weight loss of fruits and vegetables kept inside the
chamber was lower than stored outside the chamber. The fruits and vegetables were fresh
up to 3to5 days on the inside the chamber than outside.

5
Mitticool Model
Prajapathy (2009) of Gujarat, India has developed
a mini refrigerator using clay. This unit is similar to
modern clay fridge (Fig. 2.3.d.). Verma et al., (2001)
studied the effectiveness of zero energy cool chamber
to store the flower Chryanthemum and reported a 8.25
percent physiological loss of weight (PLW) in 73 h.
and 7.18% PLW in 29 cold storage after 72h. After
putting wax wrapper. According to Panhwar, (2006) post harvested fruits and vegetables
of tropical origins must be stored above 120C. This is in contrast to plants which have
evolved in temperate cooler climate which can be stored at 00C. In tropical countries the
recommended temperature for storing grapes, banana, tomato, is 100C +. Bureau, (2009)
had developed a technology for zero energy cool chambers as an alternative to
refrigerator to store fresh fruits, vegetables and flowers to extend their marketability.
Earthenware storage system developed in the present study
In the present study new designs were conceived to create three types of Zero
energy earthenware storage system (EWSS) that suits Indian environment and economic
conditions. In these EWSS different types of tropical fruits and vegetables were stored.
The shelf-life period within which the fruits and vegetables remain fresh, sustains
physiological weight changes, biochemical and Organoleptic qualities were studied.
Designs of Earthenware storage system
For making earthenware storage systems, clay was collected from different ponds
near Alwarkurichi. Dry clay was collected from the floor of the pond. Clay was collected
from ponds in Vagaikulam, Achenkulam and Karunai river bed.
The chemical constituents in the clay used were given in chapter 5. The clay and
sand collected from different sites and were dried in sun to make a powder form. The
clays were then mixed in 80:20 (80 percent clay collected from Vagaikulam and
Achenkulam and 20 percent Karunai river bed sand) proportions to get a homogenous
mass. This is known to the potters as Body.
The mixture was charged into ball mills for the grinding up to the desired
fineness. Water was added in the grinding process carefully. About 30 to 35 percent of
water is first added on the basis of the materials put into the ball mill and 10 to 15

6
percent more water is added for proper flow of the ground slip. After the materials had
been ground to their respective fineness, they were kept in separate tanks in the liquid or
slip condition. The liquid clay mix was taken in a separate tank and it was left in it for 3
days to promote fermentation that makes the body soft to. The slip was then de-watered
using filter press. The slip was made stiffer for further use.
The de-watered cakes of clay mass that come out of the filter press had the
consistency of thick paste. The clay mass was put into kneading machine or a pug mill.
The main function of these machine are to press the clay mass so as to squeeze out the
air bubbles enclosed within the mass and to make the consistency of the body
homogenous specially with regard to the water content. The workability of the clay mass
or body was greatly improved by this operation.
After pugging the body was ready for throwing or jolleying. In throwing the
claywares are shaped by hand on a rotating potter’s wheel. The clay mass for throwing
should be stiff enough for article not to lose the shape, under its own weight, yet it
should be soft enough to yield easily to the pressure of the hand. Good throwing is of
highest importance as the defects arising from any inequality of pressure of the thrower’s
hand do not show themselves before drying or firing. Throwing was followed by turning.
It is a process of shaping on a lathe when the body is wet and is employed when
accuracy of form is wanted. After truing and the properly shaped clayware were
obtained, the clayware were dried. When the clayware got light colour after drying, it
was taken to firing.
Modified Earthenware Storage System (EWSS2)
This unit is single pot structure. In this unit the exterior of the pot has two water
holding ring like jackets. One at the rim and the other just a beneath the rim. To this ring
like jackets 1 liter of water is added. The capacity of this unit is 8 liters. The water in the

7
ring like jackets provides coolness while the water moves by capillary action in the wall
of chamber. Inside this modified unit fruits and vegetables can be stored. This unit
occupies less space. The lid of the unit can be easily handled and it has air holes for air
passage inside out or vice versa. Under the bottom of the unit an air hole of 2 cm
diameter is present and this unit is placed on a hollow clay base. This permit air flow in
to the system. Inside this unit the relative humidity was 90±3 % and temperature was 5 ±
2 o C less than ambient temperature.

8
1.B.3 STRUCTURE OF EARTHERNWARE DESIGNED FOR STORAGE
For the present study 3 models of clay wares were designed and designated as
1. Basic model Earthenware storage system (EWSS1)
2. Modified Earthenware storage system (EWSS2)
3. Pyramid type Earthenware storage system (EWSS3)
Basic Model Earthenware Storage System (EWSS1)
This unit is a double pot structure, having an inner pot and an outer pot. In
between the inner and outer sides of the pots a narrow gap of 5 cm was left. At the
bottom 15 cm gap is maintained. In the gap, broken and moist pieces of bricks and a top
layer of river bed sand were kept to give cooling effect. The inner and outer chamber was
covered with a common lid that had few holes so as to facilitate the air movement. In the
inner chamber, vegetables and fruits are stored. The capacity of this chamber is 5 liters.
Inside this chamber the relative humidity was in the range 80 ± 2 % and the temperature
was normally 5 to 6 o C lower than the ambient temperature. As the capacity in this
model is less and difficult to handle a modified model with less weight was designed.

9
MODIFIED EARTHENWARE STORAGE SYSTEM (EWSS1)
MODIFIED EARTHENWARE STORAGE SYSTEM (EWSS2)

10
Pyramid Type Earthenware Storage System (EWSS3)
In this unit the vegetables and fruits can be kept in a clay bowl of 3 liters
capacity. The bowl was covered by a pyramid unit made of clay. The pyramidal unit
covers the entire clay bowl. The bowl is kept at a height inside the pyramid where
magnetic forces will be high. The pyramid shaped outer cover is provided with 0.5 cm
diameter air holes (2 numbers on each side).
PYRAMID TYPE EARTHENWARE STORAGE SYSTEM (EWSS3)
In the present study different types of earthenware storage systems (EWSS) were
tested for their efficiency to reduce microbial load/spoilage in household fruits and
vegetables. The fruits and vegetables were also pretreated with disinfectants and stored
in earthenware storage system. The microbial load in EWSS stored products were
compared with other storage systems like refrigerator and ambient conditions.

11
4. OBJECTIVES – II
BIOCHEMICAL CHARACTERISTICS, ORGANOLEPTIC QUALITIES AND
PHYSIOLOGICAL WEIGHT CHANGES IN FRUITS AND VEGETABLES
STORED IN DIFFERENT STORAGE SYSTEMS
INTRODUCTION
Optimum health demands an adequate intake of all macro and micronutrients.
Utilization of one nutrient is often dependent on the adequate supply of some other
nutrient. Deficiency of any one of the nutrients, therefore, affects the entire metabolic
machinery. Micronutrient malnutrition is a serious public health problem in the country.
Food based approach, using foods naturally rich in micronutrients, is one of the strategies
for combating micro nutritional deficiencies (Renuka Chowdhury, 2009). The
consumption of foods that are important source of micronutrients, like fruits and
vegetables, is low in Indian population, particularly among women and children.
Enhancing consumption of fruits and vegetables and green leafy vegetables in daily
dietary pattern, which are the rich source of micronutrients, dietary fibre and
antioxidants, would contribute significantly in reducing the problem of micronutrient
malnutrition among the masses.
Although India is the second largest producer of fruits and vegetables in the
world, per capita consumption is less. Because of varied agroclimatic conditions. Some
fruits and vegetables are available in glut in one season and disappear thereafter. The
home scale preservations of these fruits and vegetables however, could make them
available thought the year at the house-hold level. At least short term storage of fruits
and vegetables in home will reduce the burden of cooking to a great extent.
When fruits and vegetables are stored in storage chambers like refrigerators or
earthenware storage system or in ambient condition there should not be any loss in
biochemical qualities and Organoleptic properties or at least such losses should be
minimum to enhance consumers preference and their nutritional balance. Hence it is
essential to evaluate the biochemical characteristics like protein, carbohydrates, lipids,
sugars, vitamins minerals, fiber content etc, in the fruits and vegetables before and after
the storage process. If any biochemical deterioration is noticed due to storage that can be
reduced by using pretreatment of products before storage. Organoleptic characters like
appearance of skin colour, flavour, texture and taste, etc provide consumer preference for

12
any products. Such qualities should be retained well during storage, lest their usage will
be minimum after storage.
The taste, odor and appearance of a food are the ultimate criteria used by consumers
to judge a foods acceptability. The Organoleptic quality of a food changes as its micro-
flora bacteria, yeast, and mold-grow and metabolize available nutrients. The sensory
changes at first might be subtle, but they eventually make the food unacceptable (Ghosh,
1993) Hence the storage system must be sterile or they should not enhance microbial
growth fastly. Normally storage temperature and relative humidity determines the length
of microbiological shelf-life of perishable foods.
Fruits and vegetables continue their physiological activities even after plucking
and storage. If the storage fails to minimize the physiological weight loss, their consumer
preference is limited. So a good storage system should reduce the physiological loss of
weight during storage.
To make short term preservation of fruits and vegetables at domestic levels,
economic, eco-friendly and efficient storage is needed. As fruits and vegetables get
spoiled easily due to enzymatic changes and microbial growth, the storage system has a
role to reduce such changes during storage. With this three objectives the efficiency of
the earthenware storage system to minimize the loss of biochemical constituents,
retention of Organoleptic properties and physiological weight was tested and it was
compared with other methods of storage like refrigeration and ambient conditions.
Details collected from experiment – given in Table 4.1-4.24, Fig 4.1-4.5

13
Table 4. 1
BIOCHEMICAL CHANGES IN GRAPHS DURING DIFFERENT STORAGE PERIOD
S.No Types of
storage
Carbohydrate Concentration mg/g Protein Concentration mg/g Vitamin Concentration mg/g
Storage days Storage days Storage days
0 1 3 5 7 0 1 3 5 7 0 1 3 5 7
Room
temperature 180±3
165±3
(8.33)
160±2
(11.11)
153±2
(15.00)
148±1
(17.17) 6±1
4.5±.4
(25.00)
4.0±0.2
(33.33)
3.8±0.3
(36.66)
3.3±0.2
(45.00) 3±0.8
2.8±0.7
(6.66)
2.2±0.8
(23.33)
2.0±0.6
(33.33)
1.8±0.7
(40.0)
Refrigerator 180±3 175±2
(2.77)
171±2
(5.00)
168±2
(6.66)
161±2
(10.55) 6±1
5.5±0.3
(8.33)
5.00±0.3
(16.66)
4.8±0.2
(20)
4.3±0.1
(28.33) 3±0.8
2.9±0.6
(3.33)
2.6±0.8
(6.66)
2.4±0.8
(10.00)
2.1±0.7
(30.00.)
EWSS1 180±3 177±3
(1.66)
173±3
(3.88)
169±3
(6.11)
165±2
(8.33) 6±1
5.6±0.3
(6.6)
5.3±1
(11.6)
4.9±0.2
(1)
4.7±0.2
(21.66) 3±0.8
2.8±0.1
(2.22)
2.6±0.9
(6.66)
2.5±1
(16.66)
2.3±0.7
(23.33)
EWSS2 180±3 176±1
(2.22)
174±2
(3.33)
171±2
(5.00)
168±3
(6.66) 6±1
5.8±0.2
(3.33)
5.6±0.4
(6.66)
5.2±0.2
(13.33)
4.9±0.2
(18.33) 3±0.8
2.9±0.8
(3.33)
2.9±0.6
(3.3)
2.7±0.8
(10.00)
2.5±0.4
(16.66)
PEWSS 180±3 178±2
(1.11)
175±2
(2.77)
172±2
(4.44)
170±2
(5.5) 6±1
5.8±0.2
(1.66)
5.6±1
(6.66)
5.6±0.1
(6.66)
5.3±0.1
(11.66) 3±0.8
3±0.3
(0.00)
2.8±0.6
(6.66)
2.7±0.7
(10.00)
2.5±0.9
(16.66)
(Percentage changes over control is given in parenthesis)

14
Table 4. 2
BIOCHEMICAL CHANGES IN BANANA DURING DIFFERENT STORAGE PERIOD
S.No Types of
storage
Carbohydrate Concentration mg/g Protein Concentration mg/g Vitamin Concentration µg/g
Storage days Storage days Storage days
0 1 3 5 7 0 1 3 5 7 0 1 3 5 7
Room
temperature 790±3
765±3
(3.16)
653±2
(17.34)
642±3
(18.73)
602±3
(23.79) 40±2
35±1
(1.25)
31±2
(2.25)
24±1
(4.00)
19±1
(5.25) 70±3
67±2
(4.28)
63±1
(10.00)
58±2
(17.40)
53±1
(24.28)
Refrigerator 790±3 783±2
(0.88)
7.68±3
(2.78)
753±2
(4..68)
7.31±2
(7.46) 40±2
36±1
(10.00)
33±1
(17.50)
29±2
(27.50)
2.6±1
(35.00) 70±3
69±2
(1.42)
60±1
(14.28)
53±3
(24.28)
50±1
(28.55)
EWSS1 790±3 779±3
(1.39)
770±3
(2.53)
764±2
(3.29)
7.50±3
(5.06) 40±2
37±2
(7.50)
34±2
(15.00)
30±1
(25.00)
28±0.9
(30.00) 70±3
66±1
(5.7)
61±2
(12.85)
57±1
(18.57)
53±2
(24.28)
EWSS2 790±3 782±4
(1.01)
778±3
(2.02)
768±3
(2.78)
743±2
(4.68) 40±2
38±1
(5.00)
36±2
(10.00)
34±1
(15.00)
32±0.8
(20.00) 70±3
67±2
(4.28)
63±1
(10.00)
59±2
(15.71)
56±3
(20.00)
PEWSS 790±3 786±3
(0.50)
778±4
(1.51)
770±3
(2.53)
768±4
(2.73) 40±2
40±0.9
(0.00)
38±0.8
(5.00)
35±0.9
(12.50)
33±0.7
(17.50) 70±3
68±1
(2.85)
64±2
(8.57)
60±3
(14.28)
57±0.8
(18.57)
(Percentage changes over control is given in parenthesis)

15
Table 4. 3
BIOCHEMICAL CHANGES IN BRINJAL DURING DIFFERENT STORAGE PERIOD
S.
No
Types of
storage
Carbohydrate Concentration mg/g Protein Concentration mg/g Vitamin Concentration µg/g
Storage days Storage days Storage days
0 1 3 5 7 0 1 3 5 7 0 1 3 5 7
Room
temperature 3.11±0.3
2.98±0.4
(4.18)
2.80±0.3
(9.96)
2.70±0.4
(13.18)
2.60±.3
(16.39) 0.72±0.6
0.70±0.03
(2.77)
0.68±0.4
(5.55)
0.58±0.3
(19.44)
0.45±0.4
(37.5) 9.85±0.7
9.52±4
(3.35)
9.00±3
(8.62)
8.50±4
(13.70)
7.75±4
(19.28)
Refrigerator 3.11±0.3 3.00±0.8
(3.53)
2.92±.5
(6.10)
2.89±0.4
(7.07)
2.75±0.4
(11.57) 0.72±0.6
0.69±0.04
(4.16)
0.66±0.05
(8.33)
0.62±0.06
(13.88)
0.55±0.05
(23.61) 9.85±0.7
9.71±4
(1.42)
9.40±3
(4.56)
8.80±3
(10.65)
8.11±4
(17.66)
EWSS1 3.11±0.3 3.00±0.6
(3.53)
2.95±0.6
(5.14)
2.90±0.5
(6.75)
2.82±0.5
(9.32) 0.72±0.6
70±0.05
(2.77)
0.68±0.01
(9.72)
0.63±0.4
(12.50)
0.60±0.03
(16.66) 9.85±0.7
9.80±4
(0.50)
9.69±5
(1.62)
9.00±3
(8.62)
8.20±4
(16.75)
EWSS2 3.11±0.3 3.06±0.7
(0.32)
3.05±0.4
(1.92)
2.98±0.5
(4.18)
2.80±0.5
(9.96) 0.72±0.6
0.72±0.4
(0.0)
0.68±0.2
(9.72)
0.61±0.3
(15.27)
0.63±0.4
(12.50) 9.85±0.7
9.79±5
(0.60)
9.40±4
(4.56)
8.10±5
(11.57)
8.27±3
(16.04)
PEWSS 3.11±0.3 3.02±0.8
(2.89)
2.97±0.6
(4.50)
2.91±0.4
(6.43)
2.88±0.4
(7.39) 0.72±0.6
0.71±0.04
(1.38)
0.69±0.02
(4.10)
0.63±0.05
(12.50)
0.61±0.03
(13.8) 9.85±0.7
9.80±5
(0.50)
9.52±5
(3.35)
8.68±3
(11.87)
8.35±4
(15.22)
(Percentage changes over control is given in parenthesis)

16
Table 4. 4
BIOCHEMICAL CHANGES IN LADIES FINGER DURING DIFFERENT STORAGE PERIOD
S.No Types of
storage
Carbohydrate Concentration mg/g Protein Concentration mg/g Vitamin Concentration µg/g
Storage days Storage days Storage days
0 1 3 5 7 0 1 3 5 7 0 1 3 5 7
Room
temperature 4.02±0.6
3.90±0.4
(2.98)
3.79±.6
(5.72)
3.68±0.8
(8.45)
3.59±0.5
(10.69) 0.99±0.8
0.93±0.7
(6.06)
0.87±0.6
(12.32)
0.79±0.6
(20.20)
0.73±0.7
(27.27) 10.12±5
10.02±5
(1.98)
9.20±3
(9.09)
9.02±4
(10.86)
8.97±5
(11.36)
Refrigerator 4.02±0.6 4.00±0.8
(0.50)
3.98±0.5
(0.99)
3.98±0.8
(0.99)
3.90±0.7
(2.98) 0.99±0.8
0.95±0.6
(4.04)
0.90±0.6
(9.90)
0.87±0.7
(12.12)
0.78±0.6
(21.21) 10.12±5
10.08±5
(0.39)
10.03±4
(0.88)
9.90±4
(2.11)
9.60±3
(5.13)
EWSS1 4.02±0.6 4.00±0.5
(0.50)
3.97±0.6
(1.24)
3.95±0.4
(1.74)
3.93±0.5
(2.23) 0.99±0.8
0.95±0.5
(4.40)
0.92±0.6
(7.07)
0.90±0.4
(9.09)
0.81±0.4
(18.00) 10.12±5
10.08±5
(0.39)
10.05±7
(0.69)
9.98±6
(1.38)
9.83±6
(2.86)
EWSS2 4.02±0.6 4.00±0.3
(0.50)
3.99±0.4
(0.74)
3.97±0.4
(1.24)
3.94±0.3
(8.00) 0.99±0.8
0.97±0.5
(2.02)
0.93±0.3
(6.06)
0.89±0.4
(10.10)
0.80±0.7
(9.19) 10.12±5
10.09±5
(0.29)
90.06±6
(0.59)
9.97±5
(1.48)
9.90±6
(2.11)
PEWSS 4.02±0.6 4.02±0.4
(0.00)
4.01±0.7
(0.24)
3.98±0.6
(0.99)
3.96±0.4
(1.49) 0.99±0.8
0.98±0.3
(1.01)
0.95±0.7
(4.04)
0.93±0.6
(6.06)
0.90±0.5
(9.09) 10.12±5
10.08±6
(0.39)
10.05±7
(0.69)
10.00±4
(1.18)
9.98±4
(1.38)
(Percentage changes over control is given in parenthesis)

17
Table 4. 5
BIOCHEMICAL CHANGES IN TOMATO DURING DIFFERENT STORAGE PERIOD
S.No Types of
storage
Carbohydrate Concentration µg/g Protein Concentration µg/g Vitamin Concentration µg/g
Storage days Storage days Storage days
0 1 3 5 7 0 1 3 5 7 0 1 3 5 7
Room
temperature 17.22±3
17.18±1.5
(0.23)
17.12±1
(0.58)
16.30±0.9
(5.34)
15.00±0.6
(12.89) 12.44±2
9.16±0.9
(26.36)
8.11± 0.5
(36.80)
7.26±0.4
(41.63)
6.63±0.4
(46.70) 53.18±4
52.16±3
(1.91)
48.90±3
( 8.04)
46.80±2
(11.99)
45.26±3
(14.89)
Refrigerator 17.22±3 17.18±1
( 0.23)
17.00±1
(1.27)
16.90±0.8
(1.85)
16.60± 1
(3.60) 12.44±2
11.13± 1
(10.53)
11.00±0.8
(11.57)
10.80±0.9
(13.18)
9.16±0.8
(26.36) 53.18±4
48.26±2
(9.36)
45.80±2
(13.87)
41.40±2
(23.01)
38.92±4
(26.81)
EWSS1 17.22±3 17.10± 1
(0.69)
17.00±1
(1.27)
17.00±3
(1.27)
16.70± 2
(3.10) 12.44±2
12.15±0.9
(2.33)
12.00±0.6
(3.53)
11.80±0.9
(5.14)
11.35±0.8
(8.76) 53.18±4
52.08±3
(2.06)
48.35±4
(13.87)
46.10±3
(13.31)
47.35±2
(18.48)
EWSS2 17.22±3 17.10±0.9
(0.69)
17.00±2
(1.27)
16.90±2
(1.85)
16.70± 2
(3.01) 12.44±2
12.05±0.8
(3.13)
11.90±0.7
(4.34)
11.70±0.6
(5.94)
11.50±1
(7.55) 53.18±4
50.00±4
(5.97)
48.000±3
(9.74)
47.10±4
(11.43)
46.00±3
(13.50)
PEWSS 17.22±3 17.08± 3
(0.81)
16.95±2
(1.56)
16.85± 2
(2.14)
16.75± 3
(2.72) 12.44±2
12.00±1
(3.53)
11.80±0.8
(5.14)
17.75±0.7
( 5.54)
11.65±0.7
(6.35) 53.18±4
49.80±2
(6.35)
49.10±3
(7.67)
48.80±3
(8.23)
48.20±4
9.36()
(Percentage changes over control is given in parenthesis)

18
Table 4. 6
BIOCHEMICAL CHANGES DURING IN CARROT DIFFERENT STORAGE PERIOD
S.No Types of
storage
Carbohydrate Concentration µg/g Protein Concentration µg/g Vitamin Concentration µg/g
Storage days Storage days Storage days
0 1 3 5 7 0 1 3 5 7 0 1 3 5 7
Room
temperature 1020±4
993±4
(2.64)
973±3
(4.60)
930±3
(8.82)
860±4
(15.68) 90±3
86±2
(4.44)
81±2
(10.00)
73±1
(18.88)
68±2
(24.44) 7.5±2
7.0±2
(6.66)
6.3±1
(16.00)
5.7±0.9
(24.00)
5.0±0.8
(33.33)
Refrigerator 1020±4 990±4
(2.94)
950±2
(6.86)
910±3
(10.78)
880±3
(13.72) 90±3
87±1
(3.33)
83±3
(7.77)
75±4
(16.66)
71±4
(22.11)
7.5±2 6.9±1
(8.00)
6.5±2
(13.33)
5.9±0.7
(21.33)
5.4±0.5
(28.00)
EWSS1 1020±4 1010±3
(0.98)
980±3
(3.92)
940±4
(7.84)
920±2
(9.80) 90±3
88±2
(2.22)
86±1
(4.44)
82±2
(8.88)
79±2
(12.22)
7.5±2 7.2±0.8
(4.00)
7.00±1
(6.66)
6.8±0.7
(9.33)
6.5±0.5
(13.33)
EWSS2 1020±4 1008±3
(1.76)
980±4
(3.92)
960±4
(5.88)
940±4
(7.84) 90±3
88±4
(2.22)
85±2
(5.55)
83±3
(7.77)
81±2
(10.00)
7.5±2 7.1±
0.6
(5.33)
6.9±0.5
(8.00)
6.7±0.4
(10.66)
6.7±0.3
(10.66)
PEWSS 1020±4 1012±3
(0.78)
1000±4
(1.96)
980±4
(3.92)
960±2
(5.88) 90±3
90±4
(0.00)
87±3
(3.33)
84±4
(6.66)
81±3
(10.00)
7.5±2 7.4±1
(1.33)
7.0±1
(6.66)
7.00±0.2
(6.66)
6.9±0.8
(8.00)
(Percentage changes over control is given in parenthesis)

19
Table 4. 7 Organoleptic qualities of Grapes sample in different storage system
S.No Nature of
storage
Characters
of sample
Storage of Grapes in days Overall
acceptability Day
0 Day 1 Day 3 Day 5
Day
7
1 Room
temperature
Skin colour
appearance
10±1
8±0.7 6±0.4 4±0.2 4±0.2 5.50.3
Flaour 8±0.6 5±0.3 3±0.1 3±0.3 5.25±0.4
Texture 9±0.7 7±0.5 4±0.1 4±0.2 6.0±0.3
Odour 8±0.5 3±0.1 2±0.2 1±0.1 3.5±0.2
2 Refrigerator
Skin colour
appearance
10±1
8±0.6 7±0.5 4±0.3 4±0.2 5.75±0.3
Flaour 8±0.7 6±0.4 5±0.2 4±0.4 5.75±0.5
Texture 8±0.5 6±0.4 4±0.3 4±0.1 5.5±0.4
Odour 7±0.4 5±0.3 5±0.5 4±0.3 5.25±0.3
3 EWSS1
Skin colour
appearance
10±1
8±0.7 8±0.8 7±0.7 7±0.5 7.5±0.6
Flaour 8±0.6 8±0.5 9±0.6 9±0.6 8.5±0.3
Texture 8±0.7 9±0.4 8±0.7 8±0.5 8.25±0.5
Odour 8±0.5 8±0.5 9±0.7 9±0.6 8.5±0.3
4 EWSS2
Skin colour
appearance
10±1
9±0.1 8±0.8 8±0.6 7±0.5 8±0.6
Flaour 9±0.8 9±0.7 8±0.5 8±0.6 8.5±0.5
Texture 10±0.2 10±0.9 8±1 8±0.5 9.5±0.6
Odour 10±0.3 10±0.3 10±0.5 9±0.7 9.75±0.5
5 PEWSS
Skin colour
appearance
10±1
8±0.7 8±0.5 7±0.4 6±0.2 7.25±0.6
Flaour 8±0.6 7±0.4 7±0.5 7±0.4 7.25±0.7
Texture 8±0.5 8±0.7 7±0.3 6±0.8 7.25±0.6
Odour 9±0.6 8±0.6 6±0.2 6±0.5 7.25±0.7

20
Table 4.8 Organoleptic qualities of Banana sample in different storage system
S.No Nature of
storage
Characters
of sample
Storage of Banana in days Overall
acceptability Day
0 Day 1 Day 3 Day 5
Day
7
1 Room
temperature
Skin colour
appearance
10±1
9±0.8 7±0.5 6±0.4 4±0.2 6.0±0.2
Flaour 8±0.6 6±0.4 5±0.3 4±0.2 5.75±0.3
Texture 8±0.7 5±0.2 4±0.1 3±0.1 5.0±0.4
Odour 9±0.8 5±0.3 5±0.3 2±0.1 5.25±0.3
2 Refrigerator
Skin colour
appearance
10±1
8±0.6 7±0.5 4±0.2 3±0.3 5.5±0.2
Flaour 8±0.5 7±0.4 3±0.1 3±0.2 5.25±0.3
Texture 7±0.5 6±0.4 4±0.2 3±0.1 5.0±0.2
Odour 8±0.6 5±0.3 3±0.2 2±0.1 4.5±0.8
3 EWSS1
Skin colour
appearance
10±1
10±0.1 10±0.2 9±1 9±0.8 9.5±0.5
Flaour 8±0.9 9±0.7 10±1 8±0.5 8.75±0.7
Texture 10±0.6 10±1 9±0.8 9±0.6 9.5±0.6
Odour 8±0.5 10±0.9 9±0.5 9±0.7 9.0±0.8
4 EWSS2
Skin colour
appearance
10±1
9± 1 10±0.8 10±1 9±0.7 9.0±0.7
Flaour 9±0.7 8±0.6 9±0.7 8±0.6 9.0±0.9
Texture 8±0.6 10±1 10±0.6 8±0.5 9.0±0.6
Odour 10±0.5 10±1 9±0.6 9±0.7 9.5±0.3
5 PEWSS
Skin colour
appearance
10±1
9±0.7 8±0.6 8±0.5 7±0.5 8.25±0.4
Flaour 8±0..8 8±0.5 8±0.4 7±0.4 7.75±0.2
Texture 8±0.7 7±0.6 6±0.4 7±0.6 7.0±0.1
Odour 8±0.7 8±0.4 7±0.5 7±0.4 7.5±0.3

21
Table 4.9 Organoleptic qualities of Brinjal sample in different storage system
S.No Nature of
storage
Characters
of sample
Storage of Brinjal in days Overall
acceptability Day
0 Day 1 Day 3 Day 5 Day 7
1 Room
temperature
Skin
colour
appearance
10±1
10±1 9±0.5 7±0.5 6±0.4 8.0±0.3
Flaour 8±0.7 7±0.4 7±0.4 7±0.3 7.3±0.2
Texture 8±0.6 6±0.2 5±0.7 4±0.2 5.8±0.4
Odour 9±0.8 7±0.4 6±0.4 5±0.3 6.7±0.3
2 Refrigerator
Skin
colour
appearance
10±1
10±1 8±0.6 7±0.5 6±0.4 7.8±0.4
Flaour 8±0.6 6±0.4 5±0.3 4±0.3 5.8±0.3
Texture 7±0.5 4±0.2 3±0.2 3±0.1 4.3±0.2
Odour 8±0.4 7±0.5 6±0.5 6±0.4 6.8±0.3
3 EWSS1
Skin
colour
appearance
10±1
10±1 10±1 10±0.9 8±0.6 9.5±1
Flaour 10±0.8 10±1 8±0.7 8±0.4 9.0±0.7
Texture 10±1 10±0.9 10±0.8 10±0.6 10±0.8
Odour 10±1 9±0.4 8±0.4 8±0.8 8.8±0.6
4 EWSS2
Skin
colour
appearance
10±1
10±1 10±0.8 10±1 9±0.6 9.8 ±0.3
Flaour 10±0.9 10±0.7 10±0.9 9±0.7 9.8±0.4
Texture 10±1 10±0.4 10±1 10±0.8 10±1
Odour 10±1 9±0.7 9±0.8 8±1 9.0±0.2
5 PEWSS
Skin
colour
appearance
10±1
10±0.9 8±0.5 7±0.5 6±0.6 7.8±0.4
Flaour 8±0.6 7±0.4 7±0.4 7±0.4 7.3±0.3
Texture 9±0.7 8±0.7 7±0.5 4±0.5 7±0.5
Odour 8±0.6 8±0.6 7±0.3 7±0.2 7.6±0.6

22
Table 4.10 Organoleptic qualities of Ladies finger sample in different storage system
S.No Nature of
storage
Characters
of sample
Storage of Ladies finger in days Overall
acceptability Day
0 Day 1 Day 3 Day 5 Day 7
1 Room
temperature
Skin colour
appearance 10±1
8±0.7 4±0.3 3±0.2 1±0.2 4.0±0.2
Flaour 8±0.6 8±0.7 8±0.5 6±0.3 7.5±0.3
Texture 7±0.5 6±0.4 4±0.2 2±0.1 4.7±0.4
Odour 8±0.6 8±0.6 7±0.5 6±0.4 6.7±0.6
2 Refrigerator
Skin colour
appearance
10±1
9±0.5 7±0.6 6±0.4 5±0.3 6.7±0.4
Flaour 9±0.4 8±0.5 8±0.5 6±0.3 7.8±0.3
Texture 8±0.5 7±0.4 7±0.3 7±0.2 5.5±0.2
Odour 7±0.3 6±0.4 6±0.4 5±0.5 5.0±0.1
3 EWSS1 Skin colour
appearance
10±1 10±1 10±0.9 8±0.6 6±0.3 8.5±0.3
Flaour 10±1 10±0.8 8±0.5 8±0.3 9.0±0.4
Texture 9±0.8 9±0.7 9±0.7 8±0.6 8.8±0.5
Odour 10±0.9 10±0.9 10±0.1 9±0.5 9.75±0.7
4 EWSS2 Skin colour
appearance
10±1 10±1 10±1 9±0.7 8±0.6 9.2±0.2
Flaour 10±1 10±0.8 9±0.5 8±0.7 9.2±0.4
Texture 10±1 10±0.7 10±1 9±0.6 9.7±0.6
Odour 10±0.9 10±0.8 10±0.9 10±0.9 10±0.4
5 PEWSS Skin colour
appearance
10±1 9±0.8 8±0.6 7±0.5 7±0.5 7.5±0.6
Flaour 8±0.5 6±0.4 6±0.4 5±0.3 6.5±0.4
Texture 9±0.7 7±0.5 5±0.2 5±0.2 6.5±0.3
Odour 10±1 8±0.6 7±0.5 7±0.5 8.0±0.6

23
Table 4.11 Organoleptic qualities of Tomato sample in different storage system
S.No Nature of
storage
Characters
of sample
Storage of Tomato in days Overall
acceptability Day
0 Day 1 Day 3
Day
5
Day
7
1 Room
temperature
Skin colour
appearance
10±1
9±1 7±0.9 5±0.2 5±0.4 6.5±0.4
Flaour 8±0.4 4±0.5 3±0.3 2±0.3 4.25±0.3
Texture 7±0.7 6±0.3 5±0.3 4±0.4 5.5±0.4
Odour 8±0.6 5±0.4 4±0.2 4±0.3 5.25±0.3
2 Refrigerator
Skin colour
appearance
10±1
8±0.6 7±0.4 6±0.5 5±0.3 6.5±0.4
Flaour 7±0.7 7±0.5 4±0.3 3±0.1 5.25±0.4
Texture 7±0.4 6±0.3 7±0.5 6±0.4 6.5±0.4
Odour 8±0.5 8±0.6 6±0.4 6±0.3 7.0±0.3
3 EWSS1 Skin colour
appearance
10±1
10±1 8±0.9 7±0.3 8±0.3 8.25±0.6
Flaour 9±0.8 9±0.9 8±0.5 8±0.6 8.5±0.8
Texture 8±0.6 9±0.5 8±0.4 9±0.7 8.25±0.3
Odour 7±0.5 7±0.4 6±0.3 6±0.5 6.50±0.5
4 EWSS2 Skin colour
appearance
10±1
10±0.6 10±0.4 10±1 9±0.5 9.75±0.2
Flaour 10±0.7 10±0.9 9±0.6 8±0.9 9.25±0.4
Texture 10±0.5 10±0.8 9±0.8 8±0.5 9.25±0.7
Odour 10±0.6 9±0.7 8±0.6 8±0.7 8.75±0.6
5 PEWSS Skin colour
appearance
10±1
9±0.8 8±0.5 7±0.3 7±0.6 7.75±0.5
Flaour 7±0.5 7±0.7 5±0.8 4±0.6 5.75±0.4
Texture 9±0.7 8±0.5 6±0.4 5±0.2 7.0±0.3
Odour 7±0.6 7±0.4 5±0.3 3±0.3 5.5±0.3

24
Table 4.12 Organoleptic qualities of carrot sample in different storage system
S.No Nature of
storage
Characters
of sample
Storage of carrot in days Overall
acceptability Day
0 Day 1 Day 3 Day 5 Day 7
1 Room
temperature
Skin colour
appearance
10±1
10±1 06±0.4 04±0.4 03±0.2 5.75±0.6
Flaour 10±1 07±0.3 04±0.3 02±0.2 5.75±0.4
Texture 8±0.6 5±0.5 3±0.4 2±0.1 4.5±0.5
Odour 8±0.7 5±0.4 4±0.2 1±0.1 4.5±0.3
2 Refrigerator
Skin colour
appearance
10±1
10±1 10±1 4±0.2 3±0.1 6.7±0.6
Flaour 10±0.9 08±0.2 06±0.4 06±0.4 7.5±0.4
Texture 8±0.9 8±0.5 8±0.6 7±0.3 7.7±0.2
Odour 8±0.8 7±0.3 7±0.5 6±0.2 7.0±0.3
3 EWSS1
Skin colour
appearance
10±1
10±1 10±1 10±1 8±0.7 9.5±0.6
Flaour 10±0.9 10±1 8±0.7 8.7±0.5 9.0±0.6
Texture 10±1 10±0.9 10±0.9 10±0.8 10±0.7
Odour 10±1 8±0.6 8±0.3 8±0.5 8.5±0.4
4 EWSS2
Skin colour
appearance
10±1
10±0.9 10±0.4 10±0.3 10±0.9 10±0.6
Flaour 10±0.8 10±0.8 8±0.5 8±0.5 9.0±0.5
Texture 10±0.9 10±0.9 10±0.9 10±0.7 10±0.6
Odour 10±1 10±1 10±0.7 10±0.7 10±0.8
5 PEWSS
Skin colour
appearance
10±1
10±1 08±0.8 07±0.5 07±0.3 8.0±0.5
Flaour 8±0.5 8±0.3 7±0.4 7±0.6 7.0±0.3
Texture 8±0.6 7±0.4 7±0.3 6±0.2 7.0±0.5
Odour 8±0.7 8±0.5 7±0.4 7±0.5 7.5±0.8

25
Table 4.13 Organoleptic qualities of Grapes sample in different storage system in
pretreated with calcium hydroxide
S.No Nature of
storage
Characters
of sample
Storage of Grapes in days Overall
acceptability Day
0
Day
1
Day
3
Day
5
Day
7
1 Room
temperature
Skin colour
appearance
10±1
9±0.8 8±0.7 4±0.5 4±0.5 6.25
Flaour 6±0.4 5±0.3 3±0.1 2±0.2 4.00
Texture 9±0.7 8±0.5 5±0.3 4±0.2 6.5
Odour 8±0.5 3±0.2 2±0.1 1±0.1 3.5
2 Refrigerator
Skin colour
appearance
10±1
8±0.7 5±0.3 4±0.2 4±0.2 5.25
Flaour 8±0.6 4±0.2 3±0.1 2±0.1 4.25
Texture 8±0.3 6±0.2 4±0.1 4±0.2 5.5
Odour 7±0.4 4±0.2 3±0.2 3±0.1 4.25
3 EWSS2
Skin colour
appearance
10±1
7±0.5 6±0.7 4±0.3 4±0.2 5.25
Flaour 8±0.5 8±0.4 6±0.3 6±0.3 7.0
Texture 8±0.4 9±0.4 8±0.5 8±0.4 8.25
Odour 8±0.7 6±0.4 6±0.6 5±0.3 6.25
Table 4.14 Organoleptic qualities of Banana sample in different storage system in
pretreated with calcium hydroxide
S.No Nature of
storage
Characters
of sample
Storage of Banana in days Overall
acceptability Day
0
Day
1
Day
3 Day 5
Day
7
1 Room
temperature
Skin colour
appearance
10±1
7±0.4 6±0.3 6±0.2 4±0.1 5.75
Flaour 8±0.5 6±0.2 5±0.3 4±0.1 5.75
Texture 8±0.3 7±0.4 4±0.2 3±0.1 5.50
Odour 8±0.6 6±0.4 5±0.3 2±0.2 5.25
2 Refrigerator
Skin colour
appearance
10±1
8±0.5 6±0.3 4±0.1 2±0.1 5.00
Flaour 8±0.4 7±0.5 3±0.1 3±0.1 5.25
Texture 7±0.4 6±0.3 6±0.2 3±0.2 5.5
Odour 8±0.5 6±0.3 3±0.2 3±0.2 5.00
3 EWSS2
Skin colour
appearance
10±1
9±0.6 8±0.5 10±0.6 9±0.6 9.0
Flaour 9±0.4 8±0.5 9±0.5 8±0.4 8.5
Texture 9±0.7 9±0.6 9±0.5 8±0.7 8.75
Odour 9±0.8 9±0.5 7±0.4 7±0.6 8.0

26
Table 4.15 Organoleptic qualities of Brinjal sample in different storage system
pretreated with calcium hydroxide
S.No Nature of
storage
Characters
of sample
Storage of Brinjal in days Overall
acceptability Day
0 Day 1 Day 3 Day 5 Day 7
1 Room
temperature
Skin
colour
appearance 10±1
10±0.7 9±0.6 7±0.5 6±0.4 8.0
Flaour 8±0.6 7±0.4 7±0.4 7±0.4 7.25
Texture 8±0.5 6±0.2 6±0.3 5±0.3 6.25
Odour 8±0.5 7±0.4 5±0.3 5±0.3 6.25
2 Refrigerator
Skin
colour
appearance 10±1
10±0.7 8±0.6 7±0.5 7±0.5 8.00
Flaour 7±0.4 6±0.3 5±0.3 4±0.2 5.5
Texture 8±0.5 6±0.2 4±0.4 3±0.1 5.25
Odour 8±0.5 7±0.6 5±0.3 5±0.2 6.25
3 EWSS2
Skin
colour
appearance
10±1
10±0.7 9±0.5 8±0.4 8±0.4 8.75
Flaour 10±0.8 8±0.5 7±0.4 7±0.4 8
Texture 10±0.7 10±0.8 10±0.6 10±0.6 10
Odour 10±0.8 9±0.7 7±0.4 7±0.3 8.25
Table 4.16 Organoleptic qualities of Ladies finger sample in different storage
system pretreated with calcium hydroxide
S.No Nature of
storage
Characters
of sample
Storage of Ladies finger in days Overall
acceptability Day
0 Day 1 Day 3 Day 5
Day
7
1 Room
temperature
Skin
colour
appearance 10±1
8±0.6 6±0.5 5±0.4 3±0.2 5.5
Flaour 8±0.8 8±0.5 7±0.4 6±0.3 7.25
Texture 9±0.6 8±0.5 4±0.3 2±0.3 5.75
Odour 8±0.5 6±0.4 5±0.3 5±0.4 6.0
2 Refrigerator
Skin
colour
appearance 10±1
9±0.6 8±0.4 7±0.3 5±0.3 7.25
Flaour 9±0.5 8±0.4 6±0.2 6±0.3 7.25
Texture 9±0.5 8±0.6 7±0.4 7±0.4 7.75
Odour 7±0.4 6±0.2 4±0.2 4±0.3 5.
3 EWSS2
Skin
colour
appearance 10±1
10±0.7 10±0.6 8±0.4 7±0.3 8.75
Flaour 10±0.5 8±0.4 7±0.3 6±0.4 7.75
Texture 9±0.6 9±0.5 9±0.7 8±0.6 8.75
Odour 10±1 10±0.8 10±0.6 8±0.3 8±0.5 9.00

27
Table 4.17 Organoleptic qualities of Tomato sample in different storage system
pretreated with calcium hydroxide
S.No Nature of
storage
Characters
of sample
Storage of Tomato in days Overall
acceptability Day
0 Day 1 Day 3
Day
5
Day
7
1 Room
temperature
Skin
colour
appearance 10±1
10±0.7 9±0.8 8±0.4 8±0.7 8.75
Flaour 8±0.8 7±0.7 7±0.4 7±0.5 7.25
Texture 8±0.5 8±0.4 7±0.7 7±0.4 7.5
Odour 8±0.4 5±0.9 5±0.5 4±0.4 5.5
2 Refrigerator
Skin
colour
appearance 10±1
10±0.7 8±0.6 7±0.8 7±0.4 8.0
Flaour 8±0.6 7±0.5 5±0.4 5±0.4 6.25
Texture 10±0.7 9±0.6 8±0.6 8±0.4 8.75
Odour 8±0.4 8±0.5 6±0.3 5±0.2 6.75
3 EWSS2 Skin
colour
appearance
10±1 10±0.7 10±0.4 8±0.7 8±0.8 9.0
Flaour 9±0.8 9±0.5 8±0.4 8±0.3 9.0
Texture 10±0.6 9±0.4 9±0.7 8±0.5 9.0
Odour 8±0.5 7±0.6 6±0.4 6±0.5 6.75

28

29

30

31

32

33

34
Table 5.18 Physiological Loss in weight of Grapes
S.No Nature of
storage
The percentage of physiological loss in weight
(g) in different storage Percentage
of loss Day 0 Day 1 Day 3 Day 5 Day 7
1 Room
temperature 14±1 13.8±1 13.0±0.3 12.5±0.4 12.1±0.3 13.57±2
2 Refrigerator 15±1 14.8±1 16.4±0.2 13.9±0.2 13.5±0.8 10.00±1
3 EWSS1 15±0.9 14.8±0.9 14.7±0.8 14.4±0.3 14.0±1 6.66±0.5
4 EWSS2 16±0.2 15.8±0.7 15.2±0.6 14.9±0.9 14.6±1 8.75±0.4
5 PEWSS 13±1 12.7±0.6 12.2±0.7 12.0±0.8 11.8±0.9 9.23±0.8
Table 4.19 Physiological Loss in weight of Banana
S.No Nature of
storage
The percentage of physiological loss in weight (g)
in different storage Percentage
of loss Day 0 Day 1 Day 3 Day 5 Day 7
1 Room
temperature 78.08±3 73.47±2 67.19±1 61.04±2 56.02±1 28.24±0.8
2 Refrigerator 85.13±2 84.38±2 82.07±2 78.91±3 75.59±2 11.19±0.7
3 EWSS1 85.27±3 84.73±2 83.97±3 80.41±2 76.20±1 10.05±0.8
4 EWSS2 79±1 78±1 77.7±1 76±1 74±1 7.59±0.5
5 PEWSS 80±1 78±2 77.2±2 76.3±2 73.5±1 8.12±0.6
Table 5.20 Physiological Loss in weight of Brinjal
S.No Nature of
storage
The percentage of physiological loss in weight
(g) in different storage Percentage
of loss Day 0 Day 1 Day 3 Day 5 Day 7
1 Room
temperature 313±2 308±1 300±2 285±1 275±1 12.14±0.8
2 Refrigerator 304±2 300.4±2 292±3 286.5±2 280±1 7.8±0.8
3 EWSS1 302±2 295±2 300.4±3 296.5±1 283±2 6.2±1
4 EWSS2 299.2±2 295.8±3 291±1 288±2 284.9±1 4.78±0.8
5 PEWSS 316±3 310±2 304±3 299±2 295±1 6.6±0.8

35
Table 5.21 Physiological Loss in weight of ladies finger
S.No Nature of
storage
The percentage of physiological loss in weight (g)
in different storage Percentage
of loss Day 0 Day 1 Day 3 Day 5 Day 7
1 Room
temperature 49.36±2 45.79±2 41.94±2.5 37.30±2 35.58±3 27.91±1
2 Refrigerator 46.59±1 46.39±2 45.52±2 44.74±2 42.84±1 8.04±1
3 EWSS1 43.58±1 39.5±1 39±1 38.3±0.9 37.4±0.8 5.87±0.5
4 EWSS2 41.3±2 41±2 40.9±1 40±2 39.6±2 4.11±0.7
5 PEWSS 40.3±1 39.5±1 39±2 38.5±1 37.8±1 6.20±0.3
Table 5.22 Physiological Loss in weight of Tomato
S.No Nature of
storage
The percentage of physiological loss in weight (g)
in different storage Percentage
of loss Day 0 Day 1 Day 3 Day 5 Day 7
1 Room
temperature 133±2 132.5±3 129.3±2 125.5±1 113±2 15.03±1
2 Refrigerator 122.3±1 121.3±1 117.3±2 115±2 112±1 9.23±0.9
3 EWSS1 133±1 132.5±2 129.3±1 125.5±1 123±2 7.52±1
4 EWSS2 146±2 144.3±2 142.6±1 140±1.5 138.3±3 5.2±0.8
5 PEWSS 113±1 112±2 111.3±2 110±0.8 106±0.9 6.19±0.9
Table 5.23 Physiological Loss in weight of Carrot
S.No Nature of
storage
The percentage of physiological loss in weight (g)
in different storage Percentage
of loss Day 0 Day 1 Day 3 Day 5 Day 7
1 Room
temperature 133±2 132.5±2 129.3±2 125.5±1 113±2 15.03±1
2 Refrigerator 122.3±2 121.3±1 117.3±3 115±1 110±1 10.5±0.9
3 EWSS1 133±2 132.5±2 129.3±3 125.5±2 123±1 7.51±0.7
4 EWSS2 137±3 135.6±1 132.9±2 130.5±2 128±0.8 6.50±0.8
5 PEWSS 135±2 133±1 131±1 128±1 125±2 7.40±1

36
Table 5.24 PLW OF PRETREATED SAMPLES IN DIFFERENT SAMPLES WITH DIFFERENT STORAGE
S.No Types of
storage
Types of
samples
Storage days
Control Pretreated (2% sodium hydroxide)
O day 1 3 5 7 O day 1 3 5 7
1
Room
Graphs
38.7±1 36.2±2
(6.45)
34.9±5
(9.81)
33.5±4
(13.43)
32.2±3
(16.7) 38.3±4
37.2±3
(2.81)
36±3
(6.0)
35.1±2
(8.35)
34.0±1
(9.66)
Refrigerator 27.7±2 27.0±3
(2.52)
26.2±3
(5.41)
25.0± 3
(9.74)
23.2±1
(12.6) 35.8±3
35.1±2
(1.95)
34.7±2
(3.07)
34.0±4
(5.02)
33.3±2
(7.14)
EWSS2 36.3±3 35.8±3
(1.37)
35±2
(3.30)
34.6±2
(4.68)
34.1±1
(6.06) 27.3±1
27.1±1
(1.09)
26.8±1
(1.83)
26.1±3
(4.39)
25.8±2
(5.49)
2
Room
Banana
148±4 145±4
(2.O2)
142±2
(4.05)
130±4
(12.16)
126±3
(14.87) 150±2
147±3
(2.00)
140.5±4
(6.33)
137.5±2
(8.33)
133±2
(11.33)
Refrigerator 146±2 142±2
(2.73)
137±1
(6.16)
134±2
(8.12)
130±3
(10.95) 143±3
141±4
(1.39)
138±3
(3.43)
136±4
(4.89)
132±3
(7.69)
EWSS2 143±3 141±1
(1.39)
138±4
(3.49)
136±3
(4.89)
132±2
(7.69) 151±2
148±5
(1.98)
146±2
(2.64)
147±2
(3.31)
145±3
(3.97)
3
Room
Brinjol
103.2±4 99.3±3
(3.78)
95.3±5
(7.65)
94.4±4
(8.5)
87.6±4
(11.15) 111.8±4
107.8±4
(3.57)
102.3±1
(8.58)
98.2±5
(12.6)
96.7±2
(13.50)
Refrigerator 130±3 127±4
(2.3)
125±3
(3.84)
124±3
(4.6)
122.6±3
(5.6) 169.8±3
167±2
(1.65)
165.8±2
(1.89)
164±2
(3.41)
163.7±4
(3.6)
EWSS2 148±1 148±3
(0.40)
147.1±4
(0.67)
146 ±2
(1.74)
144.5±2
(2.75) 112.4±2
112.2±2
(0.17)
111.4±3
(0.88)
110±3
(2.13)
109.8±2
(2.3)
4
Room
Ladies finger
70.2±2 69.1±5
(1.56)
68.0±3
(3.13)
66.2±2
(5.69)
65.1±2
(7.26) 71.2±2
70.4±1
(1.12)
69.8±3
(1.96)
69±4
(3.08)
68.2±4
(4.21)
Refrigerator 82.1±1 80.8±4
(1.58)
79.2±2
(3.53)
78.0±1
(4.99)
76.2±4
(7.1) 71.2±2
70.1±3
(1.54)
69.0±3
(3.08)
67.8±3
(4.77)
67.0±3
(5.8)
EWSS2 78.5±2 78±3
(0.63)
77.2±1
(1.65)
76.9±4
(2.54)
75.9±3
(3.31) 74.8±4
74.5±5
(0.40)
74.0±2
(1.06)
73.3±4
(2.00)
72.7±4
(2.80)
5
Room
Tomato
106.6±2 105.0±3
(1.50)
102.1±3
(4.31)
100±3
(6.19)
97.2±2
(8.81) 162.8±3
159±4
(2.33)
156.7±4
(3.74)
153.2±2
(5.89)
149.2±2
(8.35)
Refrigerator 114±3 112±1
(175)
111.1±2
(2.6)
109.6±3
(3.85)
108.2±2
(5.0) 140.3±1
139.7±2
(0.42)
138.5±4
(1.28)
136.2±1
(2.92)
134.2±3
(4.34)
EWSS2 121.8±4 121.2±0.9
(0.49)
120.8±2
(0.82)
119.4±2
(1.97)
118.4±1
(2.79) 125.6±2
125±2
(0.48)
124.2±3
(1.11)
123.7±4
(1.51)
122.8±3
(2.2)

37
4.4 MICROBIOLOGICAL STUDIES IN FRUITS AND VEGETABLES STORED
IN DIFFERENT STORAGE SYSTEMS WITHOUT PRETREATMENT
INTRODUCTION
Fruits and vegetables comprise a diverse range of plant products (leaves, roots,
tubers, fruits and vegetables). The consumption of fruits and vegetables is increasing as
consumer strives to eat healthy diets and benefit from the year-round availability of these
products that up until recently were considered to be seasonal. Most of these products are
generally eaten without further processing. Fruits and vegetables carry a natural non-
pathogenic epiphytic microflora.
During growth, harvest, transportation and further processing and handling the
produce can, however, be contaminated with pathogens from human of animal sources.
Consumers are also increasingly concerned about the potential contamination of fruits
and vegetables from the application of pesticides, chemical fertilizers and herbicides and
there is a growing demand for organically grown products. Production practices, growth
condition and the location of the edible part during growth (soil, soil surface, and aerial
part) will in combination with intrinsic, extrinsic, harvesting and processing factors
affect the microbial status at the time of consumption. (European Commission Report,
2002). Vegetables are tempting source of nutrient for spoilage organisms because of their
neutral PH and high water activity. Erwinia carotovora is the most common spoilage
bacteria (Tournas, 2005).
In the present study different types of earthenware storage systems (EWSS) were
tested for their efficiency to reduce microbial load/spoilage in household fruits and
vegetables. The fruits and vegetables were also pre-treated with disinfectants and stored
in earthenware storage system. The microbial load in EWSS stored products were
compared with other storage systems like refrigerator and ambient conditions.
RESULTS
Shelf-life of fruits and vegetables (time during which it remains stable and retain
its desired qualities) gets affected unless they are stored properly after harvesting. In the
present study the effectiveness of earthenware storage systems (EWSS) to inhibit
microbial spoilage of fruits and vegetables was studied. The storage efficiencies of
EWSS were compared with other storage system like refrigeration and ambient
conditions.
Total viable bacterial load in the fruit, grapes was 4.5×10⁵ CFU/g before storage.
After 1st` day of storage the total viable count of bacteria had increased to 25.9, 24.8,

38
22.0, 12.0, and 8.0×10⁵ CFU/g in grapes stored in room, refrigerators, EWSS1, EWSS2
and EWSS3 respectively. On the 7th day of storage the total viable count of bacteria in
grapes was too numerable to count (TNTC) in room, 127×105CFU/g in refrigerator,
115×105 CFU/g in EWSS1, 82×105 CFU/g in EWSS2 and no detectable bacterial count
in EWSS3. The total bacterial load in grapes stored in all EWSS did not get elevated as it
was observed in refrigerator. But at room temperature grapes had gained a high microbial
load.
EWSS is in no way inferior to refrigerator to store fruits and vegetables. The
result of the present study has shed light on the microbial quality as well as on the effect
of storage system. In order to minimize the microbial spoilage till the fruits and
vegetables reaches the table, like refrigerator, low cost EWSS can be used for household
purposes like grapes the total microbial load in banana did not show much difference in
EWSS when compared to refrigerators. On the 7th day of storage the total viable count
of bacteria in banana was too numerable to count (TNTC) in room, 87×105CFU/g in
refrigerator, 79×105 CFU/g in EWSS1, 84×105 CFU/g in EWSS2 and 1 X 24×105
CFU/g in EWSS3.
The total viable bacterial load in the vegetable brinjal was 30.5×10⁵ CFU/g on
day 0. On the 7th day of storage the total viable count of bacteria in brinjal was too
numerable to count (TNTC) in room, 280×105CFU/g in refrigerator, 209×105 CFU/g in
EWSS1, 250×105 CFU/g in EWSS2 and 2 X 24×105 CFU/g in EWSS3.
The total viable bacterial count in ladies finger was 26, 4, 15, 12 and 20×105
CFU/g before putting them into different storage systems. After 7 days of storage, the
total microbial load in ladies finger stored in refrigerator, EWSS and room got elevated.
After 7th day of storage the total viable count of bacteria in ladies finger was too
numerable to count (TNTC) in room. However it was 56×105CFU/g in refrigerator,
72×105 CFU/g in EWSS1, 52×105 CFU/g in EWSS2 and 6 X10⁵ CFU/g in EWSS3.
Between the two storage EWSS and fridge, the changes in Total viable count was less.
This indicates that EWSS is also a good chamber like fridge to store ladies finger.
The total viable bacterial count in Tomato was 3.5, 1.0, 1.6, 0.7 and 7.4×10⁵
CFU/g before putting them into different storage systems. After 7 days of storage, the
analysis of total microbial load in tomato stored in refrigerator, EWSS and room got
elevated. After 7 days of storage the total viable bacterial count (TVC) in tomato stored
at room was too numerable to count (TNTC). However it was 90×105CFU/g in

39
refrigerator, 150×105 CFU/g in EWSS1, 130×105 CFU/g in EWSS2 and no detectable
bacterial count in EWSS3.
The total viable bacterial count in carrot was 10, 3, 9, 5 and 6×10⁵ CFU/g before
putting them into different storage systems. After 7 days of storage, the analysis of total
microbial load in carrot stored in refrigerator, EWSS and room got elevated. After 7 days
of storage the total viable bacterial count (TVC) in carrot stored in room was too
numerable to count (TNTC). However it was 59 and 50×105 CFU/g in EWSS1 and
EWSS2 and 42×105CFU/g in fridge. In pyramidal storage the bacterial count was not
detectable, this indicates that EWSS3 is very efficient in containing microbial load.
Total viable count of bacteria in fruits and vegetables stored after pre-treatment
with calcium hydroxide
In this experiment two percent calcium hydroxide had been used to treat the
samples (grapes, banana, brinjal, ladiesfinger, tomato and carrot) and results were
recorded. Pre-treatment with calcium hydroxide reduced the microbial density to a
greater extent. The microbial density of treated grapes sample after 7th day of storage
was 87×105 CFU/g in room, 20×105 CFU/g in refrigerator, 67×105 CFU/g in EWSS1,
27×105 CFU/g in EWSS2 and no detectable bacterial load in EWSS3. Like grapes
sample, all other samples had the same results. This reduction of microbial load may be
due to antimicrobial property of calcium hydroxide. This study revealed that pre-
treatment of fresh produce by calcium hydroxide decreases the density of microbial
contaminant from the surface of the fresh produce.
Similar results were reported in hydrogen peroxide pretreatment (Ukuku, 2004).
It was reported that hydrogen peroxide (2.5% and 5 %) treatments of fruits for 5 minutes
caused a considerable reduction of the indigenous surface micro flora. Joshi et al.,
(2000) reported that samples rinsed with antimicrobial agents for five minutes showed
40-80% reduction in total number of organisms. Dhruba et al., (2006) reported that the
maximum shelf-life was noticed in 1% calcium chloride treated fruits (16, 50 days)
followed by 0.75% calcium chloride treated fruits (16, 17 days).
Calcium treatment could extend storage life and reduce the incidence of
physiological disorders and storage rots. (Sharma et al., 1996). The calcium chloride had
treatment significantly influenced the shelf-life of tomato fruits, Calcium treatment
extended the storage life and reduced the incidence of physiological disorders and
storage rots (Sharma et al., 1996) It was observed that samples kept in the room
temperature, EWSS1, EWSS2 and refrigerator had high load of microbes when

40
compared with pyramid. The low number of total viable count bacteria in fruits and
vegetables stored in pyramid was due to the influence of pyramid on both living and non
living matter. This is attributed to the property of pyramid capturing cosmic energy from
the surrounding, which is supposed to inhibit the growth of microorganisms by arresting
or retarding the decay process (Ravikumar et al., 2005). To conclude pyramid could be
used as a best eco-friendly, zero cost mechanisms to preserve fruits and vegetables
without microbial spoilage
Fig 3.1. TOTAL VIABLE COUNT OF BACTERIA (10-5
CFU/g) ON GRAPES STORED IN DIFFERENT STORAGE
SYSTEM
0
20
40
60
80
100
120
140
160
180
Normal Pretreated Normal Pretreated Normal Pretreated Normal Pretreated Normal Pretreated
Room Refrigerator Earthen ware storage
system 1
Earthen ware storage
system 2
Pretreated with pyramids
Storage Systems
TO
TA
L V
IAB
LE
CO
UN
T O
F B
AC
TE
RIA
(10
-5 C
FU
/g)
Days 0
Days 1
Days 3
Days 5
Days 7
Fig. 3.2. TOTAL VIABLE COUNT OF BACTERIA (10-5
CFU/g) ON BANANA STORED IN DIFFERENT STORAGE SYSTEM
0
50
100
150
200
250
300
Normal Pretreated Normal Pretreated Normal Pretreated Normal Pretreated Normal Pretreated
Room Refrigerator Earthen ware storage
system 1
Earthen ware storage
system 2
Pretreated with pyramids
Storage Systems
TO
TA
L V
IAB
LE
CO
UN
T O
F B
AC
TE
RIA
(1
0-5
CF
U/g
)
Days 0
Days 1
Days 3
Days 5
Days 7

41
Fig. 3.3 TOTAL VIABLE COUNT OF BACTERIA (10-5
CFU/g) ON BRINJAL STORED IN DIFFERENT STORAGE SYSTEM
0
50
100
150
200
250
300
Normal Pretreated Normal Pretreated Normal Pretreated Normal Pretreated Normal Pretreated
Room Refrigerator Earthen ware storage
system 1
Earthen ware storage
system 2
Pretreated with pyramids
Storage systems
TO
TA
L V
IAB
LE
CO
UN
T O
F B
AC
TE
RIA
(10
-5 C
FU
/g)
Days 0
Days 1
Days 3
Days 5
Days 7
Fig. 3.4 TOTAL VIABLE COUNT OF BACTERIA (10-5
CFU/g) ON LADIES FINGER STORED IN DIFFERENT STORAGE
SYSTEM
0
20
40
60
80
100
120
Normal Pretreated Normal Pretreated Normal Pretreated Normal Pretreated Normal Pretreated
Room Refrigerator Earthen ware storage
system 1
Earthen ware storage
system 2
Pretreated with pyramids
Storage Systems
TO
TA
L V
IAB
LE
CO
UN
T O
F B
AC
TE
RIA
(1
0-5
CF
U/g
)
Days 0
Days 1
Days 3
Days 5
Days 7

42
Fig. 3.5. TOTAL VIABLE COUNT OF BACTERIA (10-5 CFU/g) ON TOMATO STORED IN DIFFERENT STORAGE SYSTEM
0
50
100
150
200
250
300
Normal Pretreated Normal Pretreated Normal Pretreated Normal Pretreated Normal Pretreated
Room Refrigerator Earthen ware storage
system 1
Earthen ware storage
system 2
Pretreated with pyramids
Storage systems
TO
TA
L V
IAB
LE
CO
UN
T O
F B
AC
TE
RIA
(1
0-5
CF
U/g
)
Days 0
Days 1
Days 3
Days 5
Days 7
Fig. 3.6. TOTAL VIABLE COUNT OF BACTERIA (10-5
CFU/g) ON CARROT STORED IN DIFFERENT STORAGE SYSTEM
0
20
40
60
80
100
120
140
160
180
200
Normal Pretreated Normal Pretreated Normal Pretreated Normal Pretreated Normal Pretreated
Room Refrigerator Earthen ware storage
system 1
Earthen ware storage
system 2
Pretreated with pyramids
Storage Systems
TO
TA
L V
IAB
LE
CO
UN
T O
F B
AC
TE
RIA
(10
-5 C
FU
/g)
Days 0
Days 1
Days 3
Days 5
Days 7

43
5. OBJECTIVE – III
ANALYSIS OF VARIOUS ELEMENTS IN THE SOIL USED TO
PREPARE EARTHERNWARE
5.1 Introduction
In South India, particularly in Tamil Nadu earthenwares are used for all domestic
purposes. To prepare some Siddha and Ayurvedic medicine, the traditional healers use
only clay products. Even for distillation, earthenware distillation units are used. It is also
believed that pickles, curd, buttermilk etc, can be stored for a long time with a good taste
and flavour in earthenware. Further in Kerala and Kanyakumari districts of Tamilnadu,
people still use earthenwares to cook fish curry. Today earthenware that can be used in
microoven are also available for cooking.
Hence it has become interesting to study the utility value of earthenwares. In this
context, in the present study it has been planned to find out whether earthenwares like
pots and other earthenware debris can filter the toxic arsenic in the drinking water?.
Further the earthenware products developed from the clay collected from
different areas soil have different qualities like, colour, appearance, flexibility etc. So an
interest has been developed to find out the various chemical components present in
different soils and these components are useful to enhance consumer attraction are
studied. Also microbes associated with soil fermentation and bacteria were studied
MINERAL COMPOSITION IN THE CLAY SAMPLES USED TO PREPARE
EARTHENWARE STORAGE SYSTEMS
ENERGY DISPERSIVE X-RAY ANALYSIS (EDAX)
Clay used for earthenware products contains varieties of minerals. The minerals
present in the clay gives plasticity, strength, colour and other qualities to the product
(Banerjea, 1942) In the present study it was observed that the potters collect clay from
different regions and mix them in a particular proportion to prepare their products. For
example to make a cooling pot, the potters mix clay taken from, Vakaikulam,
Achankulam, and Karunai river bed soil. It is believed that each clay has different
mineral constituents. So it is essential to analyse the mineral composition in the clay that
are used for earthenware storage system.
Hence in the present study the clay samples collected from selected places like
Vagaikulam, Achenkulam and river bed soil were subjected to energy dispersive X-ray
analysis to find out the mineral composition.

44
RESULTS
Vagaikulam (Pond) Sample
The energy dispersive X-ray analysis pattern of the caly sample taken from the
village Vagaikulam has shown the presence of several minerals. The peak value, atomic
weight, and weight of the minerals are present in the table 5.1.
The figure1. showed peak for the presence of silicon, aluminum, magnesium,
manganese and oxygen. From the fig. (5 b) and the table (5 a.) it is clear that silicon is in
the highest proportion (23.38 percentage by weight, Atomic weight percentage is 17.86.
Next to silicon, the percentage weight of aluminum in the sample was 15.20 and
manganese was 12.35%. In the sample, the amount of magnesium percentage was trace
(01.30 percent by weight). The particle size of minerals (SEM analysis) (Fig 5 b) also
indicated the presence of silicon particles in a dominant proportion.
Achenkulam (Pond) Sample
The EDAX analysis of the yellow clay taken from Achenkulam showed the
presence of silicon, aluminum, barium and ferrous (Fig. 5.2a and 5.2b and Table 5.2) .
The amount of aluminium present in this clay was higher (19.68 percent by weight) than
silicon (19.20 percent by weight), and ferrous content was 7.41 percent by weight). The
amount of barium was traced. The SEM analysis also indicated that particle size of
aluminium, silicon that were dominating the clay.
Karunai River Bed Sample
Energy dispersive X-ray analysis of the river bed sand sample that was mixed
with the above two samples for preparing the clay products showed the presence more
number of elements (Fig 5.3a). In this sample 7 elements were found to be present viz.
silicon, aluminium, ferrous, titanium, calcium, potassium and manganese. Silicon was
dominating the minerals composition (23.19 percentages by weight), next to silicon,
ferrous was found in higher proportion (12.26 percentage by weight). The amount of
aluminium was (11.13 percentages by weight). In this sample it is very interesting to
observe the presence of titanium oxide (0.83 percentages by weight). Potassium and
magnesium were also present in trace amount. The SEM analysis of the particles showed
the higher amount of silica. From the study it is clear that the chemical composition
present in the soil plays an important role in the creation of an earthenware. Although the
various component present in the sample whether unknown to potters from the time

45
immorial they knew the importance of composition by practice and hence they have
mixed different clay to prepare good quality earthenwares
Fig. 5.1 Scanning electron microscope and x-ray diffracto meter
Fig. 5.1a : EDAX analysis of soil samples taken from Vagaikulam pond
Table-5.1a Table showing the percentage comparison of various elements present
Vagaikulam pond.
Element Wt % At %
O K 47.77 64.08
MnL 12.35 04.83
MgK 01.30 01.15
AlK 15.20 12.09
SiK 23.38 17.86

46
Fig. 5.1b SEM analysis of sample taken from Vagaikulam pond
Fig. 5.2a : EDAX analysis of soil samples taken from achankulam
Table showing the percentage comparison of various element present
Achankulam pond.
Element Wt % At %
O K 47.77 64.08
MnL 12.35 04.83
MgK 01.30 01.15
AlK 15.20 12.09
SiK 23.38 17.86

47
Fig. 5.2b SEM analysis of sample taken from Achankulam pond.
Fig. 5.3a : EDAX analysis soil samples taken from Karunai river bed soil
Table- 5.3a Table showing the percentage comparison of various element present
karunai river bed
Element Wt% At%
CK 08.00 13.52
OK 43.11 54.72
AlK 19.68 14.81
SiK 19.20 13.88
BaL 02.61 00.39
FeK 07.41 02.69
Matrix Correction ZAF
Fig. 5.3b SEM analysis of soil sample taken from Karunai river bed.

48
6. OBJECTIVES – IV
ISOLATION AND IDENTIFICATION OF MICROBES IN SOIL AND TO MAKE
POTTERY PRODUCTS
In pottery making, raw clay pots / or other clay wares are fired at high
temperature (above 5000C). The higher the temperature, the greater the clayware get
colour and appearance. During the firing process, it was surprise to find certain microbes
in the very hot clay wares. The heat tolerant microbes or thermophiles in clayware shed
lights on the role of this microbe to give some strength or other properties to the
clayware. This area needs a great attention. With this curiosity clay ware samples from
red hot kiln were collected aseptically and the microbe (bacteria) was isolated. As this is
a peculiar microbe, the gene sequence of this microbe was studied. This will be valuable
information for further studies.
MATERIAL AND METHODS
From a clayware manufacturing unit an unfired pot sample was taken. This small
pot was covered by a cotton cloth and mud paste was applied over the covering cloth.
This was fired in a muffle furnace at 9000C for 2 h. After firing the clay pot was
aseptically removed and powdered. From the powdered clayware, sample was collected
using a sterile loop and transferred to thermal agar broth. The plates were incubated for
24 h at 600c (Elnasser et al., 2007). After 24 h the bacterial colonies formed on the plates
were isolated and pelletized. The microbial pellets were subjected to 16sRNA studies
using PCR. The genomic DNA was isolated and amplified in HELINI Biomolecules,
Chennai.
16S rRNA amplification
The 16S rRNA was amplified using the bacterial specific primer pairs. The
reaction mixture for PCR amplification was prepared in a total volume of 50 μl with 25
μl Master mix (10 x Taq buffer, 2mM Mgcl2, 0.4 mM dNTP mix and 2U proofreading
Taq DNA polymerase), 2 μl bacterial genomic DNA, 1 μl forward and 1 μl reverse (10
pmoles/ μl) primers, 21 μl water and nuclease. The amplifications were performed in a
DNA thermal cycler 480 (Perkin Elorer, USA). The PCR reaction details were as
follows: 3 min at 94ºC for initial denaturation, 1 min at 94ºC for denaturation, 1 min at
65ºC for annealing, 1 min at 72ºC for extension with total 30 cycles of amplification and
5 min at 72ºC final extension. The 16S rRNA of PK strain was purified using

49
GenEluteTM Gel Extraction Kit (Sigma Aldrich, USA) and sequencing of 16S rRNA
gene was done in an automated ABI-3100 Genetic Analyser (GeNei, India).
Phylogenetic analysis
BLASTN (optimized for megablast) searches were manipulated with the
sequences of PK. (my sample) The corresponding sequence of representative species was
used for phylogenetic analyses. MEGA 4.1 software programme was started with a set of
aligned sequences using Clustal W, and searches for phylogenetic trees that are optimal
according Neighbor-Joining (NJ) and Maximum Parsimony (MP) algorithms (Tamura et
al. 2007).
RESULTS
Phylogenetic analysis
A 729 (PK) bp sequence was amplified from the genomic DNA with specific
primers and it was submitted to GenBank. As shown in Table 1, strain PK 16S rRNA
sequence was used for identity search, which was made using BLASTN algorithm 79
(optimized for megablast). The 16S rRNA gene showed high similarity with 16S rRNA
genes deposited in the GenBank (Table 1). PK strain 16S rRNA had 93% identity (E
value 0.0) with 16S rRNA gene of Exiguobacterium sp. (GQ503330) followed by 93%
identity (E value 0.0) with 16S rRNA gene of Bacillales bacterium (AB491820),
Exiguobacterium aestuarii (FJ462716), Exiguobacterium arabatum (FM203124),
Exiguobacterium panipatensis (EF519705), Exiguobacterium profundum (AY818050),
Exiguobacterium homiense (FJ999945) and Exiguobacterium aurantiacum (FJ460165).
In this study, 16S rRNA gene of different Exiguobacterium species (different strains of a
species) was obtained by BLASTN search, however 8 strains of Exiguobacterium
species were selected on the basis of high identity (%) with good E value for
phylogenetic analysis. As shown in Fig. 1A, 1B, 2A and 2B, two strains belonging to
Bacillales Family XIII. Incertae Sedis were relatively closely related to
Exiguobacterium; strain PK had a clade supported with E. aestuarii (FJ462716).
The cumulative results from a limited number of studies to date suggest that 16S
rRNA gene sequencing provides genus identification in most cases (>90%) but less so
with regard to species (65-83%), with regard to species from 1-14% of the isolates
remaining unidentified after testing (Drancourt et al., 2000; Mignard and Flandrosis,
2006; Woo et al., 2003). Michael and Sharon (2007) reported that, the minimum 500-525
bp essential for phylogenetic analysis, and also for species identification minimum >99%
similarity and ideal >99.5% similarity should be desirable. <0.5% similarity and other
50
properties such as phenotype should be considered to final species identification. E value
is related to the probability that the observed degree of similarity could have arisen by
change: E is the number of sequences that would be expected to match as well or better
than the one being considered, if the same database were probed with random sequences.
Values of E below about 0.05 would be considered significant; at least they 80 might be
worth considering (Arthur, 2005). According to Michael and Sharon (2007) and Arthur
(2005) reports, in this study, isolate PK (729 bp) had (93%) which was ideal less than
99.5% similarity and E value (0.0) <0.05 with Exiguobacterium sp., Bacillales
bacterium, Exiguobacterium aestuarii, Exiguobacterium arabatum, Exiguobacterium
panipatensis, Exiguobacterium profundum, Exiguobacterium homiense and
Exiguobacterium aurantiacum. According to the suggestion of Drancourt et al., 2000;
Mignard and Flandrosis, 2006; Woo et al., 2003 our PK had 93% with 0.0 E-value; it is
reveals strain PK belongs to the genus Exiguobacterium.
Comparison of 16S rRNA sequences has become the „gold standard‟ for the
elucidation of phylogenetic relationships among microorganisms. As the number of
sequences available for analysis continues to grow, the structure of phylogenetic trees
derived from these sequences becomes both more intricate and more accurate (O‟Connor
et al., 1991). Pernodet et al. (1989), Chang et al. (1997) and Fukushima et al. (2002)
reported that 16S rRNA, gyrB and 23S rRNA of various bacterial species were partially
sequenced and used for defining all members of the genus, groups of species or
individual species. In the present investigation, phylogenetic tree were constructed that
are optimal for NJ with topology and MP with topology.
As shown in Fig. 1A, 1B, 2A and 2B, two strains belonging to Bacillales Family
XIII. Incertae Sedis were relatively closely related to Exoguobacterium; strain PK had a
branch supported with Exiguobacterium aestuarii (FJ462716) where other species had
separate branch. The results supported that the phylogenic position of strain PK in the
genus Exiguobacterium might belong to the family Bacillales Family XIII. Incertae
Sedis. The results of a BLASTN analysis and phylogenetic analysis based on the 16S
rRNA sequences can be suggested strain PK should be positioned in the genus
Exiguobacterium aestuarii. In 81 addition, the special characteristics mentioned in the
study suggest that novel strain PK belong to the species Exiguobacterium aestuarii with
high identity.

51
Table 1. Results of similarity searches between 16S rRNA gene (PK) isolated in the
present investigation and GenBank accessions using BLASTN Algorithm
(optimized for megablast).
Highest Identical Species Matched Sequence
Accession number
Sequence
Identity (%)
E-value
Exiguobacterium sp
Bacillales bacterium
Exiguobacterium aestuarii
Exiguobacterium arabatum
Exiguobacterium panipatensis
Exiguobacterium profundum
Exiguobacterium homiense
Exiguobacterium aurantiacum
GQ503330
AB491820
FJ462716
FM203124
EF519705
AY818050
FJ999945
FJ460165
93
93
93
93
93
93
93
93
0.0
0.0
0.0
0.0
0.0
0.0
0.0
0.0
Fig. 1 - Phylogenetic trees are based on the nucleotide sequence of 16S rRNA genes.
The trees were constructed by using MEGA 4.1 software. (A) Neighbor-Joining
algorithm was used for tree construction. (B) Neighbor-Joining algorithm with
topology was used for tree construction.

52
Fig. 2 - Phylogenetic trees are based on the nucleotide sequence of 16S rRNA genes.
The trees were constructed by using MEGA 4.1 software. (A) Maximum Parsimony
algorithm was used for tree construction. (B) Maximum Parsimony with topology
was used for tree construction.

53
7. OBJECTIVE – V
INCORPORATION OF HERBAL POWDER IN TO POT
In India, purified potable water is not available in many rural villages. In many
villages in Tamil Nadu and West Bengal rural people depend on ground water sources to
meet their water need. Ground water is taken out through bore wells and wells. Ground
water is polluted by many pollutants like toxic metals, pesticides etc. In many parts of
Tirunelveli district, drinking water sources in many villages is contaminated with a
variety of chemicals of which fluoride and Arsenics are common. Water contaminated
with fluoride and arsenics cause many health problems. Arsenic in water causes
hyperkeratosis, cancers in bladder, skin and other internal organs (Andrews, 1980).
WHO has given a standard value of 0.01 mg/l arsenic in drinking water as a permissible
level.
In rural village people can’t afford to install sophisticated water purifier to
remove arsenic. Hence if some indigenous technologies are developed, it will be a great
boon to thousands of poor villagers who are use arsenic contaminated water innocently.
So in the present study a novel method of removing arsenic in drinking water was tried.
For the removal of such contaminant earthen pots with earthenware pieces and naturally
occurring material were used.
MATERIALS AND METHODS
To test the efficacy of earthen pots to remove arsenic in drinking water, earthen pots
were used. To carry out the study three earthen pots of uniform capacity (20 liters) were
developed at Alwarkurichi potters society. The pots were piled one above the other.
Three types of pot systems were used. In type 1 pot system the top pot was (Fig 5.4 &
5.5) filled with 1 litter of broken pieces of clay tiles and bricks, and one liter of stone
pebble pieces. In the centre of the pot a hole of 5 cm was made and a circle of 100%
polyester batting was placed over it. So that water can flow slowly from the hole in the
bottom of the pot.
This pot 1 is placed over another pot that contained 1 litter wood charcoal and 1 litter
fine sand. In the middle of the bottom 5 mm hole was made and this was covered with a
circle of 100% polyester batting as provided in the above mentioned pot. In the third pot
filtered water was collected. To hold the pots, erect wooden stands were given for
support. This setup is a control system. For the experiments few modifications were
made in this setup. In the setup 2 in the second pot of the set up one liter of dried pieces
of the plant “sivanar vembu (Indigofera aspalathoides)” was kept above wood charcoal.

54
CONTROL POT SYSTEM
Pot 2 1 litter wood charcoal and 1 litter fine sand
Pot 1 1 litre of broken pieces of clay tiles, stone pebble and bricks
Pot 3 contains filtered water
TEST POT SYSTEM
Pot 3 contains filtered water
Pot 2. 1 litter of dried pieces of Sivanar vembu
Pot 1. 1 litre of broken pieces of clay tiles, stone pebble and bricks
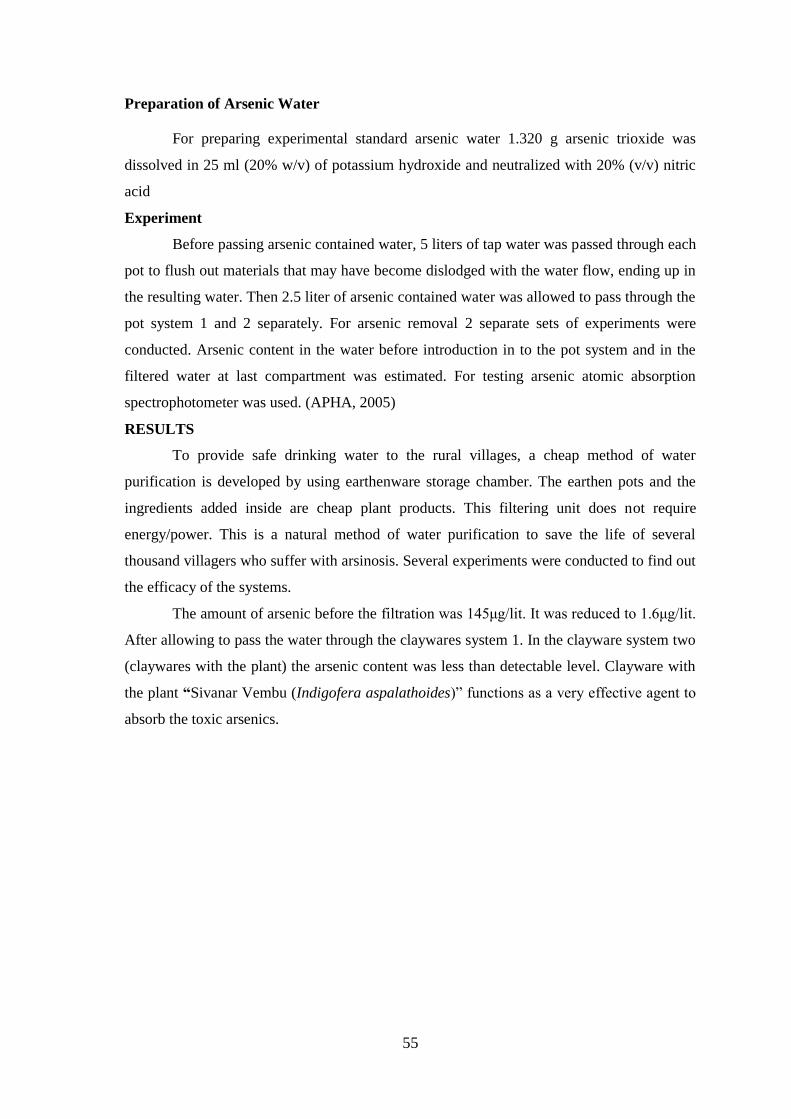
55
Preparation of Arsenic Water
For preparing experimental standard arsenic water 1.320 g arsenic trioxide was
dissolved in 25 ml (20% w/v) of potassium hydroxide and neutralized with 20% (v/v) nitric
acid
Experiment
Before passing arsenic contained water, 5 liters of tap water was passed through each
pot to flush out materials that may have become dislodged with the water flow, ending up in
the resulting water. Then 2.5 liter of arsenic contained water was allowed to pass through the
pot system 1 and 2 separately. For arsenic removal 2 separate sets of experiments were
conducted. Arsenic content in the water before introduction in to the pot system and in the
filtered water at last compartment was estimated. For testing arsenic atomic absorption
spectrophotometer was used. (APHA, 2005)
RESULTS
To provide safe drinking water to the rural villages, a cheap method of water
purification is developed by using earthenware storage chamber. The earthen pots and the
ingredients added inside are cheap plant products. This filtering unit does not require
energy/power. This is a natural method of water purification to save the life of several
thousand villagers who suffer with arsinosis. Several experiments were conducted to find out
the efficacy of the systems.
The amount of arsenic before the filtration was 145μg/lit. It was reduced to 1.6μg/lit.
After allowing to pass the water through the claywares system 1. In the clayware system two
(claywares with the plant) the arsenic content was less than detectable level. Clayware with
the plant “Sivanar Vembu (Indigofera aspalathoides)” functions as a very effective agent to
absorb the toxic arsenics.

56
8.MILE STONES FIXED AS PER AGREEMENT:
S.No Milestone Target
Achieved
1
2
3
4
5
6
Models of Earthernware storage system
Structure of Earthernware designed for storage
Biochemical characteristics Organoleptic qualities
Physiological weight changes and microbiological
studies
Analysis of various elements in the soil used to
prepare pottery products
Isolation and identification of microbes in soil
used to make pottery products
Incorporation of herbal powder and microbes in
pottery products
Capacity building Training market ability.
9. Deviation made from objectives if any: -NIL-
10. Conclusion summarizing the achievements and indications of scope for future
work
For a healthy life, good nutritional food consumption is essential. To get minerals,
vitamins and other nutrients, people consume fruits and vegetables. The demand for fruits
and vegetables increasing day by day. As fruits and vegetables are grown mostly by applying
chemical fertilizers and pesticides, their shelf-life period is poor, unless they are preserved in
good storage systems like refrigerators. To consume fresh and unperished fruits and
vegetables, every house needs a storage system. If fruits and vegetables are not properly
cared before consumption, they not only get perished but also inflict food-borne illness.
Hence proper storage of fruits and vegetables is imperative in each kitchen. Preserving the
fruits and vegetables, for domestic use by using refrigerators or deep freezers not only
pollutants to the atmosphere but also consumes electricity. In order to avoid pollutional
discharge from home hold storage chambers and to minimize poor people’s expenditure on
maintenance and electricity to keep to storage chambers, attempts had been made to design
develop a “poor man’s storage system”.
In the present study eco-friendly, economic, effective, earthenware storage systems
were created to store fruits and vegetables. Three designs were created and based on the
design, three types of home hold storage chambers were developed. For making the storage
chambers, the skills of pottery artisans were applied. Using clay pottery techniques the

57
storage systems were developed. The utilization of clay pottery for making poor man’s fridge
has many objectives. It helps to rejuvenate the dying art of day pottery and give life to
thousands of pottery artisan’s family whom are suffering because of the poor market demand
for pottery products in this era of metal culture. Besides clay pottery products are eco-
friendly, degradable, low-cost and no maintenance expenditure. Rural people can afford to
purchase this low-cost storage system. This natural way of storing the perishable fruits and
vegetables provide good nutrients supply and good health.
In the present study, three types of earthenware storage systems, viz: Basic model of
earthenware storage system (EWSS1), Modified model of earthenware storage system
(EWSS2) and pyramidal type earthenware storage system (EWSS3) were developed. For
making these units clay material were collected from local Ponds and mixed them is proper
ration. Using modern scientific knowledge the clay materials were processed and three types
of poor man’s fridges were developed.
After developing the eco-friendly storage systems the utility value and efficiency to
store fruits and vegetables were studied in detail by applying various testing procedures.
Microbial contamination easily occurs in fruits and vegetables, if they are not stored
properly. The storage systems should inhibit the microbial growth on the stored products. So
in the present study microbial load in the following food products, grapes, banana, brinjal,
ladiesfinger, and carrot was enumerated before putting them in to the earthenware storage
systems. After a periodic intervals of 3rd day, 5th day and 7th day, the microbial load in each
stored item was tested and the results were compared with the same fruits and vegetables
stored in refrigerator and in ambient condition. To the surprise it was observed that the
pyramidal type earthenware storage system significantly minimized the microbial load more
than the modern refrigerator and ambient condition.
Retention of biochemical constituents (carbohydrates, proteins, and vitamins) in
fruits and vegetables were studied. The fruits and vegetables stored at earthenware storage
systems retained all the nutrients at an astonishing level when compared with the products
stored in refrigerators.
Highly significant differences were recorded in the physiological loss of weight
among the different storage systems. The maximum weight loss was observed in all fruits
and vegetables in the ambient conditions followed by refrigeration whereas PLW was low in
fruits and vegetables stored in EWSS2 followed by EWSS1 and EWSS3. The result indicated
that EWSS2 is a good storage unit to reduce the loss of weight for stored fruits and
vegetables.

58
Organoleptic quality of the fruits and vegetables were quantified before putting them
into the earthenware storage system. After 7 days of storage Organoleptic properties (skin
colour appearance, texture, and flavour and taste) were estimated in the fruits and vegetables
stored in earthenware storage systems and refrigerator and at room. The study revealed the
efficiency of the earthenware to retain Organoleptic qualities more than the refrigerator.
For preparing clay wares, clay soil was collected from 3 major sources in the study area. In
the present study the day sample collected from the study areas were tested for mineral
constituents advanced instruments XRD and EDAX with SEM were used. The study
provided information on the different minerals in each day. The clay contained silicon,
Alumina, manganese, ferrous, barium, titanium, calcium, and potassium. Such mineral
components give strength to the pots, promote evaporation, provide flexibility create the pot
colour and appearance to the products. Further, to promote the importance of clay products
to use as filters, attempts were made to test the efficiency of the products to remove arsenic
from potable water. Two types to earthen pots were used. In one of the types a plant material
“Sivanarvembu” (Indigofera aspalathoides) was placed to enhance filtering. In this unit, the
filtered water contained arsenic content below detectable level. From these experiments it is
inferred that the clay pot can be used to remove toxic arsenic in drinking water.
Along with the newly designed clayware storage systems that are to be obtained
patent rights, other kitchen wares are to be developed shortly. It has been planned to develop
micro-oven usable claywares, dosa pan, cookers, etc. and to provide training to the poor
potters to develop the novel products. This could help them to sustain their lively hood and
prevent the extinction of this great art of pottery making.
11. S & T benefit accrued.
1. Journal publication during the period.
Title of the paper Journal issue Authors
Evaluation of shelf life and
organoleptic aspects of fruits stored
in a modified traditional earthern pot
cool chamber
Indian Journal of
Traditional Knowledge
(NISCAIR). 2011. 10(2);
375 – 379.
A.J.A.Ranjit Singh,
A.M.Murugan and
S.Vidhya
2. Presentation in Symposia / Conference during the period.
Title of the paper Symposium Date of
Symposium
Authors
1.Efficiency of
modified rural based
post harvesting
technology to
preserve biochemical
International colloquium
on Emerging
Biotechniques in
agriculture animal health
and productivity. Alagappa
23.04.2009
–
26.02.2009
A.J.A.Ranjit Singh
and A.M.Murugan

59
and organoleptic
value of vegetables
and fruits.
2.Modified earthen
pot cool chambers for
vegetable storage.
3.Eco-friendly
pyramidal type
earthen were storage
system for rural house
hold system.
University, Karaikudi.
Application of
Biotechnology in medicine
and in law. S.P.College,
Courtallum.
98th
Indian Science
Congress, SRM
University, Chennai
06.03.2009
03.01.2011-
07.01.2011
A.J.A.Ranjit Singh
and A.M.Murugan
A.J.A.Ranjit Singh
and A.M.Murugan
Biologically treated clay developed
A.J.A. Ranjit Singh, Head, Department of Advanced Zoology and Biotechnology, Sri Paramakalyani
College, Alwarkurichi, (left) with the zero energy cool chamber and A.M. Murugan, a reasearch scholar in pottery.
TIRUNELVELI: The Department of Advanced Zoology and Biotechnology of Sri Paramakalyani College,
Alwarkurichi, in the district has revived art of pottery in this region by supplying to the traditional potters four bacteria and three fungi varieties, which add more plasticity to the clay being used for making pots and other
value added products of clay like zero energy cool chambers, kitchen utensils, ornamental products, light shades, musical instruments, religious products etc.
After being funded by the Department of Science and Technology, Government of India, a team of researchers headed by A.J.A. Ranjit Singh, Head, Department of Advanced Zoology and Biotechnology of Sri Paramakalyani College commenced their research on December 1, 2008 on isolating the beneficial bacteria and the fungi from different types of soil to process the clay and to make a range of value added utensils. Zero energy cool chamberThe zero energy cool chamber, made with the bacteria-treated clay, can keep the vegetables and fruits for up to nine days and no shrink can be seen on the skin of the veggies as temperature prevailing in this specialized chamber that does not need any power is as low as 21 degree Celsius. While the specially-treated earthen frying pans, idly pans, dosa tava etc. need only a small quantity of oil, the clay bowl used in the microwave oven does not develop any crack or spoil the food. Another interesting aspect is that these clay utensils do not consume more fuel. For preparing the non-stick clayware, Dr. Ranjit Singh's team has developed ‘black pottery technology'. To enhance the quality of water being stored in these clayware, the team has used imported ‘super cera', a pro-biotic microbial chip from the United States of America. “As part of giving a new lease of life to the artisans, we've succeeded in our attempt of isolating four beneficial bacterium and three fungi to soften the clay being used for pottery. Subsequently, we trained the local potters in using the isolated micro organisms in the clay to make it soft and add more plasticity. Moreover, we've replaced the conventional flower pots, cooking pot and the household clay furnace with eco-friendly, economical, efficient and attractive clayware that consumes less fuel,” Dr. Ranjit Singh told The Hindu. As the cost of all these products so cheap (the zero energy cool chamber carries a price tag of just Rs. 500), it is expected that the clayware made with specially treated clay will rock the market, Dr. Ranjit Singh noted.

60
Indian Science congress – 98, 3-7-2011
3. Patented during the period.
1. Clay made percussion musical instrument - 1036/CHE/2011.
2. Low cost high capacity indigenous anaerobic chamber
For the culture of anaerobic microbes - 1037/CHE/2011.
3. Zero-energy earthen were cool chamber for house hold
fruits and vegetables storage - 601/CHE/2011.

61

62
4.Man power trained

63

64
5. Replication potential
In the present study the potters in Tirunelveli districts were trained in their
villages. Except the microbial culture handling, all the other techniques we followed by
the trainees and earn money.
5. Linkages developed
Linkages with 17 potters society hamlets and also with national centre.
Date : Signature of Principal Investigator
Place