reinsurance section newsletter, issue no. 50, june … news number 50 june 2002 1 the future lies...
TRANSCRIPT

REINSURANCE NEWS
NUMBER 50 JUNE 2002
1 The Future Lies Aheadby Chris C. Stroup
1 Ten Predictions for the Future ofthe Life Reinsurance Industryby Jess A. Skriletz
1 Winners and Losers in aConverging Global Marketby David B. Atkinson
2 Chairperson’s Cornerby Jeffrey S. Katz
3 Editor’s Cornerby Dean S. Abbott
16 SPRA Pools in Light of September 11th Tragediesby James B. Keller
17 Highlights of the 2001 Manulife Reinsurance Mortality Studyby Manon Laverdiere and
Valerio Valenti
23 The Relationship of Mortality Projections and The Underlying Mortality Tables Usedby Larry Warren
28 Life Reinsurance Data From The Munich American Surveyby James L. Sweeney and
David M. Bruggeman
(SEE INSERT) Apply To Join Today!
IN THIS ISSUE
continued on page 4 continued on page 8
There is anold jokeabout the
difference betweenAmerican andSicilian actuaries.While both groupscan tell you howmany people out ofa thousand will diein the coming year,the Sicilians cantell you their names. In this article Iam going to name company names.Be rest assured that I have no tiesto La Cosa Nostra—I will not makeany offers that you cannot refuse.
I’m going to confine my observa-tions to the U.S. life mortality riskmarket. I’ll take a look back in time,roll in some discussion of currentconditions, and stick my neck out totry and predict the future.
continued on page 11
The future of life reinsurancein America is certainly oursto win or to lose. The forces of
today—expanding technology, tight-ening capital, regulatory rumblings,mergers and acquisitions—willaffect the focus of tomorrow. If wewish to win the day, one to prosperin a changing environment, we needto begin preparing ourselves now forthe challenges that lie ahead.
What are those challenges? Anyattempt to polish my crystal balland peer into that future yields bothpositives and negatives, reasons tohope and reasons to tread carefully.
We’ve all had days when wewished we could know thefuture. The business deci-
sions facing us would be mucheasier if only we had a crystal ball. Ican’t give you a crystal ball, but Ican offer a number of predictionsand observations for the future oflife reinsurance over the next fiveyears. If you are like me, you takepredictions with a healthy dose ofskepticism. I hope to give you somethings to think about that will shapeyour own opinion of the future of lifereinsurance.
What do I see? A competitivemarket with a significant slowdownin growth coming from the rapidpace of growth seen recently, anincreasing appreciation by lifeinsurance companies of the finan-cial strength of their partners,
The Future that LiesAhead...by Chris C. StroupCEO of Swiss Re Life & Health, North America
“Yesterday is not ours to recover, but
tomorrow is ours to win or to lose.”
— President Lyndon B. Johnson
address to the nation
Nov. 28, 1963
Ten Predictions for the Future...by Jess A. SkriletzGeneral Manager and CEO of ING Re
Winners & Losersin a ConvergingGlobal Marketby David B. AtkinsonExecutive Vice President and COO of
Reinsurance Group of America
NEWSLETTER OF THE REINSURANCE SECTION
THE FUTURE OF LIFE REINSURANCE
DavidAtkinson
The following articles are based upon presentations given at the ACLI’s Reinsurance Executive Roundtable held at Amelia Island, Florida, on February20-22, 2002. The Reinsurance Section newsletter thanks David Atkinson, Jess Skriletz, and Chris Stroup for writing the following articles for this edition.

This newsletter is free to Section members. A
subscription is $15.00 for nonmembers.
Current-year issues are available from the
Publications Orders Department. Back issues
of Section newsletters have been placed in
the Society library, and are on the SOA Web
site, www.soa.org. Photocopies of back
issues may be requested for a nominal fee.
Expressions of opinion stated herein are,
unless expressly stated to the contrary, not
the opinion or position of the Society of
Actuaries, its Sections, its Committees or the
employers of the authors.
The Society assumes no responsibility for
statements made or opinions expressed in
the articles, criticisms and discussions
contained in this publication.
Copyright © 2002 Society of Actuaries. All rights reserved. Printed in the United States of America.
Newsletter Editor/Web Liaison (2002)Dean S. Abbott, FSAAllianz Life Insurance Company of N. AmericaP.O. Box 884Minneapolis, MN 55440-0884Phone: (763) 765-6248Fax: (763) 765-6203E-mail: [email protected]
OFFICERSChairpersonJeffrey S. Katz, FSAVice-ChairpersonJames W. Dallas, FSASecretary/TreasurerMelville J. Young, FSA
Council MembersTimothy J. Alford, FSARobert W. Beal, FSAJay D. Biehl, FSA
D. Leigh Harrington, FSARonald L. Klein, FSARobert J. Reale, FSA
SOA StaffLois Chinnock, Section CoordinatorPhone: (847) 706-3524Fax: (847) 273-8425)E-mail: ([email protected])
Joe Adduci, DTP CoordinatorPhone: (847) 706-3548Fax: (847) 273-8548E-mail: ([email protected])
Society of Actuaries475 N. Martingale Road, Suite 800Schaumburg, IL 60173Phone: (847) 706-3500Fax: (847) 706-3599Web: www.soa.org
NUMBER 50 JUNE 2002REINSURANCE NEWSNEWSLETTER OF THE REINSURANCE SECTION
The issue I would like to bringto the Section’s attention, intwo different flavors, is an
old refrain: participation. The SOAand its various component sub-groups, such as the Sections andPractice Areas, get the vast major-ity of their work accomplishedthrough the efforts of membervolunteers. Like any organization,we are only as good as we collec-tively choose to be through our ownefforts. I urge each member to takeat least a small share of responsibil-ity for what we are as a section byvolunteering. You could write anewsletter article, present at asection session or find a variety ofother ways to contribute.
Our current volunteers arecontributing in important ways. TheSection Council members who havetaken over the creation of interest-ing and informative sessions for the
various Society meetings have donea terrific job. I expect this year’smeetings to have one of the bestsession lineups the Section has puttogether in the last several years.Another key Section activity is thisnewsletter, where over the past 18months, the editorial reins havepassed smoothly to a new editor.
Part of my concern is that I seethe same members volunteeringtime and again to contribute to ouractivities. As Section Chair, Icertainly appreciate the efforts ofthose individuals. But we need toget other members into the mix.There will come a time when theusual volunteers are not available,and we’ll need others to stepforward to shoulder the burden.Beyond that, the Section wouldbenefit from the new ideas thatothers would contribute by provid-ing new ways of seeing and doing
things that wouldbring neededrefreshment tosome of our routineactivities. Finally, Ihave observed thatthose who volun-teer today will leadtomorrow. We needto continuallydevelop new lead-ers who can takeus through the uncharted waters ofthe future.
So, don’t delay! New classes arebeing formed now! Operators arestanding by to take your call at 1-800 . . . or not. Still, if you want toparticipate but just don’t know howto get started, give me a call or sendme an e-mail. I assure you that allreplies will be kept in strictestconfidence and no salesman willcall.
2 JUNE 2002
REINSURANCE NEWS
Chairperson’s CornerParticipationby Jeffrey S. Katz
JeffKatz

At the Reinsurance HotBreakfast in New Orleanslast October, Jeff Katz
mentioned that within the monthsthat followed we would be issuinga special edition newsletter cover-ing the reinsurance impacts of theevents of September 11. It was ourintention to do so, and we hadlined up authors for multiple arti-cles on the topic. Unfortunately,only one of the promised articles
was ever written and submitted,therefore, the special editionnewsletter never was. Hopefully,you haven’t been scouring your in-basket wondering if you hadmisplaced it. The one article thatwas submitted, Jim Keller’s articlediscussing the SPRA, has beenincluded in this newsletter. Ifanyone is interested in writing anarticle for future newslettersdiscussing the impacts of
September 11, wewould be veryinterested in hear-ing from you.
Dean S. Abbott,FSA, MAAA, is vice president, rein-surance actuaries, at Allianz LifeInsurance Company of NorthAmerica in Minneapolis, MN. Hecan be reached at [email protected].
JUNE 2002 3
REINSURANCE NEWS
CorrespondentMembershipOne way to increase the odds ofadding volunteers is to add newmembers. The Reinsurance Sectionis doing that through the creation ofCorrespondent Member statuswithin the Section. Correspondentmemberships are available to non-members of the Society who wish toparticipate in the activities of theReinsurance Section. Dues forCorrespondent Members are thesame as for other Section members:$10 per year at present.
Correspondent Members haveaccess to Section activities just asother Section members do and alsoreceive a subscription to the newslet-ter. It’s a great way to participate inthe Section without having to dealwith those pesky exams!
The SOA Board of Governorsapproved Correspondent Memberstatus as a change to the Section’sby-laws earlier this year. LoisChinnock of the SOA staff hasdeveloped an application form, acopy of which is included with thisnewsletter. The form is also avail-able on the Section’s page of theSOA Web site. Please spread theword to those in your organizationwho might be interested.
Spring MeetingsAs you are reading this, the SpringMeeting in Colorado Springs will behistory and the San Francisco meet-ing will be just about to start. The
featured Reinsurance session atboth Spring Meetings is a mocktrail. The topic is a timely one—thewar exclusion. The product develop-ment/financial meeting at the endof May also offered a reinsurancesession on a unified mortalityapproach. The health/pension meet-ing offers additional reinsurancesessions on provider excess stop-lossand trends in large claims. We areco-sponsoring these sessions withthe Health Section. My thanks toRonnie Klein, the Section Councilmember responsible for the SpringMeeting sessions, for all of hisefforts in developing the sessionsand recruiting presenters.
SeminarThe Section sponsored an “Intro-duction to Life Reinsurance”seminar June 11-12 in suburbanChicago near O’Hare Airport. Theseminar focused on the basics of lifereinsurance including actuarial,legal, accounting and regulatoryaspects. We offered the seminar inconjunction with the ProductDevelopment Actuary Symposiumlater that same week. Jim Dallas,the Section’s vice-chairperson,organized the seminar. Presentersincluded Denis Loring, TomSpurling, Craig Baldwin, Al Kleinand myself. The seminar wasapproved for 10 units ofProfessional Development credit. Inaddition to actuaries, there werenon-actuaries in attendance whowanted to learn more about reinsur-ance basics.
Jeffrey S. Katz, FSA, MAAA, issenior vice president at MunichAmerican Reassurance Company inChicago. He can be reached [email protected] or by phone at(312) 863-8253.
Editor’s CornerThe Special Edition that Never Was...by Dean S. Abbott
DeanAbbott
“One way to
increase the odds
of adding volun-
teers is to add
new members.”

4 JUNE 2002
Reasons for optimismFortunately, the reasons for opti-mism are numerous. The U.S. lifeinsurance marketplace seemsheaded for a secure tomorrow, andwhat’s good news for life insurers isalso good news for life reinsurers.
As the American people lookforward to longer and healthierlifespans, they’ll need to set asidemore money for their retirementyears. The current interest rates oftraditional savings vehicles are low,which makes life insurance evenmore attractive.
In addition, the U.S. life insur-ance industry has specialcharacteristics that keep it poisedfor success. As a whole, U.S. lifeinsurers are remarkably adept atdeveloping new products, and theirmortality knowledge gives them asignificant comparative advantageon a global scale. Product distribu-tion remains an area with greatpotential that so far has not beenfully exploited. Also not fullyexploited is the U.S. insurers’investment in technology. Moneyhas been spent, improvementshave been made, but the hoped-forcost savings due to lower expenseratios are still somewhere in thefuture.
On the downside…Unfortunately, not everything ispositive. There are challenges andobstacles on the U.S. insurance hori-zon that must be successfullynavigated.
Chief among those obstaclesare formidable new competitorscreated by the convergence offinancial servicesindustries in theUnited States.Mergers andacquisitions inthis field haveled to impos-ing
competitors with substantialresources. Merrill Lynch andMorgan Stanley are good examples.Together, thesetwo companieshave greatermarket capital-ization at theirdisposal thanthe top eightU.S. life insur-ance companiescombined.Needless to say,that gives Merrill Lynch andMorgan Stanley a considerablecompetitive advantage.
In addition, these new competi-tors have a keen understanding ofconsumer needs. And if the factorsthat now give insurers an advan-tage—the tax-deferral subsidy andestate tax laws—are ever elimi-nated or restructured, these newcompetitors will eagerly move intoour marketplace.
State insurance regulationsremain, of course, a constant cloudon the horizon. Regulations drive upadministrative costs and increasecapital requirements, making itmore difficult for the insuranceindustry to compete with financialservices giants that aren’t hobbledby 50 sets of state regulation.
As these giants compete for ourclients, they also fish in our talentpool. The supply of underwriters,actuaries, accountants and manage-ment professionals is not unlimited.With more companies vying forthese talents, fewer capable peopleare available to fuel the insuranceindustry’s progress.
Fragmented roles and assets
Technology hascontributed its own
interesting wrinkleto the future oflife insurance.With theInternet’s abilityto seamlessly
link computers and systems, compa-nies across state lines andinternational boundaries, it’s now
transparent tothe consumer justwho actually isproviding theservices he’sreceiving.
In the past, asingle life insurerwould have beenresponsible formanaging invest-
ment assets, manufacturingproducts, distributing those prod-ucts, providing customer service,taking on risk and administering itsaccounts. With technology, however,those roles have fragmented withlife insurers often retaining only aportion of the responsibilities.Today, those functions fall to a vari-ety of parties:
• Managing investment assets—handled by fund managers and insurers.
• Manufacturing products—still performed by life insurers.
• Distributing products and providing customer service—may be performed by a variety of credible, trusted advisors, such as banks, brokerages and independent financial planners, in addition to insurers.
• Risk taking—often handed off to reinsurers.
• Administering accounts— may be outsourced to professional third-party administrators.
This fragmentation of traditionallife insurance roles has conse-quently led to a fragmentation ofavailable assets, as well. In 1989,before this fragmentation began,life insurers had $1.4 trillion in
REINSURANCE NEWS
The Future that Lies Ahead
from page 1

JUNE 2002 5
REINSURANCE NEWS
assets under management. Anequal amount was being managedby mutual funds, broker/dealersand market funds. This means thetotal available assets were split 50-50.
What a difference a decademakes. In 2000, with service frag-mentation well underway, lifeinsurers’ assets under managementrose to more than $3.1 trillion. Butthe assets managed by mutualfunds, broker/dealers and marketfunds leap-frogged ahead to $7.7trillion. It was no longer a 50-50split. Instead, life insurers managedonly 29 percent of those assets, withthe remaining 71 percent going toother financial services companies.
As service fragmentation contin-ues, life insurers are faced withmanaging a smaller portion of theavailable assets.
Reinsurance opportunitiesFor reinsurers, this service frag-mentation offers new opportunitiesin the United States. As more lifeinsurers look to share their risk,more business is available for rein-surance companies. We canmeasure the growth by looking atcession rates, which is the percent-age of new face amount that hasbeen ceded to the reinsurancemarketplace. In 1993, the cessionrate was 15 percent. By 2000, thatamount had more than quadrupledto 64 percent. When the numbersare in for 2001, they could top 70percent.
Overall, the U.S. reinsurancemarket grew at a compounded rateof 29 percent, compared to a mere 5percent for the primary insurancemarket. There are several reasonsfor this increase in reinsurancebuying:
• Primary insurers are eager to avoid earnings volatility, and reinsurance is a key tool to accomplish that goal.
• The transformation of insurers to a fee-based business model has made it more attractive.
• Reinsurance rates are tempting.
The last point bears expansion.Over the past five years, life rein-surance prices have actually gonedown, largely due to strict under-writing that produces lowermortality assumptions. Before leav-ing the subject of prices, it should benoted that the terrorist attack ofSeptember 11, 2001, has moderatelyaffected the price of vanilla reinsur-ance for the group life market,where there is a built-in concentra-tion of risk. September 11 has hadthe greatest effect on the price andavailability of catastrophic coverage
for both group and individual lifeinsurance. This coverage is dramati-cally more expensive and difficult toobtain. Only time and future eventswill tell us if these markets willever return to pre-September 11conditions.
Moderating the futureWith falling reinsurance prices andrising cession rates, what does thefuture hold for U.S. life reinsurers?Are we on an unstoppable upwardpath? That would be nice, but it’sunlikely. There is both good and badnews for life reinsurers:
1. Cession rates will level off. The 64 percent penetration rate of 2000 will likely hit a plateau at some point and will probably not top 75 percent.
2. An information advantage, an in-depth knowledge of under-writing and distribution effects on mortality will maintain the reinsurers’ competitive edge .
3. New entrants into the life insur-ance business will be risk-averse, preferring to outsource their mortality risk-taking and underwriting.
4. As capital markets become more efficient and technology contin-ues to make reinsurance arrangements transparent to the consumer, the cost of risk will eventually be driven down-ward to the level of commodity pricing.
Commitment and capitalWhat will it take for a reinsurer tosurvive—and even thrive—in thisnew century? Two words that cometo mind are commitment and capital.
Commitment will increasinglymatter to primary carriers. Theywon’t be satisfied with a reinsur-ance relationship that’s merely the“flavor of the month.” Instead,they’ll want to know they can counton a long-term business relation-ship with a highly rated reinsurerwho has a demonstrated commit-ment to the life reinsurancebusiness. This spells bad news forunaffiliated reinsurers and thosewith marginal operations.
Capital will also be a key issuebecause the supply of life reinsur-ance capital is bound to contract,perhaps as early as the third quar-ter of this year. The signs arealready there; just look at the costand capacity of current lines ofcredit that are used to manage the
continued on page 6
“September 11 has
had the greatest
effect on the price
and availability of
catastrophic cover-
age for both group
and individual life
insurance.”

6 JUNE 2002
strain of XXX surplus require-ments. The result is that to surviveand thrive, reinsurers must be ableto offer impressive capacity.
In the U.S. reinsurance market-place of tomorrow, primary carrierswill want three things:
• Longer-term reinsurance relationships.
• A few trusted places to concen-trate their business, thus main-taining that relationship.
• A reinsurer who can supply their capital needs, product development and underwriting capacity for the long haul.
In response, successful reinsurersmust:
• Deliver a broad range of productofferings.
• Include non-traditional reinsur-ance options.
• Improve their credit ratings,because lower-rated companies just won’t cut it in the future.
Critical regulatory issues aheadTwo critical regulatory issues arelooming on the horizon of the rein-surance world of tomorrow: theestablishment ofinternationalaccountingstandards andthe develop-ment of federalregulation ofthe reinsuranceindustry. Whileboth proposalsare likely a longway off, eachwould havesignificant long-
term effects on the industry. Thewise will keep these developingprojects in view.
Our U.S. statutory accountingsystem is under some pressure.First, non-admitted reinsurers areasking that U.S. collateral require-ments be relaxed. In addition, atleast one international organizationis pushing for reinsurer white lists.
Still, others are advocating interna-tional accounting standards. In theend, these standards may lookmuch like current U.S. or CanadianGenerally Accepted AccountingPrinciples.
No matter how the internationalaccounting standards evolve,
anything thatproduces a signifi-cant accountingchange will surely
have anequallysignificanteffect on thedemand forreinsurance.
The impo-sition offederal rulesis the othermoving regu-latory target.At the
moment, regulation of insurance isthe domain of the states, creating a50-state maze of inconsistent rulesand regulations that give insurerscompliance headaches. But unlesssome compelling arguments aremade for a single federal standard,the maze is likely to remain.
The most persuasive argumentfor a single federal standard wouldbe to show how it would benefitconsumers. But that’s been difficultto argue because of the currentperception that consumers canalready get the products and pricesthey want, when and where theywant them. Unless we can make astrong case for consumer benefit,federal regulators will be less moti-vated to seize control of theinsurance industry.
But all is not lost for those whosupport federal regulation.Consumer arguments can be devel-oped. The NAIC’s inability toregulate consistently makes federalregulation more appealing toCongress. Gramm-Leach-Bliley isan example of what can be accom-plished when the banks andinsurers approach Congresstogether. In addition, the September11, 2001, terrorist attack againstthe United States left Congressdismayed and frustrated when itrealized it had no insurance expert-ise to call upon.
Hounded by the headlinesThe September 11 terrorist attackand the collapse of Enron have hadan impact on almost everyAmerican industry. The reinsuranceindustry is no exception.
A government backstop for cata-strophic claims, such as thosestemming from the September 11attack appears dead for now,although some recent commentsfrom Alan Greenspan and a reportfrom the General AccountingOffice could breathe some life backinto the proposal. So far, the indus-try failed to prove its case to the
REINSURANCE NEWS
The Future that Lies Ahead
from page 5
“At the moment,
regulation of
insurance is the
domain of the
states, creating a
50-state maze of
inconsistent rules
and regulations
that give insurers
compliance
headaches.”

JUNE 2002 7
REINSURANCE NEWS
federal government that reinsur-ance is unavailable for lifeproducts.
No one knows if Congress willact. But whether it does or doesn’t,there are things the industry canand must do to better manage itsrisk. We need to learn from thisexperience, change how we dobusiness and better manage riskconcentrations. For this, we canlook to the property-and-casualtyindustry and study the tools andbehaviors they use to handle cata-strophic claims, such as those fromHurricane Andrew in 1992. Theindustry developed methods tobetter identify risks and, when therisks were too concentrated, theindustry worked to move thoserisks off their books.
The unprecedented collapse ofEnron is another headline-grabberwith reinsurance implications.Enron’s covert deals and
labyrinthine bookkeeping have leftinvestors and the public with awariness of big business and adistrust of complicated accounting.
For the reinsurance world, thismeans clients will be looking forsimpler, more understandablebusiness transactions—somethingthey can count on withoutunpleasant surprises somewheredown the road. They’ll want rein-surance contracts that provideguaranteed payments for definedlosses. Surplus relief, securitiza-tions and other complextransactions are bound to fallunder the magnifying glass ofinvestigators looking for account-ing sleight-of-hand.
Preparing for tomorrowClearly, there are opportunities andperils awaiting us in the future oflife reinsurance. Tomorrow will beours to win or to lose, and the prize
will surely go to those companieswho have prepared themselves toavoid the perils and seize the oppor-tunities.
Theodore Roosevelt once advised,“Whenever you are asked if you cando a job, tell ’em, ‘Certainly, I can!’Then get busy and find out how todo it.”
Can reinsurers meet the chal-lenges that lie ahead? Certainly, wecan. We’re already busy finding outhow to do it today.
When tomorrow arrives, we’ll beready.
Chris C. Stroup is chief executiveofficer of Swiss Re Life and Health,North America, and a member of theLife Executive Board of Swiss ReLife and Health. He is responsiblefor the life and health reinsurancebusiness and activities for Swiss rein the U.S. and Canada.
Annual MeetingReinsurance Section Council Meets
Reinsurance Section Council
members taking some time out of
their meeting in New Orleans to
pose for the SOA camera—
Back Row—Bob Beal (2000-2001
chairperson), Jim Keller, Bob Reale,
Mel Young, Ronnie Klein, Jeff Katz
(2001-2002 chairperson)
Front Row—Jack Bailey, Leigh
Harrington, Jay Biehl, Jim Dallas,
Dean Abbott (newsletter editor)

8 JUNE 2002
slowing consolidation of the leadinglife reinsurers and growth in theuse of strategic alliances by lifereinsurers.
Since our customers’ needs shapethe environment in which we’lloperate, my predictions are basedon the trends, issues and macroeco-nomic factors facing the lifeinsurance industry. Although stillstrong and dynamic, life insurershave evolved over the last 20 years,increasingly emphasizing invest-ment-oriented products overtraditional protection-based ones.Life insurers’ assets under manage-ment have grown rapidly throughannuity sales and the acquisition ofmutual fund businesses, while lifeinsurance sales were relatively flatover that period. The industry alsomoved into variable productsduring the economic boom of the1990’s. These trends have increasedthe importance of fee-based incometo life insurers. Additionally, theincreasing proportion of life insur-ance reinsured may be a sign of lifeinsurers striving for a morepredictable bottom line and a grow-ing aversion to earnings volatility.
The above industry trends arereflected in the top two concerns oflife company management. Surveyshave shown their two top concernsare achieving profitable growth andimproving distribution efficiencyand productivity.Management’sgoal is to improvetheir company’sprofitability, andthis is a tall orderin a competitivemarket. Many lifeinsurance compa-nies areovercapitalized.While this situa-tion is good for their financialstrength ratings, it’s poor for share-holder returns. Growth—organic or
through acquisition—can createscale and critical mass to improveshareholder returns. The strongtrends of consolida-tion anddemutualization aretwo indications ofthe underlying pres-sures life insurersare facing toimprove profitabilityand to grow andreach economies ofscale.
I also expecteconomic and demo-graphic forces tocontinue to putpressure on lifeinsurance companygrowth and prof-itability.Competitive pres-sures, overcapacityand consolidationtrends are therefore likely to resultfrom these forces as well. I expectexcess global industrial capacity tolimit inflation, which should lead torelatively low interest rates overthe next few years, as well as alackluster equity market. Such aneconomic scenario will likely resultin sluggish demand for fixed andvariable investment products.Changes in tax policy may alsoreduce sales by life insurancecompanies, not only throughchanges in the estate tax, but alsoindirectly by increasing the
amountsthat can becontributedto 401(k)plans. As thenew $20,000annual401(k) planannualcontributionphases in,there will
likely be a significantly reducedlong-term demand for annuities. Inaddition, the Baby Boomers were
behind much of the growth in assetsunder management seen over therecent past. As this demographic
group eventu-ally begins toshift fromsavings topayout as theyretire, thismajor source ofgrowth willdisappear. It isalso question-able ifGeneration Xcan providethe demand forinsuranceproducts tomake up forthe drop indemandcaused byBaby Boomersmoving into
retirement. First, the Baby Boomergeneration is much larger thanGeneration X. Furthermore,Generation X’ers are believed byexperts to be survivors, independentand “do-it-yourselfers.” Therefore,people may be less likely to beinterested in “bundled” insurancecompany investment products andmore willing to invest directly inmutual funds or equities.
In summary, the life insuranceindustry is transforming into abroader financial services businesswith a focus on savings products.The playing field is not onlycrowded with insurers, but with thelikes of Merrill Lynch, CharlesSchwab and Fidelity. Insurers mayhave a long-term advantage (ordisadvantage?) with their strong(but expensive) distribution chan-nels, but the competition from theseother players will continue to putpressure on profitability.
Demutualization and consolida-tion will continue as companiesattempt to improve profitability,resulting in fewer and largercompanies. Demographics have
REINSURANCE NEWS
Ten Predictions for the...
from page 1

JUNE 2002 9
REINSURANCE NEWS
recently helped life insurancecompanies grow their assets undermanagement, but these trends areshifting. As a result, life companieswill take increasingly strongeractions to improve shareholderreturns. My predictions are:
Prediction #1: Growth in recur-ring net amount at riskreinsured will slow to that ofthe growth of insurance saleswithin three years. As the propor-tion of face amount reinsuredcontinues to climb, it eventuallymust reach a limit. The rapidincrease seen in the 1990s impliesthat reaching this limit will comemore quickly than slowly. I expectthat ultimately, no more thanroughly 75% of the life insuranceindustry’s net amount at risk willbe reinsured. Many life insurancecompanies will continue to retainthe bulk of their mortality risk andonly reinsure risk in excess of theirretention. The life insurers thatdecide to outsource their mortalityrisk will be required by reinsurersto retain significant risk in order toavoid moral hazard. What are someimplications for life reinsurers?More competition, much slowergrowth and a growing emphasis onexpenses and efficiency.
Prediction #2: Competition forlife reinsurance new businesswill remain strong, or evenintensify, and industry prof-itability will disappointshareholders. We are in a verycompetitive market today, andoffshore start-ups continue to putpressure on the market. With apredicted decline in the growth rateof new reinsured volume, competi-tive pressures will likely increase.Some observers have suggestedsingle-digit rates of return shouldbe expected on some recent acquisi-tions by life reinsurers. This is asign of an environment in which Iexpect shareholders won’t be veryhappy with returns. The result will
be a continued healthy tensionbetween management and owners.
Prediction #3: Profitable rein-surers will be those offering acompelling value proposition toclients. In a consolidatingmarket, life insurers willoutgrow the need for commod-ity reinsurance. Most largeinsurers don’t need to outsourcetheir mortality, but they will whenenticed to do so. A good price is oneway to win business, but that does-n’t necessarily solve the cedingcompany’s problems. I expect riskmanagement will take on a lesserrole (although post September 11 itwill remain important) with capital
and earnings arbitrage coming toplay the major role as thataddresses the primary profitabilityconcerns of life insurers.
Prediction #4: Financialstrength and ratings willincreasingly separate thestrongest reinsurers from therest of the pack. Consolidation inthe life insurance industry is creat-ing ever-larger life insurancecompanies. These companies willdemand bigger and stronger coun-terparties. Along with financialstrength and rating, they will alsolook for a strong commitment to themarket. Size and financial strength
are two signs of this commitmentthat leading reinsurers will use togrow market share.
Prediction #5: Consolidationwithin the life reinsuranceindustry will continue, but at aslower pace. If my prior predictionabout market growth and size andstrength is true, then many of thesmaller reinsurers may be acquired,and that trend may even accelerate,presenting some smaller companiesthe chance to consolidate to becomeone of the top ten. Thus, I’m limit-ing this prediction to the top five toten players only. I believe that clientdiversification needs will ensureopportunities for many in the indus-try and that consolidators willeventually reach a point whereadditional acquisitions will not addincremental market share above alevel around 20%. As there are anumber of reinsurers closing in onthat limit, the top five to ten playersare a more stable group than washistorically the case. This predictionmay prove wrong if the industryfalls out of favor and if acquisitionprices fall to the point that theydon’t need substantial new businessto justify the price paid. Then wemay see many acquisitions beingcompleted as blocks of in-force busi-ness, rather than as going concerns.
Prediction #6: Securitization ofmortality or longevity risk willnot occur to a significantdegree. Reinsurers need not worryabout competition from the capitalmarkets. Why? First, life insurancecompanies don’t need a publicmarket when they already have acompetitive, efficient privatemarket for transferring risk tohighly rated life reinsurers. Second,any true transfer of risk wouldrequire a very complex structureand quite a fair amount of uncer-tainty over a long period of time.Such transactions are expensive to
continued on page 10
“The life insurers
that decide to
outsource their
mortality risk will
be required by
reinsurers to
retain significant
risk in order to
avoid moral
hazard.”

10 JUNE 2002
complete, and have very limitedmarket potential given the educa-tional hurdles with potential buyersare substantial.
I also do not believe there aremany natural buyers of long-termlongevity risk (other than life rein-surers). Pension funds to thetypical long-term investor, arealready exposed to longevity risk intheir pension plans. That makesthem a natural buyer of mortalityrisk (if old age mortality ratesimprove, they win on the securiti-zation, which can help make uplosses in their pension plans).Given a pension plans’ability to invest in equi-ties, perhaps they couldbest hedge their longevityrisk by buying stock inlife reinsurers, ratherthan entering intocomplex structures theydon’t have the expertiseto underwrite.
Prediction #7: Lifereinsurers will increas-ingly and materially participatein strategic alliances and gener-ate substantial opportunitieswith alternative distributionchannels. When your currentcustomers aren’t growing your busi-ness, you find new customers. Lifereinsurers have the expertise todevelop, underwrite and manageprotection products. They just needthe distribution. Both liberalizingfinancial services legislation andthe “new economy” present opportu-nities for non-insurers to enter thelife insurance marketplace. Lifereinsurers, with their strong expert-ise and ability to assume risk, maybe their ideal partners. What arethe implications? Such strategicalliances will be a source of stabilityand growth for life reinsurers ifinsurers lose business to other
financial service providers such asbanks, mutual funds and dot-comdistributors.
Prediction #8: The reinsurerthat enables life insurancecompanies to successfullymarket payout annuities thatprovide balanced fund returnswith guarantees against outliv-ing savings will have acompetitive edge for a month—unless they’re reckless orcrazy, in which case thecompetitive edge will last twomonths. One of the biggest oppor-tunities I see for insurers is tocapture IRA and 401(k) rolloversas the Baby Boomer generationreaches retirement age. However,
the life insurance industry doesn’tyet have a product that bothprotects the individual againstoutliving their assets and providesan attractive “balanced fund” levelof long-term return. As life rein-surers were instrumental inhelping annuity writers provideaggressive Guaranteed MinimumDeath Benefits (GMDB), they alsocould play a role developinglongevity guarantees on balancedfunds.
I’m being just a little sarcasticby saying that whoever solves thisdilemma has a month’s head start.But news travels fast in this busi-ness. With reinsurers going into,then out of, the GMDB reinsurancebusiness, I also wonder if there arecompanies out there that wouldfollow a competitor into such a
business line before having thetime to do a full risk evaluation.
Prediction #9: The real competi-tion between life reinsurers willbe recognized as one for toptalent. Life reinsurance is a busi-ness that requires strong expertiseto succeed. One of my biggest chal-lenges has been finding strong andexperienced talent. There isn’tenough is out there, especially giventhe growth the life reinsuranceindustry has seen over the last tenyears. While you can develop thestaff you need, you must also strivediligently to retain them.
Prediction #10: The fond memo-ries of Bermuda will be real, butgetting rich from an IPO oracquisition are only dreams. TheIPO mania that was rampant in thehigh tech area in the 1990’s mayhave even spilled over to reinsur-ance. If any of the offshore start-upshave a business plan of selling outafter a few years of building up abook of business, I think they willfind only modest success. Many ofthese reinsurers will build success-ful businesses, but I don’t see acompelling reason for them todemand high valuations in such acrowded and competitive market. Atleast Bermuda is a great place tolive for a few years!
Jess A. Skriletz FSA, CFA is generalmanager and chief executive officerof ING Re and ING InstitutionalMarkets. He began his 20-yearcareer with ING at Security Life ofDenver Insurance Company and hasserved in various actuarial, invest-ment and management capacities,including several years in theNetherlands as an actuary of theInternational Division of Nationale-Nederlanden. He can be reached atjess.skriletz@ ing-re.com
REINSURANCE NEWS
Ten Predictions for the...
from page 9

JUNE 2002 11
REINSURANCE NEWS
To start, I’d like to take you backto a time when the U.S. life reinsur-ance industry was quite differentfrom what we see today. It was along, long time ago—the year—1995. Way back then, there were 18
U.S. reinsurers with market sharesof two percent or more. Over thelast six years, would you believethat half of those 18 reinsurershave been acquired? Six reinsurerswere merged into other reinsurersand no longer exist. The other threeacquired reinsurers were left in tactby their new parents.
In Table 1, Swiss Re and thecompanies it has acquired areshown in bold type. A question foryou is: How do you become thelargest reinsurer? Simply combinethe second, fourth, sixth, andseventh largest reinsurers, andvoila! Altogether, Swiss Reacquired four reinsurers over the
Winners and Losers...
from page 1
Table 1: U.S. Reinsurers in 19951
Rank2 Company Market Share2 Acquired By1 Transamerica Re 16% Aegon2 Lincoln Re 13 Swiss Re3 RGA 12 MetLife4 Life Re 8 Swiss Re5 ING Re 66 Swiss Re 67 Mercantile & General 4 Swiss Re8 AUL 49 Cologne Re 4 General Re 10 CNA 4 Munich Re11 BMA 312 Employers Re 313 Phoenix Home 3 Employers Re14 Allianz 315 Hartford Intl Life Re 216 Gerling Global 217 CIGNA Re 2 Swiss Re18 Munich Re 2
1 With a 2% or greater market share2 Based on 1995 SOA survey of U.S. ordinary life reinsurance in force, excluding portfolio reinsurance
and retrocessions
last six years with a combined1995 market share of 27 percent.(See table above)
As a result of this consolidation,there are only 12 reinsurers left todaythat have market shares of 2 percentor more. On average, we’ve lost onereinsurer per year over the last sixyears. At this pace, my actuarial fore-casting skills tell me there will be noreinsurers left in 12 years!
Now let’s look at the currentstate of the market as shown in
Table 2. Of the top six reinsur-ers today, Swiss Re, EmployersRe, and Munich Re are the clearmarket share winners. Theyhave vastly increased theircombined market share from 11percent in 1995 to 48 percent in2001!
In the meantime, TransamericaRe, RGA, and ING Re managed tohold onto a collective 30 percentmarket share, which is down from34 percent in 1995.
Six years ago, the top four U.S.reinsurers were U.S.-owned. Today,only four of the top 12 reinsurers areU.S.- owned. Perhaps you’ve noticedEuropean companies purchasingU.S. life insurers over the last fewyears. That trend is even strongeramong reinsurers. European-ownedreinsurers now account for over two-thirds of all U.S. life reinsuranceinforce, excluding portfolio reinsur-ance and retrocessions.
continued on page 12

12 JUNE 2002
REINSURANCE NEWS
The U.S. life reinsurance markettripled in size from 1995 to 2000.During that time, a number of rein-surers maintained about the samemarket share, namely RGA, AUL,Cologne Re, BMA, and GerlingGlobal.
Employers Re and Munich Retripled their market shares. Whencombined with the three-foldincrease in the size of the market,Employers Re and Munich Re are10 times larger than they were in1995. Swiss Re is 15 times larger,with five times the market share ithad in 1995.
Two reinsurers, ING Re andAllianz, added a couple of points ofmarket share. Only TransamericaRe lost significant market share,but still managed to double its busi-ness in only five years.
As George Santayana said,“Those who cannot remember thepast are condemned to repeat it.”Now that we’ve examined ourrecent past, I’d like to speculate onthe future. I will espouse a large
number of questionable opinions.While I am bound to be wrong, I dohope you will find this interesting,provocative and not too offensive. Tolessen the risk, I’ll talk aboutcompanies in small groups.
The Major Acquirers:Swiss Re, Munich Re,and Employers ReThe clear market share winnersover the last five years—Swiss Re,Munich Re, and Employers Re—have three things in common:
• P&C reinsurance as a core business, which has generally produced poor financial results in recent years,
• Deep pockets and
• Major acquisitions in the U.S.life reinsurance market.
For a few years, these threecompanies stood on the sidelines andwatched the U.S. life reinsurance
business growing very fast and pass-ing them by with public companieslike RGA and Life Re reportingattractive earnings. Not surprisingly,Swiss Re, Munich Re and EmployersRe each decided to expand its U.S.life reinsurance presence throughacquisitions. At the same time, eachmoved its pricing from conservativeto more aggressive.
Acquisitions over the last sixyears have not been cheap—acquirers generally paid top dollar.Having some information aboutmost of these acquisitions, I cantell you roughly what it took tohave the winning bid:
• A willingness to settle for a return on capital in the neigh-borhood of 9-10 percent,
• An assumption that the great majority of expenses could be eliminated through consolidation and
Table 2: U.S. Reinsurers in 20011
Rank2 Company Market Share2 Ownership1 Swiss Re 30% Swiss2 Transamerica Re 11 Dutch3 RGA 11 U.S4 Employers Re 10 U.S.5 Munich Re 8 German6 ING Re 8 Dutch7 AUL 5 U.S.8 Allianz 5 German9 BMA 3 Italian10 Cologne Re 3 U.S.11 Gerling Global 3 German12 Annuity & Life Re 2 Bermudan
1 With a 2% or greater market share2 Based on 2001 SOA survey of U.S. ordinary life reinsurance in force, excluding portfolio reinsurance and
retrocessions, with adjustment to Swiss Re to include Lincoln Re recurring business3 Employers Re stands to gain an additional 4% market share pending its acquisition of American United Life’s
life reinsurance business in 2002
Winners and Losers...
from page 11

JUNE 2002 13
REINSURANCE NEWS
• An assumption that the market share of the acquired company could be added to the market share of the acquiring company,even where that meant main-taining double shares of the new business of many ceding companies.
In general, the acquirers havedone a good job of eliminatingexpenses through consolidation ofoperations. They have also done agood job of holding onto, and insome cases adding to, marketshare—largely through an increasein pricing aggressiveness that wentwell beyond the minor improvementyou’d expect from consolidation-related economies of scale.
What does the future hold forthese companies? First let’sconsider Employers Re, which isowned by General Electric. Due toits large property and casualtyreinsurance business, financialresults have been disappointing,especially by GE standards. GE isnot shy about exiting a marketthat is no longer appealing. TheirWorld Trade Center losses andconcerns about future terroristattacks could result in a decision tosell Employers Re. But who besidesMunich Re might be large enoughand interested enough to buyEmployers Re? With too littledemand, GE may elect to keepEmployers Re and even expand it.
I expect Swiss Re and Munich Reto buy a little more market share,both through acquisition andaggressive pricing. I expect thatthey will earn no better than 9percent of returns on additionalcapital invested. However, suchreturns may be quite attractivewhen compared to recent returns onproperty and casualty reinsurance.
The futures for Swiss Re andMunich Re hinge on a single ques-tion: What will their stockholdersdemand? The answers to this ques-tion hinge in turn on financialreporting issues:
• Will future financial reporting standards allow non-U.S. rein-surers to create earnings on demand by harvesting unreal-ized capital gains?
• Will non-U.S. reinsurers be able to save excess earnings for a rainy day by storing them in contingency or catastrophe reserves?
If the answers to these questionsare “no,” stockholders of non-U.S.reinsurers may be faced with muchmore volatile earnings goingforward.
Munich Re boasts “hiddensurplus” of tens of billions of dollars.If this hidden surplus becomes partof publicly reported capital andsurplus, will it create a demandamong stockholders for distributionof excess capital? Or, if capital isaugmented by hidden surplus, willfinancial results show an unaccept-ably low return on equity?
My best guess is that change isin the air. Many of these financialreporting changes will happen, butnot quickly. However, before the endof this decade, I think you will seeseveral changes including:
• The reporting of more volatileearnings,
• The reporting of more realistic capital and surplus,
• Extraordinary dividends paid to stockholders to distribute excess capital and achieve a better balance between capital and risk and
• A renewed emphasis on the pricing discipline that helped Swiss Re and Munich Re become world-class leaders in the reinsurance business.
My prediction is that over thenext few years, Swiss Re will strug-gle to maintain its market share
while Munich Re acquires addi-tional market share. After that, Iexpect both companies to lose someground as they switch their focusfrom market share to producingsatisfactory returns on equity fortheir stockholders.
The Friendly Giants: Transamerica Re, RGA, and ING ReThe other three of the top six U.S.reinsurers have grown their busi-nesses organically, rather thanthrough acquisitions. While largein the U.S. life reinsurance busi-ness, each of these reinsurers isonly a small part of a much largerparent. Transamerica Re is whollyowned by Aegon, RGA is almost 60percent owned by MetLife, and INGRe is part of ING. For each of theseparent companies, reinsurance isnot a core business.
I think a strong parental influ-ence has contributed to a generallygreater pricing discipline shown bythis group in recent years. With luckand cleverness, Transamerica RE,RGA and ING Re may be able tohold onto market share because oftheir economies of scale, establishedreputations and relationships andthe special products and servicesthey bring to bear.
On the other hand, for the rightprice, each of these reinsurers couldbe purchased, just as Lincoln Rewas recently purchased by SwissRe. However, to the extent thatthese companies produce goodfinancial results and generally keeptheir owners happy, the right pricemay be too high for a prospectivebuyer.
Collectively, I expect TransamericaRe, RGA, and ING Re to gain or losea little market share over the nextfew years. Aggressive pricing byacquirers and new entrants wouldtend to decrease their marketshares. Countering this, the desireamong ceding companies to spread
continued on page 14

14 JUNE 2002
REINSURANCE NEWS
their risk among major reinsurerscould help increase their marketshares. For example, even withaggressive pricing, it may be impos-sible for Swiss Re to hold onto a 30percent market share when mostcompanies prefer to split their rein-surance between four or morereinsurers.
Each of these companies hasexperienced some large write-offs orsignificant turnover over the lastfew years, which cannot be pleasingto their parents. As a result, I wouldnot be surprised if TransamericaRe, RGA and/or ING Re andTransamerica Re were acquiredover the next few years.
The Lonely Lighthouse—American United LifeNine of the top 10 reinsurers haveparents with market capitalizationof at least $20 billion. The loneexception is AUL, whose reinsur-ance business haslighted its way andbecome its most impor-tant line of business.
As a mutual holdingcompany, AUL haslimited access to capitalneeded to continue itsgrowth. Recent lossesfrom the World TradeCenter terrorist attacksmay have been the finalimpetus to AUL’s deci-sion to sell its life reinsurancebusiness. With an efficient, good-sized life reinsurance organization,AUL had a choice of buyers. In Mayof this year, AUL announced thesale of its life reinsurance businessto Employers Re.
The Europeans areComing!The Europeans are coming! No,wait—they’re already here! We’vealready reviewed Swiss Re, Munich
Re, Aegon, and ING. That’s just thetip of the iceberg.
Allianz and BMA aresmaller reinsurers with verylarge parents—so large, in fact,that reinsurance results maybe rounding error to their ulti-mate parents. Allianz andGenerali seem to be lettingtheir U.S. operations run theirown show as long as results aresatisfactory.
While Allianz and BMA are moreaggressive pricers than they werefive years ago, they still seem to putmore emphasis on financial resultsover market share. Unless resultstake a turn for the worse, U.S.management should have no incen-tive to sell their reinsuranceoperations. I expect Allianz andBMA to maintain or grow theirmarket share. Like other survivors,they should benefit from furtherconsolidation as ceding companiescontinue to spread their reinsur-ance among multiple reinsurers.
Cologne Re, now called Generaland Cologne Re, was acquired by
General Re in the mid-1990s. Four years ago,General Re was acquiredby Berkshire Hathaway,Warren Buffett’s company.(Warren is famous forbeing a distant relative ofJimmy Buffett, but Idigress.) In spite of itsU.S. ownership, Generaland Cologne Re’s life rein-surance business isprimarily European.
In March of 1999, when massiveworkers compensation losses weredisclosed, General Re infusedhundreds of millions of dollars toCologne Re to stabilize the situa-tion and restore customerconfidence. Since then, their U.S.life reinsurance unit has experi-enced some significant turnover,has become understandably moreconservative, and its growth haslagged behind most of the industry.
Based on Cologne Re’s success in
some life reinsurance marketsoutside the U.S., I predict that their
U.S. life reinsurance operationwill be allowed to continue onits conservative course. OnceU.S. market conditionsimprove and confidence in thelife reinsurance business isrebuilt, Warren and Jimmymay surprise us. General and
Cologne Re could find itself a smallU.S. player with a very large parentwilling to bankroll a tremendousamount of growth.
Gerling Global and two smallerU.S. players–Hannover Re andSCOR Re–are mid-sized, European-based companies specializing inproperty and casualty reinsurancewith life operations in a number ofcountries around the world.
In the U.S. and some other lifereinsurance markets, I see thesecompanies faced with a choice:Either grow the local operation tocapture a significant market shareor exit the market. I think one ortwo of these companies will decideto concentrate its resources on itscore P&C business, while refocusinglife reinsurance efforts primarily onits more profitable domesticmarket. As a result, expect one ortwo of Gerling Global, Hannover Re,and SCOR Re to sell its U.S. lifereinsurance operations, but not anytime soon. I think the remainingone or two mid-size European rein-surers will commit to developing amore significant presence in theU.S. life reinsurance market, prima-rily through an acquisition over thenext few years.
The Bermuda HighI’ll finish with the two significantnew entrants to the U.S. mortalityrisk market—Annuity and Life Re,and Scottish Re—Both Bermuda-based, publicly held companies.These two companies have beenquite active in the U.S. life reinsur-ance market over the last couple ofyears. Their IPOs in 1998 raised atotal of almost $600 million, along
Winners and Losers...
from page 13

JUNE 2002 15
REINSURANCE NEWS
with considerable pressure fromWall Street to quickly deploy thatcapital.
These two IPOs were successfulbecause of the rapid growth takingplace in the U.S. life reinsurancemarket coupled with competitiveadvantages already demonstrated byoffshore P&C reinsurers, namely theuse of more favorable GAAP account-ing, a zero percent corporate tax rate,and the low overhead typically asso-ciated with a start-up operation.
As with all new entrants,Annuity and Life Re and ScottishRe have found the U.S. life reinsur-ance market a hard nut to crack. Ittakes years to build the relation-ships and reputation needed tocompete on an equal footing withmore established players. In themeantime, both reinsurers havecompensated by using a low-pricestrategy to penetrate the market.
Because some clients won’t sendbusiness offshore and because U.S.tax regulations make it difficult for anon-U.S. taxpayer to market to U.S.customers, both Bermudan reinsur-ers have established U.S. lifereinsurance subsidiaries. Their salesresults to date have been trulyamazing. Combined, the two compa-nies boast GAAP assets of $4 billionand GAAP revenue of $500 million—and this is after less than four yearsof serving the U.S. market.
Regarding profits, annuityresults to date have been disap-pointing, mainly due to losses fromone large annuity block. So far, liferesults have been encouraging, butlife reinsurance results can bedistorted by lags in reporting.When you’re growing fast and lagsare increasing, profits tend to getoverstated. I learned that the hardway. When my company’s adminis-tration finally caught up with thegrowth of the business, backdatedpremium refunds knocked earningsfor a loop. Thankfully, that wasbefore we were a public company!
Given the thin margins on thebusiness most reinsurers have
written over the last few years, prof-its are more sensitive than ever tothe effect of lags. A company with alow-price strategy would have profitseven more sensitive to lags.
My best guess is that, over thenext few years, the Bermudan rein-surers will show a return on capitalthat disappoints investors. Bothcompanies have seen their stockprices fall to within a few percent ofage points their book values. If thestock price were to fall much belowbook value, there would be pressureto sell or liquidate the company. Ifone company performs much betterthan the other, look for the betterperformer to acquire the other andmerge the two operations.
A Look Ahead to 2006In summary, over the next fouryears, I think the U.S. market willconsolidate down to eight significantreinsurers with market shares ofthree percent or more. I think theeight winners will face a more stablefuture, with little or no additionalconsolidation, few new entrants, andpricing that more regularly producessatisfactory returns to shareholders,at least on new business.
As a postscript, I’d like to pointout that there are strong forces atwork that may be bringing morepricing discipline to the market asyou read this:
• The demand and perceived value of reinsurance is up and,due to capital losses and World Trade Center losses, the supply is down. That should cause reinsurance prices to firm up.
• Losses from the terrorist attacks and other recent earn-ings surprises are causing many reinsurers to reexamine their approaches to pricing, risk management and the connec-tion between the two.
• The Enron scandal has many reinsurers reexamining the
risks associated with movingbusiness offshore, including unknown future letter-of-credit availability and costs, the finan-cial handcuffs associated with long term placement of assets in trust and the risks associated with guaranteeing offshore companies.
• Some reinsurers have accumu-lated and analyzed a mountain of relevant mortality and lapse information by tracking the results of many millions of indi-vidual policies. This enables them to make better pricing decisions. Reinsurers without such information could become the victims of those that have it.
If these forces produce a stabiliz-ing or upward influence on prices,profit margins and returns will rise,but probably at the expense ofslower growth, since reinsurancesales are made to very astute andextremely price-sensitive buyers. Inthe past, many reinsurers have beenable to walk the fine line thatcombines rapid growth withadequate profitability. As the U.S.life reinsurance market consolidates,this will become both more difficultdue to the stronger competitors andeasier due to fewer competitors.
Four years from now, you mayrecall this article and marvel athow incredibly wrong these predic-tions were. It might be interestingto follow up in 2006.
David Atkinson, FSA, MAAA, isexecutive vice president and COO ofReinsurance Group of America Inc.in Chesterfield, MO, and co-author,with Jim Dallas, of the SOA’s newbook for product development andfinancial management, LifeInsurance Products and Finance.He can be reached at [email protected].

16 JUNE 2002
REINSURANCE NEWS
Editor’s Note: As mentioned previously inthis newsletter, this article was originallypart of the Special Edition Newsletterthat never was. The Reinsurance Sectionasked Jim to prepare this article on theSPRA for the newsletter. While SPRA isassociated with Swiss Re, this is not anadvertisement for business, but is forinformational purposes only. Thank you,Jim, for the article.
September 11, 2001, wasunprecedented in its tragicramifications on both a
personal and business level.Insurers, whose business is tomanage risk, are now looking at newissues and questions about how tomanage a world whose risks includesuch horrific acts. The property andcasualty industry has a proposed billin Congress for establishing a terror-ism reinsurance pool. The ACLI hasbeen discussing a potential high-level government backstop for thelife insurance industry.
Insurance companies use variousmechanisms to control volatility ofrisks, and ultimately, solvency.Companies set a maximum amount,i.e., a retention, which they willretain on any one life. Some may alsouse first-dollar quota share to furtherreduce volatility. Even with theseelements, many insurance companiestake steps to reduce the effects of acatastrophe, which, in insuranceterms, is defined as an event causingthe insured to have three or moreclaims that add up to more thansome predetermined deductible.
One way to reduce a catastro-phe’s effects is to buy traditionalcatastrophe coverage. Another is toparticipate in a catastrophe pool.Both are typically one-year cover-ages. With a traditional coverage,the premiums (the insured costs)are known upfront. The pool, on theother hand, should result in longer-term lower net costs and can coverrisks that are too unpredictable tobe priced for in a traditional cover.
SPRA’s assessmentpoolsSpecial Pooled RiskAdministrators, Inc. (SPRA)
administers both an ordinary and agroup assessment catastrophe pool.Each member has a share of thepool (either ordinary or group)based on the company’s in forceand number of policies relative toall others in the pool. When acatastrophe does occur and amember has three or more claimsabove its deductible, all membersare assessed. To make an assess-ment pool work well, you need asignificant number of companies.This allows a substantial maxi-mum claim cover while stilllimiting the potential assessmentto any single member.
SPRA pools are fortunate toenjoy a wide number of companieswith substantial in force.Currently, the ordinary pool repre-sents 111 life companies with morethan $3 trillion of in force (roughlya third of the industry). Throughunique formulas to determine thedeductibles and pool shares, largeand small companies are treatedequitably. As such, a wide varietyof company sizes are represented.The pool maximums are $50million per company and $125million in aggregate. The grouppool has 42 life companies with $1trillion of in force (roughly a sixthof the industry). The maximumsare $0.20/1000 ($200 million) and$0.50/1000 ($500 million).
Questions afterSeptember 11The tragedy of September 11, 2001,was unprecedented for the SPRApools. Although the pools havebeen around for more than 25years and have administered morethan $50 million of catastrophicclaims, nothing has ever come closeto the impact of September 11.Estimates from the ordinarymembers total $250 million, andestimates from the group memberstotal $160 million.
Not surprisingly, experience isanything but uniform by company.Several companies, both large andsmall, had very few claims. Severalother companies (again both largeand small) had a disproportionate
amount of claims. The pool will dowhat it was designed to do—spreadthe effects of the catastropheevenly over its member base.
The terrorist attack does causesome challenges in administeringthe pools. For example:
• How many insurable events were there? Most within theindustry have argued the WorldTrade Center’s Twin Tower attack of Sept. 11 was a single event, citing the “cause” analy-sis with various case law exam-ples. But others (such as the owner of the World Trade Center’s Twin Towers) have suggested each tower attack should be treated as a separate insurable incident. SPRA has informed its members that it accepts the “cause” analysis and intends to administer the attacks as one event.
• Should the ordinary limit be raised? Given that one event occurred, an aggregate limit of $125 million and estimates of $250 million, only 50 percent of the claims are being spread.
• Where do we go from here?Many are saying the world has now changed. Several compa-nies are finding at renewal that traditional catastrophe covers are more limited in scope (excluding terrorism and/or war) and premiums have been increased. SPRA is soliciting input from its members on any potential changes going forward.
James B. Keller, FSA, MAAA, is avice president of Swiss Re in FortWayne, IN. His current responsibili-ties are business engineer forfinancial reinsurance and AdminRe™. Jim can be reached [email protected].
SPRA Pools in Light of September 11th Tragediesby James B. Keller

JUNE 2002 17
REINSURANCE NEWS
Editor’s Note: Copies of the full studies (text and tables) areavailable in the Reinsurance Section area of the SOA homepage www.soa.org.
Manulife Reinsurance, in conjunction with theReinsurance Council of the Society ofActuaries, conducts an annual study of
mortality experience on large amount and older agepolicies. The experience data wassubmitted to the Society ofActuaries by six companies.The consolidated data isanalyzed in terms of mortalityratios by number and amount,and the results are furthersubdivided by age, sex, dura-tion, smoking and underwritingstatus, reinsurance method andlevel of retention.
The exposure includes onlysingle life policies issued in theUnited States and valued in U.S.dollars. Expected deaths are basedon 100% of the SOA 1975-80 Select& Ultimate table which varies byage and sex, age nearest and age lastbirthday. The basic tables wereextended to issue age 90 and theresulting tables were used to calculatethe expected mortality for issue agesgreater than 70. Ultimate ages were also extended toage 105 from age 100, starting with the 1991 study.
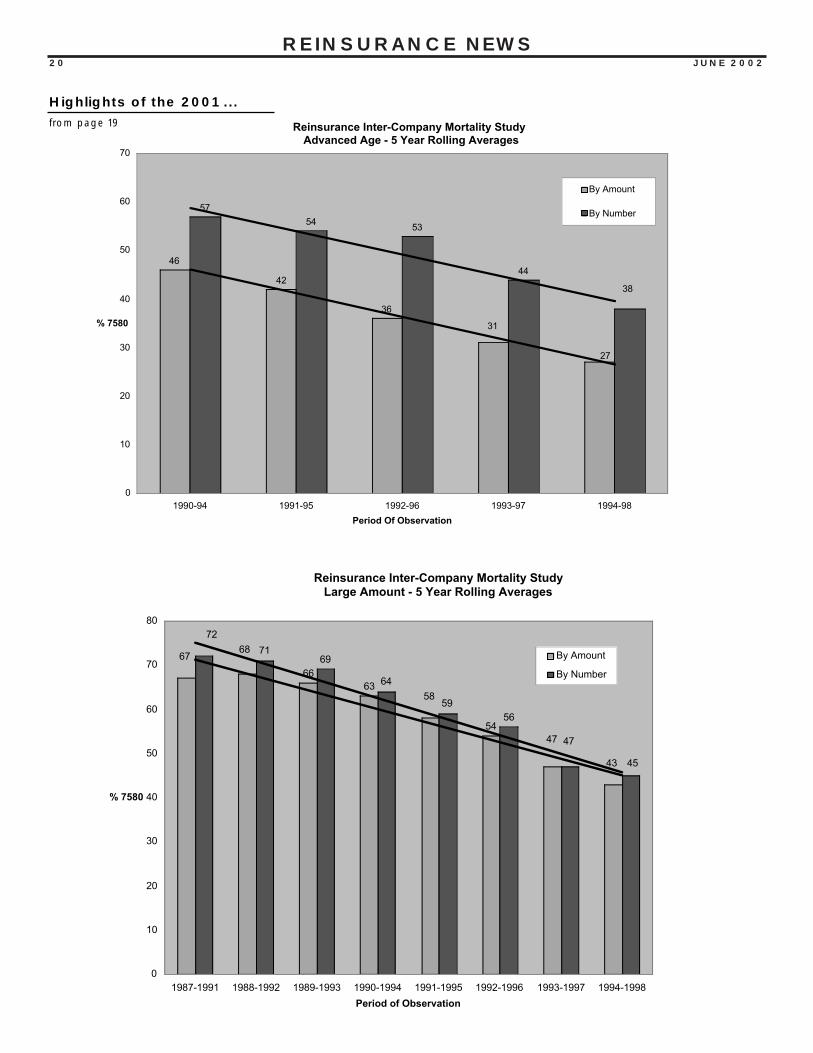
The 2001 Large Amount study covers experience forcalendar years 1997 and 1998. Manulife has beenconducting these studies since 1990, covering experi-ence during calendar years 1987 and later. TheAdvanced Age study has been conducted since 1993,covering experience in calendar years 1990 and later.Both studies present results individually for each ofthe two most recent calendar years as well as a cumu-lative result of all study years. The results of theAdvanced Age and Large Amount studies will bediscussed separately.
2001 Large Amount Study: Results
Policies for large amounts are those with a total faceamount greater than $1 million.
1997 and 1998 Results:The experience underlying the 1997 and 1998 data isbased on total exposures of $64 billion and $77 billion,respectively. Claims in 1997 were $77 million and in1998 they were $101 million. The total 1997 exposureby number is 231,965 (275,823 in 1998). In 1997, 168claims were reported (353 in 1998). The 1998 expo-sures by number and total claims represent thelargest in this study’s history.
The overall mortality ratios by amount for the1997 and 1998 study are 34% and 37%, respec-tively. By number, the ratios for the 1997 and 1998study are 27% and 48%, respectively.
1987 to 1998 Results:The experience underlying the 1987 to 1998data is based on a total exposure of $780 billionand claims of $1.6 billion. The total exposureby number is 1,597,918 with 2,395 claims.
The overall ratio by amount is 56 percent.This ratio decreases slightly when measuredon a “by number” basis to 54 percent.
This year’s study includes an analysis of theratios (and supporting exposure) by a five year rollingaverage and a four year period average. The additionaldata allows the reader to more easily view the mortalitytrends and assign credibility to those trends.
The mortality ratios are also presented for variousclassifications—first for 1997 and 1998 experience, andthen the cumulative result for the entire study periodfrom 1987 to 1998.
Sex: Males comprise approximately 88% of the 1997 and 1998 exposure by number (and by amount). Close to one-fifth of all male claims are classified as misadventure.
Highlights of the 2001 Manulife Reinsurance Mortality Studyby Manon Laverdière and Valerio Valenti
continued on page 18

18 JUNE 2002
REINSURANCE NEWS
The mortality ratio by amount for males in 1997 is 38% and for females it is 11% (1998: 38% for males, 33% for females).
The mortality ratio by number in 1997 is 28% for males and 16% for females (1998: 47% for males, 53% for females).
Based on data from 1987 to 1998, themortality ratio by amount for males is 55% and for females it is 62%. During this period male exposure was 90%.By number, the mortality ratios are 53% and 59% for males and females,respectively. Over the years female mortality has shown more improve-ment than male mortality.
Issue Age: Issue ages 30-49 represent approxi-mately 75% of the 1997 and 1998 exposure by number and approx-imately 70% of the exposure by amount. However, actual claims paid are highest in the age category 50-59 for both the 1997 and 1998 data.
The mortality ratio by amount in 1997 is 40% for issue ages 50-59 (38% in 1998). By number the 1997 ratio is 34% (51% in 1998).
From 1987 to 1998, 54% of the largest claims (over $5 million) were in the age band 50 to 69.
Policy Years: Exposure by number and by amount is the highest for the first two policy durations. The 1997 mortality ratio by number for duration one and two is 19% and 30%, respectively (36% and 29% in 1998). This compares favorably when compared to the average ratios for all durations (27% in 1997, 48% in 1998).
The 1997 mortality ratio by amount for both durations one and two is 16%.The 1998 ratios are 26% and 20%,respectively. Both 1997 and 1998 ratios are considerably better than the overall amount average of 34% in 1997 and 37% in 1998.
The 1987 to 1998 cumulative mortal-ity ratio by amount at duration one is 55% (partly due to large aviation claims in the study’s early years). It then decreases at duration two (44%) and increases over the next two durations from 51% to 56%.
In 1997 and 1998, seven out of the 19 claims with Direct Face Amounts over$5 million occurred during the first three policy durations, the remaining claims occurred in duration six andover.
Smoking Status: The mortality ratio by amount for non-smokers is 34% in both 1997 and 1998.The ratio for smokers is 56% in 1997 (49% in 1998). The exposure by amount in 1997 for non-smoker,smoker and aggregate policies are 71%, 6%, and 23% respectively (In 1998, 89%, 6%, 5%).
The overall ratios (1987-1998) by amount for non-smoker and smoker are 48% and 104%, respectively. The ratio of smoker to non-smoker mortal-ity has decreased considerably over the years. In fact, in some years the smoker ratio is less than the non-smoker ratio. However, the smoker exposure by amount is only 7% of the study and thus has low credibility.
Note that the expected 75-80 Basic Tables are not differentiated by smoker status.
Highlights of the 2001 ...
from page 17

JUNE 2002 19
REINSURANCE NEWS
UnderwritingStatus: The mortality ratio by amount for
standard policies is 32% in 1997 (34% in 1998). For substandard policies, the ratio increases to 47% in 1997 and to 59% in 1998. Approximately 96% of the exposure is accounted for by standard policies.
The overall standard ratio by amount from 1987 to 1998 is 56% (55% for substandard).
ReinsuranceStatus: The 1997 mortality ratio by amount is
21% for automatic business, and 55% for facultative (1998: 36% for auto-matic and 40% for facultative). Theexposure by dollar amount is approxi-mately 80% for automatic business in both 1997 and 1998.
The 1987 to 1998 overall amount ratio is 47% for automatic and 64% for facultative business. The facultative exposure has decreased steadily since the study’s inception. In the late 1980s, facultative business comprised more than 50% of the study’s data.
Plan of Insurance: A large portion of contributors did not
submit a plan of insurance code, and therefore, the results by plan are not very credible.
The plan of insurance was provided forapproximately half of the business submitted (and almost all of it was for Term) for 1997 and 1998 data. In 1997, Term had a 22% ratio by number and 38% ratio by amount (in 1998 the ratios were 47% and 43%,respectively).
Method of Reinsurance: The 1997 mortality ratio by amount
is 30% for YRT and 37% for Coinsurance (1998 ratios are 26% and 20%, respectively).
Data collection for reinsurance methodbegan in 1991. The 1991 to 1998 mortality ratio by amount is 48% for YRT and 50% for Coinsurance.
2001 Advanced Age Study: Results
Policies for advanced age are those with an issue age of70 or over.
1997 and 1998 Results:The experience underlying the 1997 and 1998 data isbased on total exposures of $1.9 billion and $2.3billion, respectively. Claims in 1997 were $12 millionand in 1998 they were $19 million. Total exposure bynumber in 1997 and 1998 was 20,578 and 28,175,respectively. In 1997, 237 claims were reported (333 in1998). The 1997 and 1998 exposure by number andthe 1998 claim number are the largest in this study’shistory.
The overall mortality ratios by amounts for the 1997and 1998 study are 19% and 24%, respectively. Bynumber, the ratio for the 1997 data is 27% (31% in1998).
1990 to 1998 Results:The experience underlying the years 1990 to 1998 isbased on a total dollar exposure of $15.5 billion. Duringthose years, $188 million of claims were experienced.The total 1990 to 1998 exposure by number is 115,106policies with 2,023 claims.
The overall mortality ratio by amount for the 1990 and1998 study is 36%. By number, the overall ratio is 45%.
continued on page 20
20 JUNE 2002
REINSURANCE NEWS
Reinsurance Inter-Company Mortality Study Advanced Age - 5 Year Rolling Averages
46
42
36
57
5453
44
27
31
38
0
10
20
30
40
50
60
70
1990-94 1991-95 1992-96 1993-97 1994-98
Period Of Observation
% 7580
By Amount
By Number
Reinsurance Inter-Company Mortality StudyLarge Amount - 5 Year Rolling Averages
6663
54
7169
64
5956
58
6867
47
43
72
47
45
0
10
20
30
40
50
60
70
80
1987-1991 1988-1992 1989-1993 1990-1994 1991-1995 1992-1996 1993-1997 1994-1998
Period of Observation
% 7580
By Amount
By Number
Highlights of the 2001 ...
from page 19

JUNE 2002 21
REINSURANCE NEWS
There is a decreasing trend in both ratios when analyzedon each of a moving average and period average.
The mortality ratios are also presented for the vari-ous classifications, first for 1997 and 1998 experienceand then the cumulative result for the entire studyperiod from 1990 to 1998.
Sex: In 1997 and 1998, 45% of policy amounts were from male lives. This marks the first time in this study’s history that female amounts out-number the male amounts.
By amount, the ratio for males is 20% in 1997, and 22% in 1998. By amount the ratio for females is 17% in 1997 and 27% in 1998.
The mortality ratios by number for males in 1997 and 1998 are 27% and 29%, respectively. Similarly, the femaleby number ratios are 28% in 1997 and 33% in 1998.
The mortality ratios by amount for 1990 to 1998 data are 35% for males and 38% for females. Ratios by num-ber during the period are 44% and46% for males and females, respectively.
Issue Age: By amount, approximately 65% of policies (75% by number) have issue ages between 70 and 74 in both 1997 and 1998. By amount in 1997, the age
band 70 to 74 experienced a ratio of 14% (27% in 1998). The age band 75 to 79 experienced a 30% ratio in 1997 (26% in 1998).
Policy Years: By policy year, the ratios vary greatly from one duration to the next.
In 1998, approximately half of all exposures by number and by amount are in durations one and two,compared to 41% for the 1997 data.The mortality ratio by amount at duration 1 is 16% in 1997 and 24% in 1998.
From 1990 to 1998, the overall by amount ratio for duration one is 31%.
Advanced Age Inter-Company Mortality Study
1990-94 1991-95 1992-96 1993-97 1994-98By Amount 46 42 36 31 27By Number 57 54 53 44 38
1987-91 1988-92 1989-93 1990-94 1991-95 1992-96 1993-97 1994-98By Amount 67 68 66 63 58 54 47 43By Number 72 71 69 64 59 56 47 45
continued on page 22

22 JUNE 2002
REINSURANCE NEWS
Smoking Status: The 1997 non-smoker and smoker ratios by amount are both approxi-mately 19%. The 1998 non-smoker ratio by amount is 24%, and surprisingly the smoker ratio is lower at 16%. However, since there are far fewer smoker exposures (10% vs. 90% for non-smokers), the validity of the smoker result is weak.
From 1990 to 1998, the ratio by amount for non-smoker is 31% (63% for smoker).
Underwriting Status: The mortality ratio by number for
standard policies is 23% and 22%, for 1997 and 1998 data, respectively. The 1997 substandard ratio by amount is 8% (29% for 1998 data). However, the standard exposure is nearly four tofive times more than substandard exposure. The cumulative 1990 to 1998by amount ratio for standard policies is 37% and for substandard it is 35%.81% of the exposure by amount is comprised of standard policies.
Reinsurance Status: In 1997 and 1998, the exposure by
number for automatic reinsurance is approximately 90% for both years.However, the exposure by amount for automatic business comprises on average 65% of the study’s data.
The ratio by amount for policies rein-sured automatically is 20% (17% for facultative) for 1997 data, and 21% (28% for facultative) for 1998 data.
The 1990 to 1998 cumulative ratio by amount for policies reinsured auto-matically is 32%, compared to 39% for facultative policies. In the study’s
early years (1990 to 1992), facultative was approximately double the auto-matic exposure by amount. However,in the last few years, automatic rein-surance is now double the facultative exposure.
Plan of Insurance: In this year’s two year study, many
policies were classified as Unknown (1997: 48% by amount; 1998: 44%).The 1997 Term mortality ratio by amount is 30% (40% in 1998).
From 1990 to 1998, by dollar amount,Whole Life, Term and UL mortality ratios are 28%, 46% and 35%, respec-tively. By number, Whole Life, Term and UL mortality rates are 50%, 33%,and 50%, respectively.
Manon Laverdière, FSA, FCIA, associate actuary, hasrecently joined the Corporate ALM areaof ManulifeFinancial in Toronto. She can be reached at manon_laverdier@ manulife.com.
Valerio Valenti, ASA, is senior actuarial associate in theLife Pricing area of Manulife Reinsurance located inToronto, ON. He can be reached at [email protected].
Highlights of the 2001 ...
from page 21

JUNE 2002 23
REINSURANCE NEWS
Introduction
The 1975-80 Select andUltimate mortality table hascontinued to serve the actuar-
ial profession very effectively overthe decades. Scaling factors wereupdated and minor adjustmentswere made as an attempt to keepthis table current. All prototypes,however, need to be re-evaluatedfrom time to time in order to ensureappropriateness and accuracy.Changes in lifestyles, medicaladvances, new underwriting require-ments and risk classifications, etc.can effect mortality patterns andneed to be recognized. In this paperit will be shown that the result ofusing the 1975-80 Select andUltimate Table as opposed to themore modern 1990-95 SelectUltimate Table can be a significantunderstatement of future mortalityand hence, anticipated profits mayprove to be illusory.
Projecting future mortality hasbeen referred to as an art as well asa science. Mortalityprojections/assumptions are used inmany different situations and formany different purposes (fromcalculating profit margins todemonstrating company solvency).Some examples are pricing newproducts, cash flow testing, analysisof reinsurance costs (i.e. reinsur-ance premiums vs. future expectedmortality), self-support testing(under the NAIC Model IllustrationRegulation, under New York section4228, etc.), reserve adequacy test-ing, valuing inforce blocks ofbusiness, etc.
The development of mortalityprojections/assumptions typicallytakes into consideration companymortality experience, industrymortality experience, or a combina-tion of both. In establishing a
mortality assumption for developingnew products the pricing actuaryoften would begin with the mortal-ity experience of recently issuedpolicies of a particular type of prod-uct and make some adjustments forpossible changes in new underwrit-ing requirements, average faceamount, persistency, or any otherfactor that may have an impacton future mortality.
The appropri-ate mortalityexperience,therefore,would belimited to theearly durationsof newer prod-ucts, whichwould have mostlikely beenissued usingunderwritingguidelines andrequirements similar to what iscurrently being used or will be usedin the near future. In performingcash flow testing, reserve adequacytesting, valuing an inforce block ofbusiness (possibly for sale or acqui-sition), etc. the valuation actuarywould begin with the mortalityexperience of policies issued over alonger time frame.
Perhaps issued over a period of 10to 20 or more years, which would bemore representative of thecompany’s entire inforce business.The reinsurance actuary, whetherfrom the ceding company perspec-tive (analyzing reinsurance quotesby comparing them with futureexpected mortality) or the assumingcompany perspective (developing areinsurance quote that properlyreflects future expected mortality),would be interested in mortalityexperience of recently issued policies
in reinsuring new business and poli-cies issued “many” years ago inreinsuring inforce business.
General ApproachWe started with a simple modelusing the assumption that$10,000,000 face amount was
issued each year foreach issue age (25,35, 45 and 55) andexperiencing Linton“B“ lapse rates (20%,12%, 10%, 8.8%, 8%,etc.) We also formed acomposite issue ageby assuming thedistribution of faceamount by age was15%, 35%, 35% and 15%for issue ages 25, 35, 45and 55 respectively.
We used this model tocalculate actual toexpected mortality ratios
(for each mortality table) for policiesin their first three policy years.(Expected mortality was calculatedby using a single year of issue,applying lapse rates and multiply-ing the appropriate qx’s to the faceamount exposed in durations onethrough three.) Actual mortalitywas arbitrarily assumed to equal80% of the 1990-95 table. Thisassumption was totally arbitraryand has no impact on this analysis.Next, we calculated the 20-yearpresent value of future claims (for asingle year of issue, representingnew business) using the qx’s of eachmortality table separately. That is,the actual to expected mortalityratio obtained by using the 1975-80mortality table was applied to the1975-80 mortality table in calculat-ing the 20 year present value ofclaims, and analogously for the
The Relationship of Mortality Projections and TheUnderlying Mortality Tables Usedby Larry Warren
continued on page 24
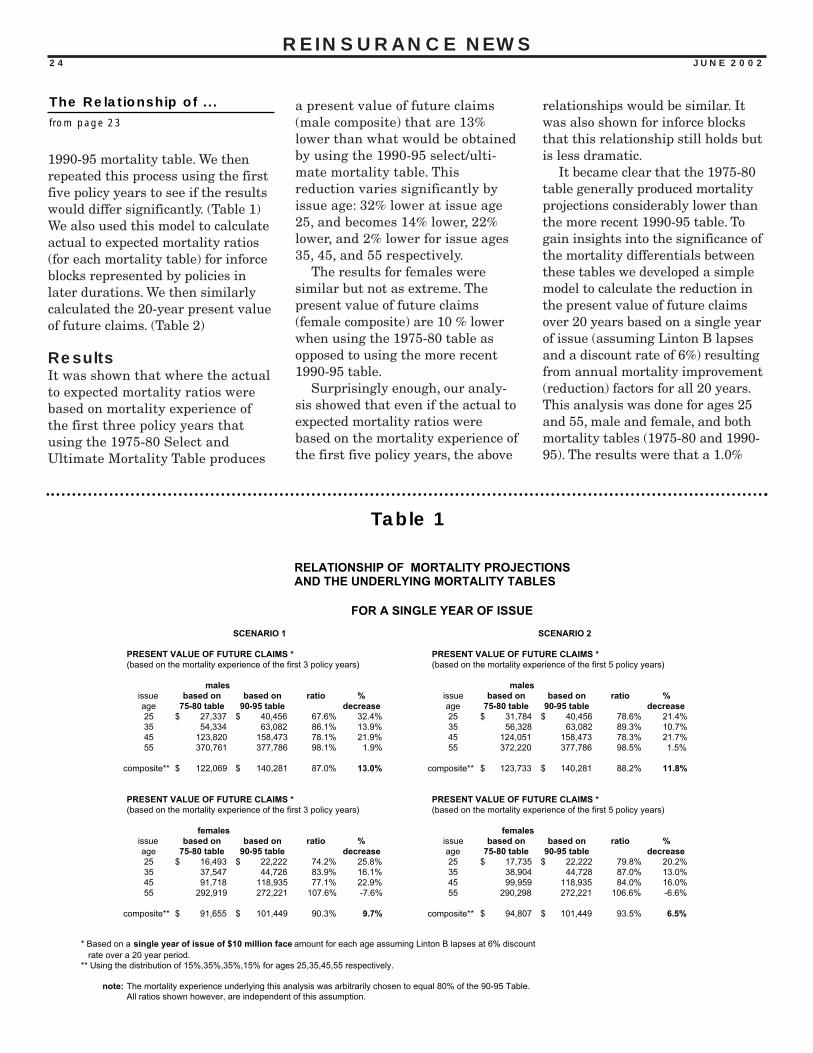
24 JUNE 2002
REINSURANCE NEWS
1990-95 mortality table. We thenrepeated this process using the firstfive policy years to see if the resultswould differ significantly. (Table 1)We also used this model to calculateactual to expected mortality ratios(for each mortality table) for inforceblocks represented by policies inlater durations. We then similarlycalculated the 20-year present valueof future claims. (Table 2)
ResultsIt was shown that where the actualto expected mortality ratios werebased on mortality experience ofthe first three policy years thatusing the 1975-80 Select andUltimate Mortality Table produces
a present value of future claims(male composite) that are 13%lower than what would be obtainedby using the 1990-95 select/ulti-mate mortality table. Thisreduction varies significantly byissue age: 32% lower at issue age25, and becomes 14% lower, 22%lower, and 2% lower for issue ages35, 45, and 55 respectively.
The results for females weresimilar but not as extreme. Thepresent value of future claims(female composite) are 10 % lowerwhen using the 1975-80 table asopposed to using the more recent1990-95 table.
Surprisingly enough, our analy-sis showed that even if the actual toexpected mortality ratios werebased on the mortality experience ofthe first five policy years, the above
relationships would be similar. Itwas also shown for inforce blocksthat this relationship still holds butis less dramatic.
It became clear that the 1975-80table generally produced mortalityprojections considerably lower thanthe more recent 1990-95 table. Togain insights into the significance ofthe mortality differentials betweenthese tables we developed a simplemodel to calculate the reduction inthe present value of future claimsover 20 years based on a single yearof issue (assuming Linton B lapsesand a discount rate of 6%) resultingfrom annual mortality improvement(reduction) factors for all 20 years.This analysis was done for ages 25and 55, male and female, and bothmortality tables (1975-80 and 1990-95). The results were that a 1.0%
RELATIONSHIP OF MORTALITY PROJECTIONSAND THE UNDERLYING MORTALITY TABLES
FOR A SINGLE YEAR OF ISSUE
SCENARIO 1 SCENARIO 2
PRESENT VALUE OF FUTURE CLAIMS * PRESENT VALUE OF FUTURE CLAIMS *(based on the mortality experience of the first 3 policy years) (based on the mortality experience of the first 5 policy years)
males malesissue based on based on ratio % issue based on based on ratio %age 75-80 table 90-95 table decrease age 75-80 table 90-95 table decrease25 27,337$ 40,456$ 67.6% 32.4% 25 31,784$ 40,456$ 78.6% 21.4%35 54,334 63,082 86.1% 13.9% 35 56,328 63,082 89.3% 10.7%45 123,820 158,473 78.1% 21.9% 45 124,051 158,473 78.3% 21.7%55 370,761 377,786 98.1% 1.9% 55 372,220 377,786 98.5% 1.5%
composite** 122,069$ 140,281$ 87.0% 13.0% composite** 123,733$ 140,281$ 88.2% 11.8%
PRESENT VALUE OF FUTURE CLAIMS * PRESENT VALUE OF FUTURE CLAIMS *(based on the mortality experience of the first 3 policy years) (based on the mortality experience of the first 5 policy years)
females femalesissue based on based on ratio % issue based on based on ratio %age 75-80 table 90-95 table decrease age 75-80 table 90-95 table decrease25 16,493$ 22,222$ 74.2% 25.8% 25 17,735$ 22,222$ 79.8% 20.2%35 37,547 44,728 83.9% 16.1% 35 38,904 44,728 87.0% 13.0%45 91,718 118,935 77.1% 22.9% 45 99,959 118,935 84.0% 16.0%55 292,919 272,221 107.6% -7.6% 55 290,298 272,221 106.6% -6.6%
composite** 91,655$ 101,449$ 90.3% 9.7% composite** 94,807$ 101,449$ 93.5% 6.5%
* Based on a single year of issue of $10 million face amount for each age assuming Linton B lapses at 6% discount rate over a 20 year period.** Using the distribution of 15%,35%,35%,15% for ages 25,35,45,55 respectively.
note: The mortality experience underlying this analysis was arbitrarily chosen to equal 80% of the 90-95 Table.All ratios shown however, are independent of this assumption.
The Relationship of ...
from page 23
Table 1

JUNE 2002 25
REINSURANCE NEWS
EX
HIB
IT 2
RE
LA
TIO
NS
HIP
OF
MO
RT
AL
ITY
PR
OJE
CT
ION
SA
ND
TH
E U
ND
ER
LY
ING
MO
RT
AL
ITY
TA
BL
ES
F
OR
INF
OR
CE
BU
SIN
ES
S
SC
EN
AR
IO 1
SC
EN
AR
IO 2
SC
EN
AR
IO 3
PR
ES
EN
T V
AL
UE
OF
FU
TU
RE
CL
AIM
S *
PR
ES
EN
T V
AL
UE
OF
FU
TU
RE
CL
AIM
S *
PR
ES
EN
T V
AL
UE
OF
FU
TU
RE
CL
AIM
S *
(bas
ed o
n a
n in
forc
e co
nta
inin
g 5
yea
rs o
f n
ew b
usi
nes
s)(b
ased
on
an
info
rce
con
tain
ing
10 y
ears
of
new
bu
sin
ess)
mal
esm
ales
mal
esis
sue
bas
ed o
nb
ased
on
rati
o%
issu
eb
ased
on
bas
ed o
nra
tio
%is
sue
bas
ed o
nb
ased
on
rati
o%
age
75-8
0 ta
ble
90-9
5 ta
ble
dec
reas
eag
e75
-80
tab
le90
-95
tab
led
ecre
ase
age
75-8
0 ta
ble
90-9
5 ta
ble
dec
reas
e25
161,
618
$
230,
208
$
70.2
%29
.8%
2540
0,17
1$
47
7,95
8$
83
.7%
16.3
%25
716,
328
$
776,
097
$
92.3
%7.
7%35
351,
082
409,
330
85.8
%14
.2%
3582
3,52
8
92
4,59
7
89
.1%
10.9
%35
1,48
5,21
7
1,
606,
312
92.5
%7.
5%45
799,
844
1,06
6,30
9
75
.0%
25.0
%45
2,12
6,56
4
2,
445,
817
86.9
%13
.1%
453,
978,
370
4,29
6,82
3
92
.6%
7.4%
552,
496,
462
2,50
5,65
1
99
.6%
0.4%
556,
184,
557
5,80
0,63
3
10
6.6%
-6.6
%55
10,8
10,0
50
10
,295
,890
105.
0%-5
.0%
com
posi
te**
801,
536
$
926,
853
$
86.5
%13
.5%
com
posi
te**
2,02
0,24
1$
2,
121,
433
$
95.2
%4.
8%co
mpo
site
**3,
641,
212
$
3,72
6,89
5$
97
.7%
2.3%
PR
ES
EN
T V
AL
UE
OF
FU
TU
RE
CL
AIM
S *
PR
ES
EN
T V
AL
UE
OF
FU
TU
RE
CL
AIM
S *
PR
ES
EN
T V
AL
UE
OF
FU
TU
RE
CL
AIM
S *
(bas
ed o
n an
info
rce
cont
aini
ng 5
yea
rs o
f new
bus
ines
s)(b
ased
on
an in
forc
e co
ntai
ning
10
year
s of
new
bus
ines
s)(b
ased
on
an in
forc
e co
ntai
ning
15
year
s of
new
bus
ines
s)
fem
ales
fem
ales
fem
ales
issu
eb
ased
on
bas
ed o
nra
tio
%is
sue
bas
ed o
nb
ased
on
rati
o%
issu
eb
ased
on
bas
ed o
nra
tio
%ag
e75
-80
tab
le90
-95
tab
led
ecre
ase
age
75-8
0 ta
ble
90-9
5 ta
ble
dec
reas
eag
e75
-80
tab
le90
-95
tab
led
ecre
ase
2510
2,08
2$
13
4,72
1$
75
.8%
24.2
%25
273,
811
$
295,
742
$
92.6
%7.
4%25
495,
919
$
498,
967
$
99.4
%0.
6%35
242,
197
299,
178
81.0
%19
.0%
3552
4,71
9
68
7,49
6
76
.3%
23.7
%35
964,
740
1,20
9,21
5
79
.8%
20.2
%45
624,
419
791,
014
78.9
%21
.1%
451,
490,
873
1,78
6,44
8
83
.5%
16.5
%45
2,68
8,22
5
3,
076,
162
87.4
%12
.6%
551,
939,
427
1,79
6,04
5
10
8.0%
-8.0
%55
4,12
8,25
5
4,
080,
374
101.
2%-1
.2%
557,
546,
308
7,15
5,64
0
10
5.5%
-5.5
%
com
posi
te**
609,
542
$
671,
182
$
90.8
%9.
2%co
mpo
site
**1,
365,
767
$
1,52
2,29
8$
89
.7%
10.3
%co
mpo
site
**2,
484,
872
$
2,64
8,07
3$
93
.8%
6.2%
The
se in
forc
e bl
ocks
wer
e de
velo
ped
from
5,1
0,an
d 15
yea
rs o
f new
bus
ines
s of
$10
mill
ion
face
am
ount
for
each
age
.
* U
sing
the
dist
ribut
ion
of 1
5%,3
5%,3
5%,1
5% fo
r ag
es 2
5,35
,45,
55 r
espe
ctiv
ely.
no
te:
The
mor
talit
y ex
perie
nce
unde
rlyin
g th
is a
naly
sis
was
arb
itrar
ily c
hose
n to
equ
al 8
0% o
f the
90-
95 T
able
.A
ll ra
tios
show
n ho
wev
er, a
re in
depe
nden
t of t
his
assu
mpt
ion.
continued on page 26
Tab
le 2

26 JUNE 2002
REINSURANCE NEWS
EF
FE
CT
OF
MO
RT
AL
ITY
IMP
RO
VE
ME
NT
FA
CT
OR
SO
N M
OR
TA
LIT
Y P
RO
JEC
TIO
NS
(20
YE
AR
S)
75-8
0 m
ort
alit
y ta
ble
90-9
5 m
ort
alit
y ta
ble
75-8
0 m
ort
alit
y ta
ble
90-9
5 m
ort
alit
y ta
ble
mo
rtal
ity
mal
e ag
em
ort
alit
ym
ale
age
mo
rtal
ity
fem
ale
age
mo
rtal
ity
fem
ale
age
imp
rove
men
t25
imp
rove
men
t25
imp
rove
men
t25
imp
rove
men
t25
fact
or
*%
dec
reas
e**
fact
or
*%
dec
reas
e**
fact
or
*%
dec
reas
e**
fact
or
*%
dec
reas
e**
0.00
%0.
0%0.
00%
0.0%
0.00
%0.
0%0.
00%
0.0%
0.50
%3.
6%0.
50%
4.1%
0.50
%4.
2%0.
50%
4.4%
1.00
%6.
9%1.
00%
8.0%
1.00
%8.
2%1.
00%
8.6%
1.50
%10
.1%
1.50
%11
.6%
1.50
%11
.9%
1.50
%12
.5%
75-8
0 m
ort
alit
y ta
ble
90-9
5 m
ort
alit
y ta
ble
75-8
0 m
ort
alit
y ta
ble
90-9
5 m
ort
alit
y ta
ble
mo
rtal
ity
mal
e ag
em
ort
alit
ym
ale
age
mo
rtal
ity
fem
ale
age
mo
rtal
ity
fem
ale
age
imp
rove
men
t55
imp
rove
men
t55
imp
rove
men
t55
imp
rove
men
t55
fact
or
*%
dec
reas
e**
fact
or
*%
dec
reas
e**
fact
or
*%
dec
reas
e**
fact
or
*%
dec
reas
e**
0.00
%0.
0%0.
00%
0.0%
0.00
%0.
0%0.
00%
0.0%
0.50
%5.
1%0.
50%
5.0%
0.50
%4.
9%0.
50%
4.9%
1.00
%9.
8%1.
00%
9.6%
1.00
%9.
5%1.
00%
9.5%
1.50
%14
.3%
1.50
%14
.0%
1.50
%13
.9%
1.50
%13
.8%
* C
ompo
unde
d ea
ch y
ear
for
year
s 1-
20.
** R
educ
tion
in p
rese
nt v
alue
of f
utur
e cl
aim
s ba
sed
on a
sin
gle
year
of i
ssue
ass
umin
g Li
nton
B la
pses
a
t a 6
% d
isco
unt r
ate
over
20
year
s.
Tab
le 3
The Relationship of ...
from page 25

JUNE 2002 27
REINSURANCE NEWS
annual improvement factor over all20 years (a somewhat aggressiveassumption) produces a decrease inthe present value of future claimsranging from 7% to 10%, while usinga 1.5% annual improvement factorover all 20 years (a very aggressiveassumption) produces a decreaseranging from 10% to 14%. (Table 3)It now becomes quite apparent thatfor many issue ages the decrease inthe present value of future claimsresulting from using the 1975-80Select and Ultimate Table asopposed to the 1990-95 Select andUltimate Table, is often greater thanthe decrease in the present value offuture claims resulting from usingaggressive mortality improvementfactors.
Observations andConclusionsThe relationship of mortality projec-tions and the underlying mortalitytables turns out to be quite signifi-cant. The majority of companiescontinue to use the 1975-80 Selectand Ultimate Mortality Table. Theactuary in making the decisionto utilize the 1975-80 Select andUltimate mortality table (asopposed to the 1990-95 Selectand Ultimate mortality table)may unwittingly be taking anaggressive posture when itcomes to projecting futureclaims. The significant decrease inthe present value of future claimsresulting from using the 1975-80Select and Ultimate Table asopposed to the 1990-95 Select andUltimate Table results from the factthat the slope of the 1990-95 tableis higher than that of the 1975-80table (i.e. in the early years theratio of the qx’s of the 1990-95 tableto the 1975-80 table are lower thanthey are in the later years). Each ofthese tables was based on the SOAInter-company Mortality Study onStandard Ordinary Issues in theUSA. The 1990-95 table, in additionto being a much more recent table,was based on data where the total
dollar amount of exposure was $4.1trillion for males, and $1.6 trillionfor females (more than double thatof the earlier 1975-80 table andhence should have greater credibil-ity). It should be noted that the1990-95 table was developed withselection factors for 25 years withan emphasis of fit over smoothness,while the 1975-80 table was devel-oped with selection factors for 15years with an emphasis of smooth-ness over fit.
Companies with relatively lowaverage issue ages (e.g., issue ages25 - 45) that are still using the1975-80 Select and UltimateMortality Table, should be espe-cially careful in setting theirmortality assumptions. If actualmortality turns out to be betterreflected by the 1990-95 table(which is very likely), they run therisk of significantly understatingfuture claims.
Certain state regulations dealingwith self-support testing andValuation (e.g. Regulation XXX)prohibit the use of mortalityimprovement factors prospectively.Since we have shown that using the1975-80 mortality table is oftensimilar (in slope) to using the 1990-95 table with aggressive mortalityimprovement factors, it is notunlikely that State Regulators maysoon consider the need to requirethe use of the 1990-95 mortalitytable or a modification thereof—perhaps the 2001 VBT table.
Based on a recent surveyconducted by Tillinghast-TowersPerrin (The 2000 Pricing Survey ofIndividual Life and AnnuityProducts) covering 22 mutualcompanies and 38 stock companies,very few companies include futuremortality improvement whencalculating expected mortality inproduct pricing. Therefore, sincecompanies in general believe itprudent not to reflect futuremortality improvement it is espe-cially important that they fullyanalyze their choice in selecting
the underlying mortality tableused in their profit studies andmortality projections. In addition,adjustments and modifications toexisting tables may be necessary(e.g. there is an AIDS “hump” inyoung male middle durationmortality reflected in the 1990-95mortality table, which is probablyinappropriate in today’s climate offluid-tested underwriting).
Many companies (direct writersas well as reinsurers), in order tomeet competition, have reducedprofit margins. Some may haveeven liberalized (lowered) theirmortality assumptions to offsetthis reduction to profit margin.This increases the likelihood ofadverse mortality deviations. Inthis business environment, theadditional vulnerability caused byusing a possibly inappropriatemortality table becomes untenable.
Mortality studies are becomingless and less rigorous because it ismore difficult to get credible experi-ence. This results from the fact thatover recent years, new underwritingrequirements and many differenti-ated risk classifications haveemerged (preferred, super-preferred, preferred-plus, etc). Inaddition this paper suggests theselection of the proper mortalitytable is yet another variable requir-ing judgment. In this climategreater emphasis must therefore beplaced on subjective judgmentrather than stringent statisticaltechniques, thereby substantiatingour earlier comment that projectingmortality is clearly an art, as wellas a science.
Larry Warren FSA, MAAA is seniorvice president and chief actuary ofNational Benefit Life (NBL) and isresponsible for NBL/Primerica LifeReinsurance. He can be reached atlarry. [email protected], or byphone at (212) 615-7341 or fax,(212) 615-7308.

28 JUNE 2002
REINSURANCE NEWS
DISCLAIMER:Munich American ReassuranceCompany prepared the survey at therequest of the Society of ActuariesReinsurance Section as a service toSection members. The contributingcompanies provide the numbers inresponse to the survey. These numbersare not audited and Munich American,the Society of Actuaries and theReinsurance Section take no responsibil-ity for the accuracy of the figures.
Munich American’s annualsurvey, which is conductedon behalf of the Statistical
Research Committee of theReinsurance Section, coversCanadian and U.S. ordinary andgroup life reinsurance new businessproduction and in force. The ordi-nary numbers are furthersubdivided into:
(1) Recurring reinsurance1: conven-tional reinsurance covering an insurance policy with an issue
date in the year in which it was reinsured
(2) Portfolio reinsurance: reinsur-ance covering an insurance policy with an issue date in a year prior to the year in which it was reinsured, or financial reinsurance, and
(3) Retrocession reinsurance: rein-surance not directly written by the ceding company.
Complete survey results areavailable from the authors uponrequest. These results may also beobtained at Munich American’s Website: www.marclife.com look underResearch.
Life ReinsuranceProductionAt first glance, it may appear thatlife reinsurance production in 2001
continued the recent trend ofgrowth—after all, looking at thetotals summarized below, a healthy31.0% increase was reported (U.S.:30.0%, Canada: 47.9%). However, ifwe dig a little deeper into thenumbers, we see quite a differentpicture. The impact the Swiss Reacquisition of Lincoln Re had on the2001 results was very significant. Ifwe exclude the Swiss Re portfoliobusiness attributable to the LincolnRe purchase, we see that in the U.S.,every reinsurance category exceptgroup experienced a decrease inproduction. This is quite a contrastto the Canadian numbers which haddouble-digit increases in every rein-surance category. Excluding theLincoln portfolio business, the 31.0%overall increase becomes a 7.4%decrease (US: -8.8, Canada: 17.6%).
Below are the life reinsuranceproduction results for 2000 and2001:
Life Reinsurance From The Munich American Surveyby James L. Sweeney and David M. Bruggeman
1 Included in the definition of recurring category is business assumed from the direct side of companies that also have a
reinsurance division. Business assumed from the reinsurance division would fall under the retrocession category.
Life Reinsurance New Business Production ($U.S. Millions)
United States Canadian Total
2000 2001 Change 2000 2001 Change 2000 2001 Change
Ordinary Life
Recurring 985,466 933,101 -5.3% 51,827 59,177 14.2% 1,037,293 992,278 -4.3%
Portfolio 157,394 569,066 261.6% 12,218 35,353 189.4% 169,612 604,419 256.4%
Retrocession 47,519 25,141 -47.1% 736 1,431 94.4% 48,255 26,572 -44.9%
Total Ordinary 1,190,379 1,527,308 28.3% 64,781 95,961 48.1% 1,255,160 1,623,269 29.3%
Total Group 20,430 46,767 128.9% 4,103 5,930 44.5% 24,533 52,697 114.8%
Total Life 1,210,80 1,574,075 30.0% 66,884 101,891 47.9% 1,279,693 1,675,966 31.0%

JUNE 2002 29
REINSURANCE NEWS
Recurring BusinessBecause the survey attempts toremove any double counting ofretrocession and block reinsurancefrom the recurring figures, recur-ring business usually offers themost revealing picture of produc-tion trends. In the U.S., there wasa 5.3% decrease in recurring newbusiness in 2001. This is a rathernoteworthy event as it marks thefirst time since 1989 that recur-ring business decreased in the U.S.To put this in perspective,increases of 21.6%, 19.3%, 33.9%,and 44.8% were recorded in 2000,1999, 1998 and 1997 respectively.Unlike the U.S., Canadian recur-ring business continued to grow in2001. A 14.2% growth rate wasrecorded. This follows increases of
41.7% in 2000, 37.1% in 1999 andconfirms the belief that Canadiandirect writers are reinsuring morebusiness on a first dollar quotashare basis. Two other factorsbelieved to have contributed posi-tively to the Canadian results are:(1) some Canadian direct writershave lowered their maximumretention limits, and (2) anincrease in high net worth sales inCanada.
While the overall recurringmarket decreased, there were stillsome companies that reportednoteworthy increases. Havingpurchased Lincoln Re in 2001,Swiss Re reported an increase of$127.5 billion in U.S. andCanadian recurring business.Annuity & Life Re and Scottish
Re, relative newcomers to the rein-surance industry, also reportedimpressive increases. Annuity &Life Re experienced a $23.5 billiongrowth in recurring production,while Scottish Re reported a $21.0billion increase. Other companiesreporting incremental increases inexcess of $5 billion in 2001include: ING Re ($7.6), CanadaLife ($7.5) and BMA ($6.0).
Totals for Canadian and U.S.recurring ordinary reinsuranceassumed in 2000 and 2001, as wellas percentage changes, are listedbelow and on page 30.
Portfolio andRetrocession BusinessTotal portfolio business increasedover 256% in 2001. However, as
U.S. Ordinary Recurring Reinsurance (U.S. Millions)
2000 2001
Assumed Market Increase in Assumed Market Increase in
Company Business Share Production Business Share Production
Allianz 45,532 4.6% 27.0% 43,711 4.7% -4.0%
Annuity and Life Re 32,253 3.3% 102.4% 55,764 6.0% 72.9%
AUL 46,942 4.8% 11.4% 21,750 2.3% -53.7%
BMA 33,004 3.3% 30.9% 39,003 4.2% 18.2%
Canada Life 11,471 1.2% 20.8% 19,010 2.0% 65.7%
Employers/ERC 86,577 8.8% -4.1% 37,248 4.0% -57.0%
General & Cologne 20,305 2.1% -1.8% 16,231 1.7% -20.1%
Gerling Global 31,397 3.2% 19.3% 27,746 3.0% -11.6%
Hannover Life Re 6,381 0.6% 59.9% 3,155 0.3% -50.6%
ING Re 86,009 8.7% 54.0% 93,584 10.0% 8.8%
Lincoln Re * 134,393 13.6% 17.1% ACQ ACQ ACQ
Munich American Re 119,859 12.2% 168.8% 103,679 11.1% -13.5%
Optimum Re (U.S.) 1,069 0.1% -1.3% 1,301 0.1% 21.7%
RGA 119,449 12.1% 36.6% 112,746 12.1% -5.6%
SCOR Life Re 844 0.1% 44.8% DNR DNR DNR
Scottish Re 5,060 0.5% 100.0% 26,045 2.8% 414.7%
Swiss Re 124,176 12.6% -2.3% 246,466 26.4% 98.5%
Transamerica Re 80,741 8.2% 7.7% 85,662 9.2% 6.1%
Totals 985,462 100.0% 26.9% 933,101 100.0% -5.3%
* Lincoln Re acquired by Swiss Re continued on page 30

30 JUNE 2002
REINSURANCE NEWS
noted earlier, this figure is heavilyimpacted by Swiss Re’s acquisitionof Lincoln Re. If we extract theportfolio business attributed to thisdeal, we see that portfolio businessdecreased 33.1%. Over the last fewyears, there has been a decreasingtrend in portfolio business. Thistrend would support the view thatthe number of in force block dealsbeing offered to reinsurers hasbeen declining.
Meanwhile, retrocession produc-tion dropped 44.9% in 2001. In justthe last two years, retrocessionproduction has fallen over 67%.Factors that may be contributing tothe drop in production are: (1)larger reinsurers increasing theirretention; (2) the trend toward firstdollar quota share arrangementswith multiple reinsurers in rein-surance pools—which reduces theavailability of “excess” layers; (3)consolidation of the reinsurancemarket.
Comparison With Direct MarketPreliminary estimates from theAmerican Council of Life Insurance(ACLI) show 2001 U.S. ordinaryindividual life insurance purchasesto be at almost exactly the samelevel as 2000 purchases. A modest0.3% increase is estimated.
Most direct writers continue toreinsure on a first dollar quota sharebasis. However, if we compare lifepurchases data from the ACLI to thereinsurance survey productionnumbers, we see that 2001 is thefirst year since 1989 where adecrease in the percentage-reinsuredwas recorded. Given that resultsfrom the last four years (1998-2001)show a relatively stable percentage-reinsured level (in the mid-to-upper50% range), the percentage-rein-sured level has definitely hit aplateau, and maybe even reached itslimit. The decrease in the percent-age-reinsured in 2001 may suggestthat direct writers are either slowlymoving away from first dollar quotashare arrangements and back to
excess retention arrangements orare increasing their maximum reten-tion limits on first dollar quota sharearrangements.
The following graph on page 31compares ordinary life new businesstotals with the recurring life rein-surance totals for the United States.
Life Reinsurance In ForceWith increases in both U.S. andCanadian life reinsurance in forcereported, total life in force businessincreased 15.1% in 2001. Excludingthe Lincoln Re portfolio businessfrom Swiss Re reduces this increaseto 3.6%. This compares to increasesof 21.6% in 2000 and 19.4% in 1999.The U.S. total life in force increased15.1% (3.3% excluding the LincolnRe portfolio business) and theCanadian market in force grew by15.0% (7.4% excluding the LincolnRe portfolio business) in 2001.
The in force survey results for2000 and 2001 are summarized onpage 31.
Canadian Ordinary Recurring Reinsurance (U.S. Millions)
2000 2001
Assumed Market Increase in Assumed Market Increase in
Company Business Share Production Business Share Production
Annuity and Life Re 144 0.3% -93.4% 0 0.0% -100.0%
Canada Life 0 0.0% -100.0% 461 0.8% 100.0%
ERC Canada 3,796 7.3% 137.2% 7,386 12.5% 94.6%
General & Cologne 6 0.0% 500.0% 41 0.1% 583.3%
Gerling Global 1,563 3.0% 22,214.3% 2,094 3.5% 34.1%
ING Re 2 0.0% -50.0% 1 0.0% -50.0%
Lincoln Re * 6,063 11.7% 53.1% ACQ ACQ ACQ
Munich re (Canada) 16,599 32.0% 63.0% 20,950 35.4% 26.2%
Optimum Re (Canada) 1,382 2.7% 67.4% 1,290 2.2% -6.7%
RGA 2 0.0% 100.0% 0 0.0% -100.0%
RGA Re (Canada) 8,439 16.3% 3.6% 7,919 13.4% -6.2%
Swiss Re 13,832 26.7% 42.6% 19,036 32.2% 37.6%
Totals 51,827 100.0% 41.6% 59,177 100.0% 14.2%
Life Reinsurance Data ...
from page 29
* Lincoln Re acquired by Swiss Re

JUNE 2002 31
REINSURANCE NEWS
ConclusionHas the U.S. reinsurance marketpeaked? Will the industry lookback at the tremendous growthwhich occurred in 1990s and say“Those were the good old days?”While a few more years of experi-ence is needed to answer thesequestions, the 2001 results do raisesome concerns. First, U.S. recurringbusiness reported a decrease inproduction for the first time in 12years. Second, the percentage-rein-sured is estimated to havedecreased for the first time in 12years. Third, retrocession business
continued it’s steady decline inproduction. On a more positivenote, the Canadian reinsurancemarket continues to producedouble-digit growth, thanks inlarge part to the prevalence of firstdollar quota share arrangements.However, one has to wonder iffuture growth trends in Canadawill mirror those witnessed in theU.S. market.
Experts are predicting continuedconsolidation within the reinsur-ance industry over the next severalyears. To date, the consolidationeffort has radically changed themake-up of the market. To illus-
trate, Fitch Ratings recentlyreported that in the past six years,nine of the top 18 life reinsurershave been acquired. This consolida-tion has resulted in the top five lifereinsurers accounting for almost70% of the new life recurring busi-ness in 2001.
In addition to the challengesabove, reinsurers will continue todeal with the Regulation XXX capi-tal requirements, and perhaps evena new valuation table. The impactthe new valuation table will haveon direct sales, and consequentlyreinsurance production, will bewatched very closely.
James L. Sweeney, FSA, MAAA, isexecutive vice president at MunichAmerican Reassurance in Atlanta,GA. He can be reached at [email protected].
David M. Bruggeman, FSA,MAAA, is an associate actuary atMunich American Reassurance inAtlanta, GA. He can be reached [email protected].
0
200
400
600
800
1000
1200
1400
1600
1800
U.S
. B
illio
ns
% Reinsured 13.7% 15.0% 19.5% 23.9% 31.3% 44.4% 54.2% 57.9% 61.8% 58.4%
Amt Retained 982 938 894 833 768 635 574 589 609 665
Amt Reinsured 156 166 216 261 350 507 679 811 985 933
1992 1993 1994 1995 1996 1997 1998 1999 2000 2001
Life Reinsurance In Force ($U.S. Millions)
United States Canadian Total
2000 2001 Change 2000 2001 Change 2000 2001 Change
Ordinary Life
Recurring 3,274,158 3,350,669 2.3% 200,377 224,427 12.0% 3,474,535 3,575,096 2.9%
Portfolio 364,337 864,448 137.3% 35,616 62,263 74.8% 399,953 926,711 131.7%
Retrocession 253,442 245,761 -3.0% 10,465 10,844 3.6% 263,907 256,605 -2.8%
Total Ordinary 3,891,937 4,460,878 14.6% 246.458 297,534 20.7% 4,138,395 4,758,412 15.0%
Total Group 110,737 144,391 30.4% 28,559 18,720 -34.5% 139,296 163,111 17.1%
Total Life 4,002,674 4,605,269 15.1% 275,017 316,254 15.0% 4,277,691 4,921,523 15.1%
U.S. Ordinary Individual Life Insurance Sales

Society of Actuaries475 North Martingale Road • Suite 800
Schaumburg, Illinois 60173Web site: www.soa.org
DON’T FORGET TO VOTE IN THE
SECTION COUNCIL ELECTION!
The Reinsurance Section has a fine
slate of candidates running for three-
year terms on the Section Council!
You can vote electronically from July 2
to August 2. (Voting information will
be e-mailed to you.) Be sure to cast
your vote and support a strong
Reinsurance Section Council!

Apply To Join Today!
SOCIETY OF ACTUARIES’
Reinsurance Section
Open to You!
Membership is only $10.00 annually and entitles you to:
• Reinsurance Section News, the Section newsletter, includes crammed with topical articles and the latest SOA activities
• Invitations to participate in Section social/networking events
• Mailing/e-mail communications announcing upcoming research, projects, continuing education events and other activities
Participation in the Reinsurance Section is no longer limited solely to members of the Society ofActuaries! The Section is now welcoming other actuaries and interested persons to participate in its activities.Applicants with interests in reinsurance areas relevant to the actuarial profession will be accepted for correspondentstatus. If you are interested in being considered for correspondent status, please complete the form below and submitwith a check for the processing fee. For those persons who are accepted, the processing fee will be applied to the first-year Section dues. Processing fees for applicants who are not accepted will not be returned.
Reinsurance Section Membership Application
Mail application and nonrefundable processing fee (by check payable to the Society of Actuaries) to:
Society of ActuariesAttn: Lois Chinnock, Reinsurance Section Staff Liaison475 N. Martingale Road, Suite 800Schaumburg, IL 60173-2226
______ YES! Enclosed is my $10.00 processing fee. I would like to be considered for correspondent status in the Reinsurance Section.
Name _________________________________________________________________________________________________________________
Organization _________________________________________ Current Position _______________________________________________
Reinsurance Involvement ______________________________________________________________________________________________
I am a member of the following organizations: __________________________________________________________________________
Mailing Address _______________________________________________________________________________________________________
City __________________________________________________ State/Province ________________________________________________
Country ______________________________________________ Zip/Postal Code _______________________________________________
Phone _______________________ E-mail address ______________________________ Fax ___________________________________