reinsurance & captives 2016 pac conference...risk adjusted pricing typically declined by 5% to 8...
TRANSCRIPT

Reinsurance & Captives 2016 PAC Conference
Energy Insurance Services, Inc. Breakout Session
Tuesday, October 25, 2016
Presenters and Topics
Robert Reader – Guy Carpenter Reinsurance Marketplace Using Catastrophe (Cat) Modeling to Develop
Effective Solutions
Mike Southers – SCOR Re Reinsurance Structures
Aggregate Specific
Page 1

Robert A. Reader
Robert is a Managing Director of Guy Carpenter & Company, LLC. in their Mission Viejo, CA office. He is a third generation insurance broker, with nearly 30 years of property and casualty underwriting and brokerage experience. Half of his career was spent at GE's reinsurance subsidiary, Employers Reinsurance Corporation, where Rob held underwriting, marketing, merger & acquisition and profit & loss center roles. While Rob has experience in most Property and Casualty lines, his greatest expertise is in casualty excess and umbrella solutions. At Guy Carpenter, Rob used his expertise to build over $1 billion of casualty limits annually for wildfire solutions for Southern California Edison and Sempra Energy. He has also worked on solutions for the Farmers Insurance Group, The California Earthquake Authority and several other regional insurance clients Rob has worked specifically with captives since the mid-1990s to obtain reinsurance limits and knows how to effectively place reinsurance limits behind captive solutions. Rob often speaks at industry conferences for energy companies and State captive associations on the subject of how reinsurance can be used to support insurance programs and captives. He has an MBA from the University of Southern California in Finance. Rob is married, has two daughters, and currently lives in Tustin Ranch, CA.
Page 2

Mike Southers
Mike joined SCOR in 2015, as an Assistant Vice President and leader of SCOR’s North American Captive Solutions group. Prior to joining SCOR, he spent eight years with Zurich’s Strategic Risk Solutions Group (SRS) designing and implementing complex insurance solutions for large corporate clients and their captives. He has worked with Risk Managers, Captive Managers and Brokers in a variety of industries including Energy, Healthcare, Pharmaceutical, Transportation, Retail, Manufacturing and Hi-Tech. In addition to developing customized Structured and multi-line / multi-year programs, he has also underwritten Excess Casualty, Marine, Security & Privacy, Professional Liability as well as other Management Liability Lines. He is a graduate of Temple University’s Fox School of Business Risk Management Program and has obtained is ARM designation.
Page 3
REINSURANCE MARKETPLACE
Page 4
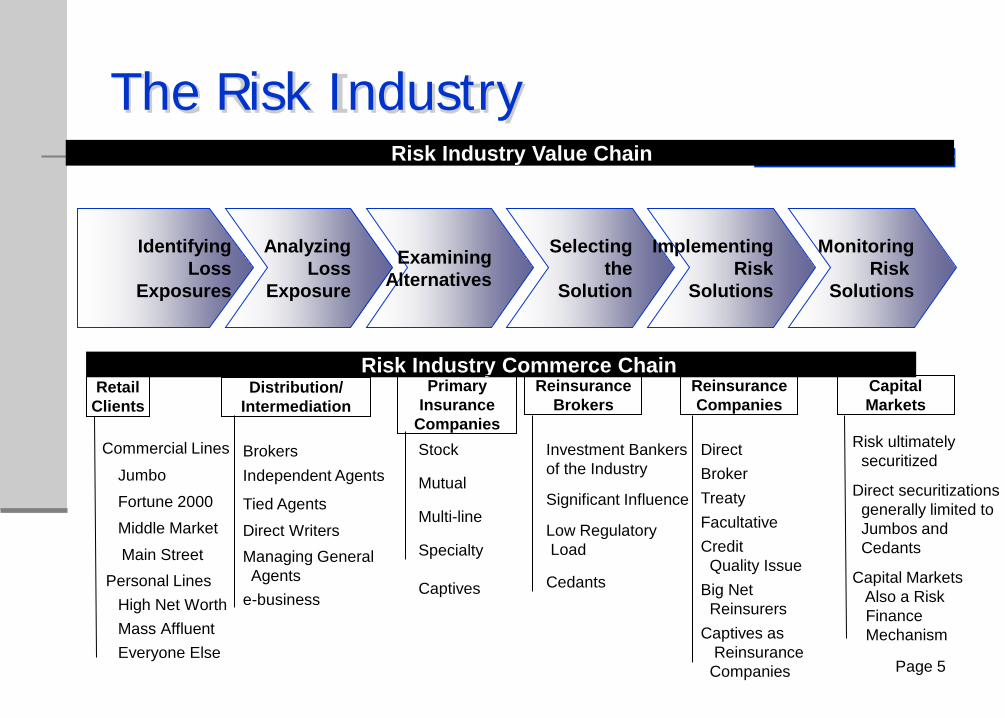
The Risk Industry
Page 5
Identifying Loss
Exposures
Risk Industry Commerce Chain
Risk Industry Value Chain
Analyzing Loss
Exposure
Examining Alternatives
Selecting the
Solution
Implementing Risk
Solutions
Monitoring Risk
Solutions
Primary Insurance
Companies Stock
Mutual
Multi-line
Specialty Captives
Reinsurance Brokers
Investment Bankers of the Industry
Significant Influence
Low Regulatory Load
Cedants
Reinsurance Companies
Direct
Treaty Facultative Credit Quality Issue
Broker
Big Net Reinsurers Captives as Reinsurance Companies
Capital Markets
Risk ultimately securitized
Capital Markets Also a Risk Finance Mechanism
Direct securitizations generally limited to Jumbos and Cedants
Independent Agents
Distribution/ Intermediation
Brokers
Tied Agents
Direct Writers Managing General Agents e-business
Retail Clients
Commercial Lines
Jumbo Fortune 2000
Personal Lines High Net Worth Mass Affluent Everyone Else
Middle Market
Main Street
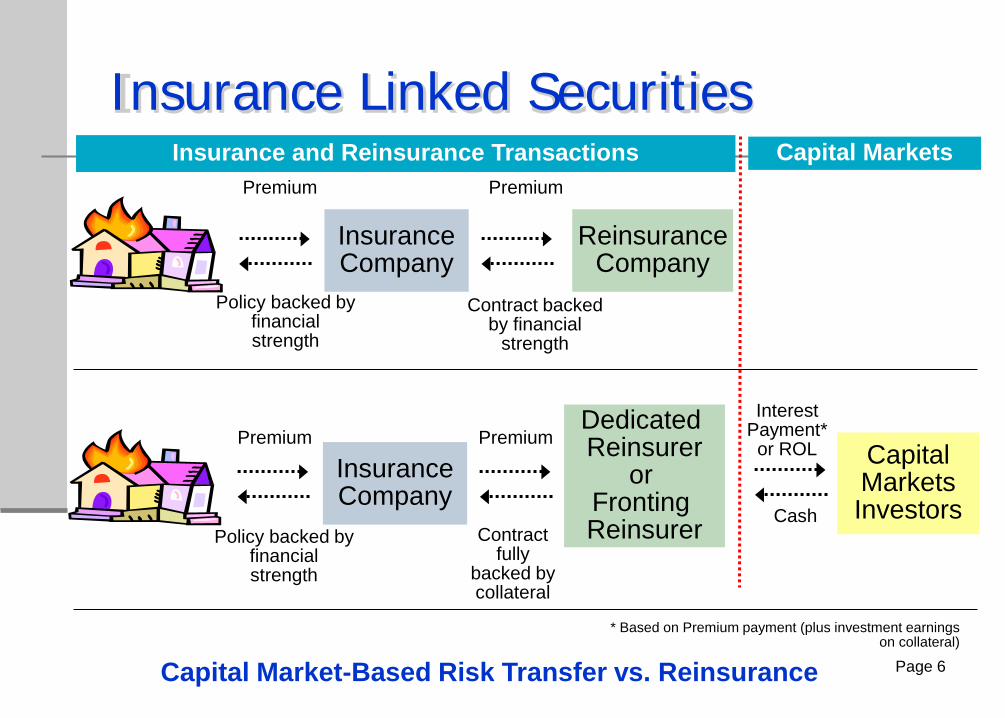
Insurance Linked Securities
Page 6
Premium
Insurance Company
Reinsurance Company
Policy backed by financial strength
Contract backed by financial
strength
Premium
Premium
Insurance Company
Dedicated Reinsurer
or Fronting Reinsurer
Policy backed by
financial strength
Contract fully
backed by collateral
Premium
Cash
Interest Payment*
or ROL Capital Markets Investors
* Based on Premium payment (plus investment earnings on collateral)
Insurance and Reinsurance Transactions Capital Markets
Capital Market-Based Risk Transfer vs. Reinsurance

Cost of Capital
Page 7
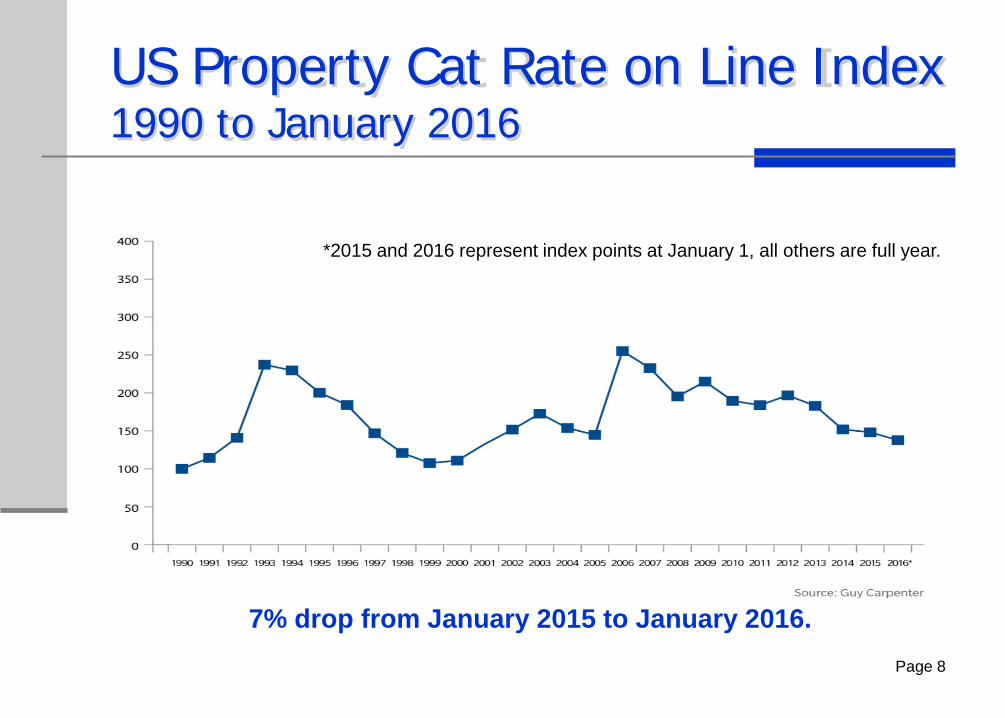
US Property Cat Rate on Line Index 1990 to January 2016
Page 8
7% drop from January 2015 to January 2016.
*2015 and 2016 represent index points at January 1, all others are full year.

Typical Risk Adjusted Pricing Changes
Risk adjusted pricing typically declined by 5% to 8% Page 9
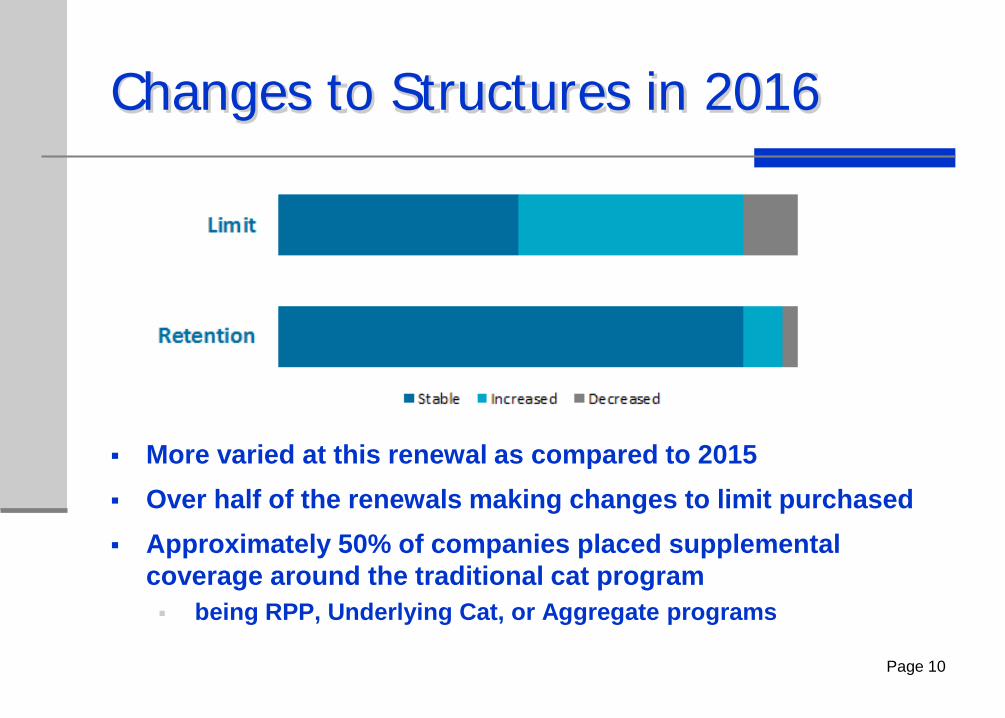
Changes to Structures in 2016
Page 10
More varied at this renewal as compared to 2015 Over half of the renewals making changes to limit purchased Approximately 50% of companies placed supplemental
coverage around the traditional cat program being RPP, Underlying Cat, or Aggregate programs

CATASTROPHE MODELING: DEVELOPING EFFECTIVE SOLUTIONS
Page 11
GUY CARPENTER
(CAT) MODELING
12
GUY CARPENTER
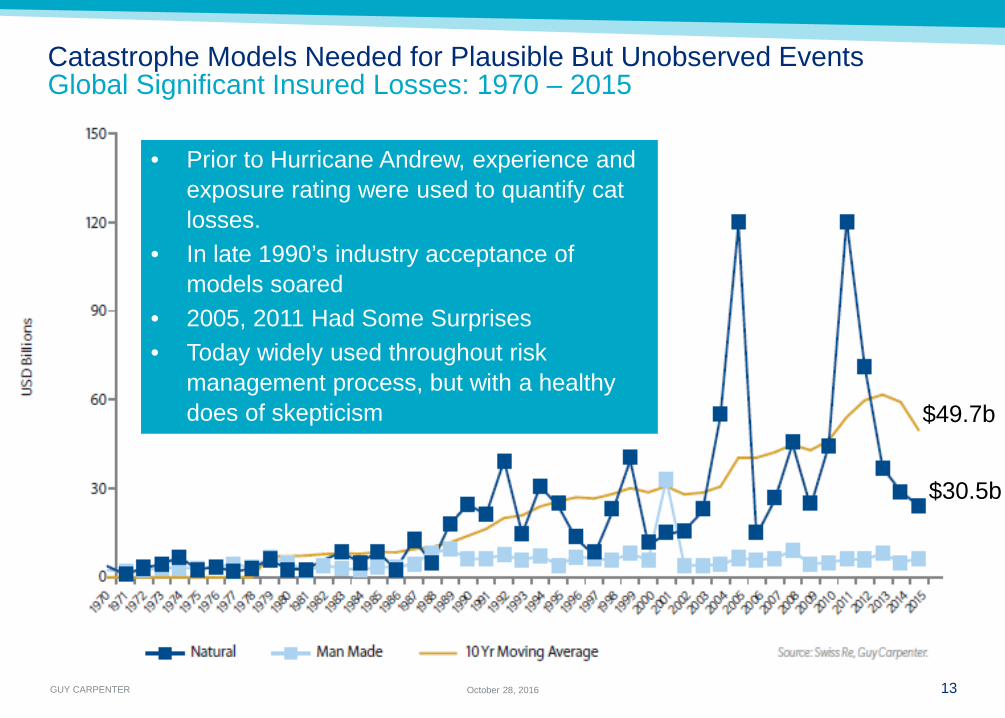
Catastrophe Models Needed for Plausible But Unobserved Events Global Significant Insured Losses: 1970 – 2015
13 October 28, 2016
$49.7b
$30.5b
• Prior to Hurricane Andrew, experience and exposure rating were used to quantify cat losses.
• In late 1990’s industry acceptance of models soared
• 2005, 2011 Had Some Surprises • Today widely used throughout risk
management process, but with a healthy does of skepticism

GUY CARPENTER 14 October 28, 2016
What Perils Are of Interest? Natural, Man-Made, Non-Modeled
• Hurricane – Storm Surge
• Severe Storm – Tornado – Hail – Wind
• Earthquake – Fire Following Earthquake – Sprinkler Leakage
• Flood (early stages)
• Winter Storm
• Wildfire
• Crop Hail
• Infectious Disease
• Terrorism
• Tsunami
• Volcano
Natural Perils
Man Made Perils
Non Modeled (no vendor)

GUY CARPENTER 15
Cat Risk Management Common Uses
$100M x $25M
• Program structure • Cost benefit analysis / pricing
Reinsurance
• Rate development • Individual risks
Underwriting
• Growth • Optimization • Allocation • Accumulation identification
Portfolio Management
• Regulatory (State and Federal) • Rating Agency (AM Best, etc.)
Regulatory
• Early warning • Fraud detection • Adjuster deployment
Claims

GUY CARPENTER
Cat Risk Management Current Thinking
16 October 28, 2016
• Model Uncertainty – Understood and accepted – Leads to a focus on accumulation
(not probabilistic modeling) for several perils such as tornado/hail and wildfire
• Many insurers adopt a management view of risk – Commercially available models are
just a starting point – Challenging the status quo – Model customization, blending,
governance
• Affect of model change on reinsurance pricing is dwindling, which can trickle down into primary rates
GUY CARPENTER 17
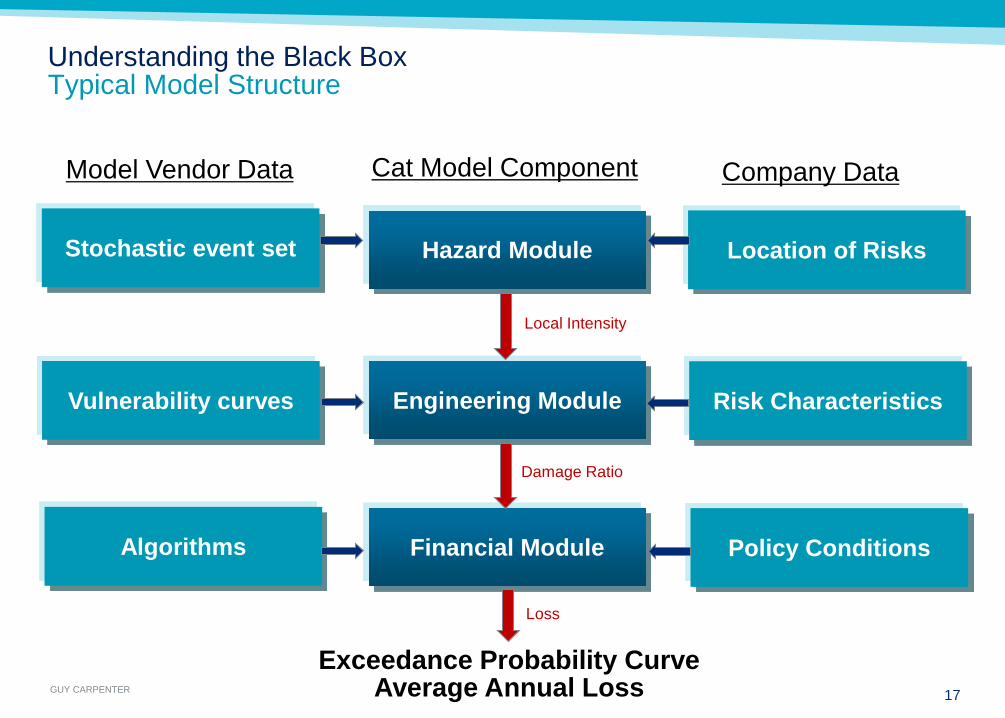
Understanding the Black Box Typical Model Structure
Algorithms
Hazard Module
Policy Conditions
Location of Risks
Financial Module
Engineering Module Vulnerability curves Risk Characteristics
Stochastic event set
Model Vendor Data Company Data Cat Model Component
Exceedance Probability Curve Average Annual Loss
Local Intensity
Damage Ratio
Loss

GUY CARPENTER 18 October 28, 2016
Hazard frequency/severity Calibrated to available scientific datasets Adapt to evolving science with each development cycle Example: Hurricane peril
• Landfall location • Maximum sustained wind • Radius of maximum wind • Wind footprint • Track angle • Local geography • Storm surge • Frequency (How often?)
Understanding the Black Box Hazard Module
Site Intensity Hurricane: Site Wind Speed Earthquake: Ground Motion
Tornado/ Hail: Event Intensity
GUY CARPENTER 19 October 28, 2016
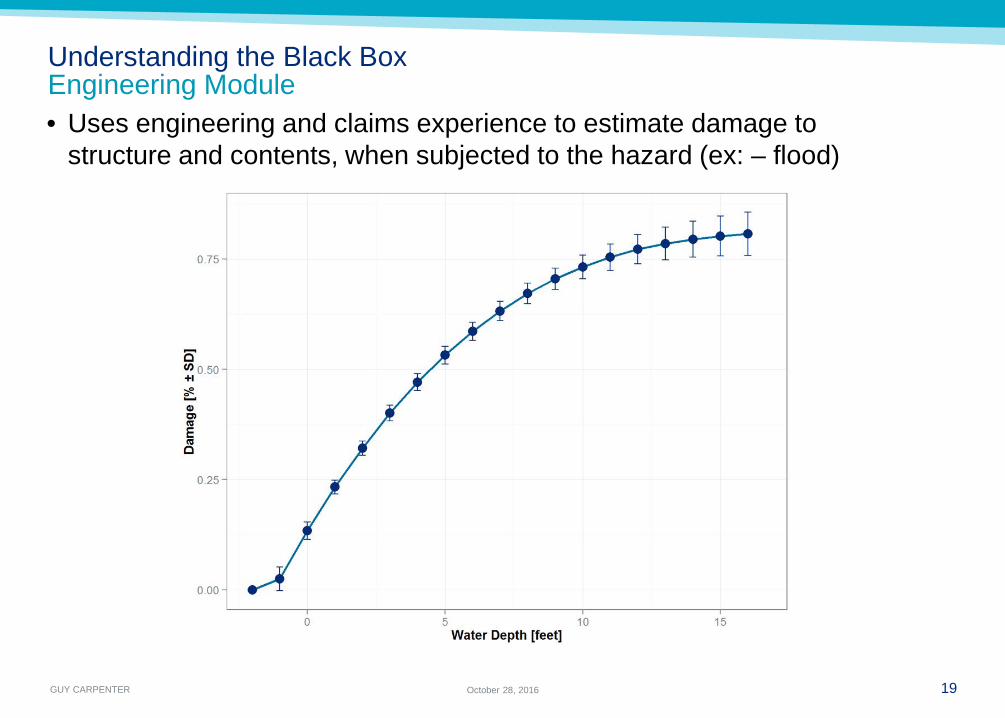
Understanding the Black Box Engineering Module • Uses engineering and claims experience to estimate damage to
structure and contents, when subjected to the hazard (ex: – flood)
GUY CARPENTER 20 October 28, 2016
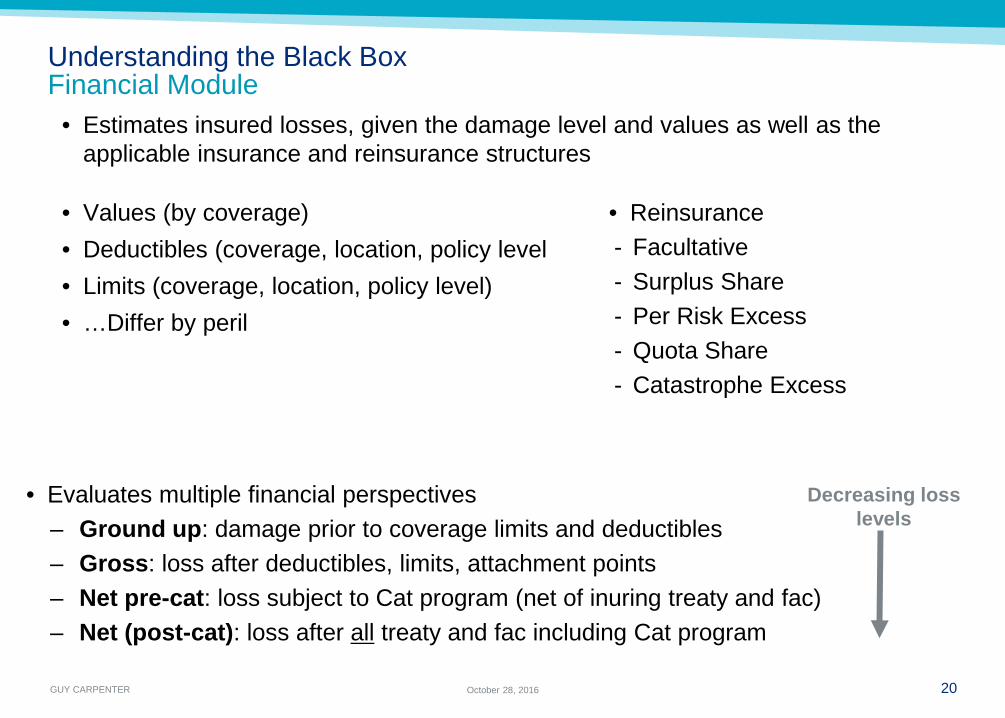
Understanding the Black Box Financial Module
• Estimates insured losses, given the damage level and values as well as the applicable insurance and reinsurance structures
• Values (by coverage) • Deductibles (coverage, location, policy level • Limits (coverage, location, policy level) • …Differ by peril
• Reinsurance - Facultative - Surplus Share - Per Risk Excess - Quota Share - Catastrophe Excess
• Evaluates multiple financial perspectives – Ground up: damage prior to coverage limits and deductibles – Gross: loss after deductibles, limits, attachment points – Net pre-cat: loss subject to Cat program (net of inuring treaty and fac) – Net (post-cat): loss after all treaty and fac including Cat program
Decreasing loss levels
GUY CARPENTER 21 October 28, 2016
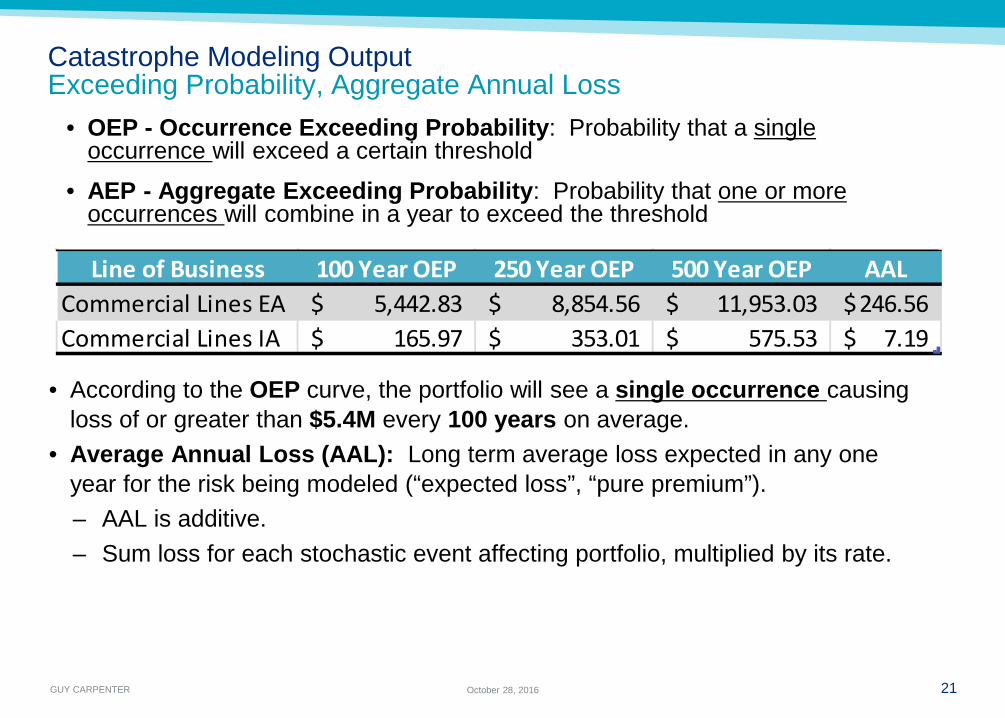
Catastrophe Modeling Output Exceeding Probability, Aggregate Annual Loss
• OEP - Occurrence Exceeding Probability: Probability that a single occurrence will exceed a certain threshold
• AEP - Aggregate Exceeding Probability: Probability that one or more occurrences will combine in a year to exceed the threshold
• According to the OEP curve, the portfolio will see a single occurrence causing loss of or greater than $5.4M every 100 years on average.
• Average Annual Loss (AAL): Long term average loss expected in any one year for the risk being modeled (“expected loss”, “pure premium”). – AAL is additive. – Sum loss for each stochastic event affecting portfolio, multiplied by its rate.
Line of Business 100 Year OEP 250 Year OEP 500 Year OEP AALCommercial Lines EA 5,442.83$ 8,854.56$ 11,953.03$ 246.56$ Commercial Lines IA 165.97$ 353.01$ 575.53$ 7.19$
GUY CARPENTER
EARTHQUAKE
22
Example

GUY CARPENTER 23
Analytics USGS Seismic Hazard Maps Update
• Includes new methods, models, and data obtained since last update in 2008
• Modifications to seismic source and ground motion inputs indicate changes of plus or minus 20% over wide areas
• Generalizations difficult to make and local areas may see larger changes
• California Insights – Discovery of new faults in San Jose, Vallejo,
San Diego lead to increased hazard – Hazards in parts of San Francisco Bay and Los
Angeles increased, while decrease was seen in other parts of these areas.
– Researchers decreased threat estimates for Irvine, Santa Barbara and Oakland due to new research
Source: USGS Open File Report
2008
2014
GUY CARPENTER
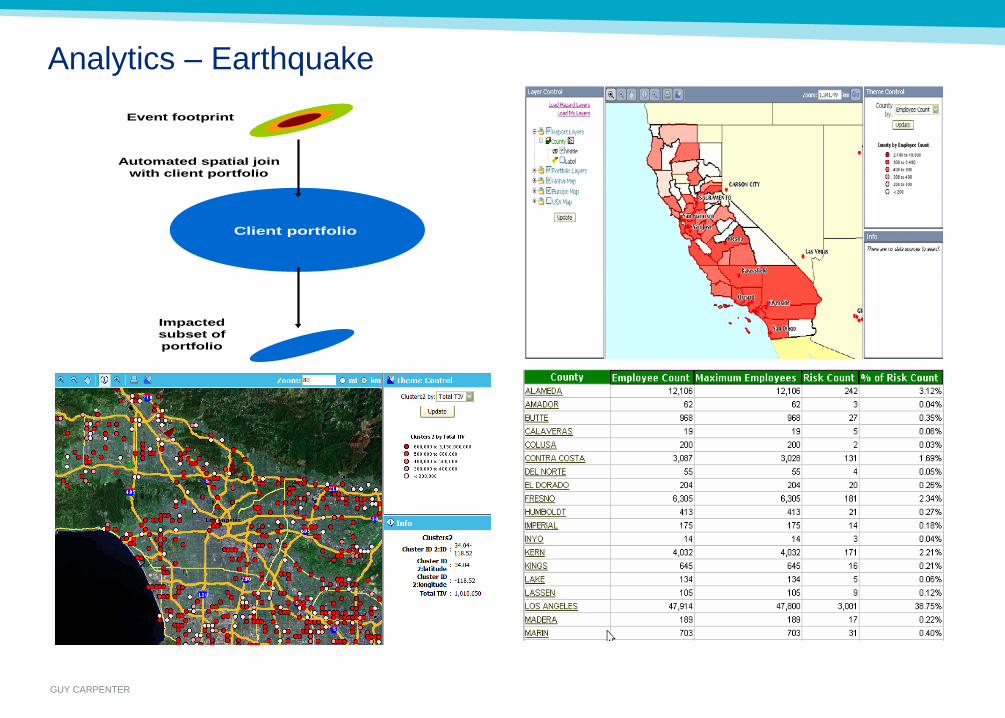
Analytics – Earthquake
Automated spatial join with client portfolio
Client portfolio
Impacted subset of portfolio
Event footprint

GUY CARPENTER
WILDFIRE
25
Example

GUY CARPENTER 26 October 28, 2016
• Soberanes Fire • 43,400 acres burned • 57 structures destroyed
• Sand Fire • 41,430 acres burned • 20 structures destroyed
Analytics Wildfire
• Wildfire has become a serious issue for insurers for both California risks and non California risks
• Less developed area of modeling
• Currently Available Analyses – Probabilistic modeling for California
via Corelogic and AIR, with an RMS wildfire model on the horizon and expansion to other states.
– Annual Burn Probability analysis for key concentrations in high risk areas
– Experience rating – Deterministic scenarios – GC probabilistic modeling using
USFS data (under development)

GUY CARPENTER
Analytics Deterministic vs. Probabilistic Deterministic
Using a historic fire loss to describe a future fire loss scenario in the same or alternate area
Probabilistic
Estimating the likelihood of a loss scenario and resulting damage over a multi-year simulation
Historic Fire #1
Future Fire #2
Property Damage (Building, Contents, Loss of Use) AND Attritional Losses AND Fire Suppression CostsReturn Period 1K Buffer 5k Buffer 10k Buffer 15k Buffer 20k Buffer
4 1,009,063 1,152,703 1,326,470 1,424,452 1,390,000 5 3,697,400 4,666,181 5,851,437 6,470,450 6,105,264
10 35,864,332 52,750,500 68,605,909 75,826,710 74,654,381 20 101,678,500 198,290,450 354,048,698 457,428,150 488,585,000 50 397,935,727 862,923,600 1,725,516,480 2,392,784,577 2,633,764,674
100 799,233,895 1,784,521,442 3,263,493,431 4,446,731,348 4,996,690,224 200 1,557,582,272 2,824,908,849 4,959,341,311 6,561,409,884 7,187,754,963 250 1,883,401,350 3,222,297,902 5,563,219,172 7,177,727,884 7,855,322,040 500 2,497,561,919 4,292,582,739 7,199,920,960 9,441,327,143 11,256,333,085
1000 3,504,225,874 5,601,844,840 8,880,096,853 13,804,559,194 16,517,661,349 10000 7,118,738,803 13,111,565,727 21,846,310,300 24,665,700,114 32,997,598,171
Territory Simulated Fires
Large Occurrence Modeled $ Loss
Privileged & Confidential
GUY CARPENTER
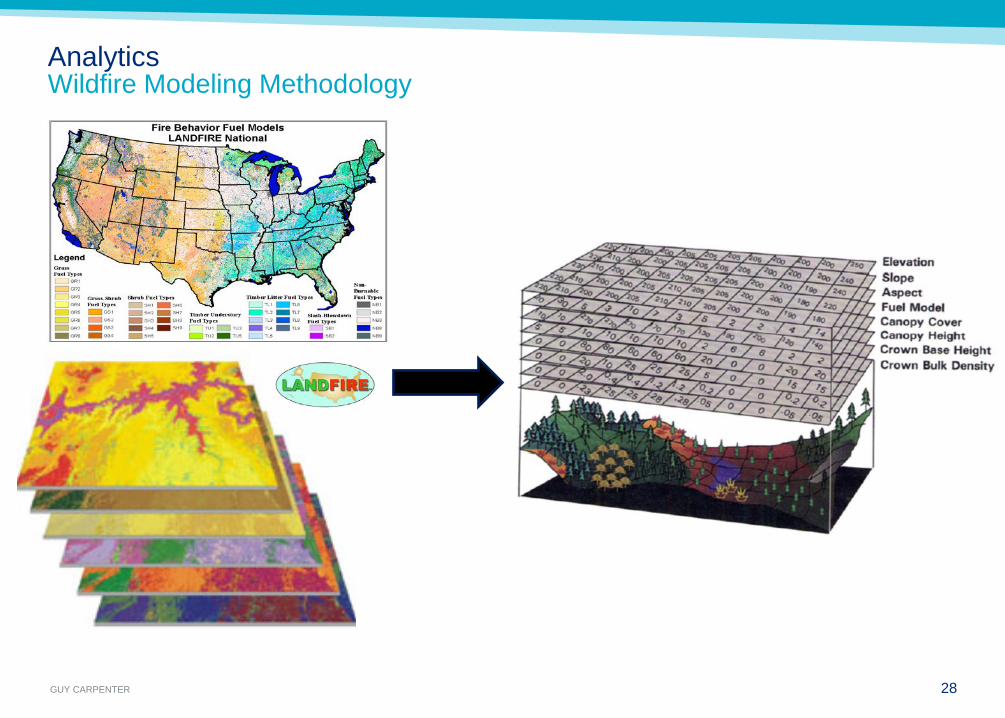
Analytics Wildfire Modeling Methodology
28
GUY CARPENTER
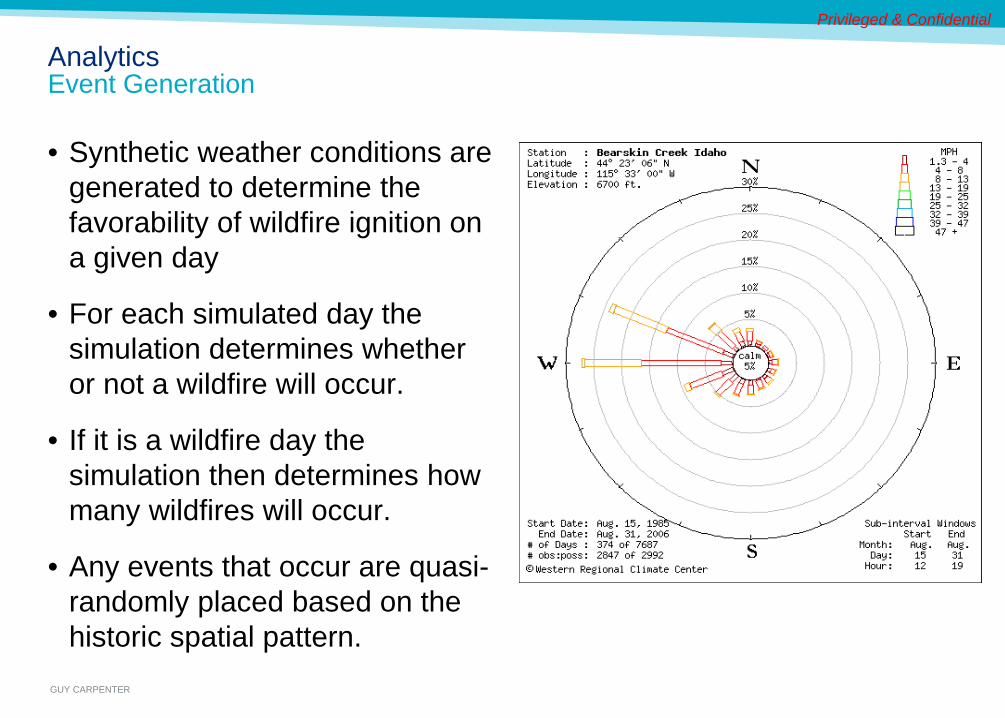
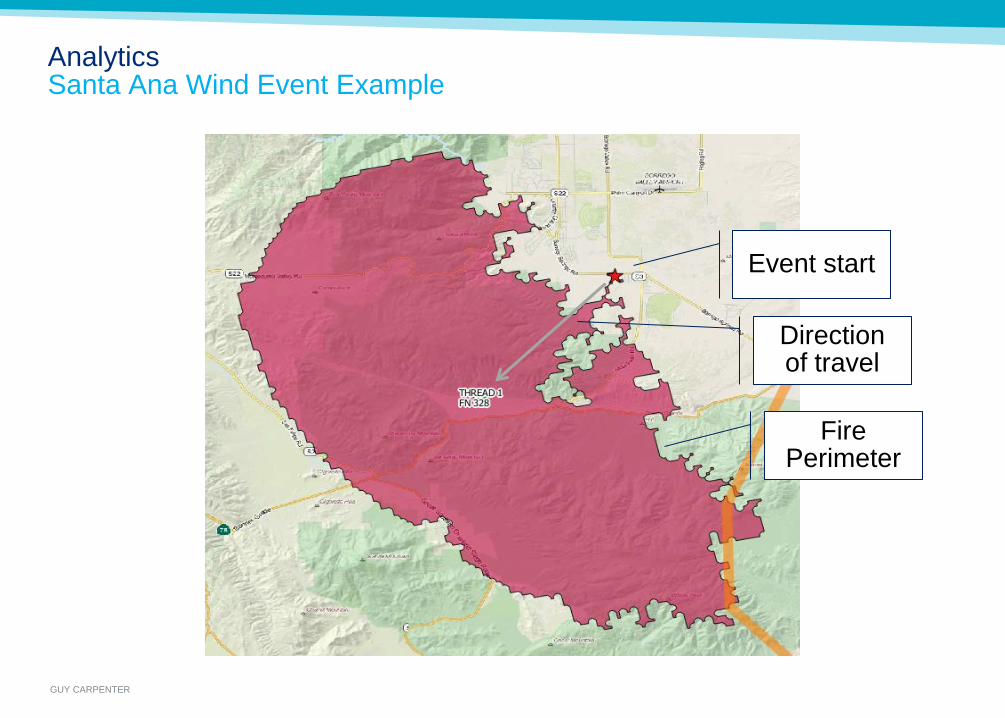
Analytics Event Generation
• Synthetic weather conditions are generated to determine the favorability of wildfire ignition on a given day
• For each simulated day the simulation determines whether or not a wildfire will occur.
• If it is a wildfire day the simulation then determines how many wildfires will occur.
• Any events that occur are quasi-randomly placed based on the historic spatial pattern.
Privileged & Confidential
GUY CARPENTER
Analytics Santa Ana Wind Event Example
Event start
Fire Perimeter
Direction of travel
GUY CARPENTER
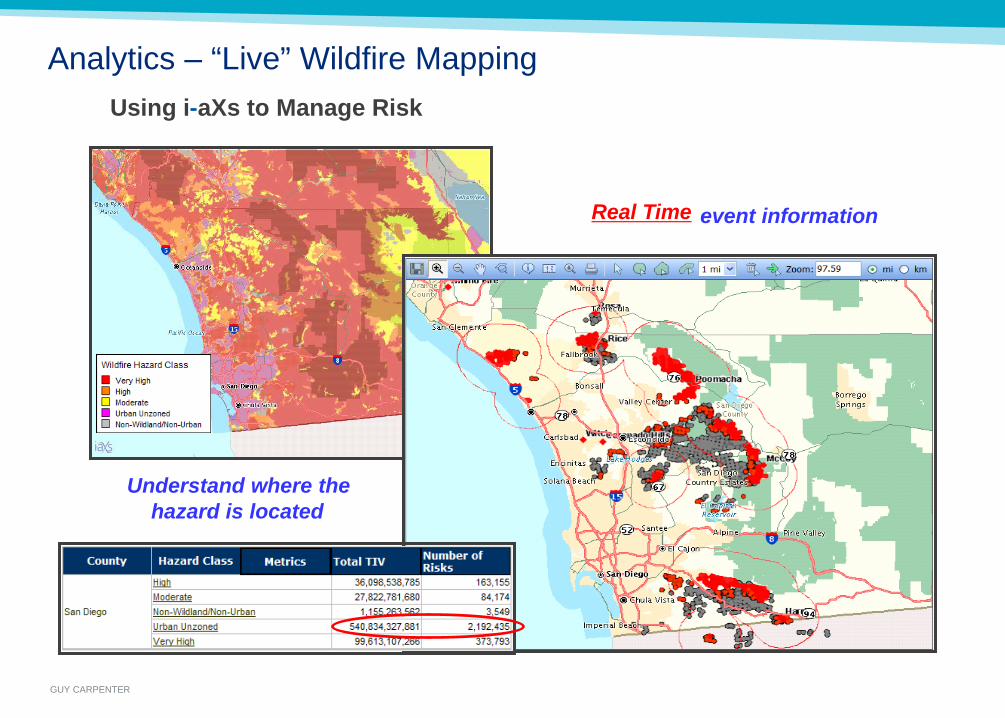
Analytics – “Live” Wildfire Mapping Using i - aXs to Manage Risk
Understand where the hazard is located
Real Time event information

GUY CARPENTER
1K Buffer 5k Buffer 10k Buffer 15k Buffer 20k Buffer1,082,061 1,309,658 1,500,224 1,556,953 1,637,312 3,954,949 5,432,169 6,470,450 7,055,018 7,394,800
37,792,422 55,759,582 72,498,431 79,508,000 81,801,500 107,030,000 211,891,600 359,710,426 458,659,780 513,548,465 421,487,822 889,801,550 1,791,503,674 2,425,189,565 2,790,296,924 842,785,785 1,822,269,501 3,348,573,365 4,481,996,785 5,251,599,795
1,674,373,150 2,848,055,595 5,093,280,858 6,544,310,623 7,439,623,788 1,943,776,792 3,257,117,500 5,597,601,173 7,130,581,850 8,140,528,353 2,690,824,565 4,362,414,874 7,193,237,097 9,354,890,977 12,100,728,400 3,694,420,773 6,283,015,450 8,994,097,960 13,576,150,279 17,147,133,047
12,103,673,734 16,336,990,818 21,638,700,818 25,236,575,900 34,582,248,387 39,017,400 70,171,855 121,537,307 161,128,388 187,921,156
303,781,208 462,094,503 739,229,068 982,105,952 1,195,790,620
Aggregate Losses
Modeled Output Multiple Expected Probability (EP) Curves Possible
Initial Loss Estimates Based Upon Return Period and Buffer Distance from Fire Origin
Multiple curves based on the radius of non-Santa Ana wind events to consider: 1k, 5k, 10k, 15k, 20k Loss EP Curves combine large fire losses with attritional losses
Return Period45
102050
100200250500
100010000
AALStDev.St.Dev.
GUY CARPENTER
WINDSTORM
33
Example

GUY CARPENTER
Analytics – Windstorm
GUY CARPENTER
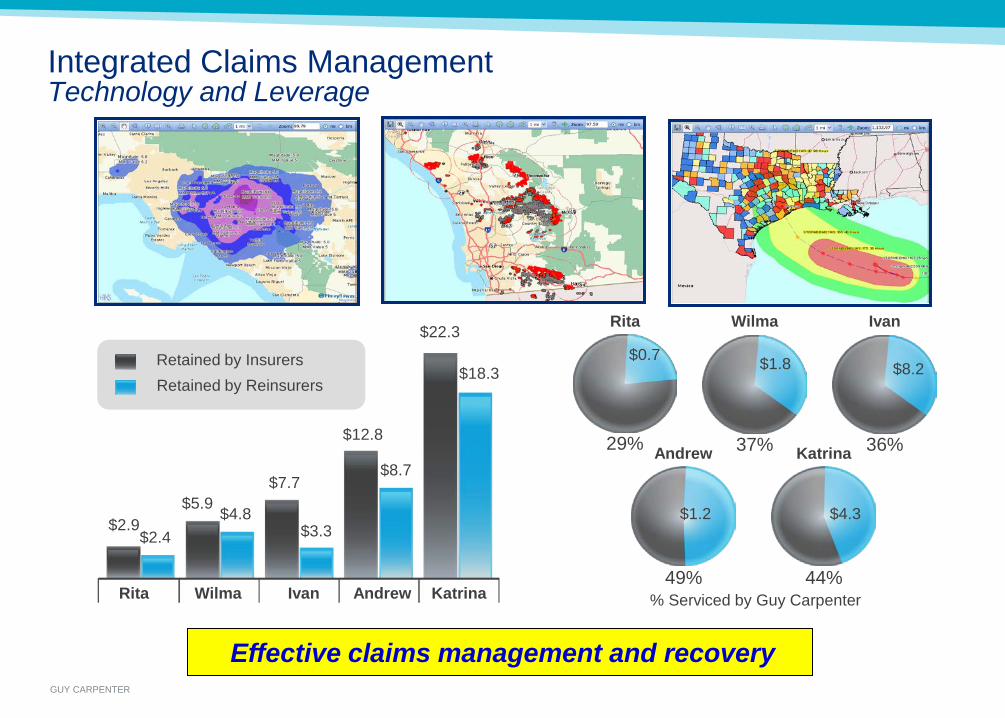
Effective claims management and recovery
29%
Rita
37%
Wilma
36%
Ivan
49%
Andrew
44%
Katrina
$22.3
$2.9 $2.4
$5.9 $4.8
$3.3
$8.7
$18.3
$7.7
$12.8
Rita Wilma Ivan Andrew Katrina
Retained by Reinsurers Retained by Insurers
% Serviced by Guy Carpenter
$0.7 $1.8 $8.2
$4.3 $1.2
Integrated Claims Management Technology and Leverage
GUY CARPENTER
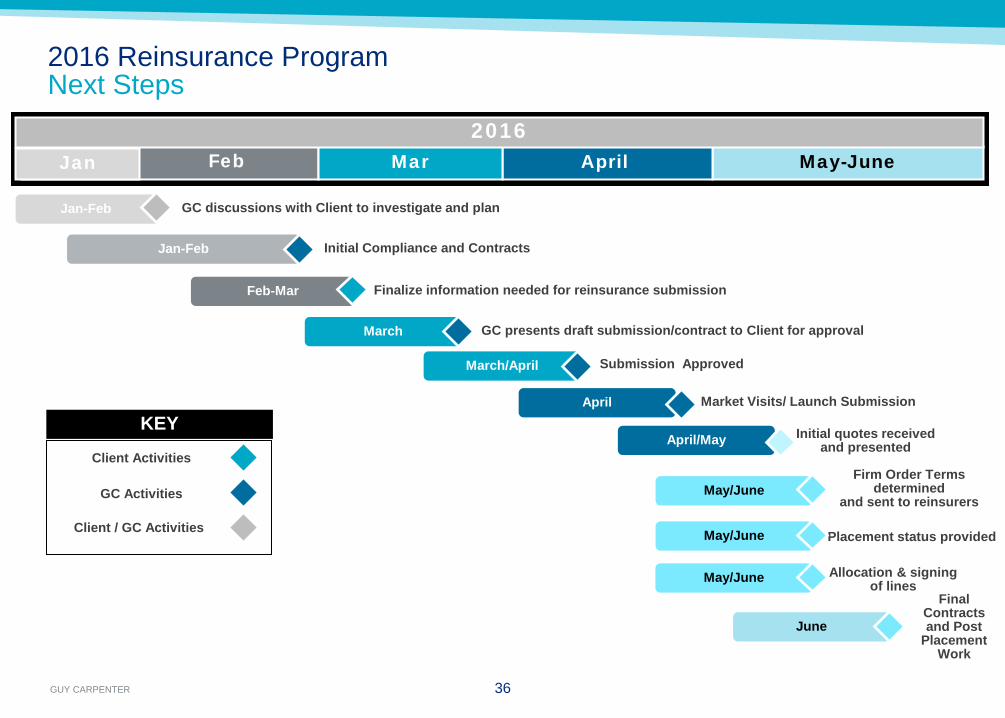
2016 Reinsurance Program Next Steps
36
KEY
Client Activities
GC Activities
Client / GC Activities
May-June April Mar 2016
May/June Final
Contracts and Post
Placement Work
Allocation & signing of lines
June
Firm Order Terms determined
and sent to reinsurers
Jan Feb
GC discussions with Client to investigate and plan
Initial quotes received and presented
Finalize information needed for reinsurance submission Feb-Mar
GC presents draft submission/contract to Client for approval March
Jan-Feb
March/April Submission Approved
Placement status provided
Jan-Feb Initial Compliance and Contracts
36
April/May
May/June
May/June
April Market Visits/ Launch Submission
GUY CARPENTER 37
Disclaimer
Guy Carpenter & Company, LLC provides this report for general information only. The information contained herein is based on sources we believe reliable, but we do not guarantee its accuracy, and it should be understood to be general insurance/reinsurance information only. Guy Carpenter & Company, LLC makes no representations or warranties, express or implied. The information is not intended to be taken as advice with respect to any individual situation and cannot be relied upon as such. Please consult your insurance/reinsurance advisors with respect to individual coverage issues.
Statements concerning tax, accounting, legal or regulatory matters should be understood to be general observations based solely on our experience as reinsurance brokers and risk consultants, and may not be relied upon as tax, accounting, legal or regulatory advice, which we are not authorized to provide. All such matters should be reviewed with your own qualified advisors in these areas.
Readers are cautioned not to place undue reliance on any historical, current or forward-looking statements. Guy Carpenter & Company, LLC undertakes no obligation to update or revise publicly any historical, current or forward-looking statements, whether as a result of new information, research, future events or otherwise.
This document or any portion of the information it contains may not be copied or reproduced in any form without the permission of Guy Carpenter & Company, LLC, except that clients of Guy Carpenter & Company, LLC need not obtain such permission when using this report for their internal purposes.
The trademarks and service marks contained herein are the property of their respective owners.
GUY CARPENTER
www.guycarp.com
Privileged & Confidential
GUY CARPENTER
APPENDIX
39

GUY CARPENTER
SEVERE CONVECTIVE STORM (TORNADO)
40
Example

GUY CARPENTER 41 October 28, 2016
Analytics Severe Convective Models
• Tornadoes are small, rare events ~ 1 in 1-Billion / sq ft / year (OK) ~ 1 in 1,200 / sq mile / year (OK)
• Low risk does not mean zero risk.
• Difficult to balance all of these aspects of SCS modeling.
• Stochastic track density versus practical run time is tough balance.
• RMS, AIR. Different approaches, upgrades.
• Recalibration of RMS 13.1, rebuild of AIR Touchstone 2.0. Both use 2011 data. Perceived improvement in tails.
• Expanding population base and increasing property value increased exposure.
• Increasing loss trend due to increased exposure alone.
Joplin Damage Swath (NWS/NOAA)
Andrew Windfield (HURDAT)
GUY CARPENTER
FLOOD & STORM SURGE
42
Example

GUY CARPENTER
Analytics Flood
43
Flood Locations 1985 - 2015
First vendor inland flood model recently released. Very complex (elevation, precipitation, land use, resolution).
GUY CARPENTER 44
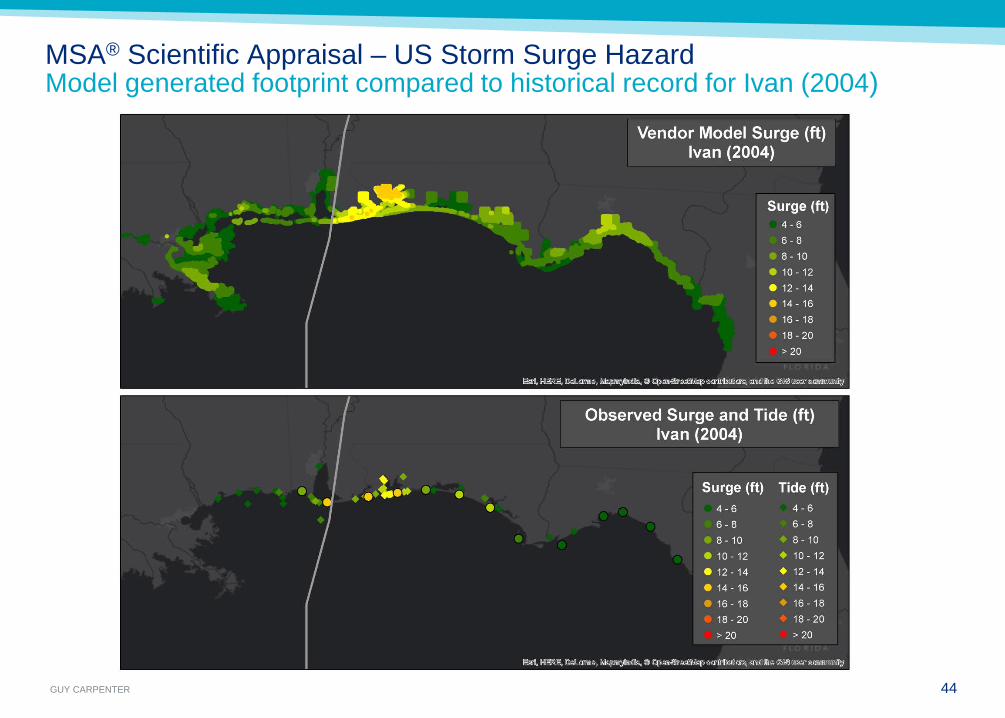
MSA® Scientific Appraisal – US Storm Surge Hazard Model generated footprint compared to historical record for Ivan (2004)
GUY CARPENTER
REINSURANCE STRUCTURES
Page 45

GUY CARPENTER
SCOR Captive Solutions – What types of solutions can we provide?
– Mono & multiline stop loss protection
– Multi-line & multi-year capacity
– Retention buy down & risk financing
– Multi trigger & parametric coverage
– Swing Program
– Buffer Layer Programs
– Diversification solutions for captives
– Earnings volatility protection on SIR losses
– Retention optimisation
– Loss of earnings triggered by non-damage
events
– Emerging & Non-Traditional Risks
solutions
mechanisms
GUY CARPENTER
What does it take to secure a successful deal?
Be as transparent as possible
– Clearly defined motive and goal
– Have a proposed structure in mind (limits, retention, Lines of Business,
etc…)
– Meet with the markets and be available for continued dialogue
throughout the process
– Assign an individual to architect or “quarterback” the deal from the
buyers side
– Have a timeframe that is sufficient and flexible to accomplish the goals
– Have a budget and share with the markets
GUY CARPENTER
What is the process?
High Level Process:
‒ Know your needs and motivation
‒ Have initial meeting with the carriers
‒ Timely respond to carrier informational requirements
‒ Understand the potential structures
‒ Modeling and Pricing followed by carrier indications
‒ Insured-broker feedback and perhaps further meetings / negotiation
‒ Carrier formalizes proposal with wording
‒ Coverage is bound and
All deals are different and the exact process will vary
GUY CARPENTER
What information do the markets need?
Informational requirements:
‒ Individual line of business submission used in the traditional insurance
market
‒ Loss history 5 to 10 years (possibly more for more esoteric coverages)
‒ Description of Insured’s Risk & Insurance Management Team
‒ Details on any relevant Risk Control procedures or mechanism
‒ Proposed Structure (Limits, Retention, LOB’s, budget)
‒ Actuarial analysis if available
‒ Audited Financials (if not public)

GUY CARPENTER
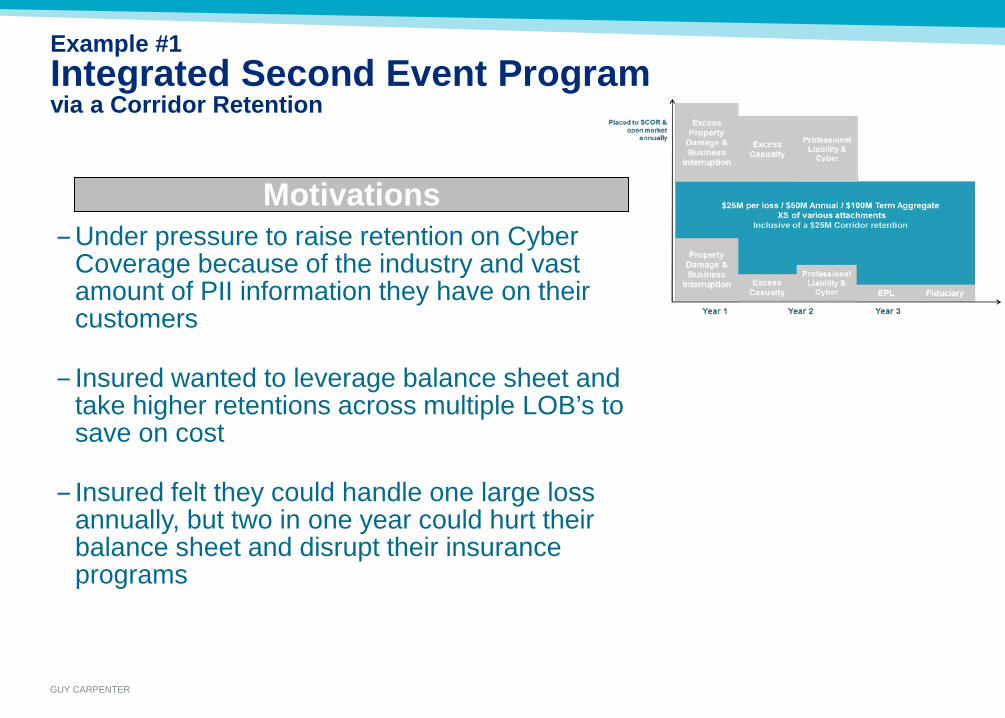
Example #1 Integrated Second Event Program via a Corridor Retention
GUY CARPENTER
Example #1 Integrated Second Event Program via a Corridor Retention
‒Under pressure to raise retention on Cyber Coverage because of the industry and vast amount of PII information they have on their customers
‒ Insured wanted to leverage balance sheet and take higher retentions across multiple LOB’s to save on cost
‒ Insured felt they could handle one large loss annually, but two in one year could hurt their balance sheet and disrupt their insurance programs
Motivations
GUY CARPENTER
Example #1 Integrated Second Event Program via a Corridor Retention
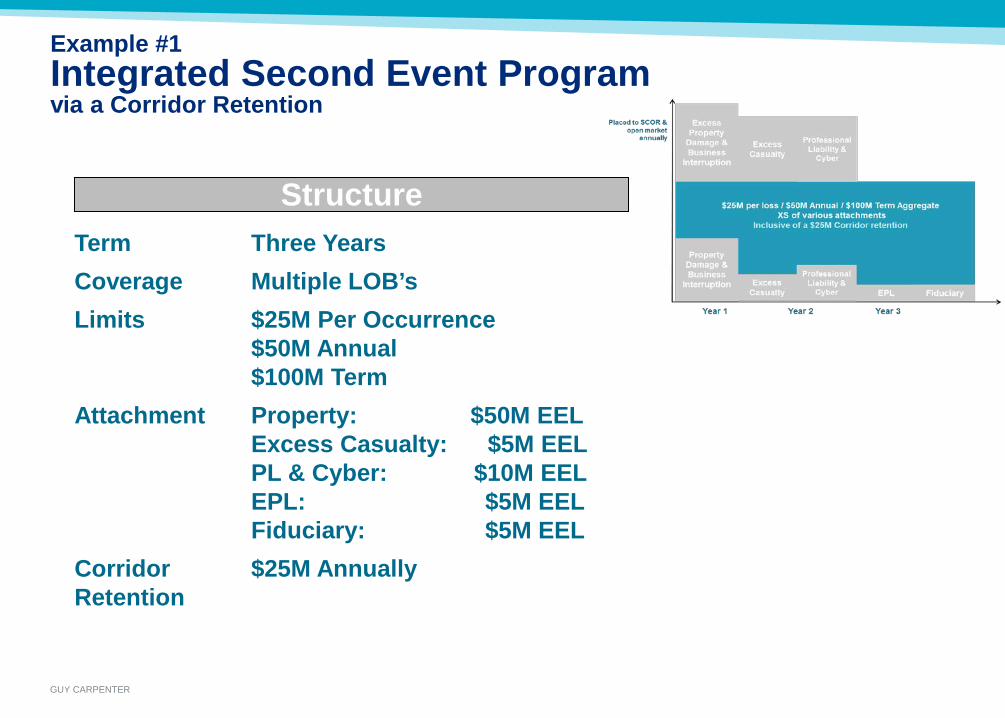
Structure Term Three Years Coverage Multiple LOB’s Limits $25M Per Occurrence
$50M Annual $100M Term
Attachment Property: $50M EEL Excess Casualty: $5M EEL PL & Cyber: $10M EEL EPL: $5M EEL Fiduciary: $5M EEL
Corridor Retention
$25M Annually

GUY CARPENTER
Example #1 Integrated Second Event Program via a Corridor Retention
‒Able to assume more risk with protection from a 2nd event
‒Saved considerable premium from raising their cyber retention to $30M
‒More dynamic use of their retention which can now respond to multiple LOB’s
‒Administrative efficiencies through a multi-line multi-year program
Key Benefits

GUY CARPENTER
Example #1 Integrated Second Event Program via a Corridor Retention
Loss Scenarios
Scenario Ground-Up Losses Program Losses
1 $100M property & $50M cyber – same year
$25M
2 $80M property & $25M cyber – same year
$15M
3 $55M property / $25M cyber & $20M XS Casualty – same year
$10M
4 Two $75M property – same year
$25M
GUY CARPENTER
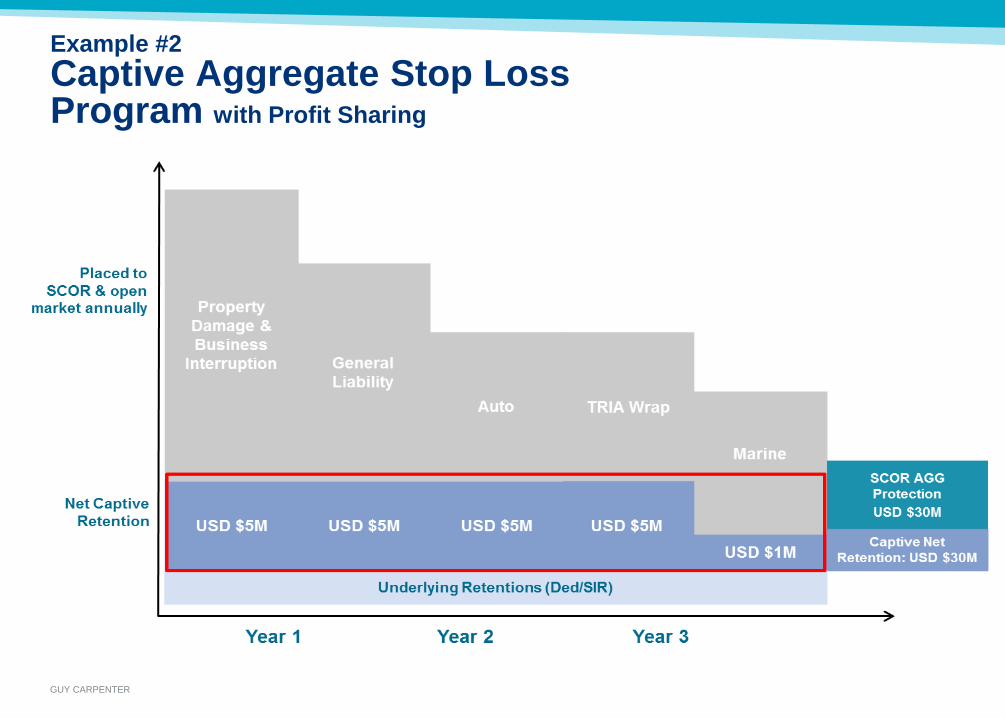
Example #2 Captive Aggregate Stop Loss Program with Profit Sharing
GUY CARPENTER
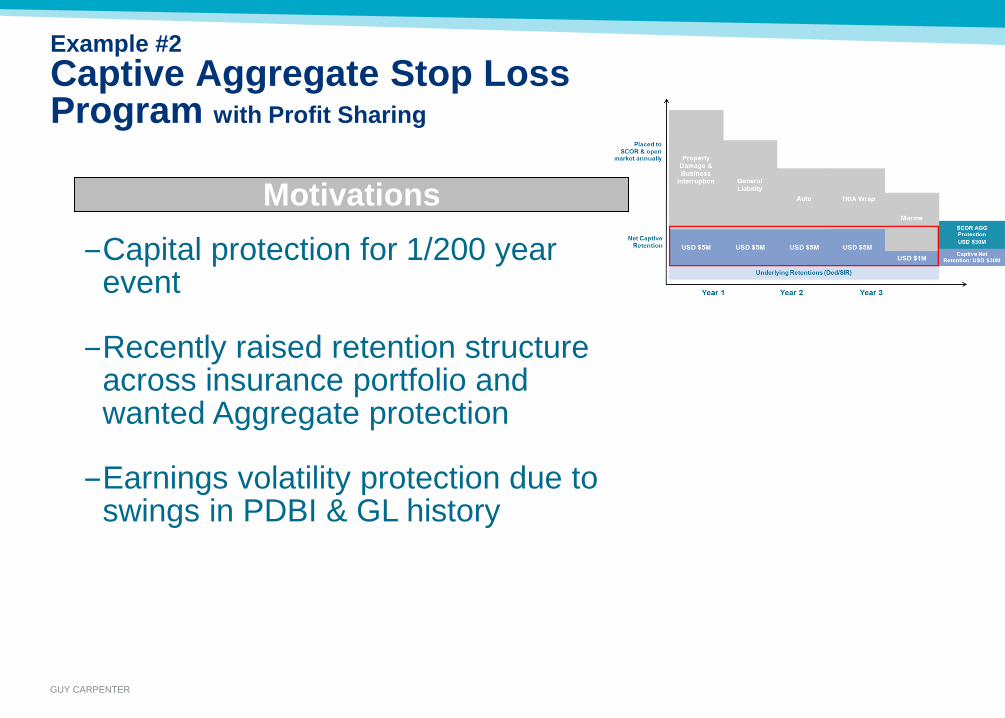
Example #2 Captive Aggregate Stop Loss Program with Profit Sharing
Motivations ‒Capital protection for 1/200 year
event
‒Recently raised retention structure across insurance portfolio and wanted Aggregate protection
‒Earnings volatility protection due to swings in PDBI & GL history
GUY CARPENTER
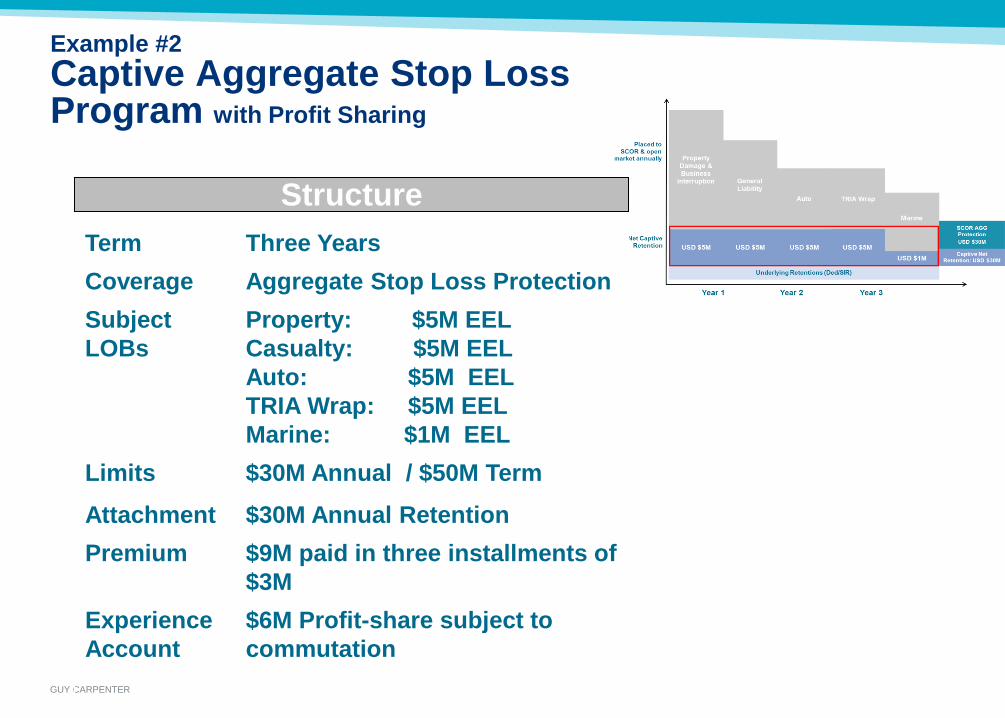
Example #2 Captive Aggregate Stop Loss Program with Profit Sharing
Structure Term Three Years Coverage Aggregate Stop Loss Protection Subject LOBs
Property: $5M EEL Casualty: $5M EEL Auto: $5M EEL TRIA Wrap: $5M EEL Marine: $1M EEL
Limits $30M Annual / $50M Term
Attachment $30M Annual Retention Premium $9M paid in three installments of
$3M Experience Account
$6M Profit-share subject to commutation
GUY CARPENTER
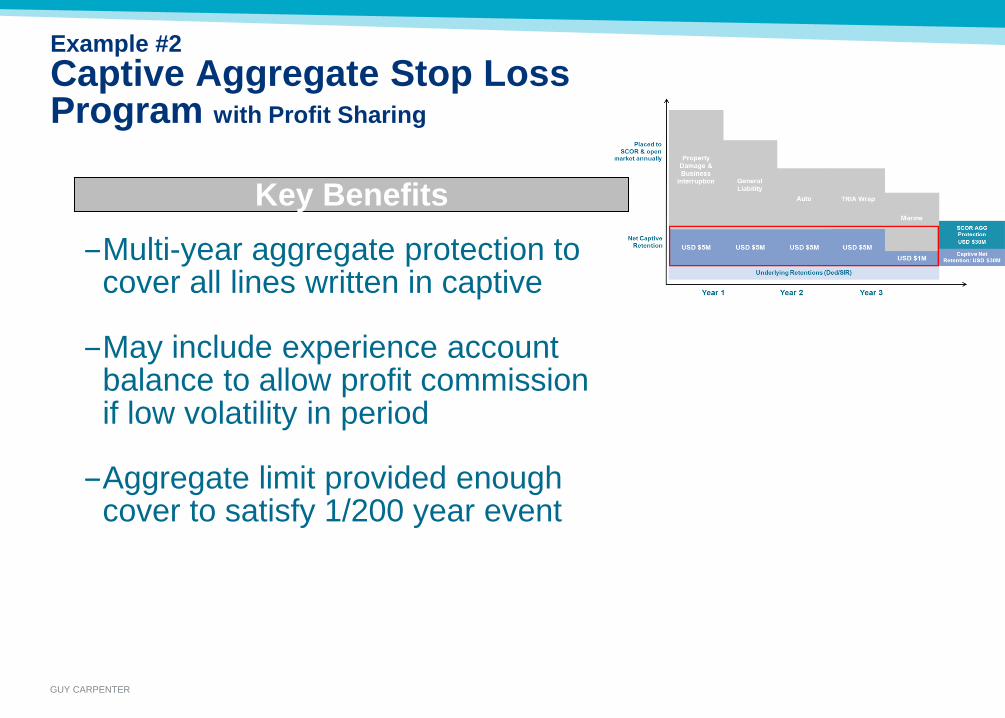
Example #2 Captive Aggregate Stop Loss Program with Profit Sharing
Key Benefits ‒Multi-year aggregate protection to
cover all lines written in captive
‒May include experience account balance to allow profit commission if low volatility in period
‒Aggregate limit provided enough cover to satisfy 1/200 year event

GUY CARPENTER
Example #2 Captive Aggregate Stop Loss Program with Profit Sharing
Loss Scenario #1 ( No Losses)
Experience Account Year 1 Year 2 Year 3
Beginning Balance 0 2,000,000 4,000,000
Premium Credit 2,000,000 2,000,000 2,000,000
Sub-Total 2,000,000 4,000,000 6,000,000
Annual Losses excess of $30M Retention 0 0 0
Ending Balance 2,000,000 4,000,000 6,000,000
Profit-share paid upon commutation: $6M
Limits Paid from
Program: $0M
GUY CARPENTER
Example #2 Captive Aggregate Stop Loss Program with Profit Sharing
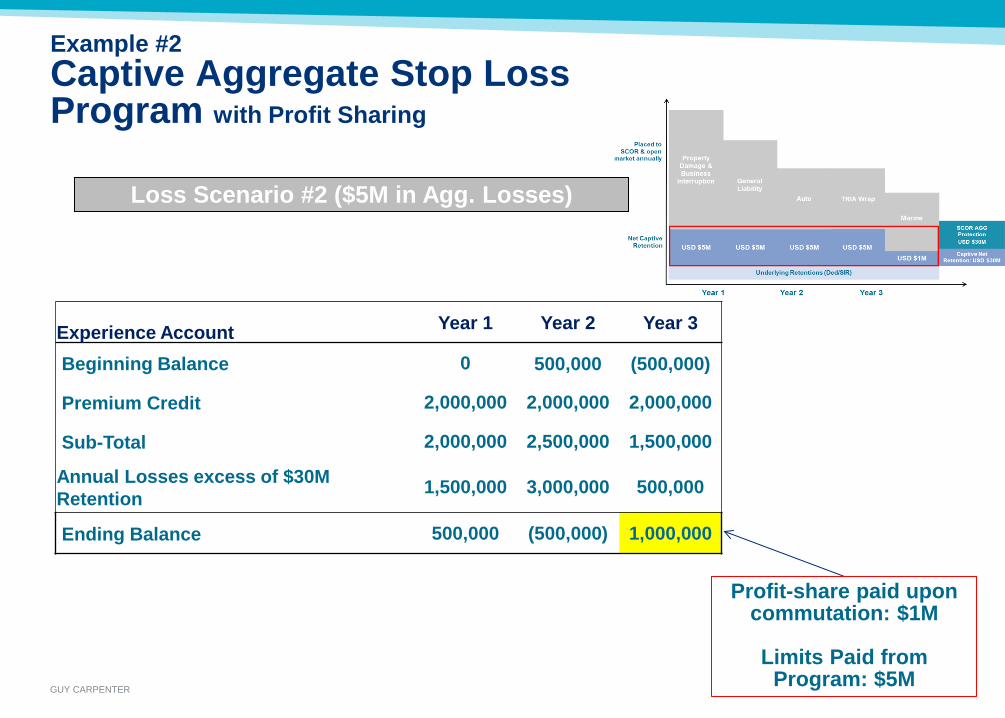
Loss Scenario #2 ($5M in Agg. Losses)
Experience Account Year 1 Year 2 Year 3
Beginning Balance 0 500,000 (500,000)
Premium Credit 2,000,000 2,000,000 2,000,000
Sub-Total 2,000,000 2,500,000 1,500,000
Annual Losses excess of $30M Retention 1,500,000 3,000,000 500,000
Ending Balance 500,000 (500,000) 1,000,000
Profit-share paid upon commutation: $1M
Limits Paid from
Program: $5M

GUY CARPENTER
Example #3 Structured Multi-Year Quota-Share Buffer
GUY CARPENTER
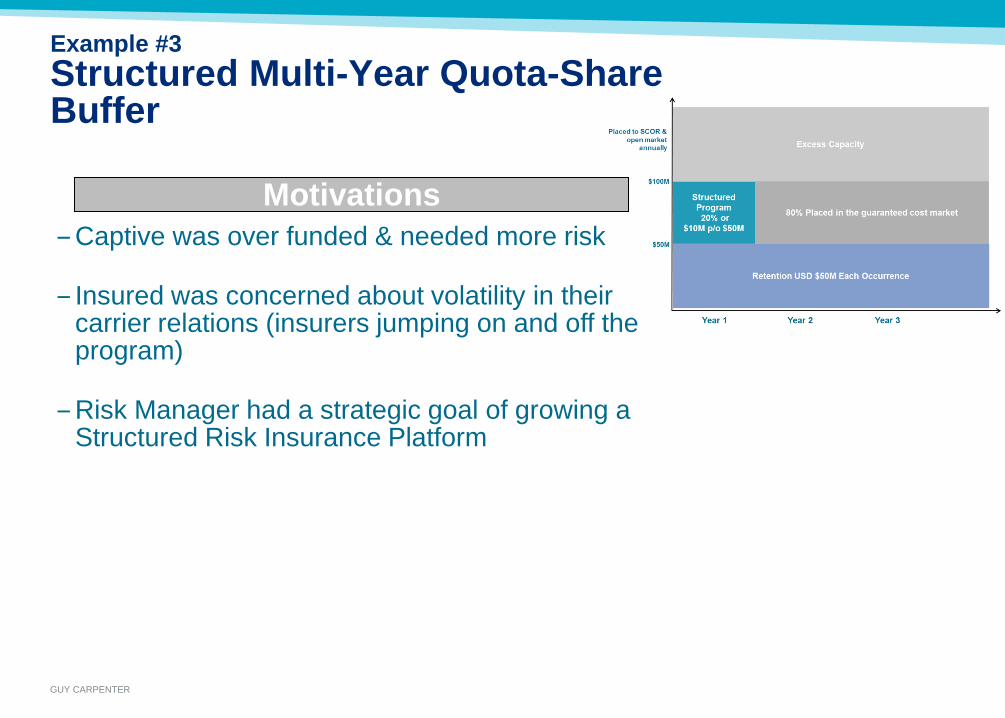
Example #3 Structured Multi-Year Quota-Share Buffer
‒Captive was over funded & needed more risk
‒ Insured was concerned about volatility in their carrier relations (insurers jumping on and off the program)
‒Risk Manager had a strategic goal of growing a Structured Risk Insurance Platform
Motivations
GUY CARPENTER
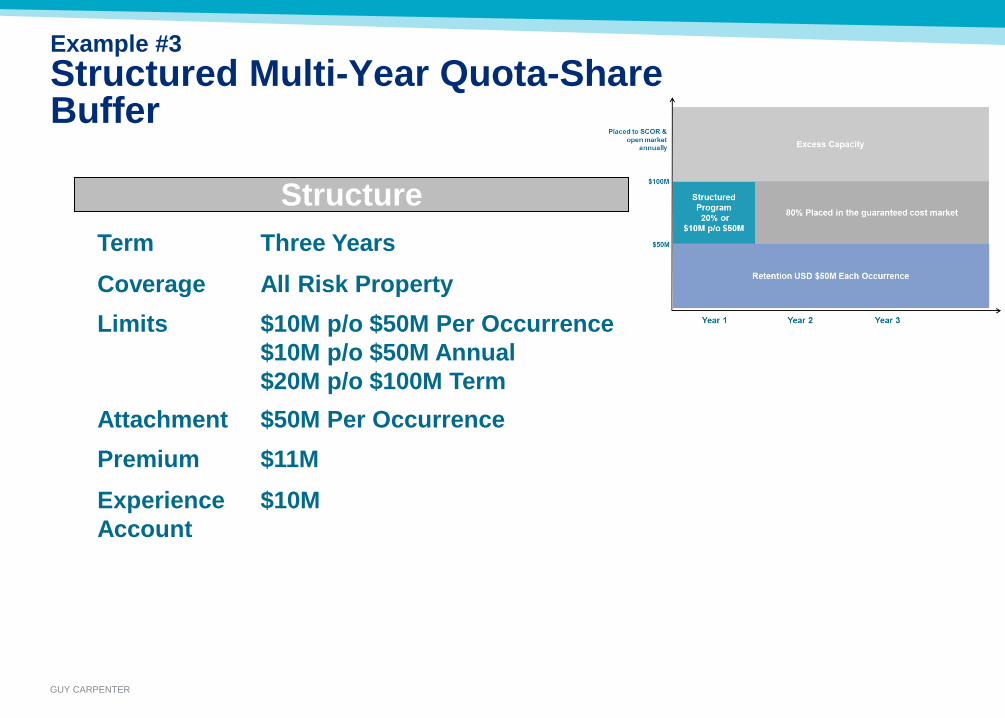
Example #3 Structured Multi-Year Quota-Share Buffer
Structure Term Three Years Coverage All Risk Property Limits $10M p/o $50M Per Occurrence
$10M p/o $50M Annual $20M p/o $100M Term
Attachment $50M Per Occurrence Premium $11M Experience Account
$10M
GUY CARPENTER
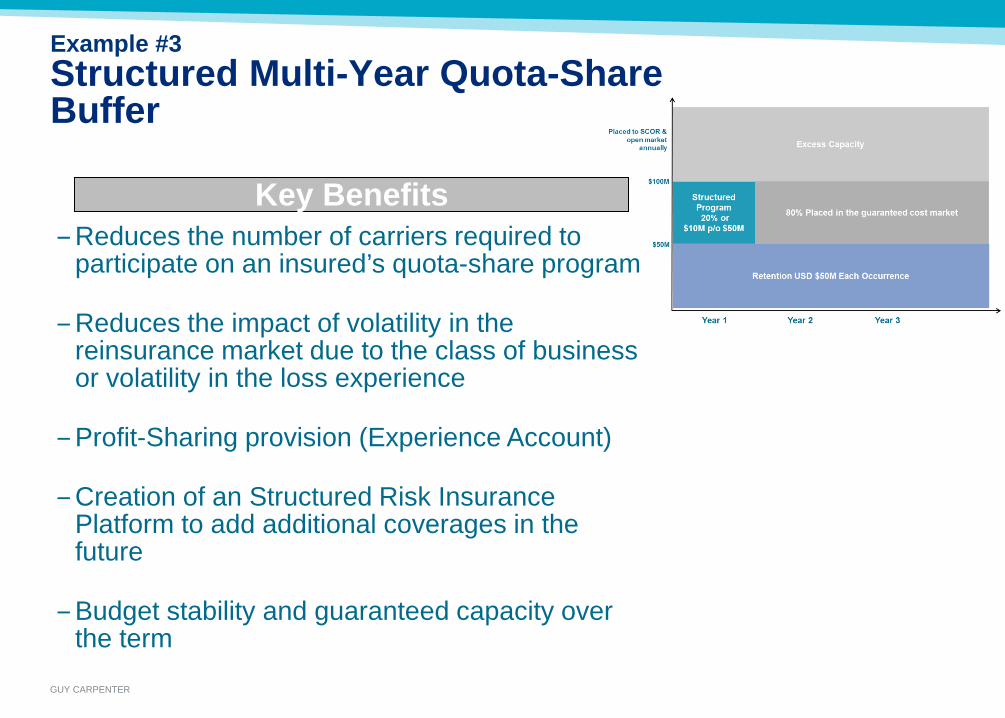
Example #3 Structured Multi-Year Quota-Share Buffer
‒Reduces the number of carriers required to participate on an insured’s quota-share program
‒Reduces the impact of volatility in the reinsurance market due to the class of business or volatility in the loss experience
‒Profit-Sharing provision (Experience Account)
‒Creation of an Structured Risk Insurance Platform to add additional coverages in the future
‒Budget stability and guaranteed capacity over the term
Key Benefits

GUY CARPENTER
Example #3 Structured Multi-Year Quota-Share Buffer
Loss Scenarios
Scenario Ground-UP Losses Program Losses Profit-Share Margin
Margin Loss Ratio
1 No Losses No Losses $10M $1M 0% 2 $45M No Losses $10M $1M 0% 3 $75M $5M $5M $1M 0% 4 $100M $10M $0M $1M 0%
5 (2) $100M Losses in Year 1 $10M $0M $1M 0%
6 $100M Loss in Year 1 & 2 $20M $0M $1M 1000%
GUY CARPENTER
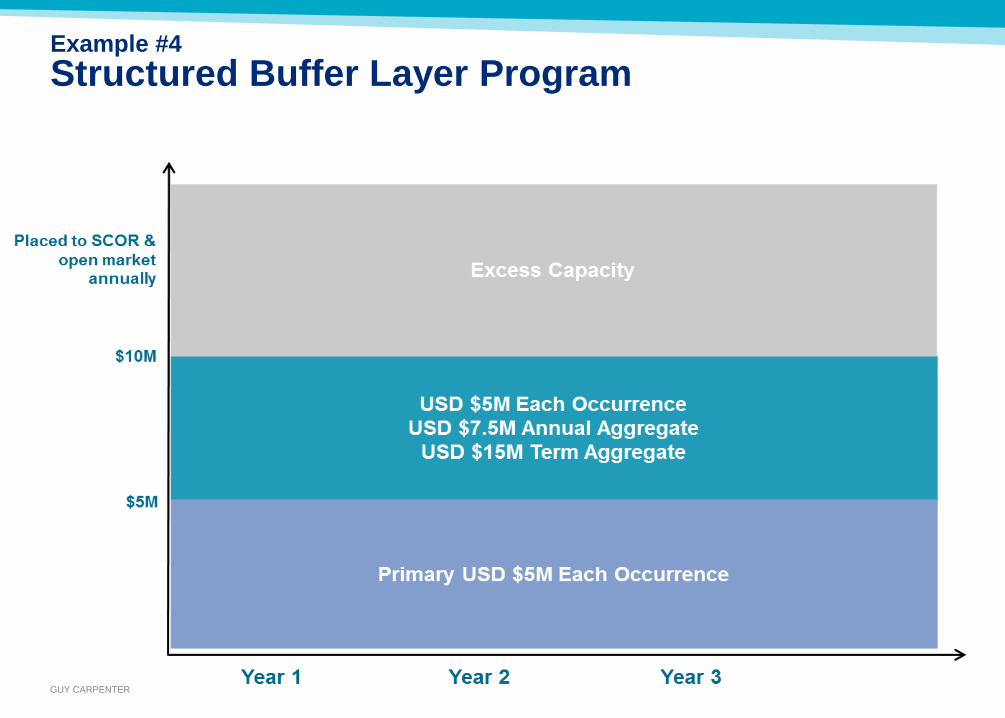
Example #4 Structured Buffer Layer Program
GUY CARPENTER
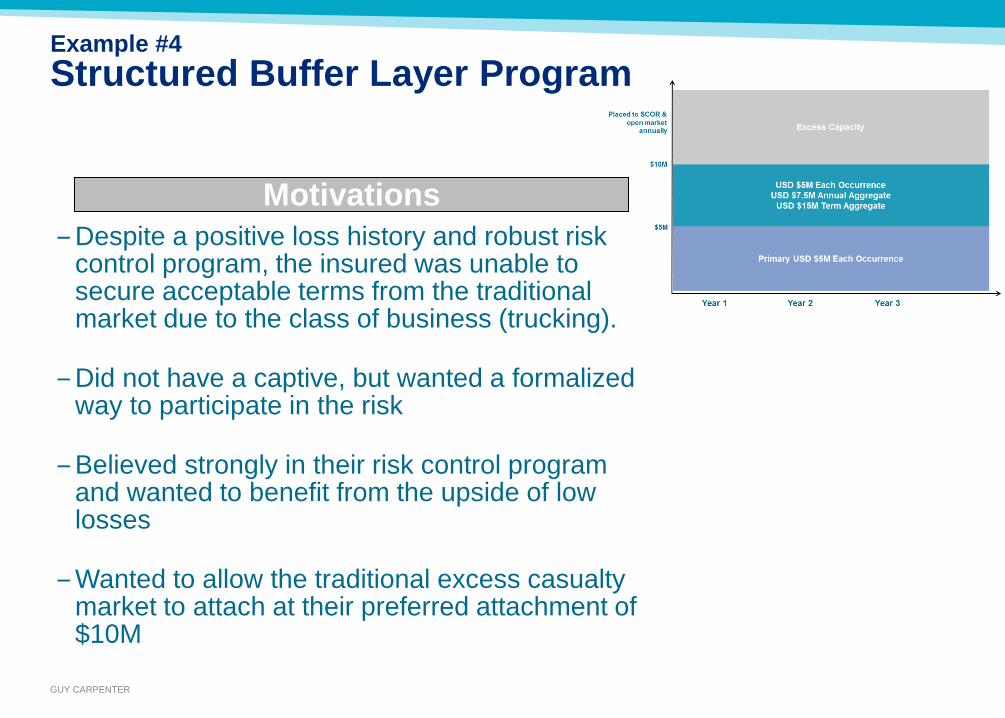
Example #4 Structured Buffer Layer Program
‒Despite a positive loss history and robust risk control program, the insured was unable to secure acceptable terms from the traditional market due to the class of business (trucking).
‒Did not have a captive, but wanted a formalized way to participate in the risk
‒Believed strongly in their risk control program and wanted to benefit from the upside of low losses
‒Wanted to allow the traditional excess casualty market to attach at their preferred attachment of $10M
Motivations

GUY CARPENTER
Example #4 Structured Buffer Layer Program
Structure Term Three Years Coverage Excess Casualty Limits $5M Per Occurrence
$7.5M Annual $15M Term
Attachment $5M Per Occurrence Premium $7.5M Experience Account
$6M

GUY CARPENTER
Example #4 Structured Buffer Layer Program
‒ Fills gap between the Primary layer and where the Excess market prefers to attach
‒ Suited for insureds with: ‒ High risk, but have a stellar loss experience in the
subject layer ‒ Invested heavily in loss control but not receiving
corresponding credit from the traditional market ‒ Typically placed on layers that are difficult to fill
due to the class of business or volatility in the loss experience
‒ Budget stability and guaranteed capacity over the term
‒ Reduced cost of insurance / reinsurance in low claims scenarios when structured with a profit-sharing provision
Key Benefits

GUY CARPENTER
Example #4 Structured Buffer Layer Program
Loss Scenario #1 (No Losses)
Experience Account Year 1 Year 2 Year 3
Beginning Balance 0 2,000,000 4,000,000
Premium Credit 2,000,000 2,000,000 2,000,000
Sub-Total 2,000,000 4,000,000 6,000,000
Losses in the $5M XS $5M Layer 0 0 0
Ending Balance 2,000,000 4,000,000 6,000,000
Profit-share paid upon commutation: $6M
Limits Paid from
Program: $0M

GUY CARPENTER
Example #4 Structured Buffer Layer Program
Loss Scenario #2 ($5M Loss in Year 1)
Experience Account Year 1 Year 2 Year 3 Beginning Balance 0 (3,000,000) (1,000,000)
Premium Credit 2,000,000 2,000,000 2,000,000
Sub-Total 2,000,000 (1,000,000) 1,000,000
Losses in the $5M XS $5M Layer 5,000,000 0 0
Ending Balance (3,000,000) (1,000,000) 1,000,000
Profit-share paid upon
commutation: $1M
Limits Paid from Program: $5M
GUY CARPENTER
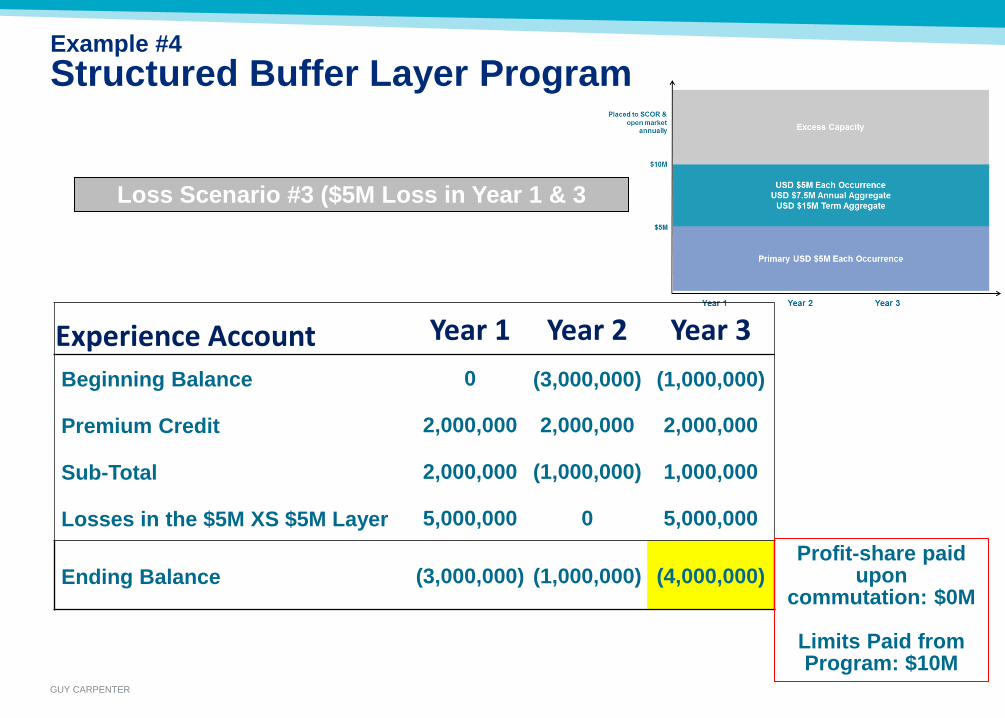
Example #4 Structured Buffer Layer Program
Loss Scenario #3 ($5M Loss in Year 1 & 3
Experience Account Year 1 Year 2 Year 3 Beginning Balance 0 (3,000,000) (1,000,000)
Premium Credit 2,000,000 2,000,000 2,000,000
Sub-Total 2,000,000 (1,000,000) 1,000,000
Losses in the $5M XS $5M Layer 5,000,000 0 5,000,000
Ending Balance (3,000,000) (1,000,000) (4,000,000) Profit-share paid
upon commutation: $0M
Limits Paid from Program: $10M
GUY CARPENTER
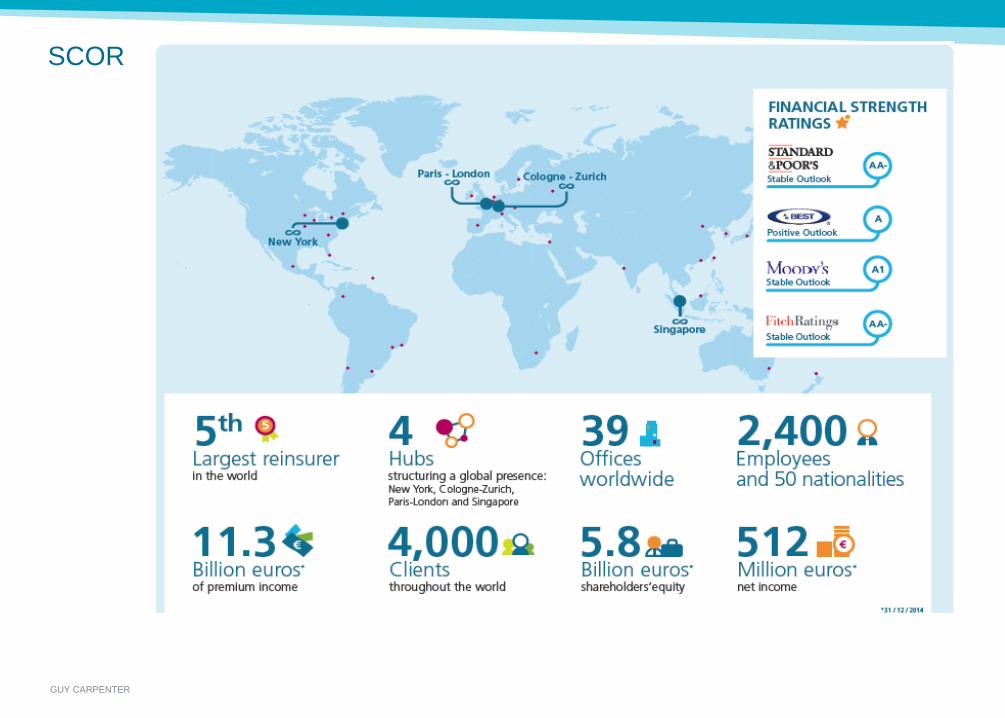
SCOR
GUY CARPENTER
SCOR Captive Solutions
– Designs and implements customized Structured and Captive reinsurance solutions
– Part of SCOR’s Global P&C
– The Property and Casualty Division of the SCOR group
– Insurance and facultative reinsurance
– $5B in GWP
– 980 Professionals worldwide
– Provides protection for general P&C as well as specialty industry lines
– Natural Resources,
– Energy,
– Engineering,
– Professional Indemnity
– Captive Solutions