reinforcing the link between the double red clump and the...
TRANSCRIPT

Article
Reinforcing the link between the double red clump and the Xshaped bulge of the Milky Way
Gonzalez, O. A., Zoccali, M., Debattista, Victor P, Alonso-García, J., Valenti, E. and Minniti, D.
Available at http://clok.uclan.ac.uk/14612/
Gonzalez, O. A., Zoccali, M., Debattista, Victor P, AlonsoGarcía, J., Valenti, E. and Minniti, D. (2015) Reinforcing the link between the double red clump and the Xshaped bulge of the Milky Way. Astronomy & Astrophysics, 583 . L5. ISSN 00046361
It is advisable to refer to the publisher’s version if you intend to cite from the work.http://dx.doi.org/10.1051/0004-6361/201527434
For more information about UCLan’s research in this area go to http://www.uclan.ac.uk/researchgroups/ and search for <name of research Group>.
For information about Research generally at UCLan please go to http://www.uclan.ac.uk/research/
All outputs in CLoK are protected by Intellectual Property Rights law, includingCopyright law. Copyright, IPR and Moral Rights for the works on this site are retained by the individual authors and/or other copyright owners. Terms and conditions for use of this material are defined in the http://clok.uclan.ac.uk/policies/
CLoKCentral Lancashire online Knowledgewww.clok.uclan.ac.uk
A&A 583, L5 (2015)DOI: 10.1051/0004-6361/201527434c© ESO 2015
Astronomy&
Astrophysics
L E
Reinforcing the link between the double red clumpand the X-shaped bulge of the Milky Way?
O. A. Gonzalez1,2, M. Zoccali3,4, V. P. Debattista5, J. Alonso-García6,4, E. Valenti7, and D. Minniti4,8,9
1 European Southern Observatory, Ave. Alonso de Cordova 3107, Casilla 19, 19001 Santiago, Chilee-mail: [email protected]
2 Institute for Astronomy, University of Edinburgh, Royal Observatory, Blackford Hill, Edinburgh, EH9 3HJ, UK3 Instituto de Astrofísica, Facultad de Física, Pontificia Universidad Católica de Chile, Av. Vicuña Mackenna 4860, Santiago 22,
Chile4 Instituto Milenio de Astrofísica, Camino El Observatorio 1515, Las Condes, Santiago, Chile5 Jeremiah Horrocks Institute, University of Central Lancashire, Preston PR1 2HE, UK6 Unidad de Astronomía, Facultad Cs. Básicas, Universidad de Antofagasta, Avda. U. de Antofagasta 02800, Antofagasta, Chile7 European Southern Observatory, Karl-Schwarzschild Strasse 2, 85748 Garching, Germany8 Departamento de Ciencias Físicas, Universidad Andrés Bello, República 220, Santiago, Chile9 Vatican Observatory, 00120 Vatican City State, Italy
Received 23 September 2015 / Accepted 19 October 2015
ABSTRACT
The finding of a double red clump in the luminosity function of the Milky Way bulge has been interpreted as evidence for an X-shapedstructure. Recently, an alternative explanation has been suggested, where the double red clump is an effect of multiple stellar popula-tions in a classical spheroid. In this Letter we provide an observational assessment of this scenario and show that it is not consistentwith the behaviour of the red clump across different lines of sight, particularly at high distances from the Galactic plane. Instead, weconfirm that the shape of the red clump magnitude distribution closely follows the distance distribution expected for an X-shapedbulge at critical Galactic latitudes. We also emphasize some key observational properties of the bulge red clump that should not beneglected in the search for alternative scenarios.
Key words. Galaxy: bulge – Galaxy: structure
1. Introduction
Understanding galaxy formation and evolution is one of the fun-damental goals of modern astronomical research. In particu-lar, modern simulations reveal that the overall shape of galaxybulges and the properties of their stars can hold the fingerprintsof the role that different processes, such as dynamical instabili-ties, hierarchical merging, and dissipative collapse, played in theassembly history of the entire host galaxy.
There are two main ideas in how bulges form: the merger-driven bulge scenario and the secular evolution scenario. Bulgescan be formed during the early stages of the galaxy, dominatedby violent and rapid processes of hierarchical merging of sub-clumps of dark-matter carrying baryons and gas (e.g. Brook et al.2011). These processes give rise to a spheroidal structure that isdominated by old stars and is known in the literature as a classi-cal bulge (see Brooks & Christensen 2016, for a recent review).On the other hand, the bulge structure in the secular evolutionscenario is naturally born from the dynamical evolution of astellar disc (e.g. Combes & Sanders 1981; Athanassoula 2005).The stellar bar in the inner regions of a galaxy suffers from so-called buckling instabilities that cause it to thicken in the ver-tical direction. This produces the so-called boxy-peanut (B/P)bulges, which earned this name because their shape is boxy, like
? Based on observations taken within the ESO VISTA Public SurveyVVV, Programme ID 179.B-2002.
a peanut, or even like an X when seen in edge-on projection (seeLaurikainen & Salo 2016, for a recent review)1.
In response to this, attempts to link the formation of theGalactic bulge to these processes have increased considerablyduring the past years. In particular, the structure of the bulgehas been mapped extensively thanks to the large coverage of re-cent near-IR surveys of the inner Galaxy. These studies are oftenbased on the construction of the luminosity function of the bulgetowards a given line of sight, where the red clump (RC) featurecan be identified, its mean magnitude measured, and used as adistance indicator (e.g. Stanek & Garnavich 1998). Followingthe discovery of a split of the RC along the bulge’s minor axisby Zoccali (2010) and McWilliam et al. (2010), McWilliam& Zoccali (2010), Nataf et al. (2010), and Saito et al. (2011)used this technique to provide a wide mapping of the doubleRC feature in the bulge luminosity function. These studies con-cluded that the bright (bRC) and faint (fRC) red clumps arethe consequence of two over-densities of stars located at dif-ferent distances, namely the two southern arms of an X-shaped
1 We note that attempting to classify observed bulges as the result ofonly one of these two scenarios is perhaps a too simplistic view. Recentobservations of main-sequence galaxies at z ∼ 2 show that the migra-tion and central coalescence of massive star-forming clumps (Immeliet al. 2004; Bournaud et al. 2009) may develop into a global violentdisc instability and also lead to the formation of compact bulges throughdissipation (Dekel & Burkert 2014).
Article published by EDP Sciences L5, page 1 of 4
A&A 583, L5 (2015)
NSTARSNSTARSNSTARSNSTARSNSTARS(J−K)0
K0
(+8,−8) (+4,−8) (0,−8) (−4,−8) (−8,−8)
longitude
latitud
e
GC
(+8,−8)
K0
(0,−4) (0,−6)
NSTARS NSTARS
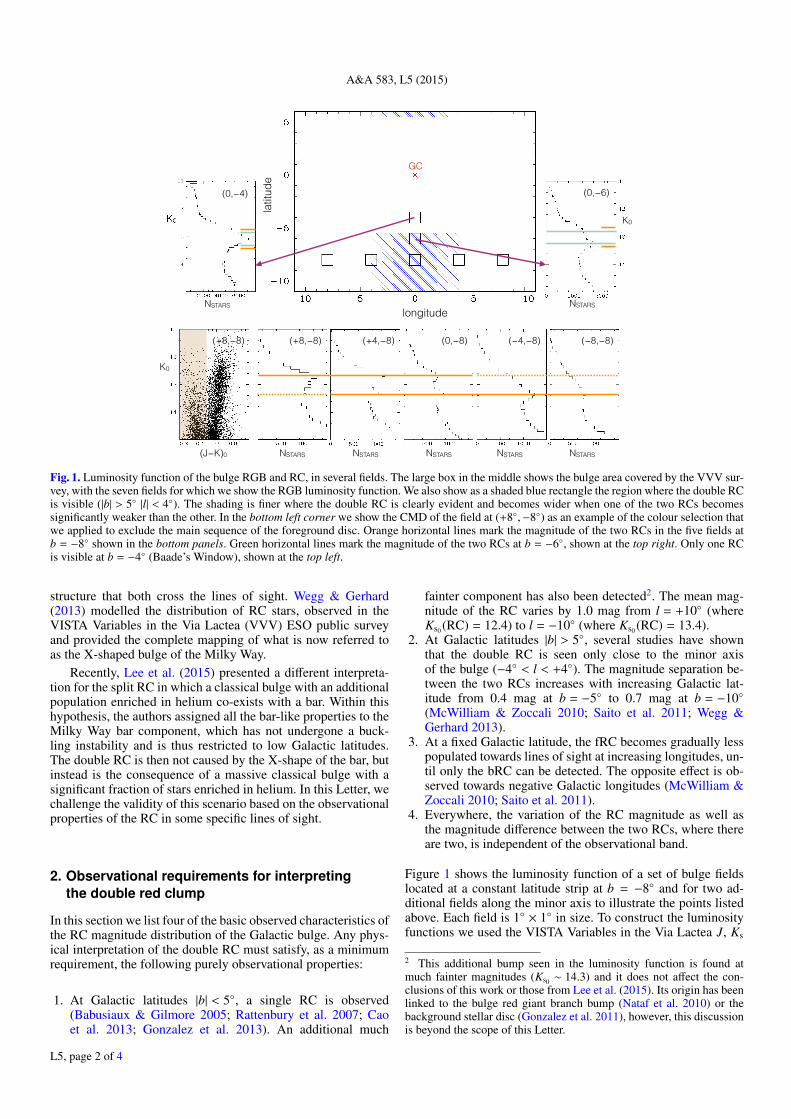
Fig. 1. Luminosity function of the bulge RGB and RC, in several fields. The large box in the middle shows the bulge area covered by the VVV sur-vey, with the seven fields for which we show the RGB luminosity function. We also show as a shaded blue rectangle the region where the double RCis visible (|b| > 5◦ |l| < 4◦). The shading is finer where the double RC is clearly evident and becomes wider when one of the two RCs becomessignificantly weaker than the other. In the bottom left corner we show the CMD of the field at (+8◦,−8◦) as an example of the colour selection thatwe applied to exclude the main sequence of the foreground disc. Orange horizontal lines mark the magnitude of the two RCs in the five fields atb = −8◦ shown in the bottom panels. Green horizontal lines mark the magnitude of the two RCs at b = −6◦, shown at the top right. Only one RCis visible at b = −4◦ (Baade’s Window), shown at the top left.
structure that both cross the lines of sight. Wegg & Gerhard(2013) modelled the distribution of RC stars, observed in theVISTA Variables in the Via Lactea (VVV) ESO public surveyand provided the complete mapping of what is now referred toas the X-shaped bulge of the Milky Way.
Recently, Lee et al. (2015) presented a different interpreta-tion for the split RC in which a classical bulge with an additionalpopulation enriched in helium co-exists with a bar. Within thishypothesis, the authors assigned all the bar-like properties to theMilky Way bar component, which has not undergone a buck-ling instability and is thus restricted to low Galactic latitudes.The double RC is then not caused by the X-shape of the bar, butinstead is the consequence of a massive classical bulge with asignificant fraction of stars enriched in helium. In this Letter, wechallenge the validity of this scenario based on the observationalproperties of the RC in some specific lines of sight.
2. Observational requirements for interpretingthe double red clump
In this section we list four of the basic observed characteristics ofthe RC magnitude distribution of the Galactic bulge. Any phys-ical interpretation of the double RC must satisfy, as a minimumrequirement, the following purely observational properties:
1. At Galactic latitudes |b| < 5◦, a single RC is observed(Babusiaux & Gilmore 2005; Rattenbury et al. 2007; Caoet al. 2013; Gonzalez et al. 2013). An additional much
fainter component has also been detected2. The mean mag-nitude of the RC varies by 1.0 mag from l = +10◦ (whereKs0 (RC) = 12.4) to l = −10◦ (where Ks0 (RC) = 13.4).
2. At Galactic latitudes |b| > 5◦, several studies have shownthat the double RC is seen only close to the minor axisof the bulge (−4◦ < l < +4◦). The magnitude separation be-tween the two RCs increases with increasing Galactic lat-itude from 0.4 mag at b = −5◦ to 0.7 mag at b = −10◦(McWilliam & Zoccali 2010; Saito et al. 2011; Wegg &Gerhard 2013).
3. At a fixed Galactic latitude, the fRC becomes gradually lesspopulated towards lines of sight at increasing longitudes, un-til only the bRC can be detected. The opposite effect is ob-served towards negative Galactic longitudes (McWilliam &Zoccali 2010; Saito et al. 2011).
4. Everywhere, the variation of the RC magnitude as well asthe magnitude difference between the two RCs, where thereare two, is independent of the observational band.
Figure 1 shows the luminosity function of a set of bulge fieldslocated at a constant latitude strip at b = −8◦ and for two ad-ditional fields along the minor axis to illustrate the points listedabove. Each field is 1◦ × 1◦ in size. To construct the luminosityfunctions we used the VISTA Variables in the Via Lactea J, Ks
2 This additional bump seen in the luminosity function is found atmuch fainter magnitudes (Ks0 ∼ 14.3) and it does not affect the con-clusions of this work or those from Lee et al. (2015). Its origin has beenlinked to the bulge red giant branch bump (Nataf et al. 2010) or thebackground stellar disc (Gonzalez et al. 2011), however, this discussionis beyond the scope of this Letter.
L5, page 2 of 4

O. A. Gonzalez et al.: Reinforcing the link of the double red clump with the X-shape of the Milky Way bulge
PSF photometric catalogues (Alonso-Garcia et al., in prep.) cor-rected for reddening using the BEAM calculator (Gonzalez et al.2012).
3. Multiple population spheroid and bar componentscenario
Lee et al. (2015) presented a scenario where the double RC is theconsequence of a classical spheroid with two stellar populations,one of which is significantly enhanced in helium. Specifically,a first population, called G1, has a skewed metallicity distri-bution in the range −0.75 < [Fe/H] < +0.05 and a stan-dard helium enrichment parameter, thus populating the faintRC. A second, super-helium-rich generation of stars (G2), with−0.55 < [Fe/H] < +0.25 and Y = 0.39 populates the bright RC.Lee et al. (2015) assumed that the global metallicity distributionfunction peaks at [Fe/H] = −0.1, but the two populations havea mean metallicity difference of ∆[Fe/H]G2−G1 = 0.2 and agesof 12 Gyr for G1 and 10 Gyr for G2. In addition to this classicalspheroid component, they included a bar population similar toG1, but with an age of 10 Gyr and a narrow metallicity distribu-tion peaked at [Fe/H] = +0.15, with σ[Fe/H] = 0.1. They adopteda population ratio between the bar and the CB components of 2:1at low latitudes, comparable to a population ratio at |b| ∼ 5.5◦,and fully dominated by the CB component at higher latitudes.Lee et al. (2015) did not explicitly state what they refer to as lowand high latitudes, therefore we assumed for our analysis threeGalactic latitude strips at b = −3.0◦, −5.5◦, and −8.5◦.
With this scenario, Lee et al. (2015) claimed to be able to re-produce all the key observations of the bulge. They found a mag-nitude difference of 0.5 mag between the faint and bright RC,with negligible differences in colour. The double RC would notbe detected in the metal-poor stars since the metallicity is re-quired to be [Fe/H] > −0.4 for the super-helium-rich G2 to formand remain in the bRC. The latitude-longitude dependency ofthe double RC is then explained by the different contributions ofthe CB and a bar component with a suitable position angle (cf.their Fig. 4). The RC of the bar population would be suitablyplaced between the faint and bright RC of the CB component.Thus, since the bar population would become less dominant atincreasing |b| and vanish at high latitudes, the double RC wouldbecome more prominent and the magnitude difference betweenfRC and bRC would increase with increasing latitude |b|. On theother hand, at intermediate latitudes (|b| = 5.5◦), the effect ofthe bar position angle would cause the bulge RC to overlap withone of the two RCs of the spheoroid, so that the other, largelyoutnumbered, would not be detected. At positive longitude thebar is closer, hence its RC would overlap with the spheroid bRC,and vice versa at negative longitudes.
4. Testing the scenario with the observed doublered clump of the bulge
In this section we test the multiple population classicalbulge (MCB) scenario proposed by Lee et al. (2015) by com-paring it to some key observations that, in our opinion, were notproperly taken into account in their paper. In particular, we fo-cus on observations where the points (P1, P2, P3, and P4) listedin Sect. 2 can be reliably tested. Figure 2 shows the bulge lumi-nosity functions at Galactic longitudes l = −2◦, 0◦, and +2◦ atlatitudes b = −3.0◦, −5.5◦, and −8.5◦. For each line of sight, theunderlying red giant branch was subtracted using an exponentialfunction following the prescriptions of Nataf et al. (2010).
Fig. 2. RC magnitude distributions for lines of sight for Galactic lon-gitudes l = −2◦, 0◦, and +2◦ and Galactic latitudes b = −3.0◦, −5.5◦,and −8.5◦. The bottom panel shows the simulated magnitudes derivedfrom the distance distribution of particles of the B/P bulge model fromNess et al. (2014) at the corresponding lines of sight for b = −8.5◦.All the distributions at the same Galactic latitude have been normal-ized by the maximum of the central distribution (l = 0◦). The solidblack line shows the mean of the RC distribution at (l, b) = (0◦,−3.0◦)and the dashed lines show the maximum separation of the two RCsat (l, b) = (0◦,−8.5◦).
In principle, P1 can be satisfied within the MCB scenarioof Lee et al. (2015) by placing a population dominated by thebar in these inner regions. P4 can also be satisfied based on thenegligible photometric bandpass dependency of the RC magni-tude of G1 and G2 (S. Cassisi, priv. comm.). We note, however,that the mean magnitude changes of the single RC, induced bythe bar position angle, should remain the same at all latitudes.The upper panels of Fig. 2 show that the single RC observed atlow latitudes has a mean magnitude variation of ∆Ks = ±0.2when moving from l = +2◦ to l = −2◦. According to Lee et al.(2015), the bulge should be dominated by the bar at these lati-tudes, therefore this is the maximum possible variation of the barRC that is due to the bar position angle. At higher |b|, the magni-tude variation of the bar RC invoked to erase the signature of thedouble RC should not exceed 0.2 mag. Furthermore, at higherlatitudes (|b| = 8.5◦), no variations should be observed betweenthe RC magnitude distribution at positive and negative longi-tudes, as this is where the effect of the bar would be negligible,and we would only see the MCB. In contrast, it is not possibleto explain the RC magnitude variations observed at b = −5.5◦as due to the bar RC shifts seen at b = −3.0◦. The observedchanges in the RC distributions become even more dramatic atb = −8.5◦. Here, not only is the separation between the fRCand bRC already 0.7 mag at l = 0◦, as expected from P2, butthe bRC at l = +2◦ also becomes even more dominant with re-spect to the fRC, although no bar should be present here in thescenario of Lee et al. (2015). A Galactic latitude of b = −8.5◦corresponds to a height of ∼1.2 kpc from the plane for a pop-ulation located at 8 kpc from the Sun. Certainly, for the barpopulation to be present at such large heights from the plane,a buckling instability process would be required. Similarly, thefact that the fRC (bRC) becomes less populated with increasing(decreasing) longitude, to the point where only one of the RCsis visible as described in P3 (Fig. 1), firmly argues against the
L5, page 3 of 4

A&A 583, L5 (2015)
MCB scenario. The only way to explain P3 within the scenarioof Lee et al. (2015) would be to impose a rather unrealistic spa-tial distribution for populations G1 and G2 where only one ofthem is present at each side of the MCB.
On the other hand, the B/P nature of the bulge is able to nat-urally explain the observed changes in the RC seen in Figs. 1and 2. To judge the plausibility of such a scenario, it is impor-tant to emphasize that the double RC was discovered and latermapped by Saito et al. (2011) using 2MASS photometry. As aresult of the high incompleteness of 2MASS in the innermostregions (|b| < 3◦), early studies did not properly normalize thestar counts in the inner and outer bulge. Because of this, thefirst (qualitative) estimates of the density contrast of the X-shapewere overestimated. When VVV photometry became available,Wegg & Gerhard (2013) performed a 3D reconstruction of theshape of the whole bulge, using a correct density normalization.From their results it was clear that the contrast of the X-shapedstructure in the outer bulge is very similar to that of externalgalaxies with B/P bulges, of which several examples are avail-able in the nearby universe (Laurikainen & Salo 2016). In fact,bars seen edge-on have a boxy shape, and most of them alsohave a peanut shape, which is due to the natural instability ofbars that produces some bending and buckling of the bar. It isthen important to realize that the X-shape claimed to be presentin the Milky Way is not a particularly exotic hypothesis, but arather common feature in barred galaxies.
To support the latter statement, we compare here the ob-served RC magnitude distributions with the output of a B/P bulgesimulation from Ness et al. (2014). We note that we did not fine-tune the simulation, which was not specifically made to repro-duce the Milky Way properties. We use it here only because ithas a pure B/P bulge and thus its line-of-sight distance distri-butions provide the ideal test for interpreting the RC observa-tions. We scaled the model size to be comparable to the B/P ofthe Milky Way using a factor of 1.2 as described in Ness et al.(2014). We transformed the coordinates of the model to place theSun at 8 kpc from the centre of the galaxy and the bar to havea position angle of 27◦ with respect to the Sun-Galactic centreline-of-sight (Rattenbury et al. 2007; Wegg & Gerhard 2013).We converted the line-of-sight distance to every star particle ofthe model to an observed magnitude by adopting an absolutemagnitude for the RC of M(Ks) = −1.55 mag (Gonzalez et al.2011). The magnitude distribution of stars towards each line ofsight was then convolved with a Gaussian FWHM of 0.21 mag toaccount for the observational effects of the bulge RC population(Gerhard & Martinez-Valpuesta 2012). The resulting simulatedRC magnitudes for b = −8.5◦ are shown in the bottom panel ofFig. 2. The B/P model nicely reproduces the double RC shapeand variations seen at higher latitudes. The fact that these mag-nitude distributions were constructed directly from their spatialdistribution confirms that the RC magnitude closely follows theshape of the Milky Way bulge structure. The resemblance withthe observed distribution at b = −8.5◦ certainly confirms the B/Pbulge origin for the double RC.
5. Concluding remarks
We have provided a list of the observational properties of thedouble RC of the Milky Way bulge that must be satisfied whenattempting to interpret its origin. We showed that these basicproperties disagree with the scenario proposed by Lee et al.(2015), where the double RC originates from a MCB with twogenerations of stars each of them with a different helium enrich-ment, but instead they are a natural consequence of the B/P shape
of the Milky Way bulge. The main reasons that support our con-clusion is that a B/P bulge, which is very common in externalgalaxies, is able to consistently explain the presence (and ab-sence) of a double RC where it is actually observed without fine-tuning any parameters. The bar orientation angle that best repro-duces the observations (27◦ according to Wegg & Gerhard 2013)is fully compatible with previous measurements (e.g. Rattenburyet al. 2007). In contrast, the work of Lee et al. (2015) is basedon the search for a mechanism able to produce a double RC ev-erywhere in the Galactic bulge. This obviously needs another,specifically tailored mechanism to erase the double RC every-where except in a narrow range of longitudes in the outer bulge.Such a task requires fine-tuning both the iron and helium distri-bution of G1 and G2 and of a suitable bar orientation angle anddensity distribution. Yet, as we have demonstrated, it still can-not explain the disappearance of the double RC away from theminor axis (in longitude) in the outer bulge. Instead, we showedthat the line-of-sight distance distribution of a simulated galaxywith a B/P bulge naturally follows the observed RC magnitudedistribution of the Milky Way bulge at high distances from theplane.
We do consider that including stellar population variationssuch as were presented in Lee et al. (2015) are important to de-termine the precision of the RC as a distance indicator. The ef-fect of stellar populations is currently considered to be minimalin morphological studies of the Milky Way bulge. Providing aset of corrections can help improving our current map of the B/Pbulge structure of the Milky Way even further.
Acknowledgements. We thank the anonymous referee for useful comments.We warmly thank Andy McWilliam for his thoughtful comments and SantiCassisi for useful discussions about the RC magnitude variation as a func-tion of helium abundance. M.Z. acknowledges funding from the BASALCATA through grant PFB-06, and the Chilean Ministry of Economy throughICM grant to the Millennium Institute of Astrophysics and the support byProyecto Fondecyt Regular 1150345. V.P.D. is supported by STFC Consolidatedgrant # ST/J001341/1. J.A.-G. acknowledges support by the FIC-R Fund, allo-cated to the project 30321072. The simulation used in this study was run at theHigh Performance Computer Facility of the University of Central Lancashire.
ReferencesAthanassoula, E. 2005, MNRAS, 358, 1477Babusiaux, C., & Gilmore, G. 2005, MNRAS, 358, 1309Bournaud, F., Elmegreen, B. G., & Martig, M. 2009, ApJ, 707, L1Brook, C. B., Governato, F., Roškar, R., et al. 2011, MNRAS, 415, 1051Brooks, A., & Christensen, C. 2016, in Galactic Bulges (Springer International
Publishing), Astrophys. Space Sci. Libr., 418, 317Cao, L., Mao, S., Nataf, D., Rattenbury, N. J., & Gould, A. 2013, MNRAS, 434,
595Combes, F., & Sanders, R. H. 1981, A&A, 96, 164Dekel, A., & Burkert, A. 2014, MNRAS, 438, 1870Gerhard, O., & Martinez-Valpuesta, I. 2012, ApJ, 744, L8Gonzalez, O. A., Rejkuba, M., Minniti, D., et al. 2011, A&A, 534, L14Gonzalez, O. A., Rejkuba, M., Zoccali, M., et al. 2012, A&A, 543, A13Gonzalez, O. A., Rejkuba, M., Zoccali, M., et al. 2013, A&A, 552, A110Immeli, A., Samland, M., Gerhard, O., & Westera, P. 2004, A&A, 413, 547Laurikainen, E., & Salo, H. 2016, in Galactic Bulges (Springer International
Publishing), Astrophys. Space Sci. Libr., 418, 77Lee, Y.-W., Joo, S.-J., & Chung, C. 2015, MNRAS, 453, 3906McWilliam, A., & Zoccali, M. 2010, ApJ, 724, 1491McWilliam, A., Fulbright, J., & Rich, R. M. 2010, in IAU Symp. 265, eds.
K. Cunha, M. Spite, & B. Barbuy, 279Nataf, D. M., Udalski, A., Gould, A., Fouqué, P., & Stanek, K. Z. 2010, ApJ,
721, L28Ness, M., Debattista, V. P., Bensby, T., et al. 2014, ApJ, 787, L19Rattenbury, N. J., Mao, S., Sumi, T., & Smith, M. C. 2007, MNRAS, 378, 1064Saito, R. K., Zoccali, M., McWilliam, A., et al. 2011, AJ, 142, 76Stanek, K. Z., & Garnavich, P. M. 1998, ApJ, 503, L131Wegg, C., & Gerhard, O. 2013, MNRAS, 435, 1874Zoccali, M. 2010, in IAU Symp. 265, eds. K. Cunha, M. Spite, & B. Barbuy, 271
L5, page 4 of 4