regulatory entities capacity building project … · regulatory entities capacity building project...
TRANSCRIPT

CCRED Centre for Competition, Regulation and Economic Development
Regulatory Entities Capacity Building Project
Review of Regulators Orientation and Performance:
Review of Regulation in the Electricity Supply Industry
Trade and Industrial Policy Strategies (TIPS)
Reena das Nair
Gaylor Montmasson-Clair
Georgina Ryan
11 April 2014
This paper is an output of the Regulatory Entities Capacities Building Project that was undertaken by the
Centre for Competition, Regulation and Economic Development, funded by the South African
government’s Economic Development Department under an MoA with the University of Johannesburg.

Page 2 of 137
Abbreviations and Acronyms
AFSA Aluminium Federation of South Africa AMEU Association of Municipal Electricity Undertakings AMPLATS Anglo American Platinum AMSA ArcelorMittal South Africa BTI Board of Trade and Industry CAPEX Capital Expenditure Expansion Programme CCRED Centre for Competition, Regulation and Economic Development c/kWh Cents per Kilowatt-hour COUE Cost of Unserved Energy CPI Consumer Price Index DEA Department of Environmental Affairs DME Department of Minerals and Energy DMP Demand Market Participation DMR Department of Mineral Resources DoE Department of Energy DPE Department of Public Enterprises DSM Demand Side Management DTI Department of Trade and Industry DWA Department of Water EAF Energy Availability Factor ECB Electricity Control Board EDD Economic Development Department EIA US Energy Information Administration EIUG Energy Intensive Users Group of Southern Africa EPP Electricity Pricing Policy ERA Electricity Regulation Act ESI Electricity Supply Industry GDP Gross Domestic Product GGGI Global Green Growth Institute GJ Gigajoules GWh Gigawatt hours HSRC Human Sciences Research Council IBT Inclining Block Tariff IDC Industrial Development Corporation IDM Integrated Demand Management Programme IEA International Energy Agency IEP Integrated Energy Plan INEP Integrated National Electrification Programme IPAP Industrial Policy Action Plan IPP Independent Power Producers IRP Integrated Resources Plan ISMO Independent Systems and Market Operator LCOE Levelised Cost of Electricity LME London Metals Exchange LPU Large Power User LRMC Long Run Marginal Cost kWh Kilowatt Hour

Page 3 of 137
MFMA Municipal Finance Management Act MYPD Multi-Year Price Determination MW Megawatts NEMA National Environmental Management Act NER National Electricity Regulator NERSA National Energy Regulator of South Africa NIASA Nuclear Industry Association of South Africa NMB Nelson Mandela Bay NPC National Planning Commission NT National Treasury PCP Power Conservation Programme PGM Platinum Group Metals PPI Producer Price Index PV Present Value RAB Regulatory Asset Base RE Renewable Energy REDS Regional Energy Distributors ROA Return on Assets RoR Rate of Return RTS Return to Service SAIDI System Average Interruption Duration Index SAIFI System Average Interruption Frequency Index SAIPPA South African Independent Power Producers Association SALGA South African Local Government Association SCOA Standard Chart of Accounts S/NPA Special or Negotiated Pricing Agreement SOE State Owned Enterprise TNS Transmission Network Services TIPS Trade and Industrial Policy Strategies TOU Time of Use UJ University of Johannesburg UCLF Unplanned Capability Loss Factor

Page 4 of 137
Table of Contents
1. Introduction ......................................................................................................................10 2. The Electricity Supply Industry (ESI) ..............................................................................14
2.1. ESI Market Structure ...................................................................................................14 2.1.1 Generation ...........................................................................................................16 2.1.2 Transmission .............................................................................................................17 2.1.3. Distribution ...............................................................................................................17
2.2. Key Players in the ESI .................................................................................................17 2.2.1 Eskom ..................................................................................................................17 2.2.2 Municipalities .............................................................................................................18 2.2.3 Independent Power Producers (IPPs) .......................................................................18 2.2.4 Institutional stakeholders of the ESI ...........................................................................18
3. Regulatory and institutional framework .........................................................................20
3.1. The institutional and legislative framework ..................................................................20 3.1.1. Institutional arrangements: Who calls the shots? ..................................................20 3.1.2. Legislative framework: A very complex picture .....................................................27
3.2. Key problems in the regulation of the ESI ....................................................................33 3.2.1 Looking back: The deficiency of policy learning ....................................................33 3.2.2. Keeping the course: Managing time inconsistency ...............................................37 3.2.3. Managing the present: Blurred lined or the absence of clarity and certainty ...........38 3.2.4. Looking ahead: The absence of a clear overarching vision ..................................43
3.3. Conclusion ..................................................................................................................50 4. Electricity Pricing in South Africa ...................................................................................52
4.1. Brief history of electricity pricing until 2006 ..................................................................53 4.2 Pricing since 2006 to date ...........................................................................................55
4.2.1 Current principles of pricing ..................................................................................56 4.2.2 Multi-Year Price Determination (MYPD) ...............................................................56 4.2.3 Components that make up the final electricity price ..............................................58 4.2.4 What are the main influences on costs, therefore influencing the MYPD outcome? 62 4.2.4.1 Valuation of Eskom’s Regulatory Asset Base (RAB) ...............................................62 4.2.4.2 Accurate reporting of all other costs .......................................................................66
4.3 The MYPD process: How it works in practice ..................................................................67 4.4 Conclusion ..................................................................................................................69
5. Pricing to different customer groupings ........................................................................71
5.1 The different Eskom tariff structures ................................................................................71 5.1.1 Different tariff structures .......................................................................................71 5.1.2 Rationale for differences in tariff structures ..........................................................76
5.2 Trends over time ............................................................................................................78 5.3 Municipality pricing of electricity .....................................................................................82
5.3.1 Concerns around municipality funding models and the impact on electricity prices 83 5.3.2 So what is the problem? .......................................................................................87 5.3.3 What can NERSA do, or is the problem beyond NERSA? ....................................92

Page 5 of 137
5.4 Pricing to large industrial users ...................................................................................93 5.4.1 Energy-intensive industrial users locked into favourable long-term contracts or negotiated pricing agreements- the case of aluminium .......................................................94 5.4.2 Energy-intensive ferrochrome smelters and Eskom entered into electricity buy-back schemes ........................................................................................................................... 106 5.4.3. Impact of electricity prices on mining value chains- incentivising move to greater use of renewables? .......................................................................................................... 107
6. NERSA’s Performance of the Electricity Supply Industry ........................................... 110
6.1. NERSA’s Performance .............................................................................................. 111 6.2. Regulatory Impact ..................................................................................................... 117
6.2.1 Cost Effectiveness of Electricity Supply .............................................................. 117 6.2.2 Reliable Infrastructure Services .......................................................................... 119 6.2.3 Financial Performance and attraction of new investment .................................... 120 6.2.3.1 Performance related to the Expansion Programme ............................................ 122 6.2.4 Socio-Economic and Environmental Performance .............................................. 123
6.3. Conclusion ................................................................................................................... 124 7. Some conclusions and areas of capacity building ...................................................... 125 Appendix 1: List of Eskom Power Stations .............................................................................. 127 Appendix 2: South African electricity grid map ......................................................................... 132 Appendix 3: Tariff Components ............................................................................................... 133 Appendix 4: NERSA interventions in tariff composition ............................................................ 134 Appendix 5: Employment in the aluminium value chain ........................................................... 136 Appendix 6: List of energy saving and renewable energy initiatives undertaken by companies in mining and related manufacturing industries ........................................................................... 137
List of Figures
Figure 1: Average Electricity Prices, c/kWh, 1972-2013 ............................................................11
Figure 2: The ESI structure and flow of electricity ......................................................................14
Figure 3: The flow of electricity through the ESI.........................................................................15
Figure 4: The Hybrid Electricity Market .....................................................................................16
Figure 5: NERSA's direct relationship network in the electricity supply industry .........................26
Figure 6: Legislative framework for the ESI in South Africa .......................................................27
Figure 7: Diverging objectives related to energy policy ..............................................................46
Figure 8: Average Electricity Prices and increases, 1972-2013 .................................................52
Figure 9: Average price increases by Eskom, compared to PPI and CPI ...................................53
Figure 10: Illustration of electricity pricing make-up ...................................................................59
Figure 11: Other factors impacting electricity pricing .................................................................60
Figure 12: Stylised revenue (and price) trajectory if historical cost of capital is used to value
assets ........................................................................................................................................64
Figure 13: Stylised revenue (and price) trajectory if inflation-indexed cost capital is used to value
assets ........................................................................................................................................65
Figure 14: Electricity Tariff Determination Process ....................................................................68
Figure 15: Building Blocks of Tariff Design ................................................................................74

Page 6 of 137
Figure 16: Tariffs to different electricity users, 1996 to 2012 .....................................................78
Figure 17: International average electricity prices to industrial users .........................................79
Figure 18: International average electricity prices to residential users .......................................80
Figure 19: Households receiving electricity from municipalities .................................................83
Figure 20: Municipality tariff comparison to Eskom’s .................................................................84
Figure 21: Municipal income by type 2009-2012 (R million) .......................................................88
Figure 22: BHP Hillside potlines 1, 2 and 3 compared to average Megaflex tariffs ..................97
Figure 23: Aluminium local and export pricing trends from 1990 to 2006 ................................ 100
Figure 24: Trade position of Aluminium and articles thereof .................................................... 101
Figure 25: Framework for analysing the performance of the electricity regulatory system ....... 111
Figure 26: Reliability of the Distribution Sector ........................................................................ 120
List of Tables
Table 1: REIPPP Programme MW Allocation and Capacity Awarded by Preferred Bidders ......18
Table 2: Composition of the IRP 2010 Task Team ....................................................................25
Table 3: List of parameters for the development of the IRP 2010 and data providers ................42
Table 4: Comparison of the standard textbook model with South Africa's hybrid reform ............45
Table 5: Summary of NERSA Decisions ....................................................................................69
Table 6: Tariff structures according to customer type ................................................................72
Table 7: Main components of tariff structures ............................................................................73
Table 8: 2009 Costs of supplying different groups of customers compared to the respective
prices/tariffs ...............................................................................................................................77
Table 9: International average prices for domestic and industrial customers .............................81
Table 10: Electricity sales by category by Eskom and Municipalities, 2006 ...............................82
Table 11: Municipal proposed tariff increase v NERSA’s approved tariffs ..................................87
Table 12: Operating Revenue and Expenditure for Electricity over time ....................................88
Table 13: Budgeted Capital Expenditure on the Electricity Function, 2006-2012, R million ........92
Table 14: BHP and Megaflex tariffs over Eskom costs ..............................................................98
Table 15: Mark-up of local aluminium prices over export prices, 2003/04 ..................................99
Table 16: Summary of impact of an electricity price increase to BHP Billiton on the aluminium
value chain .............................................................................................................................. 104
Table 17: Electricity as a % of operational or total costs .......................................................... 108
Table 18: NERSA’s Performance according to its KPIs ........................................................... 112
Table 19: Eskom Performance in terms of DPE Shareholder Compact ................................... 118
Table 20: CAPEX Expansion Programme (MW) ...................................................................... 122
Table 21: Progress on Eskom CAPEX Programme (MW) ....................................................... 122

Page 7 of 137
Executive summary
The efficiency and performance of the electricity supply industry and, by implication, of the
energy regulator, the National Energy Regulator of South Africa (NERSA), has a significant
impact on the success of other economic policies and therefore on the country’s economic
growth and development.
In recognition of the important role played by economic regulators, the Centre for Competition,
Regulation and Economic Development (CCRED) of the University of Johannesburg (UJ) has
undertaken a capacity building project (Regulatory Entities’ Capacity Building Project) targeted
at economic regulators commissioned by the Economic Development Department (EDD). The
project involves a review of the orientation and performance of various economic regulators, the
identification of the constraints impacting their performance and the design and implementation
of a knowledge capacity development programme in response to identified needs.
The Electricity Supply Industry (ESI) was identified as a key industry in which a review of the
performance of NERSA was to be undertaken. The ESI has been regulated by an independent
regulator since 1995 (first by the National Electricity Regulator (NER), followed by NERSA since
2005). The regulator is tasked with price determination, licensing, dispute resolution and
compliance of electricity suppliers. Its roles and responsibilities are set against a backdrop of an
industry that was historically, and currently still is, dominated by Eskom, a state-owned
enterprise (SoE), at all three levels of the value chain (generation, transmission and distribution).
The ESI in South Africa is a complex interaction of institutional and regulatory frameworks, the
development of which has been partly shaped by political power relations and competing
interests over the decades. Policy uncertainty and related issues in the regulatory framework of
the ESI have resulted in certain detrimental impacts on the sector and the economy as a whole,
particularly during the 2008 load-shedding crises. Sub-optimal investment decisions in terms of
planning, timing, size and technology choices of power plant investments have had negative
consequences on the development of the ESI. The unstable policy environment further
complicates Eskom’s financial planning, in turn increasing its risk profile and access to
affordable finance for new build, and ultimately increasing electricity prices. In addition to the
lack of capacity and unclear responsibilities of the Department of Energy (DoE) and NERSA,
there is information asymmetry clearly in favour of Eskom which makes regulation even more
challenging.
Policy and planning decisions of the ESI have impacted electricity pricing and this has been
mainly due to large and lumpy investment decisions of Eskom for generation expansion, which
is a pattern from the 1970s repeated in the late 2000s. In addition, political decisions to supress
electricity prices in the 1990s meant that the price path of electricity historically was not in line
with the cost of producing electricity. When new generation capacity needed to come on line to
cater for increased electricity demand, the price of electricity spiked up substantially, with
increases well above inflation. This has been exacerbated by costly construction delays in

Page 8 of 137
recent years. Furthermore, and arguably more devastating to the economy, have been the
problems related to electricity supply with periods of severe shortages and load shedding in
2008 during which a number of industries were forced to shut down or scale back production.
Eskom’s business decisions (largely investment decisions and technology choices) and
performance therefore have a significant impact on the ESI and ultimately on the cost and
availability of electricity in the country.
Covering these issues, this review conducts an evaluation of the pricing levels and trends in
South Africa, both historically, over a 40-year period, and more recently since the use of the
Multi-Year Price Determination (MYPD) pricing mechanism by the regulator. The type of
regulation that NERSA employs in determining price levels of the ESI is broadly based on a
rate-of-return methodology, which allows for tariffs to cover all costs of operation as well as earn
a reasonable return. In recent years (since 2006), this has been employed through the MYPD
developed by NERSA.
NERSA (and NER previously) has taken some bold decisions regarding electricity price
increases requested by Eskom over the years. It has played an active role in scrutinising cost
components in Eskom’s tariff applications, more often than not granting lower tariffs than
requested. This is particularly important given the rate-of-return type of regulation, where there
is an incentive or tendency for the regulated entity to inflate/pad costs. The process by NERSA
however has also allegedly been politically influenced, resulting in certain periods in sub-
economical and not fully cost-reflective prices. There is room to build NERSA’s capacity in being
better able to scrutinise cost components put forth by Eskom. As mentioned, there is significant
information asymmetry in favour of Eskom, and NERSA needs to constantly be on top of cost
components in terms of finance, accounting and modelling techniques.
NERSA has also made important strides in making the different Eskom’s tariff structures more
transparent, user friendly and cost-reflective over the years, which are positive developments
towards more efficient regulation. However, it appears that NERSA has not seriously engaged in
amending tariffs structures to large industrial users, such as those on Megaflex, as well as those
under special deals, according to changing supply and demand balances and economic
conditions. This may be the reason for the widening gap seen between industrial customer
prices on the one hand, and residential and rural customer prices on the other. Prices to heavy
users of electricity should be increasing relative to light users in tight supply situations so as to
discourage the use of electricity and encourage investment in energy efficiency and renewable
energy. However, it is appreciated that costs to supply these different user groups vary, where
industrial users are generally less costly to serve given their larger off-take than residential
customers.
Nonetheless, NERSA, in terms of the Electricity Regulation Act No. 4 of 2006, has the power to
review certain long-term contracts under special deals that also serve to keep certain industrial
tariffs artificially low, such as BHP Billiton’s agreement with Eskom, if it safeguards and meets
the interests and needs of present and future electricity customers and end-users. There is

Page 9 of 137
potentially scope for training to understand evolving market and economic dynamics of heavy
industrial electricity users in South Africa, which would provide NERSA with a better
understanding of the impacts of their interventions (or non-interventions) in the economy. This
would allow NERSA to take more robust decisions in terms of industrial policy and employment
implications of the special schemes.
Electricity tariff determination by municipalities is a complex area, with much controversy around
NERSA’s mandate to regulate municipality electricity prices. NERSA has made some important
strides in attempting to address the issue of municipality pricing in the face of uncertain
legislation governing this space, including through assisting municipalities to collate their cost
information in a formal manner that is more cost-reflective through prescribed forms.
Nonetheless, there are still serious concerns around accurate and standardised cost reporting,
as well as repair and maintenance backlogs of municipalities’ electricity distribution
infrastructure. NERSA should play a more proactive role in attempting to clarify the apparent
‘legislative misalignment’ around what its role is in setting final municipal tariffs and importantly,
assist in addressing the repair and maintenance backlog issues, which is reported to be at crisis
levels.
The impact of the performance of the electricity sector on other aspects of the economy raises
an important question around the role of economic regulators in general. Should economic
regulation be isolated from other economic and social development objectives of a country,
particularly in a developing country with a history like South Africa’s? The review takes the
position that actions of Eskom and NERSA have direct implications on other policies and
therefore cannot operate in isolation from other objectives. This is assessed in terms of pricing
to heavy industrial users, special pricing deals struck with dominant market players and the
pricing of electricity by municipalities, as discussed above. Promoting small businesses,
increasing competition, stimulating downstream beneficiation and the resultant employment
spinoffs, and poverty and inequality reduction have all been integral components of industrial
and other social and development policies over the years. It is argued that actions of the ESI
players and NERSA are significant for the successes of other policies and a regulatory approach
that does not take into account the impact of electricity-related decisions on other policies is
arguably too narrow in its mandate. With this at the heart of the debate, this review focuses on
the following key questions in attempting to understand what has happened in the ESI over the
years, why this has happened and what the impact has been on the industrial development
trajectory of the country:
“How effective has economic regulation in the electricity sector been in relation to NERSA’s
mandate? To what extent does regulation in the electricity sector contribute to, or is in conflict
with, other economic development mandates aimed at sustainable development and growth?”

Page 10 of 137
1. Introduction
The Regulatory Entities’ Capacity Building Project undertaken by the University of
Johannesburg (UJ) through the Centre for Competition, Regulation and Economic Development
(CCRED) was commissioned by the Economic Development Department (EDD) in recognition
of the importance of effective performance of economic regulators for the growth and
development of South Africa. The project involves a review of the orientation and performance
of various economic regulators, the identification of the constraints impacting their performance
and the design and implementation of a knowledge capacity development programme in
response to identified needs.
The Electricity Supply Industry (ESI) was identified as one of the key industries in which a
review of the performance of the regulator, the National Energy Regulator of South Africa
(NERSA), formerly the National Electricity Regulator (NER), would be undertaken. The
efficiency and performance of the electricity supply industry and, by implication, of the energy
regulator has a significant impact on the success of other economic policies and therefore
economic development.
For several decades prior to 2008, South African households and industry paid relatively low
prices for electricity. The electricity supply interruptions in 2008 raised fears that
underinvestment in electricity generation capacity by national power utility Eskom and weak
management of coal stocks would have a strong negative impact on economic growth (Altman
et al., 2008). Eskom subsequently embarked on a large-scale capital expansion programme to
generate the necessary electricity to cater for the shortfall and adopted a multi-year price
determination mechanism (MYPD) to fund this expansion. This has had a significant impact on
price, and has led to a public outcry by both residential and industrial customers alike.
Indeed, the core of economic regulation lies in pricing and decisions taken by the regulator in
relation to pricing. However, pricing and other decisions, such as investments in the ESI,
operate within complex institutional and regulatory frameworks, along with equally complex
political and power relations fuelled by competing interests. These interactions have shaped the
electricity sector over the last few decades. Further, conflicting and unresolved policy and
regulatory issues, particularly with regards to energy planning, have complicated the work of the
energy regulator and have resulted in some suboptimal decisions which have had implications
on the economy.
An overview of pricing over the past 40 years reveals patterns of large price spikes in real terms,
coinciding with massive power station construction projects, first in 1978 and again in 2008
pursuant to power cuts in 2007/2008 (Figure 1). This review assesses important regulatory
decisions over this time period that have shaped the trajectory of electricity pricing in South
Africa.

Page 11 of 137
Figure 1: Average Electricity Prices from 1972-2013 (in ZAR c/kWh)
Sources: TIPS, based on Eskom’s 1996 Statistical Year Book and 2013 Historical Averages; and
Statistics South Africa and Quantec’s consumer price index (CPI) and producer price index (PPI).
Note: Base year: 2012. The average price is a simple average across all tariffs Eskom charges calculated
by taking total value of sales divided by the number of kilowatt-hours (kWh) sold per year. As far as TIPS
is aware, this includes sales from special pricing deals.
In addition to Eskom’s price increases, municipalities, who are amongst the largest buyers of
bulk electricity on-selling to commercial and residential customers, add significant margins on
electricity prices, margins which are over and above their actual costs associated with
distribution. This has negatively affected the competitiveness of smaller industries that largely
rely on municipality-supplied electricity (such as the foundry industry and small fabricators).
Between 25 and 60% of the revenue earned by certain municipalities to fund their activities is
estimated to be from the on-sale of electricity (Clark and van Vuuren, 2013). Revenues from
electricity form one of the main revenue streams for municipalities, creating perverse incentives
for municipalities to earn their income through marking up electricity prices at the expense of
consumers and the development of local industry. However, there also appears to be a serious
problem in the non-standardised cost accounting methods of municipalities, which inform the
tariff application to NERSA, and severe underinvestment in repair and maintenance of the
electricity distribution system. These dynamics are assessed in Chapter 5.

Page 12 of 137
While smaller industrial users of electricity and households appear to bear the brunt of these
price escalations, large and highly electricity-intensive users, such as the aluminium and certain
ferro-alloy smelters, are shielded from these increases through long-term contracts entered into
with Eskom several years ago which locked in favourable prices. These contracts were
generally entered into at a time when Eskom had significant overcapacity, with a reserve margin
of up to 40%, and when industrial policy and the 1998 White Paper on Energy Policy advocated
for investment in large, energy-intensive sectors. These sectors are often capital intensive, not
contributing significantly to employment. And because they are often large exporters of basic
products, they generally contribute little to downstream beneficiation. There are therefore
concerns that such electricity pricing practices and policies go against South Africa’s current
development objectives and policies. The contracts with the ferrochrome smelters were short-
termed, with termination timed to coincide with the projected eroding of the electricity surplus,
while the aluminium smelters contracts were longer term and are still in effect today. It is
however important to note that one of the reasons for the favourable prices to large users is the
lower cost to serve these customers, given that they off-take high voltage and the cost of this is
less per kWh than for residential users.
This review focuses on the following key questions in attempting to understand what has
happened in the ESI over the years, why this has happened and what the impact has been on
the industrial development trajectory of the country:
“How effective has economic regulation in the electricity sector been in relation to NERSA’s
mandate? To what extent does regulation in the electricity sector contribute to, or is in conflict
with, other economic development mandates aimed at sustainable development and growth?”
This includes a critical evaluation of the pricing levels and trends in South Africa, both
historically, over a 40-year period, and more recently since the use of the MYPD pricing
mechanism by the regulator. It analyses the different tariff structures to different user groups and
explains the rationale for these over time, as well as if these tariff structures changed in line with
the economic environment. The rationale of certain special pricing deals is assessed against
industrial policy objectives. The role of municipalities in setting tariffs is also addressed and the
implications of these on industry considered.
Each of above will be assessed in the context of interventions, and non-interventions, of NERSA
over the years, with the aim of understanding the challenges faced at a practical level and what
has been done to overcome these challenges. It is noted that the topic of the ESI’s regulation is
highly complex from an economic, political and social perspective. This review only focuses on a
few core issues and is not an exhaustive account of regulation in the sector.
This review is structured as follows. Chapter 2 briefly describes the ESI value chain, including
the role of municipalities and Independent Power Producers (IPPs). Chapter 3 looks at the
regulatory and institutional framework, assessing the respective roles of NERSA, the
Department of Energy (DoE), Eskom and the Department of Public Enterprises (DPE). In
Page 13 of 137
Chapter 4, the electricity pricing mechanism and the determination of prices in South Africa is
assessed. Pricing to different customer groupings, the actions of municipalities and their impact
on electricity prices is assessed in Chapter 5. Case studies, which highlight how actions by
Eskom and the regulator have implications for industrial policy, are also presented. Chapter 6
measures the performance of the regulator and the ESI, ranging from technical to financial,
socio-economic and environmental aspects. Chapter 7 provides some conclusions based on
the above assessments and recommends areas of capacity building for the regulator.

Page 14 of 137
2. The electricity supply industry
This chapter briefly describes the ESI value chain and its key players. It provides a background
for understanding issues related to regulation at different levels. The regulation of the electricity
sector concerns both substantive matters (of what has happened in the ESI’s structure over
time) as well as governance matters based on the institutional and regulatory framework
(explored in Chapter 3).
The ESI of South Africa is dominated by a state-owned utility, Eskom, which operates across the
entire electricity value chain, in electricity generation, transmission and distribution. South Africa
has a gross installed electricity generation capacity of 365 GW and Eskom generates 95% of the
electricity consumed in the country with IPPs representing a small portion of electricity
generation (Figure 2). In the medium term, a capacity target of an additional 40 000 MW by
2030 has been set to meet the demands of the ESI (DoE, 2013a).
2.1. The market structure
Figure 2: The structure and flow of electricity
Source: TIPS, updated from Steyn 2012 based on NER sources, using 2012 data

Page 15 of 137
Key issues relate to the market structure of the ESI and Eskom’s dominant role. Large
investment decisions and the cost of overruns and delays associated with expansion
programmes have impacted the generation capacity and the cost of generating electricity which,
in turn, has had significant impact on pricing (as seen in the pricing figures above and in
Chapter 4).
Figure 3: The flow of electricity through the electricity supply industry
Source: Eskom, 2010
After the corporatisation of Eskom, there were concerns around the dominance of Eskom
throughout the ESI, and concerns around the poor performance on a technical level.1 Further,
even though Eskom was funded by Government, alternative sources of funding were needed to
develop the ESI. These factors culminated in developing a hybrid model2 that features both
private and public investment. However, the industry is still dominated by Eskom in terms of the
size of its contribution to electricity generation, its ownership and operation of Transmission
Network Services (TNS) and its role in distributing electricity.
1 Transmission and distribution losses averaged 20% compared to the global average of 5%. Eskom was
strapped for cash and debt coverage ratios were high. Below-cost tariffs significantly contributed to poor technical and financial performance (Eberhard and Gratwick, 2008). See Chapter 6 for more details. 2 Interview with NERSA (5 November 2013).

Page 16 of 137
Figure 4: The hybrid electricity market
Source: TIPS, adapted from Kapika, 2012
The diagram of the hybrid model above shows Eskom’s role as the single buyer (‘Singe Buyer
Model’) of electricity in the country. Competition has only been introduced at the level of
electricity generation, and both transmission and distribution components of the ESI remain
largely unreformed (as discussed in detail in Chapter 3).
Further reform of transmission and distribution had been conceptualised as reflected in the 1998
Energy White Paper. In principle, this document is meant to be a guide toward the reform of the
sector. At present however, instruments of reform, such as the Independent Systems and
Market Operator (ISMO) Bill, which is meant to introduce competition in the transmission level of
the value chain, have been put on hold (Business Day, 2014). At the distribution level,
Government’s original plan to realise economies of scale in distribution by amalgamating all
distributors within six wall-to-wall Regional Energy Distributors (REDS) was scrapped in 2010 in
favour of retaining the existing fragmented structure (see Chapter 3 for a fuller discussion).
2.1.1 Generation
Eskom dominates the generation level of the value chain, accounting for around 95% of
generation. In terms of the generation capacity of the ESI, a total of 535 MW of generating
capacity was added in 2011/2012, which included the return to service of the Grootvlei (150
MW), Komati (325 MW), Camden (20 MW) and Arnot (30 MW) power stations.
The generation mix of energy sources is dominated by coal-fired power stations, and alternative
sources make up a small proportion of the rest of Eskom and the ESI’s total energy mix (see
Appendix 1 for more details). In addition, Kusile and Medupi, currently in construction, will be the

Page 17 of 137
third and fourth largest coal-fired power stations in the world when they are completed. One of
the major issues within the generation component of the value chain is the reliance on coal as
the primary source of energy. At present, 80% of coal requirements until 2018 have been
secured by Eskom (Eskom, 2012).
2.1.2 Transmission
The transmission grid comprises 154 substations and 29 297 km of transmission lines with a
nominal voltage of 132 kV (Eskom, 2013a: 60). 100% of the high voltage transmission assets of
the ESI is owned and managed by Eskom through TNS. As owner of the transmission network,
Eskom is responsible for managing the supply and demand of electricity in real time and also for
trading electricity internationally. It also sells to and purchases electricity from other countries in
the region (through the Southern African Power Pool Operating Guidelines and other
agreements) and purchases from IPPs (subject to Grid Code rules), that both rely on TNS for
carrying of the electricity they produce.
2.1.3. Distribution
South Africa has 400 000 km of distribution network and, in 2012/2013, Eskom distributed 60%
of the country’s power. Eskom distributes more power than municipalities but serves a fewer
number of end-users, with large contracts with mining companies and other large industry
players. These constituted around 40% of electricity sold in 2013.3 In terms of the distribution of
electricity, municipal distributors play a significant role in the Electricity Distribution Industry
(EDI), distributing to around 40% of end-users, by purchasing electricity in bulk from Eskom and
selling it on to commercial and residential customers. This is discussed in detail in Chapter 5.
2.2. Key players in the electricity supply industry
2.2.1 Eskom
Eskom was initially a public utility of the South African Government established in 1923 in terms
of the Electricity Act of 1922. Its current mandate according to the DPE is to “provide
sustainable electricity solutions to grow the economy and improve the quality of life of the people
of South Africa and the region” (Eskom, 2012). As mentioned above, it is vertically integrated
across the electricity supply value chain and plays a significant role in shaping the ESI. For a full
list of Eskom’s power stations and a map of the Eskom grid, see Appendix 2. Eskom sells
electricity to about 30 00 industrial customers, 1 000 mining customers, 50 000 commercial
customers and 84 000 agricultural customers. Residential customers of Eskom (of which 40%
are rural customers) are about 4.7 million.
3 Industrial and mining sales figures provided by Eskom.

Page 18 of 137
2.2.2 Municipalities
The role that municipalities play in the ESI largely entails distribution and retail activities,
predominantly in urban areas with some metropolitan municipalities having their own electricity
generation capacity and operating power stations. Further detail on the role of municipalities in
the ESI is discussed in Chapter 5.
2.2.3 Independent power producers
Prior to 1998, electricity policy supported a vertically-integrated state-owned electricity industry
model. The 1998 Energy Policy White Paper proposed an unbundled structure. Since then, the
lack of participation by IPPs in the ESI has partly been due to the time taken to develop and
adopt appropriate market rules, regulations and associated institutions as well as some
hesitation by Government in implementing the proposed policy. From the IPP’s perspective,
impediments have included regulatory risk and uncompetitive pricing, as well as a complicated
procurement process. Since the introduction of competitive bidding with power purchase
agreements guaranteed by the National Treasury (NT), there has been a significant increase in
the participation of IPPs in the ESI. The current procurement programme for renewable energy
is hailed as a world-class success story. This is discussed to some extent further in Chapter 3,
but is the core subject of a separate Renewable Energy review (Montmasson-Clair et al., 2014)
and is not elaborated upon in this review aside from highlighting the significant decrease in
tariffs offered by IPP bidders as competition in the IPP sector has increased. This is evidenced
in the table below.
Table 1: Total megawatt awarded per technology, bid responses and preferred bidders in
the renewable energy independent power producer procurement programme
Awards
(MW)
Initial
determination
(2012-2016)
Second
determination
(2017-2020)
Round 1
Allocation
Round 2
Allocation
Round 3
Allocation
Total
Allocation
Wind 1 850 1 470 634 563 787 1 984
Solar PV 1 450 1 075 632 417 450 1 499
CSP 200 400 150 50 200 400
Small
Hydro 75 60 0 14.3 0 14.3
Landfill
Gas 25 47.5 0 0 18 18
Biomass 12.5 47.5 0 0 16.5 16.5
Total 3 625 3 100 1 416 1 044.3 1 456 3 916
Bid
Responses
Received
N/A N/A 53 79 93 225
Preferred
bidders N/A N/A 28 19 17 64
Source: TIPS, based on DoE, 2013a and DoE, 2012b

Page 19 of 137
2.2.4 Institutional stakeholders
Detailed descriptions of functions and responsibilities of institutional stakeholders mentioned in
the value chain will be explored in Chapter 3. The current institutional stakeholders include the
Department of Energy (DoE), the Department of Public Enterprises (DPE), the National
Treasury (NT) and the National Energy Regulator of South Africa (NERSA) which performs the
role of economic and technical regulator. It is the sole licensing authority for electricity activities
under the Electricity Regulation Act No. 4 of 2006, licensing electricity generation, transmission
and distribution.

Page 20 of 137
3. Regulatory and institutional framework
The regulation of the ESI is instrumental in establishing an effective electricity market in South
Africa. In the absence of effective competition (as a result of high barriers to entry and vertical
integration into the natural monopoly parts of the value chain), governmental involvement in the
ESI remains critical and necessary. In addition, a strong regulatory environment, from a
governance and content perspective, is critical to capture the economic efficiency benefits
associated with introducing competition into specific areas (such as generation with the
renewable energy bidding process).
Government’s primary task is to design and implement robust institutional arrangements, well-
designed policy frameworks and an independent regulator, including policies and directives
stipulating how IPPs, Eskom and municipal distributors should be governed and also how they
will account to the government (Newberry and Eberhard, 2008).
Going forward, regulation must also be adapted to the restructuring of the market in order to
support competitive behaviours. A deregulated market would not necessarily produce superior
efficiencies (particularly dynamic efficiencies) if market forces were left to their own devices,
essentially owing to the domination of the national utility. In a competitive electricity market,
market rules, strict regulations and continued monitoring are essential. However, the focus of
these activities changes from suppressing or replacing market forces to promoting competition
and encouraging new entry. For effective competition to materialise, “the government [must
ensure] that consumers can access the information necessary to make intelligent choices, and
provide the tools and structure to create a competitive market” (Khan, 1990:353).
3.1. The institutional and legislative framework
3.1.1. Institutional arrangements: Who calls the shots?
The regulatory framework of South Africa’s electricity sector comprises a wide array of
stakeholders, from government departments, to the independent regulator, to regulated entities
and end-user consumers.
While not central to the direct regulation of the sector, economic ministries, such as the National
Planning Commission (NPC), the Department of Trade and Industry (the dti) and the EDD,
provide the overall framework in which the electricity sector is to operate. The regulation and
operation of the ESI have substantial macroeconomic, industrial and developmental impacts
beyond the energy sector and must be aligned to broader governmental priorities, particularly in
terms of economic growth strategies, job creation, local manufacturing capability, and poverty
and inequality eradication.
The core regulation of the ESI mainly rests in the realm of four state entities: DoE, the DPE, the
NT and most importantly NERSA.

Page 21 of 137
First, the DoE, through its Minister, has the mission to “regulate and transform the sector for the
provision of secure, sustainable and affordable energy” (DoE, 2013c). The Department aims to
“formulate energy policies, regulatory frameworks and legislation, oversee their implementation
to ensure energy security, promotion of environmentally-friendly energy carriers and access to
affordable and reliable energy for all South Africans” (DoE, 2013c). According to the National
Energy Act No. 34 of 2008, the DoE is directly responsible for: energy planning; increased
generation and consumption of renewable energy; contingency energy supply; the holding of
strategic energy feedstock and carriers; adequate investment in appropriate upkeep and access
to energy infrastructure; measures for the furnishing of certain data and information regarding
energy demand; supply and generation; and the establishment of an institution to be responsible
for the promotion of efficient generation and consumption of energy and energy research (DME,
2008a). Under the Electricity Regulation Act No. 4 of 2006, as amended by the 2009 Electricity
Regulations on New Generation Capacity, the DoE is further empowered to set the framework
for the establishment of IPPs in the country (DME, 2006; DoE, 2009). The DoE is also
responsible for developing the Integrated Energy Plan (IEP) and the Integrated Resource Plan
(IRP) to be executed by Eskom.
Second, the DPE governs Eskom through an annual shareholder compact which documents the
mandated key performance measures and indicators to be attained by the SoE (as agreed
between the Eskom’s Board of Directors and the DPE).4 The department has a 100%
shareholding in the utility and appoints the SoE’s Board, therefore directly influencing Eskom’s
decisions. As Eskom’s sole shareholder, the DPE directly oversees Eskom’s operations
(including the performance and benchmarking of electricity generation, transmission and
distribution with a particular emphasis on security of supply), provides strategic financial and
transactional analysis (assistance in developing a long-term funding plan as well engaging with
other financial institutions), and monitors the SoE’s capital investment programme (DPE, 2012).
Third, the NT plays the multiple roles of ensuring the country’s macroeconomic stability and the
policy coherence in the energy sector, providing finance to both Eskom and the municipalities,
and delivering technical assistance to the DoE.
As the heart of South Africa’s economic and fiscal policy development and the institution
responsible for coordinating macroeconomic policy and promoting the national fiscal policy
framework (notably through the coordination of intergovernmental financial relations, and the
management and implementation of budgets), the NT plays a critical role in the oversight and
management of the ESI. The NT is for example spearheading the discussions around the
probable introduction of an economy-wide carbon tax in the country (as of 1 January 2016),
which will have substantial consequences for the electricity sector. Via the public-private
4 The compact serves to promote and encourage good governance practices within Eskom, by assisting
to clarify the respective roles and responsibilities of the Board and the shareholder, setting out the circumstances when shareholder approval is required, when the shareholder needs to be consulted, and the remaining areas where the Board is duly empowered to direct the organisation (Eskom, 2013a).

Page 22 of 137
partnership unit, the NT is also assisting the DoE in the creation of a stable enabling market
environment for IPPs and the implementation and support of specific IPP projects.
The Treasury aims at ensuring the sustainability of the electricity path and the optimal medium-
to long-term infrastructure investment programme. The NT models and analyses NERSA’s
rulings on Eskom’s tariff application, particularly in light of the impact of electricity price increase
in inflation. It reviews Eskom’s long-term electricity price path and produces tariff
recommendations with the DoE and the DPE. It also engages with Eskom on the financial
requirement to support tariff recommendations.
The NT also provides funding for the recapitalisation of Eskom and monitors the electricity
sector as the whole, particularly Eskom’s build programme. It also conducts feasibility studies
(such as, in the 2012/2013 financial year, on the use of gas, nuclear and regional hydropower
for electricity generation). The NT provides and monitors guarantees granted to Eskom so that
the SoE can access finance for its generation expansion programme. Eskom makes up
ZAR 103.5 billion out of ZAR 179.4 billion (i.e. 57.7%) of the total government guarantee
portfolio in the 2012/2013 financial year. At the local level, the NT plays a direct role in
influencing municipal prices through the level of direct and indirect intergovernmental transfers
and grants to municipal distributors, Free Basic Electricity grant and the National Electrification
Programme.
Fourth, NERSA is the institution responsible for the direct regulation of the energy sector in
South Africa. NERSA, which was established in its current form in 2005 as per the National
Energy Regulator Act No. 40 of 2004, replaced the NER and amalgamated under one roof the
regulation of the electricity, piped gas and petroleum pipeline industries.5 While the Energy
Regulator (which consists of four full-time and five part-time members) is appointed by the
Minister of Energy, the institution (i.e. the Energy Regulator and its Secretariat) operates
“independently of any undue influence or instruction” (DME, 2004).6 NERSA operates as the
custodian and enforcer of the regulatory framework for the energy sector in South Africa. It has
the mission to “regulate the energy industry in accordance with government laws and policies,
standards and international best practices in support of sustainable development” (NERSA,
2013a). As set out in the Electricity Regulation Act No. 4 of 2006 (see Box 1), the regulator is
mandated to regulate market entry (licensing) as well as oversee the conduct of, and tariffs for,
electricity sector participants. NERSA’s key functions include issuing licenses for generation,
transmission, distribution and the retail of electricity; determining electricity prices; settling
5 The NER itself replaced the Electricity Control Board (ECB), an old-style regulator, in 1995. The ECB
was set up through the 1922 Electricity Act. It had the power to regulate private producers (including
Eskom) but had no regulatory authority over self‐generators, municipalities and the railways. 6 Regulatory independence is not absolute and regulators are not intended to be a law unto themselves.
Regulators are typically required to function within specific legal mandates and policy frameworks established by governments, and mechanisms should be established to ensure that they remain within their mandates and are accountable for performance (Steyn, 2012).

Page 23 of 137
disputes; performing inspections of the equipment; and advising the Minister of Energy on
matters pertaining to the electricity supply industry.
Source: Electricity Regulation Act No. 4 of 2006
In addition to these four key institutions, environmental ministries, namely the Department of
Environmental Affairs (DEA) and the Department of Water Affairs (DWA), play a role in the
regulation of the sector. Both departments monitor and regulate the environmental impacts
(such as greenhouse gas emissions, ecosystems degradation, waste management and water
use) of Eskom’s operations. For example, Eskom must be granted the appropriate
environmental authorisations and licenses/permits to build power stations, major power lines
and substations.
Last but not least, regulated entities (Eskom, IPPs) and main electricity consumers
(municipalities and industrial users) are powerful stakeholders involved in the regulation of the
sector.
Eskom, as the vertically integrated state-owned utility company and the main regulated entity,
has an influence on the regulation and its effectiveness. Eskom’s mission is to “provide
sustainable electricity to grow the economy and improve the quality of life of people in South
Africa and the region” (Eskom, 2013b). The Eskom Conversion Act No. 13 of 2001 converted
Eskom from a statutory body into a public company on 1 July 2002. As highlighted earlier,
Eskom concludes an annual shareholder compact in consultation with the DPE. However, the
compact is not intended to interfere with normal company law principles. The Board remains
Box 1: NERSA's mandate
The Regulator- (a) must-
(i) consider applications for licenses and may issue licences for- (aa) the operation of generation, transmission and distribution facilities; (bb) the import and export of electricity; (cc) trading;
(ii) regulate prices and tariffs; (iii) register persons who are required to register with the Regulator where they are not required to hold a licence; (iv) issue rules designed to implement the national government's electricity policy framework, the integrated resource plan and this Act; (v) establish and manage monitoring and information systems and a national information system, and co-ordinate the integration thereof with other relevant information systems; (vii) enforce performance and compliance, and take appropriate steps in the case of non-performance;
(6) may- (i) mediate disputes between generators, transmitters, distributors, customers or end users; (ii) undertake investigations and inquiries into the activities of licensees; (iv) perform any other act incidental to its functions.

Page 24 of 137
responsible for ensuring that proper internal controls are in place and that Eskom is effectively
managed (Eskom, 2013a, 2013b). As the dominant player of the electricity sector, Eskom is
actively involved in the regulation and reform of the sector. Eskom engages directly with NERSA
and relevant government departments to shape the regulation of the sector. For example,
Eskom is involved in the generation planning process. As detailed in Table 2 below, the SoE is
part of the task team that determines the IRP. It also contributes to the definition of the plan
through the use of its internal data and modelling tools.
In addition to Eskom, IPPs, gathered in the South African Independent Power Producers
Association (SAIPPA), are increasingly involved as role players in the ESI by way of
consultation in the procurement process development, particularly at the generation (as
electricity producers) and transmission (as network users) stages of the value chain. Increased
stakeholder consultation has opened the door for IPPs to lobby regulators and attempt
influencing regulation in their favour.
Both public and private large electricity consumers, whose business models are based on a
steady supply of affordable electricity, have also a noteworthy influence on the way the ESI is
regulated. The Energy Intensive Users Group of Southern Africa (EIUG), which gathers 32
private and public groups, consumes an estimated 44% of the country’s electricity. The EIUG
has vested interest in ensuring the country’s security of supply as well as affordable electricity
for industrial purposes, and is actively involved in the evolution of the regulatory framework
through continual engagement with, and official submissions to, the main regulatory institutions
(notably NERSA). Likewise, the South African Local Government Association (SALGA) and the
Association of Municipal Electricity Undertakings (AMEU), which represent local government,
and collectively constitute the single largest buyer of electricity from Eskom, are directly involved
in political processes that influence Eskom’s decisions.
The composition of the DoE Task Team for the development of the IRP 2010, detailed in
Table 2 below, illustrates the clout of these non-regulatory stakeholders, structured in
concentrated and well-organised interest groups with the aim of maximising their influence and
impact on decision-making processes.
Thus, energy-intensive users are directly involved in the planning process with 7 out of the 17
original task team members (i.e. more than 40%) related to the EIUG.7 Likewise, IPPs (through
the SAIPPA) and large municipalities (with City Power Johannesburg) are part of the task team
responsible for supervising energy planning in the country.
7 In 2010, Mike Rossouw (Xstrata), Ian Langridge (Anglo American), Brian Day (Exxaro), Piet van Staden
(Sasol), Kevin Morgan (BHP Billiton), Roger Baxter (Chamber of Mines) and Shaun Nel (Gobodo Incorporated) were all related directly to the EIUG itself or to companies which were members of the EIUG.
Page 25 of 137
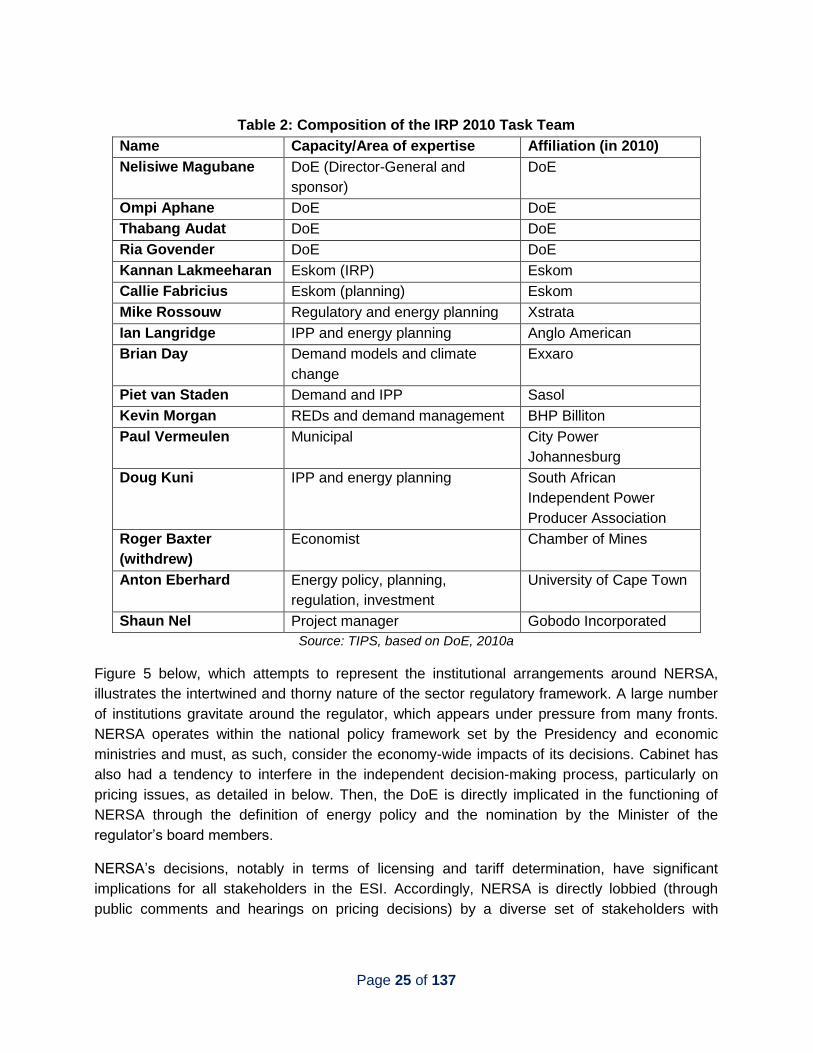
Table 2: Composition of the IRP 2010 Task Team
Name Capacity/Area of expertise Affiliation (in 2010)
Nelisiwe Magubane DoE (Director-General and
sponsor)
DoE
Ompi Aphane DoE DoE
Thabang Audat DoE DoE
Ria Govender DoE DoE
Kannan Lakmeeharan Eskom (IRP) Eskom
Callie Fabricius Eskom (planning) Eskom
Mike Rossouw Regulatory and energy planning Xstrata
Ian Langridge IPP and energy planning Anglo American
Brian Day Demand models and climate
change
Exxaro
Piet van Staden Demand and IPP Sasol
Kevin Morgan REDs and demand management BHP Billiton
Paul Vermeulen Municipal City Power
Johannesburg
Doug Kuni IPP and energy planning South African
Independent Power
Producer Association
Roger Baxter
(withdrew)
Economist Chamber of Mines
Anton Eberhard Energy policy, planning,
regulation, investment
University of Cape Town
Shaun Nel Project manager Gobodo Incorporated
Source: TIPS, based on DoE, 2010a
Figure 5 below, which attempts to represent the institutional arrangements around NERSA,
illustrates the intertwined and thorny nature of the sector regulatory framework. A large number
of institutions gravitate around the regulator, which appears under pressure from many fronts.
NERSA operates within the national policy framework set by the Presidency and economic
ministries and must, as such, consider the economy-wide impacts of its decisions. Cabinet has
also had a tendency to interfere in the independent decision-making process, particularly on
pricing issues, as detailed in below. Then, the DoE is directly implicated in the functioning of
NERSA through the definition of energy policy and the nomination by the Minister of the
regulator’s board members.
NERSA’s decisions, notably in terms of licensing and tariff determination, have significant
implications for all stakeholders in the ESI. Accordingly, NERSA is directly lobbied (through
public comments and hearings on pricing decisions) by a diverse set of stakeholders with

Page 26 of 137
different and sometimes conflicting interests, from Eskom and IPPs to civil society and large
industrial users.
Moreover, NERSA’s ability to make decisions heavily relies on other stakeholders. NERSA is
directly dependent on information, data and knowledge provided by Eskom (such as demand
forecast, generation costs) and the municipalities (such as distribution costs). In the absence of
cooperation and reliable submission from the utility and municipal distributors, NERSA does not
hold the relevant information and capability (in terms of modelling for example) to ensure
evidence-based and cost-effective decision-making.
Figure 5: NERSA's direct relationship network in the electricity supply industry
Source: TIPS
In conclusion, the vast number of stakeholders involved in the regulation of the ESI, often with
competing interests, influences both directly and indirectly the governance and decision-making
processes in the sector. The complex (and sometime opaque) relationships, and their nature
(power relations), between these various entities shape the policies regulating the electricity
sector as well as their implementation. It renders the mission of NERSA problematical as the
regulator is at the centre of a highly contested space. Having to rely on information and
expertise from other stakeholders further complicates NERSA’s independent decision-making.

Page 27 of 137
3.1.2. Legislative framework: A very complex picture
Against this thorny institutional structure, South Africa benefits from a large legislative and legal
framework governing the ESI, as illustrated in Figure 6 below. While the whole body of
documents impacting the electricity sector in South Africa is cumbersome, a key set of
legislations frames the sector. It encompasses legislation, both affecting the whole ESI (such as
the Eskom Conversion Act No. 13 of 2001, the National Energy Regulator Act No. 40 of 2004
and the Electricity Regulation Act No. 4 of 2006) or a specific stage in the value chain (such as
the Municipal Fiscal Powers and Function Act No. 12 of 2007 at the distribution level), as well as
aspirational and working documents (such as the IRP and the 2003 White Paper on Renewable
Energy).
Figure 6: Legislative framework for the electricity supply industry in South Africa
Source: TIPS
The National Energy Regulator Act No. 40 of 2004 establishes NERSA as a single regulator to
regulate the electricity, piped-gas and petroleum industries and defines the functions,
composition, duties, powers and operational mechanisms of NERSA. As already detailed in Box
1 above, NERSA’s mandate and functions are further sketched out in the Electricity Regulation
Act No. 4 of 2006, which establishes the national regulatory framework for the ESI in relation to
licences and registration for generation, transmission, distribution, trading and the import and
export of electricity.
Then, the Electricity Regulation Amendment Act No. 28 of 2007 provides for the Minister of the
then-Department of Minerals and Energy (DME) to make regulations on activities that must be

Page 28 of 137
licensed or registered, the norms and standards relating to quality of supply, new generation
capacity, the types of energy sources from which electricity must be generated, the percentages
of electricity that must be generated from different energy sources, the participation of the
private sector in new generation activities, the setting of standards relating to health, safety and
the environment and their incorporation into licences or national norms and standards; the
prohibition of certain practices in the electricity supply industry; the criteria for prohibition of
cross-ownership or vertical and horizontal integration by licensees in generation, transmission
and distribution assets. The amendment was essentially passed to give the Minister executive
authority to finalise the procurement process for approximately 1 000 MW of peaking capacity,
which the DME started in 2005. However, the amendment is not well crafted as it gives “very
little guidance as to how future planning and allocation decision making would be undertaken. In
effect, the amendment empowered the Minister with planning, allocation and procurement
functions without taking these away from Eskom, thereby creating a dual system” (Pickering,
2008)
With regards to electricity planning, the IRP, developed by the DoE, lays out the proposed
generation new build fleet for South Africa for the period 2010-2030. It was promulgated in its
revised version in May 2011. The 2011 IRP was adjusted from a cost-optimised scenario
developed under a carbon emission constraint for the power sector, incorporating localisation
objectives and bringing forward the renewable roll-out. In addition to all existing and committed
power plants, the plan includes 17.8 GW of renewables (8.4 GW of solar photovoltaic, 8.4 GW
of wind and 1 GW of concentrated solar power), accounting for 42% of all new build generation
to 2030 (42.6 GW). Nuclear energy (9.6 GW) and coal (6.3 GW) also accounts for substantial
shares of the new generation capacity considered under the IRP. The plan also takes into
account a total of 3 420 MW saved due to energy efficiency demand-side management. The IRP
is considered a “living plan” to be revised every two years, i.e. March 2013. In order to conduct
such belated review by March 2014, the DoE published in November 2013 an update to the IRP
for public comments. The updated version of the IRP relies on revised assumptions in terms of
economic growth, future demand, technology options and costs, performance of Eskom’s fleet
and the potential for extending economic life of existing fleet. Most notably, the update assumes
an ambitious average growth rate of 5.4% per annum until 2030, in line with the aspirational
target of the National Development Plan, as well as a shift in economic development away from
energy-intensive industries which is assumed to dramatically reduce the electricity intensity of
the economy. In turn, the demand in 2030 is projected to be in the range of 345-416 TWh as
opposed to 454 TWh expected in the existing IRP, resulting in a reduction of the required
installed capacity in 2030 from 89.5 GW to 81.4 GW. This might however underestimate the
suppressed demand created by the existing electricity shortage. The 2013 update also
considers new developments in terms of technology and fuel options (locally and globally,
particularly with regards to nuclear energy, renewable energy and gas), scenarios for carbon
mitigation strategies and the impact on electricity supply beyond 2030, and the affordability of
electricity and its impact on demand and supply beyond 2030.

Page 29 of 137
The updated IRP advocates that:
- new nuclear baseload capacity would not be required before 2025, if not 2035, and that
alternative options, such as regional hydropower and shale gas, could fulfil the
requirements. Overall, the update proposes to decrease generation capacity for nuclear
energy from 11.4 GW in the current IRP to 6.6 GW;
- the procurement for a new set of fluidised bed combustion coal generation should be
launched for a total of 1000-1500 MW capacity, instead of pursuing the route of another
large project (the so-called Coal 3 power station);
- regional hydropower projects in Mozambique and Zambia, as well as regional coal
options, should be pursued;
- regional and domestic gas options should be pursued and shale exploration stepped up;
- the current renewable energy programme should be continued, with additional annual
rounds (of 1 000 MW capacity for solar photovoltaic (PV); 1 000 MW for wind and
200 MW for concentrated solar power (CSP)), with the potential for hydropower at
competitive rates;
- a standard offer approach should be developed to purchase energy from embedded
generators at a set price;
- additional analysis on the potential of extending the life of Eskom’s existing fleet should
be undertaken;
- funding and appropriate mandate for energy efficiency and demand side management
programmes be formalised and secured.
The publication of the 2013 update of the IRP has triggered a wide array of comments on
various aspects of the draft revision.
The revision of future demand (although downward) and the underlying economic growth
forecast have been characterised by University of Cape Town Energy Research Centre director
and National Planning Commission member Professor Anton Eberhard as remaining highly
aspirational in nature, South Africa’s economy growing far slower and electricity demand having
declined to 2006 levels. At the same time, the EIUG advocates for a “more realistic return-to-
growth profile,” while the Nuclear Industry Association of South Africa (NIASA) and the SAIPPA
caution against artificially low demand from large power consumers. Overall, the necessity of
regular updates of the demand assumptions, such as every one or two years, has been stressed
in order to ensure appropriate levels of production.
The proposal for ‘decisions of least regret’, i.e. that long-term commitments be avoided in favour
of building only the minimum generation capacity required, has also raised some mixed
reactions, particularly from the advocates of nuclear energy. The revised ‘base case’ in the 2013
draft update proposes only 6 660 MW of nuclear capacity (including the Koeberg power plant of
1 800 MW) by 2030, instead of the 11 400 MW under the current IRP. This is partly due to the

Page 30 of 137
recommendation of USD 6 500/kW price cap for any new nuclear capacity. While the capital
costs associated with the new nuclear plant being planned for Hinkley Point in the United
Kingdom are around USD 7 900/kW, well above the suggested cap, the future role of nuclear
energy in South Africa remains a highly political rather than rational issue. In addition to
contesting the assumptions about Levelised Costs of Electricity (LCOE)8 of various technologies
and fuel sources, NIASA argues that the price cap places too much emphasis on the overnight
costs and should be replaced by a cap on the LCOE determined by the combined effects of
weighted average cost of capital, overnight costs, external costs and system costs.
Nevertheless, the proposal to delay and scale back nuclear as well as to set a capital-cost cap
has been heralded as a sound one by most analysts, particularly in light of the current project
management issues at Medupi and Kusile, as well as the future role of gas, particularly the
possibility that shale gas could be a “potential game changer if managed correctly” (Creamer,
2014).
Gas, in turn, appears to be a clear beneficiary of the revisions made in the IRP update, with a
target of 3 550 MW set for closed cycle gas turbines, up from 2 370 MW in the current plan. This
new allocation has nonetheless been deemed as conservative by some industry players
(Gigajoule Group CEO Johan de Vos for example called for a revised target of 5 000 MW in light
of recent discoveries in Mozambique), although securing a stable supply of gas, whether in the
form of shale gas or from Mozambique, and ensuring the construction of necessary
infrastructure, will be vital for this target to be met.
Revisions to the mix of renewable energy technologies, which put greater emphasis on solar
over wind, have also engendered mixed reactions, partly due to aggressive learning curves for
solar technologies. While solar energy is becoming increasingly competitive, wind technologies
are mature and economical. At an average cost of ZAR 0.74/kWh in the third round of the
REIPP procurement programme, wind energy currently offers the lowest price per kWh among
renewable energy technologies and is almost 30% below the likely cost of electricity to be
supplied by the Medupi coal-fired power station. Additionally, according to the South African
Wind Energy Association, “[t]he modelling proceeds implicitly as if all energy plants will be built
on the country’s balance sheet. The enormous risk and opportunity costs of Eskom building are
disregarded for modelling purposes,” discarding the success of IPPs in delivering projects.
Consensus seems to emerge on the performance of Eskom’s fleet and the proposal that an IPP
procurement programme be pursued for fluidised-bed-combustion coal generation instead of
another mega-project. On the potential life extension of Eskom’s fleet, while caution was raised
on the economic viability and feasibility of retrofitting flue-gas desulphurisation at the plants as
well as securing adequate coal sources, security of supply purposes may well command the
lifetime extension of existing power plants and overshadow other considerations.
8 LCOE: Levelised Cost of Electricity (where price per unit of output where PV of life cycle revenue = PV of total life cycle costs)

Page 31 of 137
In terms of pricing, the MYPD methodology was developed for the regulation of Eskom’s
required revenues. This is discussed in Chapter 4.
In 2008, the Electricity Pricing Policy (EPP) (DME, 2008b) further set out guidelines for the
setting of electricity prices in South Africa. It aims to ensure the long-term sustainability of the
ESI by providing the ability to fund investment in generation capacity through the implementation
of cost-reflective tariffs (based on a depreciated replacement valuation of assets). The EPP
does not prescribe the exact manner in which electricity tariffs should be determined, but rather
outlines a number of key principles and a methodology to be employed for this determination.
NERSA is allowed to interpret this policy in setting the specific methodology for price
determination. This is also discussed in Chapter 4.
Furthermore, at each level of the electricity value chain, key legislations reflect some of the key
issues and challenges with which the industry has been grappling.
First, at the generation stage, the introduction of IPPs into the market, particularly for the
generation of electricity based on renewable energy, remains the main matter. The Electricity
Regulation Act No. 4 of 2006, as amended by the 2009 Electricity Regulations on New
Generation Capacity, provides the regulation for the entry of IPPs onto the market. Coupled with
the 2003 White Paper on Renewable Energy, which set a contribution target of 10 000 GWh of
renewable energy to final energy consumption by 2013, the 2009 regulations paved the way for
the introduction of renewable energy and IPPs in the country. In 2011, the IRP then enacted the
scale up of renewable energy, planning for the installation of 17.8 GW of new capacity from
solar and wind energy from 2010-2030. After years of uncertainty and inconsistency,
procurement processes concretised in 2011 with the launch of the renewable energy
independent power producer (REIPP) procurement programme. While an original target was set
at 3 625 MW from 2011-2014, the programme has already procured for 3 969.4 MW by
November 2013 and a second ministerial determination provided for an additional 3 100 MW by
2020. A similar programme for baseload generation capacity is also being designed at the
moment by the DoE and the NT.
The second generation-specific issue pertains to a more low-carbon and environmentally-
friendly energy mix, in line with the country-wide transition to a green economy. The 2011 IRP
provides for a reduction of the share of coal-based electricity from 90% in 2010 to 65% in 2030.
In addition, power plants are meant to comply with environmental requirements as set by the
National Environmental Management Act (NEMA) and other key legislation (such as the Air
Quality Act and the Water Act).
Second, at the transmission stage, key legislations deal with the introduction of an unbundled
(i.e. outside of Eskom) ISMO to invest, operate and maintain the country’s high voltage
transmission grid. Going forward, the introduction of an unbundled ISMO may further accelerate
the development of renewable energy in the country, empowering IPPs to sell electricity directly
to third party consumers, such as mining and industrial complexes.

Page 32 of 137
While the 2009 Electricity Regulations on New Generation Capacity split the six functions of a
system operator (planning, allocation, procurement, buyer, system operator, transmission)
between Eskom, the Minister of Energy and the Minister of Finance, they do not however
identify the entity responsible for the buyer function. This function is currently carried out by a
fully ring-fenced ISMO within Eskom’s System Operations and Planning Division. On 6
September 2009, Cabinet designated Eskom as the single buyer from IPPs, but no policy
explaining the market architecture of the ESI in detail has been published as yet, leaving unclear
the role and function of the ISMO. Some policy statements indicate that an ISMO will be created
separately from Eskom to act as a single buyer of electricity, removing potential conflict of
interest as both a buyer and a seller of electricity. Other policy statements indicate that an ISMO
will also be responsible for planning, procurement and scheduling of generation. The ISMO Bill
is meant to consolidate policy and address discrepancies by establishing the ISMO as a national
public entity, responsible for: (a) generation resource planning in accordance with the IRP; (b)
transmission service and implementation; (c) buyer of power from generators, including Eskom,
co-generators and IPPs; (d) system operations and expansion planning; and (e) electricity
trading at a wholesale level.
The ISMO Bill was published by the DoE on 13 May 2011 for public comments (DoE, 2011a),
approved by Cabinet on 16 March 2011 (GCIS, 2011) and tabled for Parliament in the same
month. The Bill was revised and re-submitted in Parliament in March 2012 (DoE, 2012b). While
the ISMO Bill has been discussed and agreed on by the Portfolio Committee on Energy at two
occasions, it has been stalled in Parliament, being removed from the National Assembly Order
Paper twice in June and November 2013 (Pressly, 2013). In March 2014, the motion to revive
the ISMO Bill was once again dismissed.
The introduction of an ISMO would open the door for customers to choose their suppliers, i.e.
Eskom or an IPP9 (Abrahams et al., 2013). The creation of an ISMO outside Eskom, although
remaining fully-owned by Government, would contribute to levelling the playing field by
eliminating the potential bias created by the current structure in which the DoE procures energy
and trading occurs within Eskom (Unlimited Energy, 2013). However, the current version of the
Bill does not cater for the transfer of transmission assets from Eskom to the ISMO. The
ownership of the transmission grid by the ISMO is essential to avoid conflicts with Eskom.
In the proposed structure, on the one hand, the ISMO would be tasked with procuring sufficient
electricity from a variety of generators, but would rely on a high voltage transmission grid owned
and maintained by Eskom. On the other hand, Eskom would maintain its monopolistic position
on generation while retaining ownership and competency over the maintenance of the high
voltage and distribution grids under its control. This setting does not allow the ISMO to be truly
independent from Eskom, which would be in a position to maintain its control over the ESI.
9 This would also allow companies to potentially avoid carbon taxation by preferring renewable energy
producers.

Page 33 of 137
NERSA would then be responsible for setting tariffs for the electricity purchased by the ISMO
from Eskom, the transmission charges that Eskom would levy against the ISMO for the
electricity transmitted, and Eskom’s charges for connecting IPPs to the grid, as well as
establishing rules for the maintenance and extension of the grids owned by Eskom but operated
by the ISMO. This situation could open the door for numerous conflicts of interest between the
ISMO and Eskom, which would have to be settled by the regulator, and limit the ability for IPPs
to play a stronger role on the South African electricity market outside of government-run
programmes (Davie, 2013).
Against these considerations around the potential for unfair operation of an Eskom-operated
ISMO, strong contention remains on the impact the ISMO Bill could have on Eskom’s balance
sheet (depending on how the assets are liabilities are valued). In addition, concerns have been
raised about the DoE’s capacity to manage the transition (and oversee an ISMO) and the
difficulty of creating a new institution and getting it to work efficiently within planned timeframes.
Last, at the distribution end of the ESI, the main issues pertain to the funding model of
municipalities and the impact on electricity prices, as described in detail in Chapter 5. The
Constitution grants municipalities the executive authority, and the right, to administer electricity
reticulation. Based on this constitutional mandate, the Local Government Municipal Systems Act
No. 32 of 2000 prescribes the principles for the determination of tariffs by municipalities, de facto
allowing municipalities to set electricity prices within their jurisdiction. While the Municipal
Finance Management Act No. 56 of 2003 Act provides for the NT to monitor the pricing structure
for the supply of electricity by municipalities, the Municipal Fiscal Powers and Function Act
No. 12 of 2007 authorises local governments to impose surcharges over and above NERSA’s
price determination.
3.2. Key problems in the regulation of the electricity supply industry
The complexity of the regulatory framework of the ESI and the associated institutional
arrangements brings a number of issues which have hampered the performance of the
regulation over the years. From the deficiency of policy learning and the lack of policy
consistency over time to the problems of clarity and certainty about functions and mandates to
the dearth of a vision for the ESI, many issues must be addressed in order to improve the
operations of the ESI.
3.2.1 Looking back: The deficiency of policy learning
Policy process, building on the work of Lasswell (1956), can be chronologically divided between
agenda-setting, policy formulation, decision-making, implementation and evaluation (eventually
leading to redesign or termination). As policy-making is meant to participate in problem solving
or to the very least, a reduction in problem load, the evaluation of policies against their intended
outcomes, objectives and impacts is instrumental to policy learning and ultimately problem
solving.

Page 34 of 137
In the electricity space, the South African Government has displayed a chronic inability to
capitalise policy learnings. For example, the historical analysis of electrical generation building in
South Africa highlights the repetition of a similar faulty pattern despite the commissioning of
several assessments. As Steyn (2006) emphasises, “Eskom simply has not been able to supply
the right amount of power capacity since the late 1960,” essentially due to the utility’s inability to
address the uncertainty around future demand and the risks associated with technology and
investment choices.
Between 1974 and 1978, electricity prices rose by 70% in real terms due to capacity shortage,
along with increasingly frequent load shedding up to 1981. In response, Eskom started a large
new-build programme (see Chapter 4). By 1983, the SoE had 22.26 GW of generation capacity
under construction or on order (Steyn, 2006). Failure to properly plan and oversee investment
decisions resulted in an excessive capacity expansion programme and gross inefficiency in
investment by Eskom (Kessides et al., 2007). In order to service Eskom’s soaring debt, cost was
passed on to consumers, leading to steep average nominal price increases in the 1980s (Steyn,
2003) while the SoE benefited from a monopoly position, government guarantees, open-ended
Reserve Bank forward cover and an exemption from taxes and dividends.
Repeating the pattern witnessed in the 1970-1980s, the South African Government, through
Eskom, started in 2005 a mammoth generation expansion programme valued at
ZAR 340 billion, excluding capitalised borrowing costs (Eskom, 2013b). By 2018/2019, the
programme will add 17.1 GW of capacity to the 2005 nominal generation capacity of 36.2 GW
(Eskom, 2013b). As explained below, this reaction to the exacerbated vulnerability of the system
was moreover belated, thus not adequate to prevent the 2008 crisis. Although the programme
considers the objectives of the latest IRP, especially the need to diversify the technology and
fuel mix of generation, technology choices were predominately influenced by the objective of
‘keeping the lights on’ at the cheapest cost (at the time of decision-making). Hence, the
programme favours large coal-fired generation plants. While the programme is a couple of years
behind schedule, 6 017 MW of capacity had been added to the network by March 2013. As in
the 1980s, the financing requirements of this colossal investment programme have contributed
to pushing prices up, ultimately resulting in a trebling of the average standard price at 89.13
c/kWh from 2009/2010 to 2017/201810 (NERSA, 2013b, 2010).
Between the two incidences, many reviews of the electricity sector and its regulation were
however conducted and, most notably, two official investigations were conducted in order to
improve Eskom’s operations (Rustomjee, 2013, also discussed in Chapter 4).
First, consumer protests following steep price increases in the 1970s as well as heightened
concerns from stakeholders in the ESI over Eskom’s financial management and supply-demand
10
This is the result of successive average standard price increases of 24.8% in 2010/2011, 25.8% in 2011/2012, 25.9% in 2012/2013, and 8% annually from 2013/2014 to 2017/2018.

Page 35 of 137
forecasting ability called for stronger oversight and regulation of the utility. This directly resulted
in:
the passing of the 1977 Electricity Amendment Act which authorised Eskom to increase
the size of its Capital Development Fund in order to finance the expansion programme;
the empowerment of the Minister of Industries to allocate up to 3% of Eskom’s income to
a subsidy programme supporting energy‐intensive export industries (Marquard, 2006);
and
the commissioning in 1977 of an investigation by the Board of Trade and Industries (BTI)
into electricity tariffs.
The BTI had to manage different interests and contesting views in the ESI. Eskom considered
that, as the supplier of last resort, it should be in a position to unilaterally take the necessary
(tariff) decisions to finance the generation expansion programme. In 1977, in the middle of the
BTI’s investigation, Eskom then announced a 48% tariff increase, discarding the ongoing review
process. At the time, the Eskom Act required Eskom to break even each year (i.e. not make a
loss or a profit) and Eskom was setting tariff unilaterally, the ECB only approving Eskom’s tariff
structure.11
The BTI reported its conclusions in 1978, a stronger regulation of both Eskom and
municipalities. It called for changes in Eskom’s calculation of costs (notably in terms of cost
inflation, reserve margin and maintenance systems), the management of capital expenditure,
Eskom’s operating model (to allow Eskom to make profits and losses on an annual basis), the
regulation of municipalities (mainly in terms of the transparency of accounting systems) and the
regulatory framework (to increase of the capacity of the ECB). Particularly, the BTI called for
capital expenditure for national capital projects from Eskom and other state institutions to be
collectively prioritised by a higher-level body within the Department of Finance and approved by
Cabinet only. It also recommended that the financing structure of new capacity be revised in
order to better regulate internal funding and prevent the automatic pass-through to consumers of
future capital expenditure.
While the Electricity Amendment Act of 1979 increased the capacity of the ECB (moving to 5-7
Board members and increasing the ECB’s budget), many of the BTI’s recommendations were
ignored due to contending institutional interests and power relations. Municipal
recommendations were not validated and Eskom successfully managed to retain its autonomy
from regulation and state oversight by pre-empting the BTI’s recommendations in terms of
organisation structure and putting forward artificially low price increases for the 1979-1982
period. Unexpected supply shortages in the late 1970s and early 1980s12 also removed the
11
With one staff member only and 3‐5 Board members, the ECB had little capacity to seriously engage Eskom on its tariffs. 12
In the late 1970s and early 1980s, Eskom experienced the loss of reliable supply from Cahora Bassa (owing to apartheid‐supported sabotage in Mozambique), problems in starting up the new large power stations and delays in construction of the Koeberg plant from 1978 to 1985.
Page 36 of 137
issue of overcapacity that had arisen in the debate through the BTI’s recommendations and
strengthened Eskom’s institutional role (Marquard, 2006).
Second, further electricity price increases in the early 1980s prompted the Department of
Mines13 to institute a Commission of Inquiry into the Provision of Electricity in South Africa (also
known as the De Villiers Commission after Dr Wim De Villiers, the then-Managing Director of
Gencor14 who headed the Commission) in 1982. The De Villiers Commission proposed
significant changes to the national electricity governance system which represented, according
to Rustomjee (2013), the first significant shift in the relationship of power in favour of large
industrial and municipal users over the utility.15 By 1985, large users (essentially the mining and
mineral processing sectors) and municipalities were given seats on the Electricity Council (i.e.
the equivalent of Eskom’s Board). This triggered a greater oversight of the utility and enabled
main customers to exert influence on Eskom’s strategic direction, expenditure and income.
By the late 1980s / early 1990s, Eskom faced severe pressure to reduce prices (in real terms)
as soon as declining debt levels would allow it (Steyn, 2003). Ultimately, increased internal
efficiency and huge excess generation capacity (due to the economic downturn and the
commissioning of new power stations in the 1980s) allowed Eskom to reduce real electricity
price increases for the 15 years thereafter, paving the way for the repetition of impaired
decision-making.
The replication of a sub-optimal investment pattern could have been avoided through effective
(i.e. implemented) policy learning. Unfortunately, changes triggered by these evaluations and
assessments were insufficient. While the move to consider other stakeholders’ interests and
establish more stringent regulation were welcome steps towards imposing a more efficient
approach to investment and management, the ownership and governance structure of the
sector, and the absence of appropriate adaptation from Government, has maintained a situation
of lax and ill-informed oversight, gearing the ESI towards constant inadequate investment
decisions, and eventually repeated cycles of under- and over-investment. Reflecting on the
inappropriateness of the 1970-1980 schema, a proactive strategy for new generation capacity
based on timely progressive building and matching demand trends and forecasts would have
delivered a much smoother price trajectory.
13
By 1983, the global downturn, along with inflationary pressures on labour, electricity and other input costs, high interest rates and a deteriorating exchange rate, had adversely impacted on South Africa’s mining and industrial output. 14
Gencor is the product of a 1980 merger between General Mining and Finance Corporation and Union Corporation, both of which were founded in the 19th century. 15
Other outcomes of the commission included the establishment of a national tariff, the consolidation of
six licenses into one and the granting of the Eskom National License to Eskom in 1986 in terms of the
Electricity Act. It also highlighted the need for tariffs to account in more detail for distinguishing between
demand and energy costs, and determining transmission costs at different points, as well as pool costs for
different customer groups and tariff structures according load management requirements.

Page 37 of 137
3.2.2. Keeping the course: Managing time inconsistency
The existence of time inconsistency in government policy choices has been characterised since
the 1970s by Nobel Prize winners Kydland and Prescott (1977) as well as Calvo (1978). Many
policy decisions are subject to a fundamental time consistency problem. A government would
generally seize the opportunity to re-optimise and change a plan at a later date, irrespectively of
the rationality and forward-looking thinking in place at the time (assumed to aim at maximising
well-being for the country’s citizens). Interestingly, this decision is not rooted in conflicting
objectives between the government and its citizens or the ability of policymakers to react to
unforeseen shocks, but results from “a problematic logical implication of rational dynamic
policymaking when private-sector expectations place restrictions on the policy decisions. […] In
other words, if private expectations about future policy choices are rational, a certain set of
economic outcomes are simply not attainable under discretionary policy” (The Royal Swedish
Academy of Sciences, 2004). Discretionary or sequential policymaking, by opposition to
government commitments, directly results in a credibility constraint for governments unable to
make binding commitments regarding future policies, as well as lower welfare over time.
Inconsistencies, if not complete change of position, in time on the role of the private sector in the
South African ESI are a clear illustration of such mechanisms. Constant twists in the allocation
of responsibility to build new generation capacity, associated with the role granted to IPPs in the
country, have created policy uncertainty and made it difficult for stakeholders to plan and adapt,
ultimately leading to the electricity crisis, i.e. lower welfare.
A blueprint for a competitive ESI including a power exchange, the unbundling of distribution and
transmission and a partial unbundling of generation was produced for Cabinet in May 2001. The
document recommended that 30% of the generation capacity would be sold to the private
sector, Eskom retaining 70% of the market. Besides, Eskom would not build any additional
generation capacity from 2001, thus transferring this component to the private sector (Pickering,
2010).
This blueprint was eventually discarded in May 2004 and only the gradual introduction of IPPs
ultimately resulted from it (Pickering, 2010). Cabinet approved in 2003 the participation of the
private sector in the electricity industry and resolved that future power generation capacity would
be divided between Eskom (70%) and IPPs (30%) (E. Steyn, 2013), while Eskom retained its
assets and its ability to invest in new capacity. Problematically, Eskom had however been de
facto instructed not to build further power stations for some years. Owing to the delay in
introducing the framework for private sector participation,16 Eskom was moreover forced to start,
with delay and at great cost,17 a new generation expansion programme.
16
South Africa’s journey to developing a sound regulatory procurement programme for IPPs in the generation market has been a steep learning curve for Eskom, the DoE and NERSA, and until the validation of the IRP and the inception of the REIPP procurement programme in 2011, Government’s

Page 38 of 137
In a statement on 5 September 2007, Cabinet then designated Eskom as the single buyer of
power from public and private producers, mandating the SoE to ensure that “adequate
generation capacity is made available and that 30% of the new power generation capacity is
derived from IPPs” (GCIS, 2007). Cabinet further specified that, over the 2007-2027 period,
“Eskom will build all nuclear power plants in South Africa and the IPPs will build more than 50%
of all non-nuclear power plants” (GCIS, 2007). This eventually resulted in the introduction of
IPPs onto the market with the launch of the REIPP procurement programme in 2011. Following
the publication of the determination in 2012 (DoE, 2012c), a similar IPP procurement
programme for baseload electricity from coal, natural gas and hydroelectricity is currently being
designed by Government. While the opening of the generation market to the private sector
constitute a positive development, it has had no real impact on competition in the electricity
market (only introducing competition for the market) owing to the sustained control of Eskom
over the market through the holding of most of the generation capacity (Pickering, 2010) and the
limitation of the role of IPPs to government-run procurement programmes.
What has been even more problematic is that “any changed views were not communicated
clearly and timeously to allow all parties to act accordingly and to erase any uncertainty” (van
Basten, 2007b). This protracted situation of policy uncertainty on the role conferred to the
private sector compounded businesses’ lack of enthusiasm for an Eskom-dominated market (by
all aspects) and constituted one of the main factors which led to underinvestment in the 2000s
(van Basten, 2007b). In addition to leading to suboptimal investment decisions with high direct
consequences for the economy as a whole, Eskom’s programme has reinforced its dominant
position and market power, undermining the policy objective of private sector entry in the market
(van Basten, 2007a).
Although the IRP has introduced some certainty for the next two decades, improving the
institutional arrangements and processes that shape decisions to invest in generation
technologies appears as a medium-term challenge for South Africa going forward. “Eskom is a
business in flux: the uncertainty of its future mandate is preventing it from planning ahead
effectively, while its reduced income will require some re-engineering of the business and
reprioritisation over the next five years” (Eskom, 2013b).
3.2.3. Managing the present: Blurred lined or the absence of clarity and certainty
The current governance system of the ESI is characterised by competitive power relations or a
failed balance of powers, created by a confusion in the responsibility of various institutions,
ultimately limiting the effectiveness of the system (van Basten, 2007a). The effective
strategy on the involvement of the private sector in the development of the electricity sector in South Africa was unclear and uncertain. 17
The entire book value of Eskom’s regulatory asset base did not however cover the cost of a single
power plant at the beginning of the programme, highlighting the unaffordability of the programme (Steyn,
2012).

Page 39 of 137
implementation of the legislative framework has therefore proven difficult. Gaps and
incoherencies in the regulatory system have left roles and powers of key stakeholders (such as
NERSA, Eskom, the DoE, etc.) poorly defined, allowing parties to act opportunistically to protect
their interest, sometimes at the expense of other stakeholders (Steyn, 2012). This can be
demonstrated through three channels, namely conflicted divisions of roles, political interference
in independent decision-making processes and information asymmetry problems.
First, the lack of clarity in the regulatory and policy framework in the electricity sector, and in
some cases, contradictions in its various components, has complicated the ability to assign
responsibility, and eventually accountability to a specific entity, in turn leading to inefficiencies
and sub-optimal decisions.
For example, prior to the 2009 Electricity Regulations on New Generation Capacity (which
amended the Electricity Regulation Act No. 4 of 2006), planning and investment approval was
scattered among several institutions with no clarity on responsibility and accountability. While
the DoE, NERSA and Eskom all produced planning documents (the Integrated Energy Plan, the
National Integrated Resource Plan and the Internal Strategic Electricity Plan respectively)
dealing with new generation capacity, the hierarchy and relations between the three documents
remained unclear (Pickering, 2010). This lack of regulatory clarity compounded the poor policy
governance of the ESI with regards to decision-making around new generation capacity
planning and procurement system, as illustrated earlier, and resulted in an absence of decisions
and inadequate investment in new capacity (Newberry and Eberhard, 2008; Pickering, 2010).
Another illustration is the lack of clarity on NERSA’s mandate to regulate reticulation (Steyn,
2012). The Constitution states that “[a] municipality has executive authority in respect of, and
has the right to administer […] electricity and gas reticulation” (Republic of South Africa, 1996).
The power of NERSA is thus superseded by the authority of municipalities, as electricity
reticulation is classified as a municipal power and function in terms of the Constitution. Since the
Constitution effectively grants local government a veto over the restructuration of reticulation,
policy gaps have led to an impasse for the past decade. In addition, as explored in Chapter 5,
the current funding model for municipalities, which relies on the cross-subsidy of other activities
from electricity revenues (surplus) contradicts NERSA’s mandate to set tariffs on a cost recovery
basis (Steyn, 2012).
Second, the tendency of the South African Government to attempt interfering (both directly and
indirectly) in independent decision-making processes has contributed to blurring the lines of the
division of powers. The politicisation of the decision-making process has created considerable
challenges for NERSA to move prices towards long-run marginal costs (and ensure peak prices
reflect marginal costs of peak power generation) and has jeopardised the viability of the ESI
system by preventing the implementation of cost-reflective tariffs. In this respect, political
interference took several forms.

Page 40 of 137
In 2004, the Minister of Public Enterprises announced that Eskom was prohibited from
increasing prices above inflation. This announcement questioned the independence of the
regulator and tarnished the credibility of administrated pricing system. As the actions of the
Minister contradicted the principles of the legislation, it created a sense of unease regarding “the
government’s respect for the role of independent regulatory processes” (Steyn, 2003).
Ultimately, sub-optimal prices, as explained in Chapter 4, implemented through the multi-year
determination process (1 April 2006 – 31 March 2009), were driven by the governmental policy
objective of lowest possible electricity prices (i.e. only allowing Eskom to finance operational
expenditure), reflecting the prioritisation of one policy objective (i.e. affordable electricity) over
other priorities assigned the ESI as illustrated in the following section.
Likewise, upon political pressure, NERSA was not ready in 2010 to grant Eskom the adequate
tariff increases to fund the SoE’s expansion programme and receive a return on assets as per
legal requirements18 and the institution’s own regulatory methodology, thus jeopardising
Eskom’s ability to finance new generation capacity. Despite stating that Eskom should receive a
return on assets of 8.16% (pre-tax, nominal), NERSA only granted to the utility an 0.8% return
on regulated assets for 2010 (Steyn, 2012).
The circumvention of NERSA’s authority to review the commissioning of new power plants
(through licensing) is another example of political intervention. NERSA’s ability to provide an
independent review of the plan for the Kusile power plant was bypassed by Eskom. NERSA was
strong-armed into issuing a licence for the power station as contracts had already been
procured with governmental approval when the regulator was presented with the licence
application. More globally, Eskom’s investment plans are submitted to Cabinet for approval
before NERSA’s formal evaluation and public comment/review (Steyn, 2012). Similarly, while
the REIPP procurement programme spearheaded by the DoE has been a successful initiative, it
de facto removes NERSA’s ability to review applications for generation licence independently.
The DoE determines the amount to be procured per technology, in consultation only with
NERSA. Bids are independently assessed by a panel of expert reviewers19 and successful
18
In terms of the 2008 EPP, Eskom tariffs should be moved to cost reflective levels over a five-year
period (DME, 2008b). It is however unclear when the five-year period is measured from, and whether this
statement contradicts the Electricity Regulation Act (as amended), which requires tariffs to recover costs
(Steyn, 2012). 19
For example, legal reviewers are the UK-headquartered firm Linklaters and South African Bowman
Gilfillan, Edward Nathan Sonnenbergs, Ledwaba Mazwai and Webber Wentzel (DoE, 2013a). The legal
review assesses IPPs’ readiness to enter into a PPA with Eskom and an Implementation Agreement with
the DoE, as well as the terms of subcontracts with the companies which will carry out the construction and
operation of the renewable energy facility, and thus impacts other elements of the evaluation (Standard
Bank, 2012). The technical review, conducted by Tony Wheeler, Blueprint Consulting, and Mott
Macdonald assesses the quality, efficiency and deliverability of the renewable energy technology to
generate the required capacity of electricity. Lastly, the financial review, conducted by van Huyssteens
Commercial Attorneys, Ernst & Young, and PricewaterhouseCoopers, evaluates the financial standing of

Page 41 of 137
applications are granted preferred bidder status by the DoE. NERSA is still responsible to
deliver a generation licence to IPPs but has little, if not, no leeway to separately review
generations applications of preferred bidders under the REIPP procurement programme
(Montmasson-Clair et al., 2014).
In 2011, the DoE has furthermore proposed amendments to the Electricity Regulation Act No. 4
of 2006 (as amended) which would enshrine government interventions in NERSA’s independent
licensing procedure (DoE, 2011b). The proposed Electricity Regulation Second Amendment Bill
would enable the DoE to instruct NERSA to licence projects, officially adding the function of
market access regulation to the department’s roles of policy development and project promotion
(e.g. peaker project and nuclear), and exacerbating existing conflicts of interest (Steyn, 2012).
Third, the failed balance of power within the ESI, along with the monopolistic structure of the
sector, has opened the door for principal-agent issues, generating information asymmetries in
favour of a handful of decision-makers and resulting in biased suboptimal (in terms of
technology choice, timing, size, etc.) investment decisions (G. Steyn, 2013).
Thus, the primary source of data for the ESI is the vertically integrated national utility. NERSA’s
decisions are based on Eskom’s data, and often NERSA does not independently verify Eskom’s
information. Furthermore, NERSA has not conducted an independent review of Eskom’s cost
items or of the asset valuations, which questions NERSA’s ability to conduct an independent
review of Eskom’s application (Steyn, 2003). Furthermore, as illustrated in Table 3 below, while
inputs required for the development of the IRP are scattered across several institutions (Eskom,
the DoE, the dti, NERSA, the DEA, the EDD and the NT), demand forecast (energy and
maximum demand), which is the key variable to an accurate planning, remains solely provided
by the utility.
Likewise, NERSA depends on accurate cost reporting (through Distribution Forms known as D-
Forms, as discussed in Chapter 5) from municipalities to review municipal tariff applications. As
required by the Municipal Finance Management Act No. 56 of 2003, NERSA must have the
tariffs for all municipalities approved by 15 March each year. Since 2010, the regulator thus
requires municipalities to submit D-Forms prior to 30 October in the previous year. In the last
few years, many municipalities have however not complied, forcing NERSA to ask for a
ministerial exemption from the Municipal Finance Management Act requirements and resort to
the NT to obtain missing information.20 NERSA is attempting to close this gap in consultation
with municipalities to ensure that the municipal and NERSA approaches are aligned (AMEU,
2013).
the developer and their funding partners as well as the financial modelling used in their price offering
(DoE, 2013a and Standard Bank, 2012). 20
Interview with National Treasury.

Page 42 of 137
Table 3: List of parameters for the development of the IRP 2010 and data providers
Parameter Nature Owner
Demand forecast (energy and
maximum demand)
Demand input Eskom (System Operations and Planning
division)
Gross domestic product Demand input NT
Electricity intensity (short-term) Demand input the dti, NT, EDD, NPC
Electricity Intensity (long-term) Demand input the dti, NT, EDD, NPC
Price elasticity of demand Demand input NT
Demand side management Demand input DoE
Energy efficiency Demand input DoE
Demand market participation /
demand response
Demand input Eskom
Energy conservation Demand input DoE, NERSA
Own generation Demand input DoE
Cost of unserved energy Supply input NERSA
Reserve margin Supply input DoE with input from NERSA and Eskom
(System Operations and Planning division)
Discount rate Supply input NT, DPE
Renewable energy Supply input DoE, DEA
Exchange rate Supply input NT
Cogeneration Supply input DoE
Nuclear Supply input DoE
Imports Supply input Eskom
Generation life cycle cost Supply input DoE with input from Eskom (System
Operations and Planning division), DST
Generating plant location Supply input DoE
Generation mix Supply input Eskom (System Operations and Planning
division)
Funding and financing Supply input NT
Climate change Externality DEA
Carbon tax Externality DEA, NT
Water Externality DEA, DoE
Distribution infrastructure Externality Electricity Distribution sector with direct
influence from NERSA (via tariffs)
Base scenarios Output DoE
Generation cost cone Output DoE, NERSA
Rate of inflation Output NT
Source: TIPS, based on DoE, 2010b

Page 43 of 137
The above three issues, which directly emanate from a failure in the balance of powers in the
South African ESI, call for a clarification of the role attributed to each stakeholder. The state
holds the four distinct roles of shareholder (through the DPE), policymaker (through the DoE),
regulator (through NERSA) and project developer (G. Steyn, 2013). As such, “Government has
not found a definite solution to its multiple roles as shareholder, industrial and social policymaker
or reconciled this with the state’s decisions to allocate economic regulatory function to an
independent regulator” (Storer and Teljeur, 2003).
Government’s policy indecisiveness on a clear and unambiguous mandate for the regulator, and
the tools it requires to implement it, has hampered NERSA’s ability to operate efficiently (van
Basten, 2007a). NERSA’s function is further complicated by the market structure of the ESI (i.e.
the dominance of Eskom, notably in terms of information and skills), a fragmented EDI and the
splitting of powers on various issues, such as municipal reticulation. In addition, regulatory
independence opens the door for conflict with policymakers over the division of responsibilities
and their respective role, paving the way for attempts of political interference if not managed
properly.
In order to ensure mutually supportive roles respecting the regulator’s independence,
policymakers must set the framework within which decisions are to be taken while the regulator
bears the responsibility of decisions. The legislative framework and supportive documents must
be detailed enough in order to create confidence over the probable outcomes of the regulator’s
decisions. If the framework is unclear, the regulator is forced to interpret policymakers’
intentions, creating uncertainty (Hodge et al., 2008).
3.2.4. Looking ahead: The absence of a clear overarching vision
The global rise of the free market ideology and technology progress, associated with the
historical poor record of public enterprises, led in the 1980s to a push to reform ESIs around the
world. Reform processes were undertaken with the idea of improving economic efficiencies by
breaking away from natural monopolies and introducing competition and private participation,
ultimately lowering the cost of electricity. Paul Joskow (2006) summarises the standard
sequential seven-step model as follows: (1) corporatise the SoE; (2) commercialise activities in
the value chain; (3) design and implement a regulatory system;21 (4) unbundle activities in the
vertically and horizontally integrated value chain to facilitate competition; (5) manage the
divesture of state assets; (6) promote private sector participation; and (7) implement wholesale
and then introduce retail competition, at least for industrial customers.22 Chile, the United
Kingdom and Norway were among the first countries to follow such model, followed by many
developed economies and around 70 developing and emerging countries by the end of 1990s
(Nepal and Jamasb, 2013).
21
This includes applying performance-based regulation to transmission and distribution, establishing an objective independent regulator and mitigating self-dealing and cross-subsidisation arising from information asymmetries between incumbent and new entrants. 22
See Gratwick and Eberhard, 2008 for a historical analysis of the development of standard model.

Page 44 of 137
In South Africa, while the 1998 Energy White Paper reflects some principles of the standard
textbook model (such as the liberalisation of distribution and the open access to the
transmission system), this model was never really implemented. Instead, a hybrid model
maintaining the dominance of the SoE prevailed in the country, based on the theory of
contestable markets23 and the political and social necessity to consider the economic growth
and developmental objectives. The ESI has not been fully unbundled (both vertically and
horizontally) and, as illustrated in Table 4, only some features of the standard model were
implemented in South Africa, such as the corporatisation of Eskom, the introduction of
competition in specific value chain components (such as in generation with IPPs) and the
establishment of an independent regulator.
While the textbook approach generally implies clear policy choices on the relative roles of the
utility and IPPs, and the establishment of appropriate regulatory and institutional arrangements
for the procurement, contracting and dispatching of new generation capacity, this remains a
confused and contested policy and institutional space in many developing countries including
South Africa. In this case, the incumbent utility remains in a dominant position, arguably
retaining its ability to invest in new generation capacity, while IPPs are introduced into the
market, without clarity on the role they ought to play in the market (and often without support
from the state-owned enterprise) (Gratwick and Eberhard, 2008). This hybrid structure creates
challenges for the regulatory and institutional framework established in the country as part of the
reform process, which requires assimilating the characteristics of South Africa’s hybrid market in
order to support economic efficiencies. Indeed, hybrid markets “present an array of new
challenges related to which institution is responsible for generation planning, how to allocate
new investment opportunities, timely initiation of competitive bidding processes, institutional
capacity to contract effectively and fair and transparent power dispatch arrangements” (Gratwick
and Eberhard, 2008). The understanding and recognition of the market structure by regulatory
institutions is therefore instrumental to their ability to effectively and efficiently drive and
implement an investment strategy (i.e. the main factor determining electricity prices).
Clarity on the structure towards which the ESI is shifting and on the role of each stakeholder in
this remodelled system is instrumental to successful and effective regulation. However, the
vision expressed in the 1998 White Paper is now outdated and appears in contradiction with
recent policy decisions made by Cabinet. In addition, on-going reforms, most notably the
separation of the transmission grid and the system operator from Eskom with the establishment
of an ISMO, are currently stalled. The reform of the ESI has been side-lined by the security of
supply problem and Eskom’s transmission and distribution assets will not be unbundled in the
short or medium term before energy security is ensured.
23
The theory of contestable markets, developed by William J. Baumol (1982), advocates that some markets, although of monopolistic or oligopolistic nature, are characterised by a competitive equilibrium (and therefore delivering the same associated welfare outcomes) due to the absence of entry or exit barriers. In a contestable market, the threat of potential short-term entrants guarantees a competitive behaviour from the dominating firm(s).

Page 45 of 137
Table 4: Comparison of the standard textbook model with South Africa's hybrid reform
Refom steps Implementation activities Situation in South Africa
Corporatisation of the SoE
Transformation of the SoE into a separate legal entity
Implemented: Eskom corporatised with the Eskom Conversion Act of 2001
Commercialisation of activities
Move towards cost reflective tariffs, transparent subsidies and improved revenues collection systems
Progress made: introduction of MYPD process and unbundling of tariffs structures
Design and implementation of a regulatory system
Establishment of an independent regulator and passage of legislation to provide a mandate/ framework for restructuring and private participation
Progress made: establishment of a regulatory system and authority of the regulator entrenched
Vertical and horizontal unbundling
Unbundling of the SoE to facilitate competition and mitigate self-dealing, starting with transmission and establishing a system operator
Minimal progress made: ISMO has been established and ring-fenced within Eskom
Divesture of state assets
Divesture state ownership in part or full of generation assets to private sector
No progress made
Promotion of private sector participation
Introduction of IPPs under long-term power purchase agreements
Slow-paced progress made: procurement of renewable energy from IPPs
Implementation of wholesale and retail competition
Different market models exist. Retail competition might not be viable but industrial customers should be able to choose supplier
No progress made
Source: TIPS, based on Gratwick and Eberhard, 2008 and Joskow, 2006
Despite the commissioning of several reports on potential market structure by Government,
Eskom, NERSA and EDI Holdings over the years, no official view (other than the obsolete 1998
White Paper) exists on the evolution of the ESI. The South African Government at the moment
lacks a clear overarching vision of the future evolution of the sector, thus amplifying the
unpredictability of the policy and regulatory environment in the country.
The absence of an official vision for the ESI is also conveyed in the lack of clarity on the
objectives to which the sector is meant to contribute and, in turn, the drivers of regulation. In the
electricity sector, numerous conflicting priorities make the work of regulatory stakeholders,
essentially the regulator, a very complicated, if not impossible, balancing act. Energy policy is a
cornerstone to economic development and is intrinsically intertwined with other aspects of the
economy. As illustrated in Figure 7 below, energy policy is inter alia aimed to address diverging
priorities, from core energy objectives to economic and industrial development, to social and
environmental concerns.

Page 46 of 137
Figure 7: Diverging objectives related to energy policy
Source: TIPS
The ability of energy policy, and of the regulator, to tackle all these irreconcilable issues
however appears compromised. In the current order, the electricity sector is pulled in many
directions trying to meet all objectives while, in practice, trade-offs at the energy policy level are
inevitable. Without prioritising the objectives attached to energy policy, the risk of falling short on
all is vivid, thus carrying disastrous consequences for economic, social and environmental
structures.
Ensuring security of supply remains the core priority of energy policy. In addition to this
fundamental function, which must hold the primacy, energy policy can be mobilised to achieve
peripheral objectives. What these secondary objectives must be depends on the situation of the
country and remains a debatable issue. Undoubtedly, these should be focused and hierarchised
in order to maximise positive spillovers and chances of success, and manipulated with caution
so as not to overshadow the primary objective of energy security.
In line with energy policy objectives, Eskom has divergent responsibilities too. The first of these
is ‘keeping the lights on’ by investing in generation capacity and ensuring provision of electricity
to its end users. The second is the accommodation of market reform of the generation sector in
terms of enabling IPPs to connect to the grid. Third, it has a role to play in keeping prices below
double digit increases by ensuring its own financial sustainability and, lastly, to some extent it
Energy objectives
Security of supply
Quality of infrastructure (generation, transmission, distribution)
Economic objectives
GDP growth, investment,
macro-economic impacts
(inflation, exchange rate)
Industrial objectives
Impact on competitive-
ness, particularly on
the EIUG
Security of supply
Developmental objectives
Universal access to electricity
Affordable electricity
(particularly for low-income households)
Social objectives
Job creation
B-BBEE
Financial objectives
Eskom’s financial stability
Municipalities
Private sector participation
Environ-mental
objectives
Energy-related environ-mental
impacts
Green economy
Sustainable development

Page 47 of 137
acts as an agent of social and economic development in provision of electricity to as many
South Africans as possible.
In light of these objectives, Steyn cautions against the setting of objectives for SoEs that are too
broad and conflicting (Steyn, 2012). The argument is that the role of the regulator should be to
ensure the efficient, cost effective operation of the ESI in order to provide electricity at the lowest
cost possible, while remaining sustainable and allowing for adequate investment. As will be
discussed in Chapter 4, the tariff setting methodology employed by NERSA is moving towards a
more cost reflective basis, although cross subsidies for free electricity to poor households and
the electrification programme is factored into the tariff formula.
This raises an important question around the role of economic regulators in general. Should
economic regulation be divorced from other economic and social development objectives of a
country, particularly a developing country with a history like South Africa’s? It would seem
counterproductive, in our view, to assume this position.
The actions of Eskom and NERSA have direct implications on other policies. For instance, as
detailed in Section 5, while bringing undeniable short-term benefits to the country at the time of
signature, special pricing agreements entered with electricity-intensive users have had
unintended consequences on the country in the longer run. South Africa’s most electricity-
intensive users, such as non-ferrous metals (aluminium), benefit from fixed long-term contracts,
often favourable to dominant players. Most notably, BHP Billiton obtained favourable long-term
special pricing agreements with Eskom in the late 1990s for the implantation of its aluminium
smelters in the country. South Africa having no other comparative advantage, the aluminium
smelting industry owned by BHP Billiton was then located in the country purely owing to the
access to cheap and plentiful electricity. In line with industrial policy at the time, these pricing
agreements were struck to stimulate investment in aluminium refining in South Africa. Further
benefits that were anticipated included the development of a downstream aluminium industry
and the generation of both direct and indirect jobs on a significant scale, the substitution of
significant imports of aluminium by domestic production and a contribution to the balance of
payments. When the first smelters were considered, the country’s energy policy faced a different
set of priorities as Eskom had an estimated 30% surplus of generating capacity. By entering into
long-term contracts for a sizeable share of the country’s electricity consumption,24 the South
African Government, via Eskom and the NER, however locked the country into a perilous
situation. While these contracts did serve a purpose at the time of signature, they triggered
another set of problems in the longer run. By encouraging the excessive use of electricity and
dissuading the introduction of energy-efficient technologies, these pricing agreements
contributed to make South Africa one of the most energy- and carbon-intensive economies in
the world. Favourable electricity pricing to these energy-intensive industries also served to
entrench their dominant positions in their respective markets, giving them a significant cost
24
The EIUG, which comprises 32 companies, consumes about 45% of the country’s electricity. BHP Billiton’s consumption alone accounts for about 5.5% of the country’s generation capacity.

Page 48 of 137
advantage over rivals (such as secondary smelters) and presenting barriers to entry to potential
new entrants who cannot secure such rates. There have been numerous competition-related
problems that other economic regulators such as the Competition Commission and Competition
Tribunal of South Africa have been confronted with relating to abuse of dominant positions by
incumbents. While not attributing the sole reason for dominance of incumbents to favourable
electricity prices; privileges or subsidies offered to only a select, or favoured, group of firms25
and not to several competing firms in an industry, often negatively impacts on competitive
outcomes.26
In this case, macroeconomic considerations, industrial development and job creation were
prioritised as the objectives of energy policy. While energy security, the primary objective of
energy policy, was not a concern at the time, decision-makers failed to understand (probably
due to wrong assumptions on future electricity demand and the rand/dollar exchange rate) the
long-term impact of special pricing agreement on the country’s security of supply. Likewise,
other objectives, such as sustainable development and social development were not considered
in the decision to grant these favourable contracts and were arguably negatively impacted by
them. In addition, the special electricity pricing deals did not necessarily translate to envisaged
cost benefits being passed on to downstream beneficiation industries or end consumers, for
instance, when key outputs from such industries were simply exported in basic form or priced at
import parity price equivalent when sold to local customers.
Since the 2008 load shedding crises, and in the current context of electricity shortage and
increasing electricity prices, these contracts have offered these industries preferential conditions
at the expense of the rest of the economy. This has also contributed to slow down the
diversification of the South African economy away from these energy and resource-intensive
products.
Promoting small businesses, increasing competition and stimulating downstream beneficiation
and the resultant employment spinoffs, have all been integral components of industrial policy
over the years. Therefore the decisions of the ESI players and NERSA are significant for the
successes of other policies and a regulatory approach that does not take into account the
impact of electricity related decisions on other policies is arguably too narrow in its mandate.
Another illustration of the requirements to conjugate multiple objectives through energy policy is
the REIPP procurement programme launched by the South African Government in August 2011.
In addition to contributing to the country’s energy security, the programme aims to achieve
several environmental and social objectives. Despite some constraints, the clear definition of the
25
In South Africa’s case, ‘national champions’ have been particularly favoured. 26
This includes through industrial policy interventions. See Aghion et al., 2012 and Rodrik, 2004 and 2007 for debates on ‘competition-friendly’ industrial policy. The South Korean industrial policy approach was to offer multiple firms in an industry support (as opposed to a single firm), and these firms were expected to compete aggressively in export markets.

Page 49 of 137
priorities assigned to the procurement of renewable energy from IPPs has however facilitated
achieving several objectives (Montmasson-Clair et al., 2014).
First, the REIPP procurement programme is a tool of the country’s energy policy. The South
African Government recognises that Eskom alone does not have the capacity to meet the
country’s electricity demand and ensure energy security. Given Eskom’s financial constraints
and the urgency to meet electricity demand, Government has welcomed the entry of the private
sector on the generation market, in the form of IPPs, to stimulate the production of electricity.
The programme focuses on renewable energy but a similar scheme is being designed for
baseload coal, gas and hydropower electricity, further contributing to the core objective of
energy policy.
Second, the development of renewable energy, along with the introduction of IPPs, aims to
contribute to containing the cost escalation of electricity in South Africa, especially in the
medium to long term. In the short term, the introduction of IPPs has created additional costs for
the utility, which have been reflected in recent electricity tariff increases. The national utility
could nevertheless benefit from IPPs building new plants and generation capacity at their own
cost and financial risk. In addition, IPPs argue that their entry to the generation market means
that plants are built faster and electricity is generated more cheaply for a given technology
(Yelland, 2009). In the medium to long term, the development of renewable energy-based
electricity will contribute to cushioning electricity price increases, if not reducing the cost of
electricity available in South Africa. While renewable energy remains a nascent industry in South
Africa, and as such requires some governmental support in the short term, the sector is
expanding very rapidly. Renewable energy technologies are becoming increasingly competitive
and cost-effective alternatives to traditional fuels and technologies. The probable introduction of
an economy-wide carbon tax in South Africa from 1 January 2015, aimed at internalising
environmental externalities linked to economic activities, will further build the business case for a
substantial share of renewable energy in the country’s electricity supply mix. Therefore, while
contributing to tariff increases in the short term, the REIPP procurement programme will
effectively contribute to generate affordable electricity in the medium to long term.
Third, the development of renewable energy is a clear priority of the South African
Government’s climate change mitigation and green economy strategies. South Africa has
pledged to peak its greenhouse gas emissions between 2020 and 2025 at respectively 34% and
42% below a business-as-usual trajectory, plateau for approximately a decade and decline in
absolute terms thereafter, subject to the adequate provision of financial resources, technology
transfer and capacity building support provided by developed countries (UNFCCC, 2011). The
energy sector, through both renewable energy and energy efficiency improvements, constitutes
a cornerstone of this mitigation effort. The roll-out of renewable energy, owing to the low-carbon
nature of the technologies, from large-scale grid-connected projects through the REIPP
procurement programme to small-scale rooftop systems, participates in the country’s transition
Page 50 of 137
to a greener low-carbon economy by changing the structure of the energy sector (TIPS and
GGGI, forthcoming).
Last but not least, the creation of a renewable energy industry in the country is meant to
contribute to local economic development objectives. Particularly, the creation of sustainable
employment, along with the development of a domestic manufacturing capacity, constitutes
Government’s priority. The South African Government aims to create 400 000 new direct jobs by
2030 in green economy sectors, as heralded in the country’s New Growth Path. The
procurement of renewable energy and the roll-out of specific projects (such as in solar water
heaters, recycling, public transportation and natural resource management) constitute the main
driver of green employment in the country. Community ownership and black economic
empowerment also feature high on the governmental agenda, and constitute key characteristics
of the existing renewable energy programme. Renewable energy projects are evaluated on their
price competitiveness (for 70% of the total) and a set of economic development criteria (for the
remaining 30%). While competition occurs primarily on price, the programme brings positive
economic and social developments. These remain nevertheless secondary in the programme,
whose primary goal is to procure clean (and ultimately affordable) electricity. In addition, local
content requirements, which are leveraged to generate employment and develop domestic
capacity, involve short-term trade-offs. As the localisation of green technologies raises the costs
of goods, local content requirements can hinder the shift to sustainable development if not in line
with the country’s capacity and capability, and impede the decrease in prices.
As illustrated by these two examples, the compatible nature of the objectives assigned to the
programme, and more broadly to policies and regulation, is therefore a key element of success.
As economic regulation is not an end in itself but a means to an end and regulatory decisions
must ultimately make a positive difference to all stakeholders, providing confidence that policies
are implemented in the best interest of industry, end-users and the economy as a whole (van
Basten, 2007b), clarity is required on the division between regulatory functions and broader
economic and industrial policy objectives (van Basten, 2007a). For the regulator to be efficient
and effective, the final aim of regulation, and beforehand the priorities assigned to the regulated
industry, must be defined by Government. In addition, these priorities shall be clear, concise,
compatible and within the scope of the industry and the regulatory entities. Having said this, the
point is reiterated that economic regulation cannot happen in a vacuum and in a manner that is
contradictory to other economic, social and development policies, particularly in a developing
country like South Africa.
3.3. Conclusion
As illustrated in this section, the institutional and regulatory frameworks operating the ESI are of
a complex nature. Power relations, fuelled by competing interests, have shaped the sector over
the last few decades. A range of unresolved policy and regulatory issues, particularly with
regards to energy planning, are further hampering the electricity sector in South Africa, leading
to sub-optimal decisions and ultimately negatively impacting the economy as a whole.

Page 51 of 137
The regulation, policy and legislation governing generation expansion planning, the allocation of
new build opportunities, procurement and contracting must be refined and respective
stakeholders’ roles and obligations articulated. Capacity planning processes as well as decision-
making mechanisms must be clarified, streamlined and strengthened. In addition to the lack of
capacity and unclear responsibilities of the DoE and NERSA, information asymmetry in favour of
Eskom which concentrates investment planning expertise and system information complicates
the position of the regulator and must be addressed.
At the distribution level, the duality of regulatory institutions and legislation affects the
determination of municipal tariffs. The relationship between NERSA and municipalities has at
times been strained owing to concurrent legislation blurring the repartition of roles. Ultimately,
this legislative misalignment, as termed by NERSA, has made it difficult to clarify which
institution has the responsibility and the authority to determine, approve and implement tariffs
and whether municipalities are bound by NERSA’s decisions (AMEU, 2013, SALGA 2012,
Rustomjee, 2013).
More importantly, a new vision for the ESI must be elaborated to provide direction and certainty
to all stakeholders in the sector. The electricity crisis has given business, government and
academics an opportunity to think beyond mega-build generation plants and how much IPPs
and renewable energy should be introduced into the system. Modular and smart technologies,
used in conjunction with standard technologies, can provide the tools to rethink energy strategy
in South Africa.
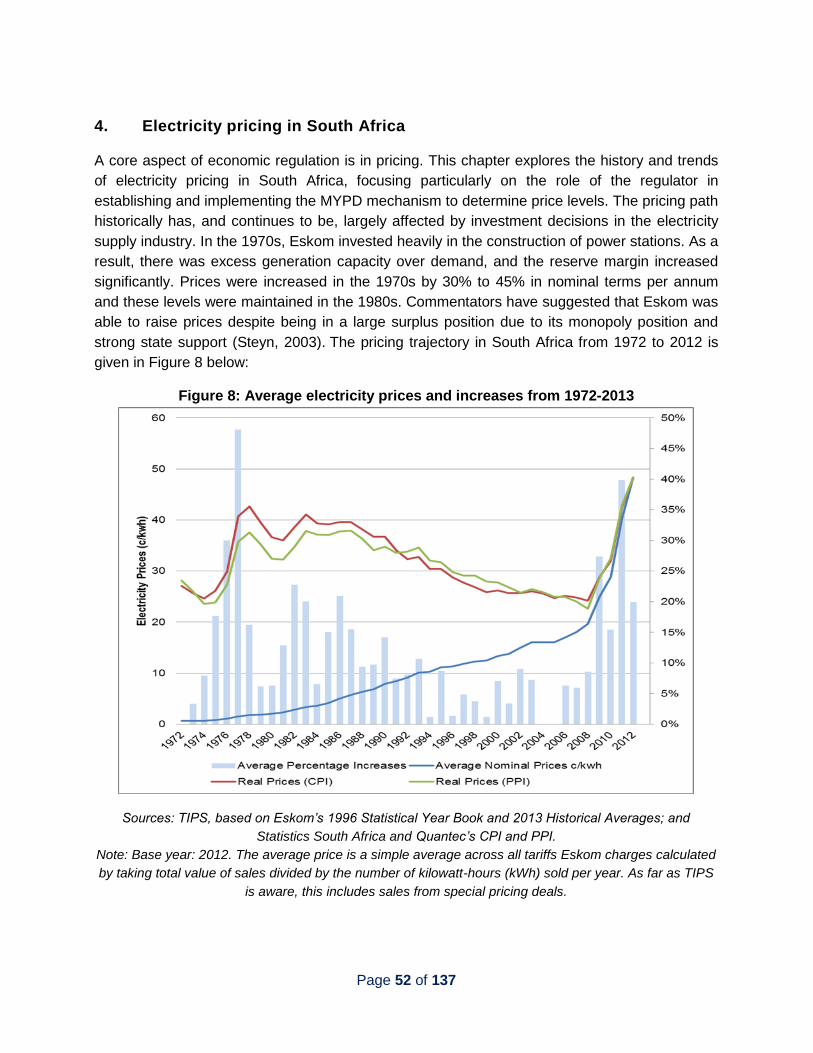
Page 52 of 137
4. Electricity pricing in South Africa
A core aspect of economic regulation is in pricing. This chapter explores the history and trends
of electricity pricing in South Africa, focusing particularly on the role of the regulator in
establishing and implementing the MYPD mechanism to determine price levels. The pricing path
historically has, and continues to be, largely affected by investment decisions in the electricity
supply industry. In the 1970s, Eskom invested heavily in the construction of power stations. As a
result, there was excess generation capacity over demand, and the reserve margin increased
significantly. Prices were increased in the 1970s by 30% to 45% in nominal terms per annum
and these levels were maintained in the 1980s. Commentators have suggested that Eskom was
able to raise prices despite being in a large surplus position due to its monopoly position and
strong state support (Steyn, 2003). The pricing trajectory in South Africa from 1972 to 2012 is
given in Figure 8 below:
Figure 8: Average electricity prices and increases from 1972-2013
Sources: TIPS, based on Eskom’s 1996 Statistical Year Book and 2013 Historical Averages; and
Statistics South Africa and Quantec’s CPI and PPI.
Note: Base year: 2012. The average price is a simple average across all tariffs Eskom charges calculated
by taking total value of sales divided by the number of kilowatt-hours (kWh) sold per year. As far as TIPS
is aware, this includes sales from special pricing deals.

Page 53 of 137
Figure 9: Average price increases by Eskom, compared to PPI and CPI
Sources: TIPS, based on Eskom’s 1996 Statistical Year Book and 2013 Historical Averages; and
Statistics South Africa and Quantec’s CPI and PPI.
There have been numerous delays in the construction of Medupi and Kusile power stations and
both industries and households have been affected by on-going rationing, interruptions (when
there are unplanned maintenance shutdowns, for instance) and escalating prices. Given the
rate-of-return methodology employed in the regulation of electricity price (discussed in Chapter
4), costs of such delays are theoretically27 passed onto customers in the administered electricity
price.
As explored in the narrative below, NERSA has in most instances not granted Eskom its full
requested required revenue. This was typically when NERSA’s own calculations and analysis
showed that the requested required revenue was excessive, but was also in some instances (as
was touched upon in Chapter 3) when there was significant pressure from different interest
groups and government to keep prices low.
4.1. Brief history of electricity pricing until 2006
Prior to the establishment of the NER in the mid-1990s, Eskom was solely responsible for price
determination with little or no regulatory oversight. The ECB (established in the 1920s,
27
Theoretically, in that the full requested revenue by Eskom (which translates into price) is not necessarily always granted by NERSA.

Page 54 of 137
essentially Eskom’s board) only approved tariff structures and it was not until the amendments
to the Electricity Act of 1987 in 1995 that the establishment of the first independent regulator
took place in the form of the NER. This was later established as NERSA in 2005.
Consistently over the period, significant price spikes have been associated with large capital
investment programmes, which is a pattern repeated in the late seventies and early eighties (in
1977, 1981 and 1983) and again in the late 2000s (after 2007) every time there has been new
build.
Eskom in the 1970s embarked on large scale capacity expansion investments, resulting in
electricity tariff increases in 1975 by 15%, in 1976 by 30% and in 1977 by 48% respectively. The
determination of electricity prices at the time when there was no formal regulation began as an
Eskom exercise in forecasting required revenues to cover costs. Prior to the corporatisation of
Eskom, it was required just to break-even and not earn any profits. This resulted in a price
determination that was largely based on pure cost recovery. It was determined by forecasting
the total kWh expected to be sold based on prices per kWh for recovering revenues according to
these sales estimated, initially based on three main customer groupings. The Electricity Act No.
40 of 1958 allowed Eskom to adjust tariff levels for the purpose of recovering electricity supply
cost and any changes to the pricing formula was required by law to be approved by the
Electricity Control Board. Beyond the actual tariff, discounts and surcharges applied however it
is unclear whether these structures needed Board approval. Further, historically tariffs were
developed on a provincial level until pricing was nationalised in the mid-1980s.
When price increases were significantly high in the 1970s, there was a huge outcry by
consumers and the BTI was commissioned to investigate the increases in 1977 as discussed in
Chapter 3. The BTI commission results did not achieve any significant regulatory reform or
change in prices determination.
Prices in the 1980s increased substantially again to cater for the new build of the seventies.
Further prices increases in the early eighties were due to rising interest rates, inflationary effects
on Eskom’s operating costs, a drop in electricity sales and a global and domestic recession.
Increasing costs were fully recovered through higher tariffs. As discussed in Chapter 3, a
second commission was set up to investigate these increases- the de Villiers Commission of
1985.
After 1986, components that made up tariffs were altered in terms of cost components that were
recovered through additional charges.28 This change makes it difficult to directly compare pre-
1986 and post-1986 tariffs. The change to nationalised tariffs from provincial tariffs further
28 The energy-related components of the variable cost of electricity consumed consisted of fuel and water consumed by generation stations. The fixed costs were associated with generation, transmission and distribution equipment to deliver this energy, which were related mostly the plan-capacity-related costs. These include interest, redemption and other financing charges. Since plants are built to certain capacity parameters, the cost per electrical capacity kwh is estimated per plant.

Page 55 of 137
meant that some customers benefitted from a 28% decrease in electricity costs and some
customers paid up to 6% more.
What was also significant in the late eighties and nineties was that there was considerable
excess capacity. The large scale capacity expansion of the seventies that Eskom had embarked
on was followed by sluggish growth in the local economy, below what was projected, coupled
with a global recession after the international oil price shock.
In the 1990s, Eskom entered into a compact with its customers to keep its prices low and to
reduce the real cost of electricity by 20% over the period 1991-1996. A reduction of 16.6% was
achieved. This kept prices at a level that was relatively low compared to global standards.
Eskom in this period also entered into favourably-priced long term supply agreements to ensure
offtake of excess capacity. This is discussed later under Special/Negotiated Price Agreements.
Also during this time, the NER was established in 1995 in terms of the Electricity Act of 1987. It
assumed responsibility of tariff structures and price determinations as well as licencing for
generation, transmission and distribution activities. The NER required ring fencing of Eskom’s
divisions for generation, distribution and transmission in order to accurately report on costs. In
1994 appropriate names for tariff structures were introduced. By 2001, the NER had introduced
a uniform regulatory framework for Eskom and municipalities for the determination of tariffs
through a rate-of-return methodology.
The regulation of electricity pricing obviously had an impact on the level of price increases as
well as the structure of tariffs, however two other developments also affected pricing during this
time. First, there was a drive to increase residential electrification, and second, a push to
encourage investment in heavy industry which was electricity intensive. The pricing
methodology in these years was based on average costs using historic book valuation of
Eskom’s assets resulting in prices that were claimed to be below Long Run Marginal Cost
(LRMC) of power generated by the new power stations (Newbery and Eberhard, 2008). Prices
during this period were considered to be sub-economic, and not sufficiently high to cover all
costs, particularly that of new build. Also around this time, the Department of Finance (now the
NT) corporatised Eskom into a tax and dividend paying entity.
In 2004, the Minister of Public Enterprises announced that Eskom was prohibited from
increasing prices above inflation. As explained in Chapter 3, this type of intervention by
government puts pressure on the regulator and questions its credibility and independence.
4.2 Pricing since 2006 to date
Prices continued to remain at relatively low levels until 2008. Following the load shedding crises
in 2008, Eskom once again embarked on large scale investment in generation capacity, which
saw prices increasing dramatically to cater for the infrastructure spend.

Page 56 of 137
4.2.1 Current principles of pricing
The Electricity Regulation Act No. 4 of 2006 provides the context for the EPP (DME, 2008b).
According to the Act, the setting of prices, charges, tariffs and the regulation of revenues (DME,
2008b:13):
a) must enable an efficient licensee to recover the full cost of its licensed activities,
including a reasonable margin or return;
b) must provide for or prescribe incentives for continued improvement of the technical and
economic efficiency with which services are to be provided;
c) must give end users proper information regarding the costs that their consumption
imposes on the licensee's business;
d) must avoid undue discrimination between customer categories; and
e) may permit the cross-subsidy of tariffs to certain categories of customers.
Linked to the above EPP criteria, it is argued that optimal pricing should take into account at
least two other key criteria: sustainability (where prices should allow for or recover full costs) and
stability (where there should be some level of long term stability and predictability in prices). Full
costs imply all costs over the full operational life of an asset. Long run stability (or ‘smoothing’) is
best achieved if recovery of costs are spread over the longest period possible and over as high
an output as possible (Joubert, 2012). The rational for these two criteria are clear: full recovery
of costs is needed to provide the incentive to invest in the first place, and stability is required to
offer certainty to customers, particularly industrial users, to invest in industrial activity. Other
criteria include affordability and economic efficiency of prices (Joubert, 2012).
Further, NERSA is mandated to proactively take necessary regulatory actions in anticipation of
and in response to the changing circumstances in the energy industry. NERSA is also
responsible for approving tariff structures for different customer groupings (see discussion in
Chapter 5).
4.2.2 The Multi-Year Price Determination
NERSA currently employs the mechanism of a MYPD to set electricity prices for the industry.
This was conceptualised in 2005 and introduced from 2006. The type of interrogation and
response in price determination that the former NER engaged in as it became more established
was a foretaste of what NERSA’s price determination would entail in the MYPD from 2005.
According to Rustomjee (2013), NER and NERSA had created a credible track record in
determining prices (including for the MYPD) institutionalising the process broadly as follows:

Page 57 of 137
Box 2: General principles followed in tariff determination
Informal and continuous interaction between NERSA, Eskom, municipalities and stakeholders
representing electricity consumers
Internal Eskom processes- revenue needs analysis process and the tariff restructuring process- both
of these are combined into an application for the required price increase
Interaction between Eskom and government shareholder, represented by the Department of Public
Enterprises, particularly if price increase is likely to be contentious
Formal application to NERSA requesting a tariff increase
NERSA statutory processes:
- Publication of tariff application - Call for public comments - Publication of NERSA’s preliminary determination and call for comments - Public hearings - Publication of NERSA’s final determination
Options for appeal by parties unhappy with the regulator’s decision.
Source: Reproduced from Rustomjee, 2013
The MYPD method is essentially a rate of return method of price regulation, not unlike the basis
of price setting prior to 2006. Under rate of return regulation, the price level is set to cover all
costs and allow a fair rate of return on the cost of capital.
There are both advantages and disadvantages to rate of return regulation. One advantage is
price sustainability, as prices cover all costs and adjust to changing conditions. Indeed, the
rationale for the establishment of this pricing mechanism was to allow for more certainty,
predictably and stability of the price path as well as for prices to be more cost reflective given
the new build spend that was anticipated. Further, company profits are kept within acceptable
limits. However, there is little incentive to minimise costs or to innovate and make productivity
improvements which reduce costs given that costs can simply be recovered through regulated
price. Indeed there are strong incentives to ‘pad’ expenses. There is also a tendency to
excessively invest in capital in order to gain revenues through higher returns on capital.
The first MYPD1 ran for 3 years, from 1 April 2006 to 31 March 2009, and MYPD2 from April
2010 to 2013.29 The most recent price determination (MYPD3) applies from 1 April 2013 to 21
March 2018. This was a change to a five-year duration from the original three-year duration.
NERSA approved changes to the MYPD rules in 2008. Under a rate of return regulation method,
the longer the time period before review of a tariff, the greater the incentive to cut costs. In this
sense, the increase in the number of years before tariff review may stimulate Eskom to cut
costs.
29
In the period between MYPD 1 and 2, there was interim pricing request by Eskom.

Page 58 of 137
The MYPD formula is as follows:30
AR = (RAB x WACC) + E +PE + D + TNC + R&D + IDM + SQI + L&T +/- RCA
AR Allowable Revenue
RAB Regulatory Asset Base
WACC Weighted Average Cost of Capital
E Expenses (operating and maintenance costs)
PE Primary Energy costs (inclusive of non-Eskom generation)
D Depreciation
TNC Transmission and Network Costs
R&D Costs related to research and development programmes/projects
IDM Integrated Demand Management costs (Energy Efficiency and Demand Side Management, Power Conservation Programme, Demand Market Participation)
SQI Service Quality Incentives related costs
L&T Government imposed levies or taxes (not direct income taxes)
RCA Balance in the Regulatory Clearing Account (risk management devices of the MYPD)
4.2.3 Components making up the final electricity price
As stated, the main principle applied in the MYPD is that of cost recovery. The cost of producing
electricity depends on capital expenditure, initial asset investment, operating and maintenance
costs and fuel costs. Annual depreciation is also included, as is interest to recover the purchase
of the plant over its life. The factors affecting electricity prices can broadly be categorised as
supply-side and demand-side factors. Cost of supply is also affected by past investment
decisions and financial policies, as well as the weighting of these in the pricing formula. Other
cost drivers that affect price levels are investment decisions on new generation and cost of
supplies (specifically coal). A chief consideration of the MYPD is an appropriate rate of return for
Eskom to theoretically recover all its costs. Broadly, these costs include:
operating costs (largely considered fixed)
fuel costs (variable costs)
capital expenditure costs which include financing costs (cost of capital such as interest
costs and tax costs (if equity is present in the capital mix/structure) and depreciation
costs over the life of the plant/asset.
30
This formula applies to generation. Transmission and distribution are regulated under different formulas.

Page 59 of 137
The cost components on the electricity supply side include the following:
Generation Transmission and Distribution Retails services to end-users
Primary energy costs
Cost of finance and
investment in generation
Environmental levy
Labour and services costs
Labour, services, materials and
property
Finance costs to maintain, upgrade
and extend the network
Systems, services, labour and
materials to deliver electricity
directly to end-users’ premises
and to bill them for services
rendered
Source: TIPS
Primary energy is the largest single component of the utility’s overall costs, which rose to ZAR
54.2 c/kWh, from ZAR 41.3 c/kWh in the previous year (Creamer, 2013).31 Looking at a model of
the four main cost components of a typical base load coal fuelled power station, the operational
and fuel costs are around 35% of the total lifecycle cost (Joubert, 2012). 65% is the capital cost
of purchasing a plant in terms of the total life cycle cost. This is a cost that is typically recovered
through the depreciation charge and pre-tax return on assets (Joubert, 2012). Since the
technology choice impacts variable fuel costs, it is the historical investment decision that
continues impacting costs. Selecting the wrong mix of technology, scale of plant, and
contractors will either increase the cost of construction or cause delays which will increase the
cost of supply, ultimately increasing the price of electricity.
Figure 10: Illustration of electricity pricing make-up
Source: Eskom, 2009
31
Between 2008 and 2012, prices have increased by 139% over a five-year period (2008-2012. “The main driver behind these tariff increases is undoubtedly Eskom’s massive capital programme” (Pickering, 2010).

Page 60 of 137
Other factors impacting pricing, directly and indirectly, are reflected in the figure below:
Figure 11: Other factors impacting electricity pricing
Source: TIPS
MYPD 132
The first MYPD determination was for a three year period, applicable from April 2006. The
average price increase allowed in MYPD 1 was 5.1% for the first year, and then 5.9% and 6.2%
in the following years- roughly inflation plus 1 % tariff. This was a slight change from the 2004
period, where DPE essentially forced Eskom to price at levels not exceeding inflation.
But a year after MYPD 1 was running, Eskom applied for an 18.7% tariff increase in April 2007.
The tariff increases was motivated by increased primary energy costs to run the gas turbine
peaking plants as well as to cover capital costs. Of this, NERSA approved 14.2%, mainly on the
basis of increased primary energy costs, but did not allow requested revenues for capital costs
as these costs applied not to the regulatory asset base, but to Eskom’s corporate division and
specific customers. NERSA can be seen to be critical of Eskom’s required revenue applications
at this stage.
When the electricity crises hit in 2008, Eskom applied for a 60% increase. The reasons for the
request were based on increase energy costs as well as the need to ramp up the demand side
management (DSM) programme. The approval in June 2008 by NERSA was for a 13.3%
increase over and above the already given 14.2%, which was a total increase of 27.5% for
2008/9.
32
The MYPD1 to 3 descriptions are largely drawn from Rustomjee (2013).

Page 61 of 137
However, it is argued that even the tariffs granted by NERSA in this phase resulted in sub-
optimal prices, with NERSA facing pressure from governmental policy objectives of lowest
possible electricity prices.
MYPD 2
Eskom requested rule changes to the MYPD in this tranche (September 2007) to take into
account primary energy costs, capital expenditure and a new rule for ‘re-opener’ triggers, which
refer to the conditions required to re-open the determination. NERSA did not allow changes
during the present MYPD period, but acknowledged that in the next period of review (2008), the
issue around primary energy cost changes, certain capital expenditure increases and other
triggers (aside from the existing inflation trigger) such as exchange rates, would have to be
considered.
Eskom’s application as part of MYPD 2 in March 2008 for 2008/9 was for a 53% increase in
2008/9 and 43% increase in 2009/10. The main reasons for the increase request again included
increases in primary energy costs and costs of the Demand Side Management Programme. The
tariff increase allowed in MYPD 2 was 27.5% which was made up of 1.42% increase for 2008/9
and 13.3% in response to its 53% increase request.
In 2008, NERSA also approved the pass through of primary energy costs (subject to certain
conditions), introduced a Capital Expenditure Carry over Account (CECA) to track capital
expenditure-related variances, and allowed further criteria for opportunities to re-open the
determination.
This reflected NERSA’s willingness to engage with Eskom in a transparent manner and to be
flexible given practical and unexpected difficulties faced by Eskom, provided it was justified.
However, NERSA continued to be critical of Eskom’s cost calculations and according to certain
views, was still subject to political pressure. For instance in 2010, NERSA only granted Eskom a
return on assets of 0.8% instead of the applied 8.16% (Steyn, 2012). This appears to have
stemmed from disagreements on what the appropriate valuation of the regulatory asset base
should be (see later for a discussion on this).
This latter topic of the valuation of the regulatory asset base was another major change that
occurred in 2008. By 2008, existing Eskom assets had depreciated significantly translating into a
low value in the required revenue formula and hence, a low price. Until 2008, NERSA used an
indexed historical cost method to value the regulatory asset base. This resulted in under
recovery of costs when the large new power station assets started coming onto Eskom’s books.
After 2008 the valuation was changed to replacement cost of capital valuation, the implications
of which are discussed in the next section.

Page 62 of 137
MYPD 3
The latest MYPD 3 submission by Eskom in October 2012 was for an increase of 16%, based
predominantly on the new capacity build of Kusile power station. This included a 1 020 MW
peaking plant and the first 3 725 MW of the REIPP procurement programme. The cost of
purchasing power from these IPPs is estimated at ZAR 750 billion for the period 2013/2014-
2030/2031. During the MYPD period, IPPs purchases will be ZAR 150 billion. In terms of the
MYPD revenue application, 13% of the revenue needed was for Eskom’s cost recovery and the
ZAR 150 billion estimate for IPPs was 3% of the revenue application. In total, its MYPD 3
application was for allowable cumulative revenue earning of ZAR 1.1 trillion.
The main issues raised in MYPD 3, for which submissions were made by the public through the
consultation process, were around primary energy costs, the weighted average cost of capital,
the regulatory asset base, IPP purchases, integrated demand management, operational
expenditure and tariff restructuring. During the year ended 31 March 2013, Eskom’s primary
energy costs surged by 36.1% to ZAR 28.05 c/kWh, with coal accounting for 53% of the
increase.
As part of the MYPD 3 process, Eskom also requested some tariff structuring changes. This
included the request to simplify residential tariffs, recalculate costs to service customers, further
unbundling of tariff components, and cross subsidisation and revision of tariffs for peak demand
energy in winter.
Eskom was allowed an 8% increase in this round, and some of the above tariff structure
changes requested was granted with conditions.
4.2.4 What are the main influences on costs, therefore influencing the Multi-Year Price
Determination outcome?
4.2.4.1 Valuation of Eskom’s Regulatory Asset Base (RAB)
One of the major debates within the pricing of electricity has been the issue of how Eskom’s
asset base has been valued and the shift to replacement cost, or inflation-indexed asset
valuation from historical cost of capital. This has a significant impact on the generation cost
component described above.
As previously stated, prior to 2008, the RAB was valued at indexed historical cost of capital.
Following 2008, NERSA allowed for the valuation to shift to replacement cost, also known as
modern equivalent asset or inflation-indexed asset valuation. This asset valuation adjustment
was meant to be phased in over five years.
The implications of the appropriateness of using a historic or replacement cost of capital to value
to RAB is at the centre of the debate as it influences the rate at which Eskom recoups its
investment costs and hence influences price stability. The asset base that NERSA allows the

Page 63 of 137
utility to earn revenue from includes the assets it uses to provide electricity as well as new
investments under construction (which includes the new build or expansion programme). It also
includes net working capital for Eskom to meet short term obligations (NERSA, 2011: 13).
Both the historical asset values and replacement asset values methods treat annual operating
and fuel costs the same way, as both are recovered fully on an annual basis.33 What is different
between the two methods is how the cost of asset acquisition is recovered, particularly given the
gap between the financial outflow for the investment and the financial inflow to recover the
capital expenditure. This gap results in another cost being incurred, namely financing costs such
as interest costs. Assets could be financed through either debt or equity. Debt funding is tax
deductible, whereas equity funding is not, therefore if the asset is financed through equity (or a
portion thereof), a further cost component is incurred- that of income tax. In the case of Eskom,
NERSA factors in the tax cost by ‘grossing-up’ the cost of equity to a pre-tax level (Joubert,
2012).
The determined revenue from each method (historical or replacement cost) is equal when
considered over the full life cycle of the asset however. In other words, the Net Present Value
(NPV) of the life cycle revenues is identical under both approaches.
Under the historic cost approach, revenues are awarded to compensate for operating costs, fuel
costs, annual depreciation and interest cost of capital. These are referred to the ‘revenue
building blocks’. Company income tax incurred as a result of equity financing could be added as
a fifth block or, as is done for Eskom, by ‘grossing-up’ the cost of equity to a pre-tax level.
Assets (made up of equity and debt) equate to total capital, and the cost of capital can be
proxied by the Return on Assets (ROA).
When the time comes for the asset to be replaced, at the end of its operational life, new equity
or the raising of additional debt would be required to fund the new asset (it is argued that the
cash accumulated through depreciation of the original historical acquisition cost is insufficient to
fund the new asset in an inflationary environment). Tariff adjustments at this point would
therefore need to account for this, and this would result in a steep price ‘spike’.
Under historical cost accounting, annual depreciation is calculated by dividing the original cost of
the asset by the anticipated operational life of the asset. Under a straight line depreciation
method, the same resultant nominal amount of annual depreciation would be incurred for each
year of the life of the asset, and this would be added to the ‘revenue building blocks’ calculation
in the electricity price determination mechanism. However in inflationary environments, the
purchasing power of this amount decreases, and therefore so does the real price of electricity.
There is a similar impact on the ROA calculation, where in inflation-adjusted terms, the ROA will
33
Both are actual costs incurred in cash in each time period, and most commonly are recovered in the same period. Therefore, no funding is usually required to bridge the gap between financial outflow and inflow (unlike the case of capital costs) (Joubert, 2012).

Page 64 of 137
decline. The impact is compounded however for the ROA calculation in that the ROA
percentage is applied to the depreciated value of the asset.
Therefore under the historical cost approach the electricity tariff is significantly lower at the end
of the life of the asset than it is at the beginning of the life of the asset. When it comes to
replacing the asset, the tariff spikes up to compensate for the costs of the new asset. The chart
below broadly reflects this:
Figure 12: Stylised revenue (and price) trajectory if historical cost of capital is used to
value assets
Source: Joubert, 2012.
Note: HC=Historical cost, LCOE= Note: LCOE: Levelised Cost of Electricity (where price per unit of output
where PV of life cycle revenue = PV of total life cycle costs)
The replacement cost of capital, or inflation indexed,34 approach differs from the historical cost
approach in the recovery of the invested capital. The replacement cost of the asset is the
amount that a buyer or new entrant would pay to build or acquire an alternative, equivalent
asset, or what it would cost the company to replace the entire asset. The argument is that using
34
These may not be technically equivalent in reality.

Page 65 of 137
replacement values in tariff determination allows a firm to generate a reasonable rate of return
on its assets which is not eroded by inflation.
Under the replacement cost method, the initial annual depreciation charges are calculated by
dividing the original historical cost price of the asset by the anticipated operational life (as it is
under historical cost regulation). The difference is that annual depreciation is also indexed to the
rate of inflation from the initial starting value. This results in regulated revenue increasing at the
rate of inflation over the operational life of the asset (Joubert, 2012).
The ROA percentage would also be applied to an asset that is indexed to the rate of inflation.
The ROA amount will continue to decrease in ‘real’ or inflation-adjusted terms over the
operational life of the asset. The combination of inflation increased depreciation costs and lower
ROA results in higher required revenue under replacement cost method compared to historic
cost method of valuation.
When replacement cost valuation is used, significantly higher revenue results at the end of the
operational life of the asset and reduced revenue at the beginning of the asset’s operational life.
This is broadly depicted in the figure below
Figure 13: Stylised revenue (and price) trajectory if inflation-indexed cost capital is used
to value assets
Source: Joubert (2012).

Page 66 of 137
While the replacement cost method provides for a more accurate valuation of new assets, it has
been criticised in that it could result in inflated tariffs. These observations were made by several
commentators and academics, including in relation to the experience of British gas and water
regulation. Whittington suggested that if tariffs were based on book values of the assets (rather
than actual cost or cash spent), the new asset owners (in the context of privatisation) would gain
large wealth windfalls at the expense of gas and water consumers who would have to fork out to
pay the inflated RAB based tariffs. He notes:
“To adopt a replacement cost or current cost approach at this late stage would involve a very
large transfer of wealth from the consumer to the shareholder, which would be inconsistent with
the requirement that the regulator strike an appropriate balance between these interests by
allowing a return sufficient to justify the shareholders’ investment but not excessive from the
perspective of the consumer” (Whittington 1998a: 93).35
This raises the issue of a change in asset valuation of Eskom’s RAB from historical cost
accounting to replacement cost. NERSA has phased this approach over five years to avoid the
big price shock that would result as a consequence, and in this sense, it could be argued that it
has applied the MYPD formula inconsistently.
4.2.4.2 Accurate reporting of all other costs
As previously stated, while the rate of return methodology has several positive implications,
such as price stability, sustainability and financial viability through changing economic conditions
for the regulated entity, the incentives to minimise costs (through increased efficiency) is
reduced and incentives to ‘pad’ expenses is higher, compared to other types of economic
regulation.
Therefore, such a methodology through which tariffs aim to recover all costs incurred requires
an accurate determination of various cost parameters. As the narrative in the historic pricing
section clearly shows, NER and NERSA have, more often than not, taken a firm stance on costs
that Eskom has not been able to properly justify (although arguably, part of this firm stance may
have been politically motivated). In most instances, requested required revenues were not
granted and specific cost components have been publically scrutinised.
For example, as part of the MYPD 3 process, NERSA recently made a decision on Eskom’s
applications for its requested revenue in March 2013 (van Vuuren, 2013) where it cut Eskom’s
request for revenue by more than ZAR 180 billion over the next five years. This was following
NERSA’s findings of inflated cost bases and incorrect assumptions in Eskom’s application. The
end result of this finding was that Eskom’s 16% a year increases request, which was expected
to generate revenue of ZAR 1.08 trillion, was not accepted, and a smaller increase of 8% a year
35
The debate on whether replacement cost or historic cost is the more appropriate basis is a long and contentious one. This section does not attempt to go into a detailed discussion on this.

Page 67 of 137
was approved. NERSA’s electricity subcommittee chairman, Thembani Bukula, explained that
Eskom’s requested revenue would have resulted in ZAR 46 billion retained earnings, even after
paying all operating costs and down payments on loans for the building of the Medupi and
Kusile power stations. This high level of retained earnings was seen as unjustified by NERSA,
and allowing for the requested price increases would have placed a large burden on already-
stretched customers. NERSA also found significant cost anomalies in Eskom’s application, for
instance, costs were added for solar water heaters and pumps which were already funded by
the NT through a special fund and coal price projections were higher than what was in the
previous application, inflating the base. Such costs were removed in NERSA’s revised
calculations. NERSA also did not take into account the power buy-back schemes from the
ferrochrome and ferromanganese smelters in its determination (see Chapter 5). The biggest
cost saving was apparently on depreciation costs, resulting in costs being slashed by around
ZAR 45 billion. NERSA allowed an 8% increase in tariffs at the end of this process.
But accurate cost valuation goes beyond just understanding costs presented to NERSA by
Eskom. If Eskom could be more efficient, for instance in its procurement of coal as primary
energy (a major cost component), costs would be reduced. NERSA has started playing a bigger
role in understanding how Eskom could be more efficient in procuring coal. Understanding the
coal market’s impact on Eskom operations and the interrogation of these costs from NERSA’s
perspective involves not only understanding trends in terms of pricing, but understanding coal
supply issues in South Africa as well as matters regarding coal contracts and quality of supply
(both in the short and long term).36 Given one of the key disadvantages of rate of return
methodology- that of the tendency to inflate costs and not invest in improving efficiency-
NERSA’s increased scrutiny in this area is a positive step.
4.3 The Multi-Year Price Determination process: How it works in practice
The MYPD process is based on a tariff application submitted to NERSA by Eskom with
information based on requirements stipulated by NERSA. NERSA37 explains that the tariff
determination involves receipt of the tariff application from Eskom; and after the minimum
information required is received, a consultation paper is commissioned for tariff calculation and
evaluation. The application that Eskom makes is not necessarily for a specific tariff structure
(discussed in the next section) but for a required rate of return which is used to inform the tariff
level required. A rate of return is established based on the information and reasons Eskom
provides and on the calculations and considerations made by NERSA. Part of the decision
making NERSA engages in is to provide detailed explanations and reasons for the final decision
made. NERSA evaluates the application and interrogates the proposal increase based on an
established formula:
36
Interview with NERSA, 5 November 2013. 37
Ibid.

Page 68 of 137
Figure 14 below offers a simplified demonstration of the process involved in the tariff setting
methodology:
Figure 14: Electricity Tariff Determination Process
Source: Amra, 2013
The modelling capabilities within NERSA to adequately interrogate the tariff application made by
Eskom are critical to proper price setting.38 Within the organisation there are ‘dedicated teams’
that look the implications of the following on the cost of electricity:
- coal prices and policy trajectory
- fuel prices and policy trajectory
- exchange rate impact and macroeconomic developments
- DoE policy on electricity supply
- demand growth in terms of electricity demand
- Eskom projects and planning
NERSA also hires external consultants from time to time to assist in these processes.
NERSA, aside from electricity, regulates petroleum pipelines as well as piped gas industries.
There are different methods of price regulation employed in these different industries. However,
learnings and experiences do not seem to be shared between these different units. Each unit
appears to operate in a silo. Sharing experiences would benefit all units.
38
Interview with NERSA, 5 November 2013

Page 69 of 137
Price increases that have been approved by NERSA between 2005 and 2013 are tabled in the
summary below.
Table 5: Summary of NERSA Decisions
MYPD 1: 2008/9 Eskom Electricity Price Increase
Feb 2006 Original NERSA MYPD1 decision 6.2%
May 2009 Eskom applies for revision 34.0%
June 2009 NERSA approves 31.1%
ACTUAL PRICE INCREASE FOR 2008/9 is 27.5%
MYPD 2 (2010/11/12/13)
Sept 2009 Eskom intends to apply for an increase of 45% per annum
Nov 2009 Eskom reduces request to 35% after consultation with NT and SALGA
April 2010 NERSA approves average of 25% for each year
Feb 2012 Eskom applies for a reduction to 16% increase
March 2012 NERSA approves reduction to 16% increase
MYPD 3 (2014/15/16/17)
2013 Eskom applied for an increase of 16% per annum
2013 NERSA approves reduction to 8%
Source: TIPS
As can be seen, the initial price increases requested by Eskom were not always granted by
NERSA. Had the MYPD formula been strictly adhered to, the price increases allowed by NERSA
would have been higher.
4.4 Conclusion
The electricity price path in South Africa has been influenced mainly by large scale
infrastructure spend on new power stations. Capacity investment decisions made in the
1970 and 1980s with substantial state support at the time meant that Eskom did not bear
the full brunt of the debt burden of the build. With this support, it could afford to continue to
price at sub-economic prices well into the nineties. Several years of falling real electricity
prices stimulated electricity demand, but also made it difficult for Eskom to build up
sufficient reserves to fund additional capacity. Lessons from the 1970s’ experience of large
price spikes as a result of new build seem not to have been learnt and the same pattern
emerged in 2008 when new power stations were commissioned to be built . The massive
scale of the capital expansion programme, delays in construction and selection of
technologies further exacerbated the costs of new generation capacity. The 2008 situation
was exacerbated given the load shedding crises stemming from poor coal/ primary energy
stock management.

Page 70 of 137
NER and NERSA have nonetheless played an active role in scrutinising cost components in
Eskom’s tariff applications, granting lower tariffs than what was requested when cost
components were not properly justified. The process however has also been politically
influenced and prices as a result are alleged to still be sub-economical and not fully cost-
reflective. NERSA attempted to smooth the transition from historical cost of capital RAB
valuation to replacement cost in 2008, but the price hikes that resulted from this change
were still significant over the years. This inconsistent implementation of the MYPD
framework by NERSA, although resulting in prices lower than would have been if MYPD
formula was strictly followed, results in uncertainty for users. A more defined MYPD
methodology and more consistent application of the MYPD principles from period to period
might give NERSA a stronger framework and greater strategic direction to balance the
competing needs it must consider when it sets tariffs and also provide stakeholders with
information to understand its decisions better.

Page 71 of 137
5. Pricing to different customer groupings
This chapter explores the different tariff structures and the rationale for changes over time,
explaining NERSA’s role and responsibility in tariff determination and investigation. It also looks
at tariff setting behaviour of municipalities, an area of concern for several small businesses and
households. Finally it assesses, by means of case studies, pricing to certain large industrial
groupings.
5.1 The different Eskom tariff structures
The MYPD determination discussed in Chapter 4 translates to pricing to different customer
groupings through the determination of retail tariffs by NERSA. The average price increase
determined by the MYPD will result in different percentage increases for different customer
categories based on the tariff structures for these groupings.39 The basic structures of these
tariffs were initially developed by Eskom and are supposed to be reviewed by NERSA as part of
the considerations in the MYPD process and thereafter (outside of the MYPD process).
Initially there were three major tariffs (for large power users; small power users and domestic
users) that applied to customers in the early 1990s. This has, in more recent years, been
broken down into various tariffs under four key category groupings namely residential, urban,
rural and municipal.
There appears to have been four significant tariff structure changes over the years. These
include:
the nationalisation of tariffs in the mid-1980s;
the introduction of connection charges in the 1990s;
a basic charge being introduced from early 2000s; and
further unbundling of the basic charge.
Furthermore, adding description of subsidies explicitly in tariffs (reflecting in billing) was
implemented from 2005.
5.1.1 Different tariff structures
Within the four category groupings (residential, urban, rural and municipal), there are in turn
different tariffs that apply to customers depending on their load profiles and use of electricity.
The main components of a tariff consist of the cost of serving a customer, their load profile
39
For example, when the MYPD 2 was announced for 2010-2013, the average price increase per year was 24.8%, 25/8% and 25.9% for the respective years (2010/11; 2011/12 and 2012/13). In terms of the average increase to local authority rates (municipality rates) this would be an average increase of 28.9% applicable from July 2010. For the other three major groupings (urban, rural and residential) however the increases were 23.5% for urban (including Megaflex, Miniflex, Nightsave urban, public lighting and Businessrate); 18.7% for rural (including Nightsave rural, Ruraflex, Landlight and Landrate) and -9.% for Homelight and 7% for Homepower respectively.
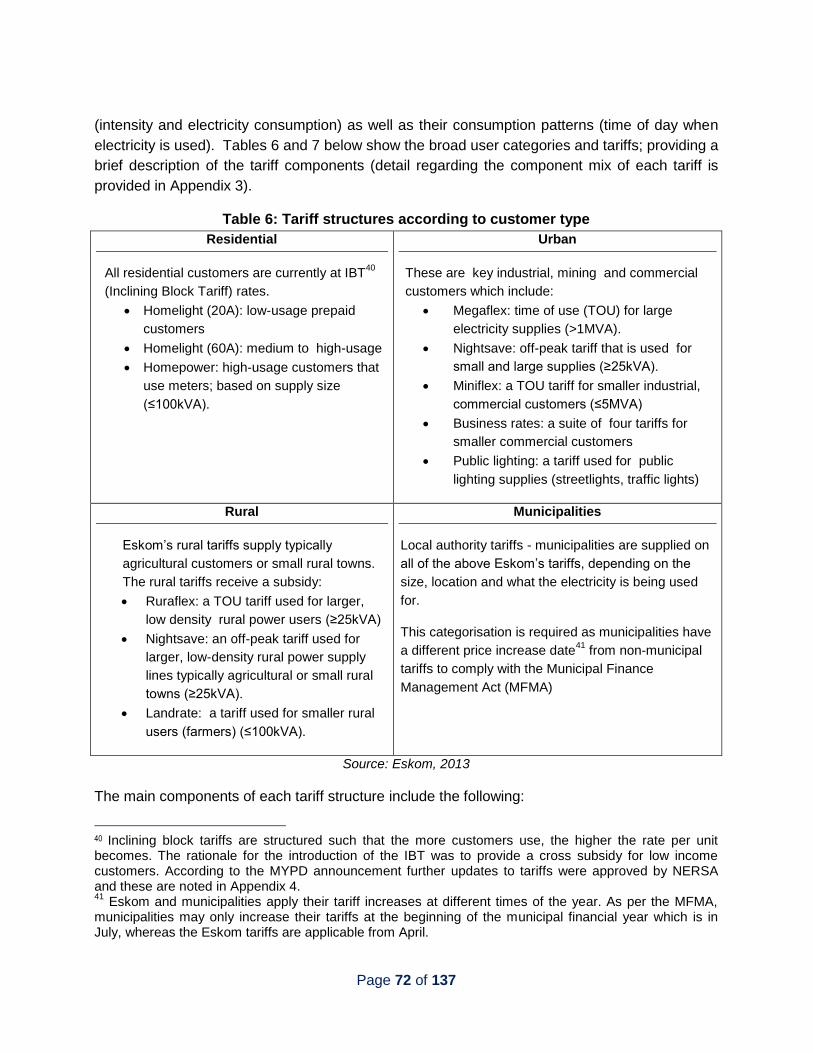
Page 72 of 137
(intensity and electricity consumption) as well as their consumption patterns (time of day when
electricity is used). Tables 6 and 7 below show the broad user categories and tariffs; providing a
brief description of the tariff components (detail regarding the component mix of each tariff is
provided in Appendix 3).
Table 6: Tariff structures according to customer type
Residential
All residential customers are currently at IBT40
(Inclining Block Tariff) rates.
Homelight (20A): low-usage prepaid
customers
Homelight (60A): medium to high-usage
Homepower: high-usage customers that
use meters; based on supply size
(≤100kVA).
Urban
These are key industrial, mining and commercial
customers which include:
Megaflex: time of use (TOU) for large
electricity supplies (>1MVA).
Nightsave: off-peak tariff that is used for
small and large supplies (≥25kVA).
Miniflex: a TOU tariff for smaller industrial,
commercial customers (≤5MVA)
Business rates: a suite of four tariffs for
smaller commercial customers
Public lighting: a tariff used for public
lighting supplies (streetlights, traffic lights)
Rural
Eskom’s rural tariffs supply typically
agricultural customers or small rural towns.
The rural tariffs receive a subsidy:
Ruraflex: a TOU tariff used for larger,
low density rural power users (≥25kVA)
Nightsave: an off-peak tariff used for
larger, low-density rural power supply
lines typically agricultural or small rural
towns (≥25kVA).
Landrate: a tariff used for smaller rural
users (farmers) (≤100kVA).
Municipalities
Local authority tariffs - municipalities are supplied on
all of the above Eskom’s tariffs, depending on the
size, location and what the electricity is being used
for.
This categorisation is required as municipalities have
a different price increase date41
from non-municipal
tariffs to comply with the Municipal Finance
Management Act (MFMA)
Source: Eskom, 2013
The main components of each tariff structure include the following:
40 Inclining block tariffs are structured such that the more customers use, the higher the rate per unit becomes. The rationale for the introduction of the IBT was to provide a cross subsidy for low income customers. According to the MYPD announcement further updates to tariffs were approved by NERSA and these are noted in Appendix 4. 41
Eskom and municipalities apply their tariff increases at different times of the year. As per the MFMA, municipalities may only increase their tariffs at the beginning of the municipal financial year which is in July, whereas the Eskom tariffs are applicable from April.

Page 73 of 137
Table 7: Main components of tariff structures
Supply side Depending on the voltage use by customers different rates apply and a
voltage surcharge is applied for the cost to transform electricity from high
voltages to lower voltages. This is calculated as a percentage of the active
energy charge, energy demand charge and network charge combined. The
transmission surcharge is for covering the cost of the transmission of energy
over long distances. After the voltage surcharge is levied a further
transmission charge may be applicable depending on distances from
electricity source.
Administration Charge Applies to the premises where electricity is used, charged at a R/day and is
based on monthly use of electricity; contributing to the fixed costs for meter
reading and billing
Network charge A fixed monthly charge that applies whether electricity is consumed or not
Energy Demand Charge Units of electricity consumed measured in kwh and this can be adjusted in
terms of time use as well as seasonally adjusted;
Reactive Energy Charge This applies to Megaflex, Miniflex and Ruraflex and is a levy applied in
excess of 30% of active energy supplied in a specific period
Rate rebalancing levy This represents the cross subsidy in electricity tariffs and is applied to total
active energy and is not subject to voltage differences or transmission
charges.
Source: Simbalism Consultants, 2013
The above table shows that there are a number of components in the make-up impacting on the
cost of providing electricity to customers (discussed in Section 5.1.2 below). This is driven by
the customers’ consumption volumes and patters (time of use and seasonal use). Other factors
include the size and capacity of the electricity to be supplied, as well as the geographical
location of customers and the cost of connections to supply these customers.
In terms of the design and principles behind tariff structures, the following building blocks are
considered:

Page 74 of 137
Figure 15: Building Blocks of Tariff Design
Source: RSA Distribution Code, 2007
Unbundling the different cost components has been an ongoing process between Eskom and
NERSA in achieving greater transparency and cost reflectivity in tariff structures. One of the
criticisms in Eskom’s tariff structures historically has been that not all of the tariff packages are
sufficiently unbundled. Any tariff restructuring or unbundling requires approval from NERSA
which is over and above the average price increase process. Unbundling entails showing the
costs of supplying electricity based on different charges in the cost related to different
components that make up the price. The unbundling of Eskom’s tariff components is a process
that began as early as the 1990s.
Eskom last restructured tariffs on 1 July 2009. It is a process that, according to the Promotion of
Administrative Justice Act, requires consultation with customers. This is due to the requirement
that an organ of the state ensure proper consultation for any decision that may adversely affect
the rights of any person. Furthermore, consultations on the changes to tariffs are only allowed
after the NERSA decision on price increases. This creates some level of instability in prices paid
by customers because the return revenue requirement for Eskom in relation to the annual
increase would have been calculated based on different (previous) tariff structures. After the
introduction of the inclining block tariffs was implemented in 2011 there have been no further
tariff changes but Eskom has made recommendations for the introduction of a tariff for
municipalities (Muniflex, see section 5.3).

Page 75 of 137
The changes that have been made to tariff structures over time are captured in the following
paragraphs.
The Megaflex tariff was first introduced in 1991. A basic charge for electricity as part of the tariff
was introduced in 1992 followed by adding the connection fee charged from 1993 (which is part
of the cost of supplying electricity). Ten years later the basic charge was broken down into three
components which were made up of a service charge, administrative charge and a network
charge; and these were later broken down into five smaller cost categories. The Miniflex was
modelled on the Megaflex structure however excludes the demand charge that features in the
Megaflex rate. The Megaflex tariff in the figure is composed as follows:
Box 3: Megaflex Tariff composition, 2012
Seasonally and time-of-use differentiated c/kWh active energy charge; based on the voltage of the supply and the transmission zone
• Three daily time-of-use periods namely peak, standard and off peak periods • A R/kVA/month transmission network charge based on the voltage of the supply, the transmission zone and the utilized capacity applicable during all time periods • A R/kVA/month distribution network access charge based on the voltage of the supply and the utilised capacity applicable during all time periods • A R/kVA/month distribution network demand charge based on the voltage of the supply and the chargeable demand applicable during peak and standard periods • A c/kvarh reactive energy charge supplied in excess of 30% (0,96 PF) of the kWh recorded during the peak and standard periods. The excess reactive energy is determined per 30-minute integrating period and accumulated for the month and will only be applicable during the high-demand season • A c/kWh electrification and rural subsidy contribution to cross-subsidies to rural and Homelight tariffs, applied to the total active energy supplied in the month • A c/kWh environmental levy charge, applied to the total active energy supplied in the month • A R/day service charge based on monthly utilised capacity of each premise linked to an account • A R/day administration charge based on monthly utilised capacity of each premise linked to an account
Source: Eskom Tariffs & Charges Booklet 2011/12
The Nightsave rate has differentials in terms of voltage requirements and a voltage discount was
introduced to replace the voltage-differentiated demand charge in 2002. The demand rates were
later also seasonally adjusted to strengthen the implementation of demand side management by
Eskom.
In the 1980s the monthly extension charges for rural customers was reduced by 40% in order to
reduce the cost of connection for new customers and to share costs across the customer base.
Rural subsidies were also introduced as early as the 1980s with a R/kVA rebate being applied to
the large power tariffs. The mandated subsidy was aimed at Eskom’s drive towards rural
electrification.
Time of Use (TOU) was introduced to tariffs in 1992 and this was followed in 2002 by voltage
discounts that later became the voltage surcharge.

Page 76 of 137
It was not until 2004/5 that the inter-tariff subsidy was shown on statements that customers
received. The subsidy paid had previously been hidden but now reflected as a ‘rate rebalancing
levy’ (later changed to electrification and rural subsidy, see also Box 3 above) on customer bills.
It was also separated out from any energy charges.
The inclining block tariff became applicable to residential customers from 2011. Inclining block
tariffs (IBT) are structured such that the more customers use, the higher the rate per unit
becomes. The rationale for the introduction of the IBT was to provide a cross-subsidy for low
income customers. The IBT was a design by NERSA and not Eskom. They affect the residential
tariffs only, namely Homelight (1 & 2 A20; 1 & 2 A60) and Homepower. There has therefore
been a proactive move by NERSA to be more involved in tariff structure design compared to the
past.
5.1.2 Rationale for differences in tariff structures
As raised earlier, the difference in pricing to different customers is partly as a difference of cost
to serve different customer groupings, but also partly due to special deals struck with specific
customers and as a result of cross-subsidisation imperatives to provide poor customers and
rural areas with more affordable electricity.
According to Eskom, to compensate for its pro-poor service delivery initiatives, it supplies
electricity to more lucrative large end-users in the agriculture, mining, manufacturing and
transport sectors. Supplying these sectors, in Eskom’s view, is more lucrative than domestic
end-users as the average cost of distribution is less due to scale economies, benefits of
agglomeration and less administration. Tariffs are impacted by customer profiles (load profiles)
as well as their consumption patterns (use of electricity).42 In terms of adjusted rates within tariff
structures, these are meant to be checked against the NERSA approval forecast which is meant
to ensure that recovery of revenues is done within the approved cost estimated.
The table below shows some of the cost estimates of providing electricity for different customer
groupings compared with the actual tariff rates based on 2009 numbers.43 This shows the
difference between the cost of supply and the rates charged out as the tariff. What Table 8 also
shows is that for categories such as Nightsave Rural, Ruraflex (under category ‘Rural’) and
Homepower, Homelight and Landrate (category ‘Residential’), the tariffs do not cover cost of
supply. This implies that (at least in 2009), the other tariff structures cross-subsidised these
categories. Figure 16 below from Eskom also illustrates the differences in cost to delivering
electricity to smaller users.
42
Eskom has developed a modelling tool for certain customers to show the impact of their profile and use on the end price to be charged http://www.eskom.co.za/CustomerCare/TariffsAndCharges/Pages/Tariffs_And_Charges.aspx 43
We have not been able to reproduce this over time given lack of data.

Page 77 of 137
Table 8: 2009 Costs of supplying different groups of customers compared to the
respective prices/tariffs
Source: Eskom Financial results 2009 http://www.financialresults.co.za/eskom_ar2009/ar_2009/info_sheets/pricing_03.htm
Figure 16: Cost to serve
Source: Eskom, MYPD 3 application, January 2013
Tariff
Costs Tariff rate
Difference c/kWh c/kWh
Megaflex 20,6 22,5 9%
Nightsave Urban 21,9 25,0 14%
Miniflex 24,4 26,3 8%
Nightsave Rural 45,1 36,4 -19%
Ruraflex 53,8 34,0 -37%
Businessrate 36,7 43,7 19%
Homepower 52,2 48,9 -6%
Homelight 77,7 53,9 -31%
Landrate 73,6 56,6 -23%
Total 25,5 25,5 0%

Page 78 of 137
5.2 Trends over time
Eskom tariff structures have changed in composition over time as reflected in the above
narrative. This has been related to attempting to affect consumption patterns, increase cost-
reflectivity and allowing for the cross-subsidisation of rates between customers. These changes
impact the pricing to different customers and the graph below shows the different prices that
different customer groups have paid in since the nineties. Residential and rural customers in
general face higher c/kWh tariffs compared to industrial commercial and mining companies,
despite cross-subsidisation.
However, this differential has increased over time. In other words, the gap between categories
such as industrial, mining and commercial users (predominantly under Megaflex) and
Residential and Rural customers has been increasing. This suggests that either the costs to
supplying Residential and Rural customers is increasing at a greater rate than cost to supply
industry, or the cross-subsidy to these categories is decreasing, or large customers on Megaflex
tariffs may be locked into long term favourable deals which serve to keep electricity prices from
increasing by the same rate as other categories. Particularly after 2008, residential and rural
electricity users have been more negatively impacted by rising prices than large industrial
customers. Again however, it is noted that the costs to supply large industrial users is generally
lower.
Figure 17: Tariffs to different electricity users, 1996 to 2012
Source: Data provided by Eskom (2014)

Page 79 of 137
While it is important to acknowledge that NERSA has made important strides in making the
different Eskom’s tariff structures more transparent, user friendly and cost-reflective over the
years (clearly positive developments towards more efficient regulation), it appears that tariffs to
large industrial users, such as those on Megaflex, as well as those under special deals have not
been revised according to changing supply and demand balances and economic conditions.
As will be discussed later, certain of the special deals with large electricity users were entered
into at a time when there was surplus electricity in the country. Given that the surplus of the
1990s is no longer available, the question to be asked is if it makes sense to have a widening
gap between residential/rural and industrial customers. Prices to heavy-users of electricity would
be thought to be increasing relative to light users in such situations so as to discourage the use
of electricity and encourage investment in energy efficiency and renewable energy.
The price to industrial users is low in relation to other countries as is clearly seen in the figure
below.
Figure 18: International average electricity prices to industrial users
Source: Deloitte, 2012.
The pricing to residential customers is also one of the lowest as is evident in the figure below.

Page 80 of 137
Figure 19: International average electricity prices to residential users
Source: Deloitte, 2012.
However, the differential between residential and industrial tariffs in South Africa is one of the
highest, reflecting the fact that residential tariffs are proportionally much higher than industrial
tariffs in South Africa. Eskom calculates that the residential tariff (which takes into account the
provisions for low income households) is 74% higher than the industrial tariff (the Megaflex tariff,
not including special industry deals). This compares with an international average of 40%.44
According to the above graphs, industrial customers in South Africa pay almost half the
electricity rate (average of 0.025 US cents per kilowatt hour) of residential users (who pay an
average of 0.5 US cents per kilowatt hour). A recent study conducted to compare the difference
between industrial and residential pricing between South Africa and other countries showed that
the differential between these two prices are high for South Africa, shown in the table below.
However it is important to note that the costs to serve these different groupings in different
countries may be different, as is the split between residential and industrial sales volumes in the
different countries (hence affecting relative costs to serve). Therefore any differences in prices
must be interpreted with this in mind. This being said, even for countries with similar proportions
between residential and industrial customers such as Mexico and Finland, the difference in
South Africa is largest, with only Belgium showing similar large differences between the two
groupings.
44
Slide 30, Eskom/DPE presentation

CCRED Centre for Competition, Regulation and Economic Development
2007 2008 2009 2010
Prices (USD cents/kwh)
Consumption (% of sales) Prices (USD cents/kwh) Consumption (% of sales) Prices (USD cents/kwh)
Consumption (% of sales)
Prices (USD cents/kwh)
Consumption (% of sales)
Domestic Industrial Domestic Industrial Domestic Industrial Domestic Industrial Domestic Industrial Domestic Industrial Domestic Industrial Domestic Industrial
Country
Belgium 14.51 9.62 26% 48% 18.53 9.83 24% 47% 16.05 11.39 26% 42% 16.85 10.87 24% 46%
Denmark 12.65 9.42 31% 30% 16.95 11.34 31% 29% 14.89 10.52 32% 32% 15.54 11.24 32% 27%
France 10.35 5.82 34% 31% 10.25 6.33 35% 30% 10.34 6.73 36% 27% 11.29 7.11 37% 26%
Finland 9.23 5.98 25% 54% 10.38 7.03 26% 52% 10.63 7.2 29% 47% 11.18 7.16 28% 48%
Greece 12.53 10.98 32% 28% 15.05 13.12 33% 27% 13.25 12 33% 26% 13.27 12.12 34% 27%
Ireland 17.64 12.89 31% 33% 18.85 14.93 32% 30% 18.1 12.95 32% 34% 18.83 12.99 34% 36%
Mexico 13.06 14.45 24% 56% 13.39 15.82 23% 56% 10.68 11.78 24% 54% NA NA 24% 55%
Netherlands 15.05 10.03 22% 39% 15.61 10.52 23% 39% 16.34 10.92 23% 35% 15.01 10.12 23% 34%
Norway 13.17 7.73 32% 45% 15.85 9.58 31% 45% 14.91 8.87 34% 38% 17.99 10.38 35% 39%
Spain 15.82 12.52 27% 39% 17.75 14.12 27% 37% 19.4 15.59 30% 32% 20.75 14.46 31% 30%
South Africa 9.95 3.81 20% 56% 9.97 3.86 20% 58% 11.25 4.56 20% 59% 12.81 5.41 20% 57%
South Korea 11.49 8.44 NA NA 14.09 9.93 NA NA 9.67 7.43 NA NA NA NA NA NA
Sweden 12.48 8.02 30% 44% 14.57 9.84 30% 45% 14.05 9.07 33% 42% 16.59 10.83 31% 41%
Switzerland 9.66 5.93 30% 33% 10.34 6.32 30% 33% 9.82 5.87 31% 32% NA NA 31% 32%
Taiwan 11.93 9.23 NA NA 12.48 9.49 NA NA 12.82 11.73 NA NA NA NA NA NA
UK 17.38 12.72 36% 33% 19.61 13.45 35% 33% 17.78 12.91 37% 31% 17.89 12.42 36% 32%
USA 10.06 6.17 36% 24% 10.34 6.44 33% 33% 11.05 6.87 37% 22% NA NA 38% 23%
Table 9: International average prices for domestic and industrial customers
Source: Adapted from Pouris and Thopil (2013) including EIA sales data.
Note: the other categories of sales are transport, agriculture, other etc.

CCRED Centre for Competition, Regulation and Economic Development
5.3 Municipality pricing of electricity
The distribution of electricity is dominated by Eskom in terms of the volume of electricity. In
2012/13 Eskom distributed around 60% of the country’s power. Even though municipalities
supply more than half of all customers/end users, they supply less than half of electricity sold (in
GWh)45, distributing around 40% of electricity to end-users. Municipalities are primarily
responsible for distribution and retail activities in urban areas, and they purchase power from
Eskom for resale to consumers within their boundaries. Municipalities supply both poor and non-
poor customers and need to manage a large number of dispersed connections. Efficiency in
distribution requires investment and maintenance of a system of decentralised infrastructure to
supply residential and commercial users.
The spilt of customers and GWh sales as a proportion of total for 200646 is highlighted in the
table below.
Table 10: Electricity sales by category by Eskom and Municipalities, 2006
Source: National Treasury, 2012
The number of households receiving energy from municipalities has increased between 2003
and 2010 (see figure 20 below).
45
National Treasury presentation to Portfolio Committee on Energy: “Maintenance In The Municipal Electricity Distribution Industry, 25 July 2012 46
TIPS was unable to get more recent figures.

Page 83 of 137
Figure 20: Households receiving electricity from municipalities
Source: National Treasury, 2012
In 2010/2011, 178 municipalities reported R38billion spending on bulk purchases of electricity
from Eskom. Of these, only 6 account for 65% of all purchases, spending over R1.5billion each.
5.3.1 Concerns around municipality funding models and the impact on electricity prices
Serious concerns have been raised by households and industry that electricity prices are
excessively marked-up by municipalities, over and above Eskom’s tariffs, with no consistency
across municipalities. This is said to have large negative impacts on the competitiveness of
small industrial end-users supplied by municipalities. Examples of complaints made to NERSA
in this regard are given in Box 4 below.
Box 4: Extracts from submission by Nelson Mandela Bay (NMB) Chamber to NERSA on
MYPD 3
“The cost to industry in NMB is one of the highest in the world and has reached a tipping point.
Eskom and Municipalities see industry as “a milk cow”. The proposed increases will have a direct
impact on all energy consuming businesses. These prohibitive costs will result in business closures,
job losses and negatively affect investment decisions.”
“Municipal mark-ups fund municipality budgets for matters unrelated to electricity. Local authorities in
this country rely on between 25% and 60% of their income on profits made from electricity sales (8%
to 10% from water sales).
“Municipal Mark-ups of between 50% and 100% for electricity are a catastrophic reality for industry
and business. This is an unfair and unconstitutional taxation. Customers receiving an identical
service from Government are taxed in a different manner. Municipal mark-ups will switch the lights
off in South Africa.”
“Approximately 50% of electricity users buy electricity through municipalities.”
Hou
seho
lds
(mill
ions
)
(mill
ions
)

Page 84 of 137
“Government has no strategy regarding energy prices for Business and Industry for the whole
country, including municipal users.”
Source: Clark and van Vuuren, 2013
An Energy Intensive User Group (EIUG) study on municipality tariffs in 2012 emphasises some
of the problems:
Municipality tariffs for industrial users are increasing at a greater rate than Eskom tariffs
Fixed charges (demand charges) of municipalities are increasing at a higher rate than
energy charges. EIUG calculates that an industrial user of a given load profile and
consumption pattern would pay R39m if billed by Eskom directly compared to R65m if billed
by City Power (Rustomjee, 2013).
A comparison of Eskom and various municipalities is provided below by EIUG. As can be seen,
demand charges by the various municipalities are higher than Eskom’s.
Figure 21: Municipality tariff comparison to Eskom’s
Source: Delport, 2012, as cited in Rustomjee, 2013

Page 85 of 137
The process of municipality electricity tariff determination
The MYPD process also sets rates for municipalities, called ‘Local Authority’ tariff rates. NERSA
calculates an approximate or benchmark electricity price increase annually which is to be used
as a guide for municipalities in their price determination. This is done by grouping together
municipalities with similar characteristics, for instance, similar load profile, customer mix etc.,
and creating a benchmark tariff increase.47 More precisely, NERSA would assess the following
criteria in coming to this benchmark/guideline price:
Bulk purchases (Eskom’s Local Authority rate)
Bad debts
Reasonable energy losses
Salaries and wages (CPI escalated)
Repairs and maintenance (CPI escalated)
Capital charges and other costs (CPI escalated)48
Since most municipalities have not carried out calculations on cost to service customers,
NERSA uses Eskom’s costs to serve customer categories calculations to benchmark
municipalities. Public hearings are held on these guidelines and in parallel to this process
municipalities develop their individual annual electricity tariff proposals. For municipalities that
fall outside the benchmark, a process is available to motivate deviations from the benchmark.49
Repairs, maintenance and refurbishment
One of the considerations NERSA looks at in municipality requested tariffs is the investment
made in repairs, maintenance, refurbishment and new infrastructure costs of electricity
distribution networks. According to National Treasury, these should be part of operating cost
calculations, and should be funded through electricity tariffs. On the other hand, the operating
costs of providing free basic electricity (50kWh per month) for poor customers should be funded
by the national fiscus through the local government equitable share, grants or through the
Integrated National Electrification Programme (INEP). However, rural municipalities with a
greater proportion of poor customers are more reliant on grants to fund their activities. Unlike
larger, urban municipalities, these do not have access to borrowing to finance repairs and
maintenance, and they are not able to optimise revenues from electricity tariffs.
There are checks and balances in place for underinvestment in repair, maintenance and
investment. For instance, when a municipality allocates less than 40% of its capital budget to the
renewal of existing assets it must provide a detailed explanation and assurance that the
budgeted amount is adequate and where the budgeted amounts for repairs and maintenance is
less than 8% of the asset value of the municipality’s plant property and equipment they must
provide a detailed explanation. Further, all municipalities are required to provide information in
47
Interview with NERSA, 5 November 2013 48
National Treasury presentation to Portfolio Committee on Energy: “Maintenance In The Municipal Electricity Distribution Industry, 25 July 2012 49
Rustomjee (2013)

Page 86 of 137
budget documents on how they are planning, managing and financing repair and maintenance,
and asset renewal, as well as strategies in place to deal with any backlog.50 However, whether
these checks and balances are sufficient to ensure adequate maintenance is debatable. There
have been serious concerns about the quality of distribution infrastructure of many municipalities
(see later for a discussion).
In terms of the ERA, the municipalities have to apply to NERSA for a tariff increase by providing
cost breakdowns for all of the above. NERSA may approve a tariff that is higher than the
guideline/benchmark it calculates if the municipality can provide sufficient motivation for the
following additional costs and circumstances.
Extensive repairs and maintenance programmes
Need for additional funds to fill in critical vacancies
The municipality faces serious financial challenges and the municipality has been placed
under administration
Capital expenditure programmes
Any other electricity related project, such as Demand Side Management initiatives51
These above-average calculated increases require the municipality to ring-fence the additional
funding and use it for the intended specific earmarked purpose (e.g. infrastructure
maintenance). Reports on how the additional revenues were spent must be provided to NERSA
and what was not spent would be clawed back in the next financial year.
National Treasury has provided a list of examples of municipalities that applied of tariffs above
the guideline/benchmark tariff for 2012/13 FY citing repairs and maintenance, and what NERSA
approved. As can be seen in the table below, municipalities do not usually get the full amounts
they apply for.
50
National Treasury presentation to Portfolio Committee on Energy: “Maintenance In The Municipal Electricity Distribution Industry, 25 July 2012 51
National Treasury presentation to Portfolio Committee on Energy: “Maintenance In The Municipal Electricity Distribution Industry, 25 July 2012

Page 87 of 137
Table 11: Municipal proposed tariff increase v NERSA’s approved tariffs
Source: National Treasury, 2012
5.3.2 So what is the problem?
There appear to be four broad categories of problems which need to be considered when
attempting to understand the concerns with municipality electricity pricing and what NERSA’s
role to address some of these problems may be.
(i) Municipality funding models
The financial health of many municipalities is poor and surplus funds generated from selling
electricity cross-subsidises other essential services. For years, electricity sale was considered
the ‘cash cow’ in generating much needed revenue for municipalities. The 2011 Local
Government Budget and Expenditure Review estimated that by 2012/13, electricity revenues
would account for around 40% of revenues in municipalities licensed for electricity distribution.52
This trend however, according to National Treasury, is no longer the case in more recent
years.53 The table below submitted by National Treasury shows that the net surplus generated
by electricity sales has been declining over the years.
52 National Treasury presentation to Portfolio Committee on Energy: “Maintenance In The Municipal
Electricity Distribution Industry, 25 July 2012 53
Interview with National Treasury, 3 December 2013

Page 88 of 137
Table 12: Operating Revenue and Expenditure for Electricity over time
Source: National Treasury, 2013
However, data from StatsSA shows that ‘Service charges’ of which electricity is over 90%, are
the highest source of income, and is growing at a faster rate than the others.
Figure 22: Municipal income by type 2009-2012 (R million)
Source: StatsSA, 2013
Notwithstanding this alleged decline in recent years (according to National Treasury), treating
electricity as the ‘cash cow’ raises a fundamental issue around the financing model of
municipalities where the current model creates perverse incentives to inflate electricity tariffs to
earn more revenue. The current funding model for municipalities, which relies on the cross-
subsidy of other activities from electricity revenues (surplus), contradicts NERSA’s efforts to set

Page 89 of 137
tariffs on a cost recovery basis. However, municipal financing is a much wider issue, beyond the
mandate of NERSA, and we take this debate no further in this report.
(ii) Poor cost reporting by municipalities
National Treasury suggests that even the applied for tariffs by municipalities are grossly
understated as they don’t take into account many, what is termed, ‘Indirect costs’ of operating
the municipality.54 According to National Treasury, common costs for providing the full range of
municipality services such as HR, legal costs, audit fees, personnel costs etc. are not
incorporated in the costs provided to NERSA to work out (on a pro rata basis) the guideline tariff
or above guideline tariff for electricity. Only ‘direct costs’ of electricity provision are provided, and
even these costs, are not reported in a standard fashion across the municipalities.
Many municipalities allegedly also under-report electricity related costs as they don’t provide, for
instance, for third party costs of certain services such as tree felling and trenching to install new
electric cables in hilly and tree filled areas, digging up roads to insert cables and subsequent
covering up costs etc. National Treasure estimates that this adds on between 10 to 15% on the
costs of metro municipalities and 18 to 25% on the costs of smaller municipalities.55 In other
words, National Treasury suggests that municipalities may be under-recovering their costs
through less-than-full cost reflective tariff applications to NERSA and this according to Treasury,
is not sustainable.
The main contributor to this problem is that municipalities in general maintain very poor records
of their costs. Further, their billing systems are poor, making it difficult for them to collect fees for
services rendered. Adequate customer databases are not maintained and municipalities often
don’t have a full appreciation of the profiles of their customer base. Over and above this, there is
no standardised method of recording and reporting costs across municipalities, which makes
NERSA’s job in determining a guideline tariff very difficult, hence NERSA’s reliance in Eskom’s
cost to serve calculations.
National Treasury is currently in the midst of a large project which aims to create a Standard
Charter of Accounts (SCOA) across municipalities. This would hopefully address some of the
concerns raised above. However, the question of efficiency has to enter into the discussion
here. To what extent are these indirect (and some direct costs, as well as ‘operating
expenditure’ reported in the table above) a result of inefficient operations in municipalities? And
should these inefficiencies be ‘subsidised’ through higher tariffs by end users? What would this
mean for incentives to drive down costs through more efficient operations?
There are also concerns that the NERSA benchmark method of determining municipality tariffs
is not appropriate or reflective of the actual costs of municipalities, which vary greatly between
municipalities.
54
Interview with National Treasury, 3 December 2013 55
Ibid.

Page 90 of 137
NERSA has attempted to assist municipalities by creating the ‘D-form collection plan’ to aid
municipalities in submitting the correct required data to work out the benchmark tariff. NERSA
has further committed direct assistance and training for 65 municipalities in 2013/2014
(Rustomjee, 2013).
Box 5: Composition of D-Forms
D1 (Financial information) - Finances (income statement, balance sheet and cashflow) - Capital expenditure (electrification, network expansion, general) for the next three years - Surplus and how surplus is used
- Electricity purchases and own‐generation (by source) D2 (Market information) - Electricity connections (new and total by type) - Electricity sales (to consumers, redistribution, own use, street lighting, other municipal departments) - Electricity sales, revenues and number of customers by SIC category (domestic, agricultural, mining, manufacturing, commercial, transport, general, redistribution, own use/streetlighting/other departments) - Tariff information by tariff (tariff name and number, date approved, date implemented, tariff structure category, SIC category, load profile category, number of consumers on the tariff, total energy sales for that tariff, total revenue for that tariff from energy, demand and fixed charges (separately), average sales per customer per month, extramunicipal surcharge (%). D3 (Human Resources information) - Human resources information (remuneration, staff numbers by level – management, skilled,
unskilled) split into technical and non‐technical
Source: Rustomjee, 2013
(iii) ‘Legislative misalignment’56- ability to add surcharges over and above NERSA
determined prices
While NERSA has the mandate to set the tariff that municipalities can price electricity sales at,
the Constitution further allows municipalities the right to apply surcharges over and above this
NERSA determined price to municipal services. The Municipal Fiscal Powers and Functions Act
(MFPFA) allows for the NERSA determined “base municipal tariff” and stipulates that
municipalities can add a surcharge onto this. Other legislation that governs municipalities
includes Municipal Finance and Management Act and the Municipal Systems Act.
It is argued that this protection by the Constitution dilutes the power of NERSA with respect to
municipalities, and creates uncertainty and inconsistency in the regulatory environment. Another
example of this ambiguity is the reticulation of electricity by municipalities. Under the Electricity
Regulation Act of 2007, municipalities must be licensed by NERSA who sets the standards
governing reticulation tariffs and quality of supply. But the Constitution states that municipalities
have executive and administrative authority of electricity reticulation (TIPS (2013), drawn from
Newbery and Eberhard, 2008).
56
As termed by a NERSA official.

Page 91 of 137
According to National Treasury, the purpose of the surcharge is to allow municipalities to have
another source of income to fund other municipal activities, for instance, a public library that
earns no income. Treasury argues that the typical surcharges added by municipalities are tiny,
often only a fraction of a percentage of the increase, and that in any event, only one or two
municipalities are adding surcharges above NERSA’s approved tariff.57This appears not to be
the view of small commercial customers.
A statement by AMEU highlights the uncertainty around the regulation of municipality tariffs:
“The Executive Summary of the (NERSA tariff guideline) consultation paper states the legal
basis for the National Energy Regulator’s regulation of (electricity) prices and tariffs as being the
Electricity Regulation Act, 2006 (Act No.4 of 2006). We wish to remind NERSA that during a
meeting between representatives of NERSA and SALGA (South African Local Government
Association) held on 8 March 2010, it was reported (SALGA circular 05/2010 dated 11 March
2010) that `there are conflicting interpretations of relevant legislation addressing legal
competence to regulate municipal electricity distribution tariffs’ and that there was apparent
agreement that `this needs to be settled and documented in a court judgment or declaration and
that SALGA, CoGTA and NERSA will cooperate towards getting a court
determination/decision/declaration on this matter’. The AMEU would like to again suggest that
clarity be obtained on the legal authority for this function.........Notwithstanding the above
recommendation, the AMEU would like to express appreciation to NERSA for attempting to
assist municipalities in meeting their legal obligations to their communities and the municipal
budget process by finalizing its guidelines as early as possible.” Rustomjee (2013), citing AMEU
(2013).
It appears that these issues have not yet been resolved.
(iv) Concerns around repairs, maintenance and refurbishment of the Electricity
Distribution Industry (EDI)
Between 2003 and 2010 the number of households supplied by municipalities has more than
doubled, but expenditure on maintenance and investments in EDI infrastructure has not
increased. As a consequence, ageing infrastructure is operating at maximum capacity causing
the system to be overloaded, resulting in supply interruptions. The international benchmark for
distribution losses (as electricity moves through the network) is 3.5%. Distribution losses in
South Africa’s best-run metros are significantly above the international benchmark. In 2011/2012
the most efficient municipality, eThekwini, achieved a distribution loss of 5.0% (National
Treasury, 2011: 154), whereas the two largest metros in RSA, the City of Johannesburg and
City of Cape Town, achieved 11% and 9.3% respectively (National Treasury, 2011: 155).
A major refurbishment backlog exists in the EDI, and continues to grow (Thompson, 2011). In
1999, there were attempts to restructure the EDI through the Electricity Distribution Industry
Restructuring Committee. The establishment of EDI Holdings in 2003 and the decision to have
57
Interview with National Treasury, 3 December 2013

Page 92 of 137
Regional Electricity Distributors (REDS) could have increased investment in the distribution
network. However, municipalities, threatened by the potential risk of losing EDI assets to the
REDS, stopped investing in maintenance and new infrastructure. EDI Holdings was
subsequently disbanded in 2010 and along with it, the REDS (the ‘REDs are Dead’
announcement, Eberhard, 2013).
The maintenance and refurbishment backlog is estimated at ZAR 27-billion,58 growing at an
estimated ZAR 2.5 billion per annum (Louw, 2012). In 2007/2008 and 2008/2009, capital
expenditure grew at an average annual rate of 24% but, in 2009/2010, no increase in
expenditure was reported, whereas budgets reflected a decrease in capital expenditure by 11%
in 2011/2012 and a further fall of 4% in 2012/2013 (National Treasury, 2011). The budgeted
figures for 2011/2012 and 2012/2013 include over ZAR 1 billion from the Integrated National
Electrification Programme (INEP) grant.
Table 13: Budgeted Capital Expenditure on the Electricity Function, 2006-2012, R million
Operating
Revenue, R mill
2006/7 2007/8 2008/9 2009/10 2010/11 2011/12 2012/13
Metros 2311 2793 3342 3392 3705 3734 3696
Locals 780 1037 1406 1390 1975 1333 1167
Districts 1 2 0 2 43 40 35
Total 3093 3833 4748 4784 5724 5107 4898
Source: National Treasury Local Government Data Base, National Treasury 2011
Eberhard (2013) and SALGA (2012) have developed policy proposals “that support the larger
and better functioning municipalities with the ring-fencing of their electricity businesses and the
funding of backlogs, while encouraging failing municipalities to contract-out their electricity
services to more competent providers”. Noah (2012) has suggested a similar approach that
“effectively utilises the strengths and capabilities within the industry to assist those players that
lack these strengths and capabilities”, referred to as active-partnering, and “allows for some
consolidation within the industry where this make sense”.
5.3.3 What can NERSA do, or is the problem beyond NERSA?
It is important to acknowledge that NERSA has made some important strides in attempting to
address the issue of municipality pricing in the face of uncertain legislation governing this space.
To recap, it is assisting municipalities to collate their cost information through the D-form
system, and has committed to train municipalities on how to complete these forms. This is a
move towards greater cost reflectivity. Towards the same goal, National Treasury has embarked
on the Standard Charter of Accounts (SCOA) initiative to standardise cost reporting across
municipalities (not limited to electricity costs). Although NERSA’s average benchmark approach
has been criticised as being too generic and not reflective of the cost realities of municipalities, it
58
This includes only municipal distributors. The total value for the EDI, which includes Eskom Distribution, was ZAR 260 billion (in 2008). Eskom will spend approximately ZAR 68 billion on capital expenditure between 2012 and 2018, of which ZAR 14.5 billion will be dedicated to refurbishment (Rustomjee, 2013 and Noah, 2013).

Page 93 of 137
is difficult to see what more NERSA can do at this stage, particularly given the poor state of cost
accounting of most municipalities.
Regarding the legislative ‘misalignment’, with municipality surcharges being protected by the
Constitution, it appears that neither NERSA nor any other relevant stakeholder has taken up the
matter legally. This is potentially an area in which NERSA could take the initiative to clarify the
matter through the legal route. Clarity on this would potentially enable NERSA to take a stronger
stance on addressing the backlog of municipality infrastructure investment and high demand
charge to energy charge ratios presently the case in many municipalities’ pricing.
But perhaps the area which NERSA could play a much stronger role is in ensuring that there is
investment by municipalities in maintenance and refurbishment of distribution infrastructure. The
maintenance backlog by municipalities is arguably at crises-levels, and it is hard for NERSA to
achieve its aim of cost-reflective tariff setting for municipalities given this. According to Eberhard
(2013) “the most important challenge is giving municipalities the means and incentives to invest
adequately in electricity networks and in the people and skills to operate and maintain them”.
He also suggests a broader stakeholder approach, which includes NERSA, National Treasury
and the DoE. NERSA should use its oversight powers “to establish national norms and
standards, including ring-fencing of municipal electricity businesses and minimum maintenance
levels, and the tariff approval process to penalise municipalities, the form of revenue claw-backs
and lower tariffs that do not spend allocated capex / maintenance budgets.”
With regards to residential customers of municipalities, Eskom submitted a proposal recently
(late 2013) for alternative tariffs for municipalities with a predominantly residential customer
base, called ‘Muniflex’, following complaints of high winter Time of Use tariffs. The process is
still in its early stages and NERSA has called for public comments on the proposal.
5.4 Pricing to large industrial users
As discussed earlier, electricity pricing to the most electricity-intensive users such as non-
ferrous metals (aluminium) and ferrochrome, are currently, or were historically, fixed in long-term
contracts, often favourable to dominant players. Instead of paying higher prices to dissuade
excessive use of electricity and to incentivise use of more energy-efficient methods and/or
renewable energy, these high energy-intensive industries paid lower prices than other industrial
customers.
Newbery and Eberhard (2008) suggest that the low electricity costs historically sent incorrect
signals for investment in energy-intensive industries and that energy-intensive industries were
encouraged through favourable long-term contracts Eskom entered into (for instance, the BHP
Billiton Special Pricing Agreements). According to these authors, setting prices at more ‘efficient’
levels would not in fact jeopardise the competitiveness of these industries. This is contrary to

Page 94 of 137
media reports by BHP Billiton, for example, which repeatedly suggest that without the favourable
electricity prices, they would face closures.59
Three illustrative case studies are presented in this section, which highlight some implications of
electricity pricing on industrial policy. The first case study will draw from TIPS’s findings in a
recent project looking at special electricity price contracts to the BHP aluminium smelters. The
second case study will look at the more recent Eskom ‘buy-back’ agreements entered into with
the ferrochrome and ferromanganese smelters. The third case study will very briefly look at the
impact of electricity price increases on the mining industry (gold, iron-ore, coal and platinum)
and whether increases from a previously low base has triggered greater use of renewables and
increased electricity-efficient methods.
5.4.1 Energy-intensive industrial users locked into favourable long-term contracts or
negotiated pricing agreements- the case of aluminium
Eskom’s top 140 energy-intensive users are mostly mining and large mineral processing
industrial giants. The Energy Intensive Users Group (EIUG), which comprises 32 companies,
consumes about 45% of the country’s electricity. Certain energy-intensive industries historically
paid, and continue to pay in some instances, lower prices for electricity than general industrial
users. The aluminium smelting industry owned by BHP Billiton for instance was located in South
Africa purely because of access to cheap and plentiful electricity (through Special or Negotiated
Pricing Agreements (S/NPA) with Eskom), having no other comparative advantage.60
In line with industrial policy at the time, these NPAs were entered into with BHP Billiton’s
predecessor, Alusaf, as a critical factor to induce investment in aluminium refining in South
Africa, with the ore imported. Further benefits that were anticipated with the introduction of the
smelters included helping to foster a downstream aluminium industry and generating jobs
directly and indirectly on a significant scale; saving South Africa having to import significant
volumes of aluminium for its developing industrial base; and making a positive contribution to
the balance of payments. At the time when the first smelters were considered the country faced
a different set of priorities in terms of the electricity environment – Eskom had an estimated 30
59
BHP Billiton Bayside and Hillside smelters, despite the preferential rates at which they buy electricity
from Eskom, have apparently shown successive losses in the last few years. As a consequence, it is
reported that there will be no further investment in production capacity and that there may even be plant
closures, in which case South Africa would have to import primary aluminium. “BHP Billiton’s SA smelters’
income could fall by $500m in half-year to June”, Leandi Kolver,
http://www.miningweekly.com/article/south-africas-primary-aluminium-smelters-showing-successive-
losses-2013-01-18. Accessed on 18 April 2013
60 According to BHP Billiton’s current chairman, Dr Xolani Mkhwanazi, “the Eskom contracts were negotiated on a risk-sharing basis and in terms of a recognised international model. First, this was important to ensure the financial viability of the smelters over the long term, which is necessary to provide a reasonable return on the substantial investment. Without that we would not have made the investment. We have invested more than R60bn in our aluminium business in Southern Africa during this time." http://www.bdlive.co.za/business/2013/04/03/bhp-billiton-says-it-will-hold-eskom-to-special-price-deal.

Page 95 of 137
per cent surplus of generating capacity, other estimates suggest a 40 per cent reserve61 (TIPS
EPP Report (2013): Options for managing electricity supply to aluminium plants). Special
agreements were negotiated for the Hillside, Bayside and Mozal aluminium smelters. The
pricing of electricity under these contracts was based on the LME aluminium price and prevailing
exchange rates, and not in relation to Eskom’s cost of producing electricity.
Other NPAs were entered into with ferrochrome smelters, but these were shorter termed, with
termination timed to coincide with the projected eroding of the electricity surplus (ending in
2000). However, for an account of recent developments in the ferrochrome industry, see the
next subsection. An NPA was also entered into with Anglo American’s Skorpion Zinc, which was
renegotiated in 2011.62 The Mozal contact has been renegotiated such that it is de-linked from
the LME and exchange rate in 2010.
The former National Energy Regulator (NER) approved the SPA in the late 1990’s. BHP
Billiton’s current chairman, Dr Xolani Mkhwanazi, was the CEO of the National Energy
Regulator, NER, although not at the time all the contracts were entered into. This is a classic
example of the ‘revolving door’ phenomenon, where persons who work for the regulator move to
the private company they were regulating and vice versa. The obvious problem with the
revolving door phenomenon is the possibility of regulatory capture.
The box below highlights the relevant electricity pricing clauses in the BHP Billiton’s potlines 1 &
2 contract.
Box 6: Extracts of relevant pricing clauses for Hillside Potlines 1 & 2
2.1 As from the commencement date the prices to be charged by ESKOM and to be paid by the CUSTOMER for electricity supplied or made available to the installation, shall comprise an energy charge, a maximum demand charge and rebatable capital charge as follows:
2.1.1 ENERGY CHARGE
The charge for electrical energy supplied in each month shall be calculated as follows: ES x 6.54 x AL x R/$= Rands
where, ES= the total number of GW.h of energy supplied in the month; AL= is the three-month London Metal Exchange (LME) sellers’ price for 99.7% high grade
aluminium ingot expressed in US Dollars per ton; R/$= the Rand/US Dollar exchange rate. 2.1.2 DEMAND CHARGE The charge for electrical power supplied in each month shall be calculated as follows: MD x 3.237 x AL x R/$= Rands
where,
61
Presentation to National Assembly Portfolio Committee on Trade and Industry, Dr Xolani Mkhwanazi: Chairman- BHP Billiton SA Mr Lucas Msimanga: Asset President - BHP Billiton Aluminium SA, 26 April 2013, Slide 10. 62
2011 Eskom Annual Report, p 209

Page 96 of 137
MD= the maximum demand in gigavolt amperes supplied during peak hours [as defined in the Eskom Schedule of Standard Prices for Tariff (E)] in the month;
AL= is the three-month London Metal Exchange (LME) sellers’ price for 99.7% high grade aluminium ingot expressed in US Dollars per ton;
R/$= the Rand/US Dollar exchange rate
Source: parts of the contract available in the public domain following Media 24 litigation
Similarly to Potlines 1 & 2, the tariffs applicable to BHP’s Potline 3 are on a two-part tariff basis
with a demand charge and an energy charge. Also like the original contract, there is a monthly
capital component. However, unlike the original contracts, the pricing is not in any way linked to
the international aluminium price or exchange rate, but is based on Eskom’s Nightsave prices
applicable in the 2001 calendar year, subject to a range of conditions, including PPI related
escalations as described in the box and paragraphs below.
Box 7: Relevant pricing clauses for Hillside 3 63
(a) A basic charge of R174.80 (+VAT= R199.27) per month for each point of delivery, which charge shall
be payable every month whether any electricity is used or not.
(b) A DEMAND CHARGE for each kilovolt-ampere of the maximum demand supplied during peak hours
in the month at the rate of R40.23 (+VAT= R45.86)
(c) An ENERGY CHARGE at the rate of 7.26 cents (+VAT= 8.28c) per kilowatt-hour (kWh) of electrical
energy supplied in the month.
(d) If the sum of the amounts of the demand changes in paragraphs (b) above and the energy charge in
paragraph (c) above, divided by the number of kWh supplied in the month, exceeds 43.16 cents
(+VAT=49.20c) per kWh, then the demand change in paragraph (b) above, together with the energy
charge in paragraph (c) above, will for the month concerned be cancelled and be replaced by a
charge at the rate of 43.16 cents (+VAT=49.20c) per kWh of electrical energy supplied in the month.
(e) The sum of the amounts determined under paragraphs (b) and (c) above or (d) above, whichever is
applicable, shall be subject to a voltage percentage discount of 7.13%.
(f) The sum for the month, of the amounts determined under paragraphs (b) and (c) above or (d) above,
whichever is applicable, less the discount in paragraph (e), shall be subject to a transmission
percentage surcharge of 1%.
For Potline 3, on 1 January each year, starting from 1 January 2002, Eskom escalates the
prices annually such that the pricing in year n+1 is equal to the price in year n multiplied by the
ratio between the South African Producer Price Index, PPI (November in year n)/ PPI
(November in year n-1). Therefore, unlike the contracts for Potlines 1 & 2, there were provisions
for escalation of costs through inflating by PPI. In addition to PPI related escalations, there is a
floor and ceiling provision in the contract. If prices fall below 0.8 US cents per kWh (in real 2001
terms) during any meter-reading month, then the customer must pay this floor price for electricity
supplied to Potline 3. Similarly, if the price rises above 2.0 US cents per kWh for any month,
63
The contract contains other pricing related clauses not reflected in the box, for instance what peak hours refers to (see clause (g)) , and reductions in the monthly amount for particular years (see clause 7.2.2) and Connection fee and fixed capital charge (see clause 8)

Page 97 of 137
then the customer pays this ceiling of 2.0 USc/kWh. Similar PPI related escalations as described
above apply for the upper and lower limits.
It may be argued that the PPI escalation results in prices being more in line with some cost
pressures, although PPI is not reflective of all of Eskom’s costs, particularly capital costs.
The figure below compares BHP Billiton’s Hillside potlines 1, 2 & 3 compared to what general
industry pays- Megaflex tariff. Using the formulas above, pricing to BHP smelters in the figure
below can be seen to be well below general industry prices at average Megaflex rates after
2009.
Figure 23: BHP Hillside potlines 1, 2 and 3 compared to average Megaflex tariffs
Source: TIPS, based on LME price, SARB exchange rate, Eskom Tariff books for each year
Note: Average Megaflex is the average of the three daily time-of-use periods namely Peak, Standard and
Off peak periods Megaflex tariffs, and the spikes are due to seasonality [High demand [June – August]
and Low demand [September – May].
The implication is that the heaviest user of electricity in the country, the BHP Billiton smelters,
pays some of the lowest prices for electricity, particularly in recent years.
The contracts created much controversy recently in that the refineries typically use around six
per cent of Eskom’s base electricity capacity, yet allegedly only pay half the cost of Eskom’s
0.00
0.20
0.40
0.60
0.80
1.00
1.20
Jan
-02
May
-02
Sep
-02
Jan
-03
Ma
y-0
3
Sep
-03
Jan
-04
Ma
y-0
4
Sep
-04
Jan
-05
Ma
y-0
5
Sep
-05
Jan
-06
Ma
y-0
6
Sep
-06
Jan
-07
Ma
y-0
7
Sep
-07
Jan
-08
Ma
y-0
8
Sep
-08
Jan
-09
Ma
y-0
9
Sep
-09
Jan
-10
Ma
y-1
0
Sep
-10
Jan
-11
Ma
y-1
1
Sep
-11
Jan
-12
Ma
y-1
2
Sep
-12
Jan
-13
Ma
y-1
3
R/k
Wh
Average Megaflex Hillside Potline 3 Hillside Potline 1&2

Page 98 of 137
production as well as much lower prices than standard industrial customers.64 The table below
highlights the difference between the BHP Billiton and Megaflex prices and Eskom’s operating
costs as reported in its Annual Reports. It is clear that the BHP prices in the later years from
2009 in particular are below reported costs, while Megaflex prices are above operating costs
from 2009 (although between 2006 and 2008, Megaflex tariffs were also below costs65).
Table 14: BHP and Megaflex tariffs over Eskom costs
Average
Megaflex
(R/kWh)
BHP
Hillside
Potlines
1&2
(R/kWh)
BHP
Hillside
Potline
3
(R/kWh)
Eskom’s
operating
costs,
Annual
Reports
(R/kWh)
BHP
Hillside
Potlines 1
& 2, %
difference
over
costs
BHP
Hillside
Potline 3,
%
difference
over
costs
Average
Megaflex,
%
difference
over
costs
2002 0.14 0.16 0.14 0.13 28% 12% 15%
2003 0.14 0.12 0.16 0.14 -11% 18% 2%
2004 0.11 0.12 0.16 -
2005 0.13 0.14 0.16 0.11 18% 40% 14%
2006 0.14 0.20 0.17 0.14 37% 19% -5%
2007 0.1466
0.21 0.19 0.16 30% 18% -11%
2008 0.18 0.24 0.20 0.19 25% 6% -7%
2009 0.28 0.16 0.23 0.26 -39% -11% 9%
2010 0.38 0.18 0.23 0.28 -36% -18% 35%
2011 0.48 0.20 0.24 0.33 -41% -27% 46%
2012 0.57 0.19 0.26 -
2013 (till
June) 0.52 0.20 0.28
-
Source: TIPS, based on LME price, SARB exchange rate, PPI (Quantec), Eskom Tariff books for each
year
Note: In 2005, TIPS adjusted the 15 month figure reported in the Annual Report to a 12 month figure.
For certain years, TIPS was unable to get Eskom’s costs as there were no figure in the annual report for
operating costs.
The aluminium contracts signed in the 1990s have therefore become hugely contentious,
particularly during the load shedding crises in 2008, as they are seen to favour the dominant
BHP Billiton whose key focus is the export market when the rest of the economy is experiencing
increasing electricity costs and supply shortages.
64
The Supreme Court Of Appeal Of South Africa Judgment in the matter between BHP Billiton Plc Incorporated, Hillside Aluminium (Pty) Ltd and Jan George de Lange, Media 24 Limited Case No: 189/2012 65 Note that the Megaflex tariff calculation undertaken above is a simple average of peak, of peak and standard tariffs. It is not weighted by volumes. The Megaflex tariffs at peak (alone) are likely to be above operating costs. 66
The Megaflex rate is an average of peak, standard and off-peak rates. The reason the 2007 figure is similar to earlier years has to do with averaging the rates. Peak price in 2003 ranges between R 0.15 and R 0.49 and off peak was at 0.8. In 2007 this range for peak is 0.15-0.56 and for off-peak around 0.7.
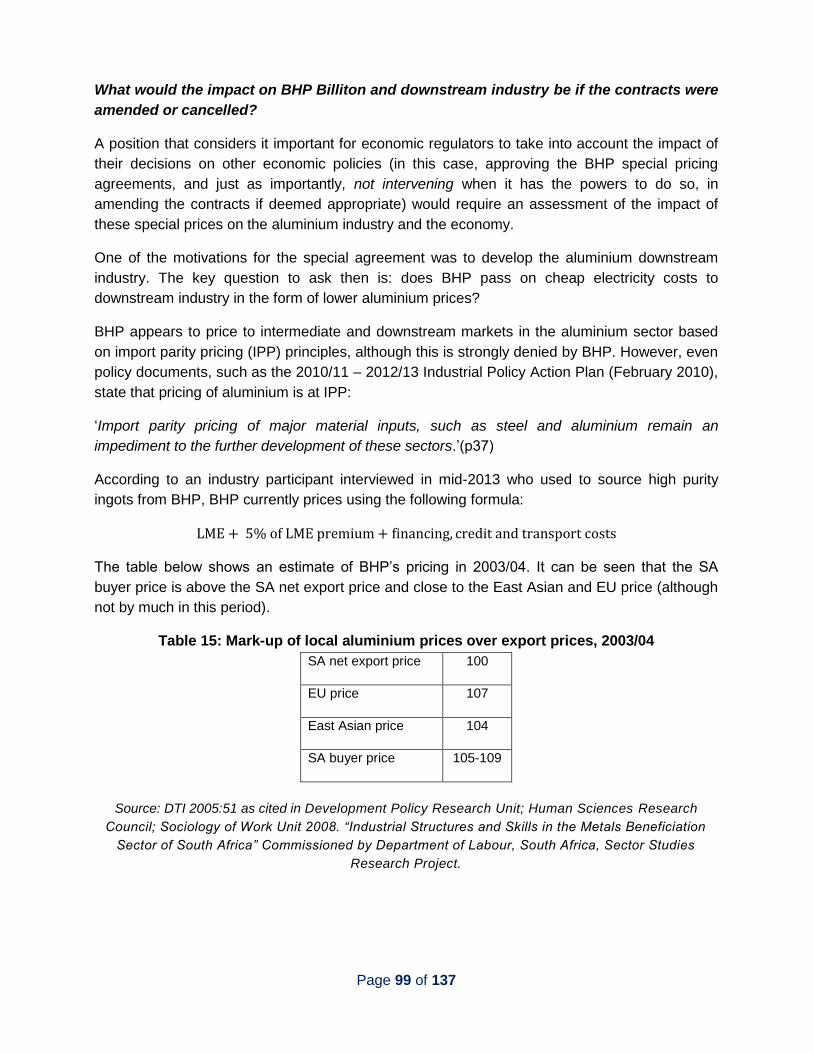
Page 99 of 137
What would the impact on BHP Billiton and downstream industry be if the contracts were
amended or cancelled?
A position that considers it important for economic regulators to take into account the impact of
their decisions on other economic policies (in this case, approving the BHP special pricing
agreements, and just as importantly, not intervening when it has the powers to do so, in
amending the contracts if deemed appropriate) would require an assessment of the impact of
these special prices on the aluminium industry and the economy.
One of the motivations for the special agreement was to develop the aluminium downstream
industry. The key question to ask then is: does BHP pass on cheap electricity costs to
downstream industry in the form of lower aluminium prices?
BHP appears to price to intermediate and downstream markets in the aluminium sector based
on import parity pricing (IPP) principles, although this is strongly denied by BHP. However, even
policy documents, such as the 2010/11 – 2012/13 Industrial Policy Action Plan (February 2010),
state that pricing of aluminium is at IPP:
‘Import parity pricing of major material inputs, such as steel and aluminium remain an
impediment to the further development of these sectors.’(p37)
According to an industry participant interviewed in mid-2013 who used to source high purity
ingots from BHP, BHP currently prices using the following formula:
The table below shows an estimate of BHP’s pricing in 2003/04. It can be seen that the SA
buyer price is above the SA net export price and close to the East Asian and EU price (although
not by much in this period).
Table 15: Mark-up of local aluminium prices over export prices, 2003/04
SA net export price 100
EU price 107
East Asian price 104
SA buyer price 105-109
Source: DTI 2005:51 as cited in Development Policy Research Unit; Human Sciences Research
Council; Sociology of Work Unit 2008. “Industrial Structures and Skills in the Metals Beneficiation
Sector of South Africa” Commissioned by Department of Labour, South Africa, Sector Studies
Research Project.

Page 100 of 137
Over a longer time period (Figure 24 below), it can be seen that until around 2004, local prices
for aluminium products (in general ) were above export prices, although the gap has narrowed
over time, and appears to have equalised in 2005/6.
Figure 24: Aluminium local and export pricing trends from 1990 to 2006
Source: Quantec
The pricing of slabs (from Bayside), the only higher value-added product BHP Billiton producers
currently, is allegedly at prices at a discount to import parity prices, unlike the pricing of ingots
described above. However here is not enough detail on pricing of slabs in the public domain to
verify this. The BHP local pricing system for ingots at least does not appear to take into account
its actual costs of production, and therefore does not take into account any input cost
advantages (such as electricity cost advantages).
Role of BHP Billiton’s aluminium smelters in the economy
There is a strong stance by BHP Billiton on the contribution it is making to both the national and
regional, Richards Bay, economy. This section summarises the TIPS team findings from
previous research, in which a number of aluminium industry participants were interviewed,
including BHP, to ascertain what they thought the impact on their business would be if BHP
Billiton was to pass on any electricity cost increases to them in the form of higher aluminium
ingot or slab prices.
According to an HSRC study, of the aluminium sold to the domestic industry, approximately 60%
is exported after only limited value-addition (mainly rolling to sheet by Hulamin), and a further

Page 101 of 137
10% is exported after downstream value-addition. An estimated one-eighth of primary aluminium
produced in South Africa is retained in the domestic market after further processing.67
Figure 25 below shows the balance of trade for the whole aluminium industry for the period 2002
– 2012 (not just BHP smelters). From the figure it can be seen that South Africa has maintained
a significantly positive balance of trade in the aluminium sector over the entire period. However,
closer scrutiny of the export data reveals that it is exports of basic products, with very little value
add.
Figure 25: Trade position of Aluminium and articles thereof
Source: Own calculations from Quantec data (2013), HS 2-digit level
According to extracts from a 2012 report by Econometrix commissioned by BHP Billiton
available in the media (most of the report is confidential however and therefore cannot be
interrogated), the aluminium operations (i.e. BHP smelters only) have a R4.4bn positive impact
on the current account balance of payments (Kolver, 2013). This is made up of R8.4bn exports
less R4bn imports of alumina, petroleum, coke and pitch for 2012 (BHP, 2013).
According to a Deloitte study (2012), non-ferrous metals and gold mining account for 25 per cent
of electricity consumption but only 4 per cent of GDP. The overall contribution of these sectors
to GDP however also depends on their linkages to sectors in the economy, and it is not clear if
the Deloitte numbers capture this. Deloitte (2012) suggests that energy-intensive sectors like
gold mining, non-ferrous metals, soap and pharmaceuticals add relatively little value to the
economy (in terms of GDP) per unit of energy consumed (Deloitte (2012).
BHP Billiton has claimed in several fora that it continues to contribute significantly to the
economy. However, according to Deloitte (2012), non-ferrous metals and gold mining account
67
Development Policy Research Unit; Human Sciences Research Council (HSRC); Sociology of Work Unit 2008. “Industrial Structures and Skills in the Metals Beneficiation Sector of South Africa” Commissioned by Department of Labour, South Africa, Sector Studies Research Project.
0
2,000,000,000
4,000,000,000
6,000,000,000
8,000,000,000
10,000,000,000
12,000,000,000
14,000,000,000
16,000,000,000
18,000,000,000
2002 2003 2004 2005 2006 2007 2008 2009 2010 2011 2012
Ran
ds
Exports: Aluminium and articles thereof Imports: Aluminium and articles thereof Balance of payments

Page 102 of 137
for 25% of electricity consumption but only 4% of GDP. It is however noted that the overall
contribution of these sectors to GDP also depends on their linkages to sectors in the economy,
which may not be taken into account in these calculations. Deloitte (2012) suggests that by
definition, energy-intensive sectors, like gold mining, non-ferrous metals, soap and
pharmaceuticals add relatively little value to the economy (in terms of GDP) per unit of energy
consumed. The importance of the BHP smelters in the economy, particularly in terms of
contribution to downstream beneficiation, is discussed later in this chapter.
In terms of employment AFSA estimates that there are around 16 500 jobs in the aluminium
industry, made up of direct, indirect and induced employment. Of this, AFSA estimates that
around 15 000 are directly employed by the aluminium industry.68 Also, because of its
recyclability, there is a demand for aluminium for beverage cans and AFSA reports that the
Bevcan contract worth ZAR 5.6 billion signed for Coca-Cola means that there is a bigger
contribution of the aluminium industry to GDP and employment could potentially increase
(AFSA, 2013).
But according to the publically available extracts from the Econometrix report commissioned by
BHP, the BHP Billiton Bayside and Hillside smelters jointly created 7,000 jobs (direct and
indirect) in KwaZulu-Natal (KZN), primarily in the Richards Bay area, positively impacting on the
livelihood of more than 33,000 people in northern KZN, according to BHP Billiton.69 Using a
dependency ratio of 4.0, it is estimated that the livelihood of approximately 28,000 people could
be dependent on the operations.70 What these calculations do not take into account is the loss
of productivity and jobs that have occurred as a result of electricity being interrupted or rationed
to all other industry as a result of being supplied to BHP, and the impact on Eskom of pricing
below operating costs to BHP in later years.
Impact of an electricity cost increase on BHP and other aluminium industry players
It has been reported in the media that both BHP’s Bayside and Hillside smelters, despite the
preferential rates at which they buy electricity from Eskom, have shown successive losses in the
last few years. As a consequence, it is reported that there will be no further investment in
production capacity and that there may even be plant closures, in which case South Africa
would have to import primary aluminium (BHP, 2013).
The decision BHP will make to cut back on production or pass on cost increases to customers is
difficult to determine without input from BHP on their pricing and costs. Nonetheless, BHP’s
ability to pass on costs increases, including electricity cost increases, is probably high given its
considerable market power (assuming it has not already fully exerted its market power) in the
68
Interview with the Aluminium Federation South Africa (AFSA), 21 June 2013. 69
“BHP Billiton, analyst differ on power pricing regime for aluminium smelters”, 5th July 2013, http://www.miningweekly.com/article/contribution-of-bhp-aluminium-smelters-to-south-african-economy-disputed-2013-07-05, accessed on 11 July 2013 70
Source: BHP Presentation to National Assembly Portfolio Committee on Trade and Industry, Dr Mkhwanazi, April 2013

Page 103 of 137
local market. Given a more competitive international aluminium market that is in oversupply, it is
unlikely that BHP can pass through electricity price increases, or any cost increases, to export
customers.
It is also unlikely that there will be new entry in primary smelting given surplus in aluminium
globally and current severe electricity shortages in South Africa. The failed entry attempt of
Alcan a few years ago is evidence of this.
The table below provides a high-level qualitative summary of what the impact may be on the
value chain if BHP Billiton’s NPA was amended and prices increased, perhaps to Megaflex
levels. In summary, the impact on secondary smelters, most foundries and all but one fabricator
who buys value-added slab (Hulamin), appears insignificant as these players use scrap
aluminium as their main input. The major concerns for these players are the pricing and
availability of scrap71 and the mark up and inconsistency of municipality electricity tariffs.
71
There has since been an ITAC policy which stipulates that local customers should first be offered scrap at discounted prices before it is exported. Notice 470 of 2013 Policy Directive on the Exportation of Ferrous and non-ferrous waste and scrap metal, and Notice 33 International Trade Administration Act (71/2002): Draft Policy Directive on the Exportation of Ferrous and Non-Ferrous Waste and Scrap Metal. No R543, 2 August 2013, accessible on: http://www.itac.org.za/docs/Government%20Gazette%202%20August%202013.PDF

Page 104 of 137
Table 16: Summary of impact of an electricity price increase to BHP Billiton on the
aluminium value chain
BHP Billiton
Secondary smelters
Foundries
Semi-fabricators and fabricators
Smelters, despite the preferential electricity rates, have allegedly shown successive losses in the last few years (particularly Bayside). Any increase in costs, including electricity costs could therefore exacerbate these losses. There is no data to verify this however. BHP is dominant in local market and shows significant market power: it may cut back production, or pass on costs depending on pricing policy. BHP is a price taker in export markets: it is unlikely to pass on costs
Unlikely to have a direct impact, as secondary smelters mainly use scrap (only small amounts of virgin aluminium) Indirect impact: less virgin material, increases demand for scrap (particularly high grade), which may increases price of scrap. Less virgin material means less scrap available. Main concern: municipality electricity mark-ups and scrap pricing, availability and quality. Limited ability to pass on cost increases.
Of the three largest aluminium foundries (all supplying automotive industry), only one [confidential] still buys virgin material from BHP. [confidential] stopped sourcing from BHP in 2012 due to contamination concerns. Given Hayes is the largest aluminium foundry serving the automotive industry, there may be some impact if it cannot get material from BHP. Unlikely to have a direct impact on other foundries who use scrap aluminium as an input. These face same concerns as secondary smelters. Main concern: municipality electricity mark-ups and scrap pricing, availability and quality. Competition from imported castings, especially in the automotive industry. Limited ability to pass on cost increases: many have to shut down, lost business to imports
[Confidential]: unlikely to have a strong impact; do their own re-melting of scrap, only buy small volumes of basic ingots (virgin) from BHP. In the event of non-supply from BHP, move more to scrap, and import balance of needs. It claims that ingots are priced at or close to import parity price anyway; already importing billets. [Confidential]: likely to have a very big impact as it purchases large volumes of slab from BHP. Importing slab is much more expensive than buying locally (unlike importing basic ingots). Threat of imports of finished fully fabricated products is a constraint. Players have market power, and some ability to pass on costs.
Source: TIPS, based on stakeholders’ interviews

Page 105 of 137
What can NERSA do?
NERSA has the power to review these contracts in terms of the Electricity Regulation Act (ERA).
In this regard, any interested party could request NERSA to review these agreements. NERSA’s
decisions, including a decision in terms of which it refused or failed to review these contracts,
could be reviewed in terms of Promotion of Administrative Justice Act [No. 3 of 2000] (PAJA)
and the principle of legality. However, provisions for NPAs feature in the EPP and the
honouring of existing NPAs until the end of the contract is expressly stated, making it difficult for
NERSA to amend them:
NPAs are permitted, but must be structured in a way so as to minimise price distortions
Commodity price risk exposure must be hedged outside of the ESI.
Existing NP As will be honoured until the end of contract.
The evaluation of NPAs at inception must be based on the cost of supply (excluding
cross subsidies) on a discounted cash flow basis over the period of the agreement. The
cost of supply for NPAs intended for the sale and consumption of electricity in South
Africa must be defined by the electricity price forecast which will be based on the
prevailing regulatory methodologies in South Africa inclusive of an appropriate risk
premium.
DME must develop a transparent NPA application and approval process to ensure
adequate evaluation and consultation with key stakeholders, including National
Treasury.
DME must update the NPA pricing framework setting out the evaluation criteria. NERSA
will approve and monitor NPAs in accordance with the framework.
All applications must be treated in accordance with the approved processes and
frameworks and be approved by NERSA.
NERSA could nonetheless amend the contracts if it can justify the following in terms of public
interest where it is necessary to amend the contracts:
to safeguard and meet the interests and needs of present and future electricity
customers and end users having regard to the governance, efficiency, effectiveness and
long-term sustainability of the electricity supply industry within the broader context of
economic energy regulation in South Africa;
for universal access to electricity;
for a fair balance between interests of customers and end users, licensees, investors in
the electricity industry and the public; and
to ensure that a licensee does not terminate the supply of electricity to other customers.
NERSA would obviously have to be mindful of the kind of message that any premature
termination and amendment to the contract would send to international and domestic investors.
It would also have to be mindful of the clauses contained in the particular agreements, including
possible stabilisation or similar clauses and the jurisdiction of international arbitration tribunals.

Page 106 of 137
However, this does not mean that it may not under any circumstances not review these
agreements (TIPS, 2013).
Another consideration is the interruptibility provisions currently in the BHP contracts. The Hillside
and Bayside contracts have interruptibility provisions which allow Eskom to interrupt power
supply to the smelters for two hours each week during periods in which the national electricity
grid is under immense pressure, and when nationwide demand outstrips supply. It also appears
that Mozal smelter has a similar interruptibility provision (BHP, 2010). The objective is to
stabilise power supply. There is no compensation for loss of production during the interruptibility
period. The smelting process is continuous and if production is interrupted by a power supply
failure for more than a few hours, the metal in the pots may solidify. Getting back into operation
after this is an expensive process. Any renegotiation of the contracts may result in BHP
demanding compensation for the interruptibility of electricity going forwards (which has large
cost implications for them).
Eskom has indeed approached NERSA to review the contracts and hearings were initially said
to be scheduled for August 2013, but have not yet taken place. NERSA is however able to make
a decision on the contracts without public hearings.
There is a dispute between Eskom and BHP on the exact termination dates of the NPAs. On
Hillside Potline 1 & 2, Eskom is of the view that the contract (original agreement) ends in July
2020. BHP is of the view that the Potline 3 agreement (supplementary agreement), for which
there was an agreed amendment to June 2028, superseded the 1 & 2 agreements such that
they all end in 2028. Presumably, these disputes could be addressed through dispute-resolution
clauses that are likely to be contained in the respective agreements.
5.4.2 Energy-intensive ferrochrome smelters and Eskom entered into electricity buy-back
schemes
As stated, there were NPAs to the ferrochrome industry till 2000. The smelting of ferrochrome is
very electricity intensive. The impact of increases in electricity prices have allegedly led to
ferrochrome smelters in SA operating at below 50% capacity and some shutting
down/relocating. Relocation means that the ore is shipped to another country, smelted and the
value-added product is imported back into South Africa.
Merafe (part of Glencore Exstrata) is one of the world’s largest ferrochrome producers and its
direct electricity costs are said to make up 21% of its total costs. Tubatse and SA Chrome are
also large ferrochrome producers in South Africa. According to a Deloitte report, all three
ferrochrome producers above reported that their direct electricity costs constitute around a fifth
(20%) of their total costs. Some analysts suggest that South African ferrochrome producers
control a significant share of the global market, and therefore are able to pass on the costs of
rising electricity prices (Deloitte, 2012).
Further, in 2012, Eskom entered into negotiated agreements with major energy-thirsty
ferrochrome smelters which allow Eskom to turn off power to the smelters for up to three months
in return for what has been termed by the media as ‘handsome’ payments to the smelters by

Page 107 of 137
Eskom. These are essentially ‘buy-back schemes’ for the smelters to not use their allocated
power provisions and to redirect this capacity into the grid. Companies with whom Eskom has
struck deals include Xstrata, Samancor, Ruukki and International Ferro, amongst others. Details
on the magnitude of the payment have not been made public, but Eskom told the Mail &
Guardian that it had signed agreements covering more than 500 MW of electricity (more than
enough to power a city like Bloemfontein, which uses around 400 MW during peak times)
through the buy-back programme.
According to previous Eskom spokesperson Hilary Joffe, different payments have been
negotiated with different companies, but all on the principle that the compensation would be less
than the cost of running the open-cycle gas turbines, the most expensive to run and which are
used only at peak times. According to the former CEO of Eskom, Brian Dames, the cost to
generate a unit of electricity for standard power station is 38c, while electricity produced by the
open-cycle gas turbines cost close to R1.40 per unit as they run off expensive diesel. Increasing
fuel prices have hiked this cost up to R2.50 per kWh.
These buy-back schemes appear to be a key strategy going forward until the much-awaited
Medupi power station comes on board. The buy-back programme is voluntary and envisaged to
be taken up by smelters with excess capacity. These buy-back schemes allegedly resulted in a
saving of R8 billion.
Commentators have however suggested that the power buy-backs are more profitable for
ferrochrome producers than smelting the metal owing to the decline in international prices. So
once again, like the special pricing arrangements to the aluminium smelters, these agreements
are creating controversy in that Eskom may be subsidising these smelters at the expense of
other customers of electricity. Further National Union of Metalworkers of South Africa (NUMSA)
has raised serious concerns around the repercussions of these buy-back schemes in terms of
workers that are being essentially ‘laid-off’ in creative ways by the smelting companies.
Role of NERSA?
NERSA has approved these contracts. It is uncertain whether the economic implications and
ripple-effects on the value chain have been adequately assessed by NERSA prior to approval.
While it may be so that this may be the least costly method to address the stress on the grid and
to prevent costly outages, it would be useful to understand further the criteria NERSA assessed
when approving these contracts and what, if any, considerations were taken about the industrial
policy and employment repercussions of the decisions. It has not been possible to assess this
decision given limited information in the public domain.
5.4.3. Impact of electricity prices on mining value chains- incentivising move to greater
use of renewables?
The historically cheap electricity supply to mines provided little incentive to invest in energy-
saving methods or technology. Mining and related industries in South Africa are strategic drivers
of growth and development in the economy contributing to employment, balance of payments,
foreign investment etc. Mining and mineral products constitute a major portion of South Africa’s
exports, and employ around 500 000 people. Mining also has numerous linkages to other key

Page 108 of 137
and strategic industries. The National Development Plan: Vision 2030 outlines that these sectors
will continue to feature prominently in the structure of the South African economy because of
these significant contributions (National Planning Commission: 2011, as cited in TIPS, 2013).
However, mining and related downstream beneficiation activities are electricity-intensive and
therefore are vulnerable to the risks of electricity supply in the country. These risks include
escalating electricity prices and, arguably more costly to industry, interruptions in electricity
supply (TIPS (2013): GGGI). Electricity costs as a proportion of operational costs or total costs
vary significantly depending on the type of mining as well as depending on the processes
undertaken by the mines.
Table 17: Electricity as a % of operational or total costs
Value chain
Platinum
Mining Between 6-12% of operating costs
Catalytic converter manufacturing <10% of total costs
Gold
Mining 6-14% of total costs
Iron ore
Mining 5-10% of operating costs
Steel manufacturing
<10% of total costs; between 4-21% of operating costs
(depending on steel mill type and process)
Coal
Mining 3-5% of operating costs
Source: Interviews and data received from mining and manufacturing companies. It was not possible to
get consistent cost measures for all companies.
Mines and downstream beneficiation companies have invested in a range of energy efficient
methods and renewable energy sources over the years. However, this appears to be as much
an insurance against supply interruptions as a reaction to increased prices (which are still
relatively low compared to global levels). These investments are also as a result of general cost
reduction efforts due to a combination of cost pressures (labour, raw material, global prices
achievable etc.).
In any event, the main players in these industries have committed to reduce their energy
(including, but not limited to electricity) consumption through an energy accord with DoE and
Eskom. A national energy efficiency improvement target of 12% by 2015 was set by the National
Energy Efficiency Strategy, first approved in 2005 and reviewed in 2008. Mining and industrial
sectors have both been assigned an energy efficiency improvement target of 15% by 2015
(DME, 2008c). As part of the strategy, 36 companies and eight industry associations, including
several in the mining sector (e.g. Anglo American, Anglo Coal, Anglo Platinum, AngloGold

Page 109 of 137
Ashanti, BHP Billiton, De Beers, Exxaro, Gold Fields, Implats, Sasol, Xstrata, etc.) have signed
an energy efficiency accord with the DoE and Eskom72 (TIPS, 2013: GGGI Project).
Some of these efforts are ‘quick fix’ savings, such as changing light bulbs in offices, changing
fan settings on ventilation systems in deep shaft mines, and motors on equipment. Most mines,
particularly deep shaft gold and platinum mines, are 40 to 50 years old, and it is generally more
difficult to install modern energy-saving technology in these mines.73 Some mines, such as
Anglo American, have increased their use of renewable energy, although the scale is still very
small. Given the lack of reliability and high costs, renewable energy will only remain a very small
contributor to overall energy requirements of a mine. Appendix 6 provides examples of some of
the energy efficiency and renewable energy initiatives undertaken by the mines and downstream
manufacturing companies. In general however, very few firms have moved beyond short term
profit maximising motives to a more long-term, sustainable, green growth path when it comes to
electricity (and more broadly, energy usage).
72
The full list of signatories can be found at http://www.nbi.org.za/Focus%20Area/ClimateAndEnergy/EnergyEfficiency/Pages/Energy-Efficiency-Accord-Signatories.aspx. 73
Meeting with the Chamber of Mines as part of the TIPS GGGI project, 22 August 2013

Page 110 of 137
6. NERSA’s Performance of the Electricity Supply Industry
The performance of the ESI takes into account the activities, decisions, outputs and outcomes of
not only the largest ESI player, Eskom, but also that of the regulator and other key players such
as municipalities, IPPs and government stakeholders. This chapter explores the performance of
the electricity sector. It provides a brief overview of the performance the regulator according to
Eskom as the chief electricity player but focusses predominantly on the outcome of NERSA’s
performance in relation to its mandate and the impact of the regulatory system on the electricity
sector. NERSA has emerged in the South African context as a form of New Style regulator74,
first in the form of the NER and later as NERSA from 2005. It is mandated to regulate the sector
in terms of pricing, licensing and compliance, dispute resolution and development of the
planning and reform of the sector. In analysing its activities in executing its mandate, this
chapter will analyse the regulators performance in terms of its own key performance indicators
as well as impacts on the electricity sector as a whole.
Ideal performance of the ESI of South Africa would involve all end users having access to a
reliable supply of electricity that it competitively priced. This electricity would ideally also be
generated and distributed most efficiently and in the least harmful way to the environment in
terms of carbon emissions, consumption and waste. Achieving this requires that the entire ESI
be both financially viable and technically efficient. It also requires incentivising the integration of
environmental standard into operations across the value chain. Socio-economic objectives are
achieved through transparent cross-subsidisation and roll out of an electrification programme
that should be as far reaching and equitable as possible. The measure of the performance of the
ESI is thus multi-dimensional in terms of finance, technical, socio-economic and environmental
performance measures.
In analysing the performance of the regulator, the evaluation framework developed by the World
Bank75 is applied, taking into consideration both the regulatory governance and regulatory
substance of the regulator. Regulatory governance matters look at the institutional
arrangements and processes for decision making within the regulatory system. This has largely
been covered in chapters 3, 4 and 5 in the analysis of the institutional and procedural framework
describing NERSA’s role in the ESI, particularly in price determination.
Matters of regulatory substance are the main concern of this chapter and this centres on the
content of the regulatory system, which are the core actions and decisions of the regulator.
Throughout the previous chapters these matters of regulatory substance have been discussed
and analysed, especially in terms of pricing. In this chapter they are analysed in relation
NERSA’s own mandate and ultimately in terms of the impact on the electricity sector. The
74
New Style regulators are separate regulatory entities that have circumscribed independence and decision making authority and concomitant accountability. This is in contrast to Old Style regulators that are housed within line ministries and are relatively opaque. (Steyn, 2013) 75
The World Bank Handbook for Evaluating Infrastructure Regulatory Systems was developed in 2006 and is recognised worldwide as a framework for analysing the performance of regulators. An important conclusion of the handbook is that evaluation of any regulatory system requires a review of both regulatory governance and regulatory substance.
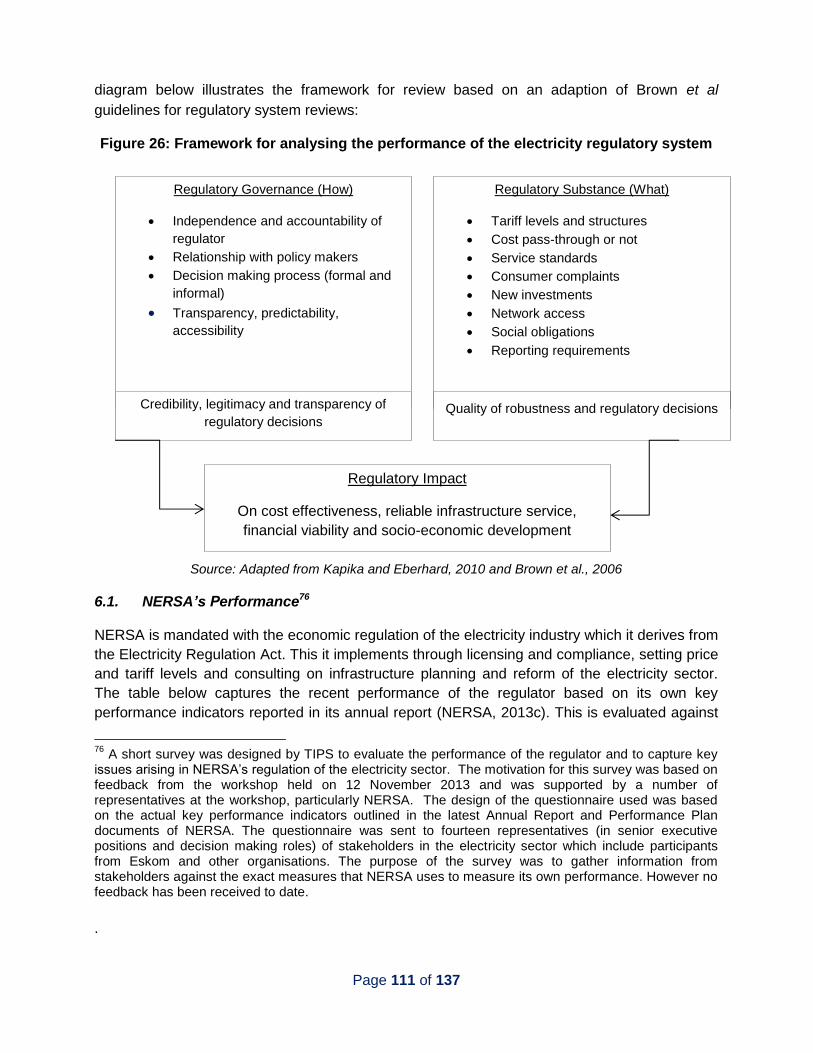
Page 111 of 137
diagram below illustrates the framework for review based on an adaption of Brown et al
guidelines for regulatory system reviews:
Figure 26: Framework for analysing the performance of the electricity regulatory system
Source: Adapted from Kapika and Eberhard, 2010 and Brown et al., 2006
6.1. NERSA’s Performance76
NERSA is mandated with the economic regulation of the electricity industry which it derives from
the Electricity Regulation Act. This it implements through licensing and compliance, setting price
and tariff levels and consulting on infrastructure planning and reform of the electricity sector.
The table below captures the recent performance of the regulator based on its own key
performance indicators reported in its annual report (NERSA, 2013c). This is evaluated against
76
A short survey was designed by TIPS to evaluate the performance of the regulator and to capture key issues arising in NERSA’s regulation of the electricity sector. The motivation for this survey was based on feedback from the workshop held on 12 November 2013 and was supported by a number of representatives at the workshop, particularly NERSA. The design of the questionnaire used was based on the actual key performance indicators outlined in the latest Annual Report and Performance Plan documents of NERSA. The questionnaire was sent to fourteen representatives (in senior executive positions and decision making roles) of stakeholders in the electricity sector which include participants from Eskom and other organisations. The purpose of the survey was to gather information from stakeholders against the exact measures that NERSA uses to measure its own performance. However no feedback has been received to date.
.
Regulatory Governance (How)
Independence and accountability of
regulator
Relationship with policy makers
Decision making process (formal and
informal)
Transparency, predictability,
accessibility
Regulatory Substance (What)
Tariff levels and structures
Cost pass-through or not
Service standards
Consumer complaints
New investments
Network access
Social obligations
Reporting requirements
Credibility, legitimacy and transparency of
regulatory decisions Quality of robustness and regulatory decisions
Regulatory Impact
On cost effectiveness, reliable infrastructure service,
financial viability and socio-economic development

Page 112 of 137
the regulatory impact these KPI’s have in terms of cost effectiveness, reliable infrastructure
service, financial viability and socio-economic development.
Table 18: NERSA’s Performance according to its KPIs
Key Performance Measures
NERSA's Performance in 2011/12 Regulatory Impact
I In setting and/or approval of tariffs and prices, NERSA aims to (1) ensure municipalities are sustainable within the ring fenced electricity business and (2) ensure the sustainability of Eskom and the Electricity
Supply Industry (ESI)
1 Ensuring 80% of municipalities are sustainable
This measure was removed. The Minister of Energy approved on 12 February 2013 that this target be removed from the NERSA Annual Performance Plan as the sustainability of the municipalities falls outside of NERSA’s control.
It is significant that this measure has been removed from NERSA's activities. It impacts on prices and the reliable delivery of electricity by municipalities. The role of municipalities in the ESI is crucial and NERSA will need to continue developing tools to influence the performance of municipalities regarding electricity.
2 96% of tariff applications of all licensed distributors set and approved.
NERSA has met the target of setting tariffs for distributors. Its future goal is 100% target achievement.
Approval of tariff applications is an ongoing process impacting price and the operations of distributors.
3 Approved implementation plan for an additional 3 Municipalities
Only 2 implementation plans were approved instead of the target of 3. The Minister of Energy approved on 12 February 2013 that this target be changed from 100% of municipalities implementing the 10% RRM requirements to what is indicated, as the management of the municipalities is different from the management of licensees in the other industries regulated by NERSA. Therefore a review of the approach for dealing with the municipalities was necessary. Externally delayed – NERSA is awaiting the submission of the plans from the metros.
The implementation plans for municipalities are a vital tool for measuring the performance of municipalities in electricity delivery. The delays caused in submissions from metros are a concern that can impact on quality of service by metros if unchecked. NERSA can work with National Treasury on ensuring that metros submit plans on time.
4 Approved Inclining Block Tariffs (IBTs) for 65% of licensed distributors for residential customers
Only 60% of Municipal IBTs were approved instead of the target of 65%. Externally delayed - some Municipal distributors are still struggling with the implementation of IBTs. It was also noted that The Minister of Energy approved on 12 February 2013 that this target be changed from 100% of licensed distributors implementing IBTs for their residential customers to what is indicated, as the approved percentage of licensed distributors implementing IBTs is impossible to achieve due to challenges faced by municipalities in the 2012/13 financial year.
The IBT is a tariff structure that impacts on electricity price and socio economic development and is an important measure for allowing access to electricity at affordable prices. The trouble in implementing IBTs is an area of concern for NERSA and the low implementation levels should be addressed.

Page 113 of 137
5 Approval of MYPD2 This was completed and Eskom’s application for the MYPD 3 was evaluated for implementation
MYPD is a complex and important process impacting the entire ESI and touches on all aspects of regulatory impact. Detailed discussion on the process is found in chapter 4.
6 Determine baseline for interest cover ratio, weighted average cost of capital as and debt equity ratio from Eskom audited financial statements; also submit MYPD 2 impact analysis report submitted
The Minister of Energy approved on 12 February 2013 that this target be removed from the NERSA Annual Performance Plan as it is covered under the new target of Approved Eskom’s annual Regulatory Reports. Furthermore an impact analysis report is also part of the future target as part of the Regulatory Report to be submitted by NERSA.
The measures now form part of a formalised process regarding the regulatory reports of Eskom that NERSA approves. These measures are central to the cost effectiveness of electricity supply and determine the long term viability and sustainability of the sector particularly form a financial point of view.
7 Approved Eskom retail tariffs (ERTSA) for 2012/13
The approval of Eskom’s retail tariffs was completed and NERSA will continue to assess Eskom’s application of adjusted retail tariffs for implementation
The detailed investigation of these retail tariffs over time is important in understanding the impact on different customer groupings in terms of pricing- particularly in the transparency of different cost components. It also feeds into issue of socio-economic development in terms of the impact on various sectors due to pricing.
8 The free basic electricity rate for the compensation of Eskom determined for 2012/13
NERSA has approved the free basic electricity rate for the compensation of Eskom. This forms part of tariff setting.
Free Basic Electricity is a socio-economic development priority within the ESI and NERSA's responsibility in determining the rate impacts on electricity pricing and costs to generators in the ESI.
9 Approved Regulatory Reporting Manual (RRM) implementation plan of Eskom
The Minister of Energy has approved that this target be added to the approved Annual Performance Plan as Eskom submit its regulatory financial reports at the end of the first quarter and the target is to have them analysed and approved by the end of the second quarter
NERSA's management of the regulatory reports from Eskom is central to its management of the ESI and impacts on all aspects of the regulatory environment. Clear guidelines and requirements for reporting are central to the effective use of these reports by NERSA. Interrogations of the financial and technical aspects of the reports are vital.
II Through Licensing and Registration NERSA tries to (1) control entry and ensure orderly development of the Electricity industry

Page 114 of 137
1 75% of licence applications processed in 120 days (statutory time frame) from application
80% of licence applications processed within 120 days from application. NERSA exceeded its licensing target in terms of licence applications processed in time. The Minister of Energy approved that this target be changed from 100% of licence applications processed within statutory time frames to what is indicated as the 120 days statutory time frame to complete a licence application is more than the 90 days quarter) required to report the processing of a licence application. The 120 days consists of one quarter and an additional 30 days. Therefore it stands to reason that after 90 days (completion of a quarter) only 75% of the application will be processed. The remaining 25% will be completed in the next month of the following quarter. For ease of reference it is assumed that all licence application(s) will be received at the beginning of every quarter.
Licensing is one of the core activities of the regulator and is central to the reliable service delivery of electricity in the ESI. It is the mechanism by which NERSA can choose to intervene where there is poor performance and non-compliance with codes, thus the efficient and effective processing of applications is vital to NERSA.
III Compliance monitoring and enforcement by NERSA for the (1) enforcement of quality and reliability level of electricity supply and (2) to ensure efficient operation of the licensed activities
10 audit reports on the state of compliance of licensees with licence conditions
The Minister of Energy approved that this target be changed from 10 licensees selected per annum to 10 audit reports to check their level of compliance with licence conditions through an audit to what is indicated in order to provide more clarity as to the required outcome.
The replacement with 10 audit reports is important as the monitoring of compliance remains a core activity for NERSA to determine the performance of generators, distributors and transmission services. Audit reports instead of licensee inspections formalises the process for NERSA and could lead to more details performance reviews.
100% of corrective action plans implemented through re-enforcement from previous non-compliant licensees; 100% compliance to 80% of prescribed conditions for previously audited licensees
The Minister of Energy approved that this target be removed from the approved Annual Performance Plan as it falls outside of the mandate of NERSA as the licensees are expected to implement the corrective action plans and not NERSA. NERSA can only report on the status of compliance with licence conditions and recommend possible corrective action plans. These corrective action plans will be monitored in the next financial year
The monitoring of corrective action plans is an area where NERSA can only follow up in the following financial year. This can impact on the time taken to implement corrective action plans.
IV Dispute resolution, including mediation, arbitration and handling of complaints by NERSA is aimed at (1) creating a fair balance between the needs of all stakeholders

Page 115 of 137
1 70% of complaints processed within 120 days from receipt
In 2012 NERSA exceeded its target. The Minister of Energy approved that this target is changed from 100% of complaints processed within statutory timelines to what is indicated as the 120 days statutory time frame to process complaints and disputes is more than the 90 days (quarter) required reporting the processing of complaints and disputes.
77
Handling of complaints is a key regulatory activity of NERSA. It is positive that the rate of processes complaints is exceeding targets. Progress regarding unresolved complaints needs to be made clear and requires follow up however as in indicated in the following new target set.
2 Report showing the status of complaints and disputes in the electricity supply industry
This is a new target. The Minister of Energy approved that this target be added to the approved Annual Performance Plan as it is a key activity of NERSA that was accidentally left off
Ongoing resolution of disputes should result in efficient and effective resolution of disputes. It is unclear how long disputes have been ongoing where there are unresolved disputes and this should be clarified.
V By setting of rules, guidelines and codes for the regulation of the electricity industry, NERSA (1) ensures non- discriminatory access to the electricity infrastructure and (2) facilitates investment in the ESI
1 100% attendance and chairing of the Grid Code Advisory Committee’s quarterly meetings
NERSA achieved 100% attendance and chairing of the Grid Code Advisory Committee’s quarterly meetings – thus enabling Independent Power Producers (IPPs) to constructively participate at all meetings including the Industry Expert Team workgroup sessions.
These forums and committee meetings are central to determining the operational parameters within the ESI and link directly to quality and reliability of electricity supply.
100% completion of applications received from IPPs relating to fair and equitable access to electricity infrastructure requiring amendment of the Grid code processed within set timelines
NERSA achieved a 100% completion of applications received from IPPs relating to fair and equitable access to electricity infrastructure requiring amendment of the Grid code processed within set timelines.
This involvement in determining Grid code access relates to both the viability of new IPPs as well as access to market for new generators and is central in the sustainability of the ESI in terms of attracting new investment and expanding generation capacity.
77
The 120 days consists of one quarter and an additional 30 days. Therefore, after 90 days (completion of a quarter) only 75% of the complaints and disputes will be processed. The remaining 25% will be completed in the next month of the following quarter. However some of the complaints and disputes from end-users and customers involve resellers (traders) who are outside the radar of the Electricity Regulation Act, 2006 (Act No 40 of 2006) and as such it is extremely difficult to resolve these types of complaints and disputes as the resellers (traders) are uncooperative. Therefore 5% has been deducted to cater for these types of complaints and disputes involving resellers (traders). [75% - 5% = 70%] (NERSA, 2013c).

Page 116 of 137
100% of transmission development plans evaluated
Eskom’s development plans not evaluated- Externally delayed - The transmission audit was deferred to the 2013/14 financial year on Eskom Transmission’s request in order for Eskom to accomplish compliance with previous audit findings
This is a cause for concern as delays is updating transmission network issues could impact on reliability of supply as well as the needed expansion and development of the network to new areas to connect unserved customers.
100% of rules relating to IRP developed and published through a consultation process within the required time frame
The Minister of Energy that this target be removed from the approved Annual Performance Plan due to changes in energy policy and the revised New Generation Regulations that was published by the Minister of Energy.
The removal of this element from the performance plan means that part of NERSA's role in planning and development of the ESI is reduced. This is a cause for concern regarding its mandate to provide consultation on planning matters.
Identification of rules to be published
What was achieved was the development and publication of rules (standard offer programme) for the implementation of EEDSM through a consultation process within the required time frame
Outlining requirements for Energy Efficiency and Demand Side Management is key to developing the technical parameters that will reduce electricity demand and use as well as promote energy efficiency.
Framework for Monitoring Renewable Energy Performance
NERSA has developed a framework for monitoring renewable energy performance and aims to publish 2bulletins on renewable energy performance. The Minister of Energy approved that this target be changed from 100% development and publication of renewable energy and co-generation rules through a consultation process within the required time frame to what is indicated due to changes in energy policy and revised New Generation Regulations published by the Minister of Energy.
This requirement enables the development and access to the energy market for renewable energy suppliers and is key adds to attracting new investment in the sector.
Published guideline for municipal tariff increases and benchmarks for 2012/13
NERSA has approved and published guideline for municipal tariff increases and benchmarks for 2013/14
It is important that these guidelines be implemented in a way that enables cost effective pricing of electricity and reliability of supply. The matter of electricity pricing in municipalities is contentious and involves financing and maintenance issues as discussed in chapter 5.
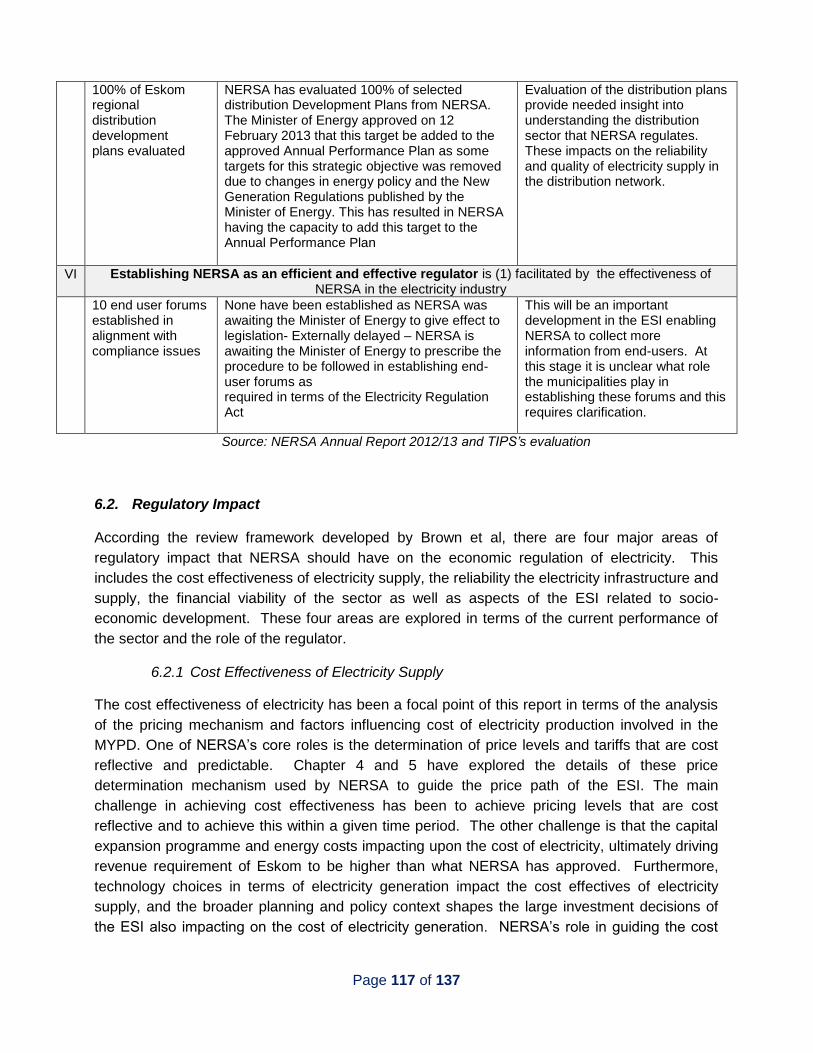
Page 117 of 137
100% of Eskom regional distribution development plans evaluated
NERSA has evaluated 100% of selected distribution Development Plans from NERSA. The Minister of Energy approved on 12 February 2013 that this target be added to the approved Annual Performance Plan as some targets for this strategic objective was removed due to changes in energy policy and the New Generation Regulations published by the Minister of Energy. This has resulted in NERSA having the capacity to add this target to the Annual Performance Plan
Evaluation of the distribution plans provide needed insight into understanding the distribution sector that NERSA regulates. These impacts on the reliability and quality of electricity supply in the distribution network.
VI Establishing NERSA as an efficient and effective regulator is (1) facilitated by the effectiveness of NERSA in the electricity industry
10 end user forums established in alignment with compliance issues
None have been established as NERSA was awaiting the Minister of Energy to give effect to legislation- Externally delayed – NERSA is awaiting the Minister of Energy to prescribe the procedure to be followed in establishing end-user forums as required in terms of the Electricity Regulation Act
This will be an important development in the ESI enabling NERSA to collect more information from end-users. At this stage it is unclear what role the municipalities play in establishing these forums and this requires clarification.
Source: NERSA Annual Report 2012/13 and TIPS’s evaluation
6.2. Regulatory Impact
According the review framework developed by Brown et al, there are four major areas of
regulatory impact that NERSA should have on the economic regulation of electricity. This
includes the cost effectiveness of electricity supply, the reliability the electricity infrastructure and
supply, the financial viability of the sector as well as aspects of the ESI related to socio-
economic development. These four areas are explored in terms of the current performance of
the sector and the role of the regulator.
6.2.1 Cost Effectiveness of Electricity Supply
The cost effectiveness of electricity has been a focal point of this report in terms of the analysis
of the pricing mechanism and factors influencing cost of electricity production involved in the
MYPD. One of NERSA’s core roles is the determination of price levels and tariffs that are cost
reflective and predictable. Chapter 4 and 5 have explored the details of these price
determination mechanism used by NERSA to guide the price path of the ESI. The main
challenge in achieving cost effectiveness has been to achieve pricing levels that are cost
reflective and to achieve this within a given time period. The other challenge is that the capital
expansion programme and energy costs impacting upon the cost of electricity, ultimately driving
revenue requirement of Eskom to be higher than what NERSA has approved. Furthermore,
technology choices in terms of electricity generation impact the cost effectives of electricity
supply, and the broader planning and policy context shapes the large investment decisions of
the ESI also impacting on the cost of electricity generation. NERSA’s role in guiding the cost

Page 118 of 137
effectiveness of electricity is limited to the MYPD process, however many other factors
impacting cost effectiveness lie outside of its regulatory sphere and belong to the policy and
planning activities of government and Eskom. The table below shows Eskom’s performance in
terms of its performance compact with DPE. The table shows the increase in cost per kwh along
with increased capacity.
Table 19: Eskom Performance in terms of DPE Shareholder Compact
Performance area
Company level performance indicator
Target Target Actual Actual Actual
2012 achieved 2012 2011 2010
Ensuring adequate future electricity
Generation capacity installed (MW)
385 √ 535 315 452
Transmission lines installed (km)
606 √ 631 443 600
Transmission capacity installed (MVA)
500 √ 2 525 5 940 1 630
Ensuring reliable electricity supply
Management of the national supply/demand constraints
No load shedding
√ No load shedding
No load shedding
No load shedding
Demand-side management energy efficiency (GWh)
1 051 √ 1 422 1 339 n/a
Business sustainability
Internal energy efficiency (GWh)
25.5 √ 44.96 26.20 n/a
Water usage (L/kWh)
≤1.35 √ 1.34 1.35 1.34
Cost of electricity (R/MWh) (excluding depreciation)
387.02 √ 374.19 296.36 255.09
Debt: equity ≤2.6 √ 1.69 1.66 1.68
Interest cover ≥1 √ 3.27 1.40 0.77
Supporting South Africa’s developmental objectives
% local content in capital expansion contracts placed
52 √ 77.2 79.7 73.9
Total learners in the system (engineers)
1 800 √ 2 273 1 335 955
Total learners in the system (technicians)
700 √ 844 692 681
Total learners in the system (artisans)
2 350 √ 2 598 2 213 2 144
Source: Eskom 2012 Annual Report- Shareholder Compact

Page 119 of 137
6.2.2 Reliable Infrastructure Services
Reliable infrastructure of the electricity sector is based on three main measures for the technical
performance of the ESI and this is the continuity of the electricity supply to end users, the
reliability of this supply and also the quality of the electricity supply. On a technical level it
requires the full function and operation of the entire value chain from generation, transmission
and distribution to be optimally efficient and sustainable. NERSA’s role in guiding these aspects
of the ESI are through technical guidelines and codes it establishes and the monitoring
conducted in accordance with license issuing. The reliability of the ESI infrastructure is
dependent on the performance of both Eskom and municipalities.
In terms of supply and demand for electricity, installed capacity is greater than peak demand.
Whether or not this capacity to generate electricity can actually be dispatched to meet electricity
demand is an operational and technical matter impacting the performance of the ESI. The
matter concerning what South Africa’s peak demand is also a matter of contention because
peak demand could be altered by voluntary shifting of energy use in peak times as well as
through initiatives such as the buyback schemes initiated by Eskom.
Looking at the performance of the ESI in terms of what the reserve margin is serves as a better
indicator of whether supply has met demand in the ESI. Between 2000 and 2007 the reserve
margin was at its lowest of 5%. This is compared to the 1990s, where reserve margins were
around 40%. This was when special pricing agreements were entered into with BHP Billiton for
instance (previously discussed).
These low reserve margins are essentially an indication of the strain on the ESI. In terms of
international standards the reserve margin is meant to be between 10-15%. To add to this the
use of stand-by energy sources such as expensive gas turbines is another indicator that on a
technical level the ESI has not been operating most efficiently.
Unplanned Capability Loss Factor (UCLF) and Energy Availability Factor (EAF) are two
measures that also speak to this performance measure. Between 1990 and 2003 the EAF was
90% and declines to 80% between 2003 and 2006. The performance of this measure has
declined even further to 77% in 2013. When power plants are operating beyond their limits and
when emergency measures need to be taken and alternative and more expensive energy
sources used to provide electricity, this impacts the EAF measure. The UCLF deterioration also
indicates that plants are not properly maintained and generation assets become more
unreliable.
This reliability is measured by System Average Interruption Frequency Index (SAIFI) as well as
System Average Interruption Duration Index (SAIDI) measures. According to the two graphs
below there have been technical improvements in the ESI in the last 5 years but the level of
outages is high compared to international standards. The chart shows that SAIDI (left figure) is
improving at a faster rate than SAIDI (right figure) i.e. the duration of interruptions is reducing

Page 120 of 137
faster than the frequency of interruptions. North American and European utilities for example
have SAIFI measures of between 1 and 3 and interruptions of no more than 5 hours (Newbery
and Eberhard 2008).
Figure 27: Reliability of the Distribution Sector
Source: NERSA
Eberhard (2008, 2012), Steyn (2003, 2012) and Pickering (2012) agree that existing generation
capacity is insufficient and additional investment in generation capacity is necessary. To take
generating units off line to perform essential maintenance, Eskom needs 3000 MW of
generating capacity in reserve. With nearly two-thirds of Eskom’s 27 power stations beyond the
midpoint of their expected lifespans (Eskom, 2013b), the issue of maintenance and upgrade of
power stations is a critical one; since delaying maintenance causes plants to be more unreliable
and causes more outages.
6.2.3 Financial Performance and attraction of new investment
Financial performance of the ESI is very dependent on not only the Capital Expenditure
Expansion programme (CAPEX) of an organisation such as Eskom but also matter of liquidity
levels and the cost reflectivity of electricity tariffs. The ability of the ESI (particularly Eskom) to
be profitable is particularly difficult. Input costs have become a major issue in the financial
performance of Eskom as well as the cost of its expansion programme. Sufficient income must
be generated to cover operating costs and this is a major challenge for the electricity utility.
When there is not enough surplus to reinvest in infrastructure and upgrading of the ESI this
funding gap impacts the future viability of the industry. Furthermore, lenders look at the
performance of the ESI both from a technical and financial perspective and their decisions

Page 121 of 137
impact the cost of capital to the utility (which is also impacted by its credit rating by ratings
agencies). The financial performance of the ESI in terms of liquidity and cash flow problems has
been one of the main areas of concern. Eskom established a Group Capital division in
September 2010 to improve capital portfolio management.
Eskom showed a net profit of R5.23 billion for the year ending March 2013. It earns most of its
profit in the first half of the financial year, during the winter months. Revenue earnings for the
period increased from R114.8 billion to R128.8 billion even though sales volumes had declined.
These were the lowest since 2006, declining by 3.7% to 216 561 GWH. The company stated
that this reflects the lower than expected economic growth and the impact of industrial action; as
well as the success of the buy-back programme and demand side management programme.
Eskom’s net group profit in 2012 was R13.2 billion and R 12.7 billion at company level. Total
debt of Eskom has increased to R202.9 billion. Furthermore Eskom’s refurbishment,
maintenance and strengthening of current operating plants amounted to R19 billion in the last
financial year.
The revenue per kilowatt hour for Eskom in 2012 was 58.5 c (and in the previous financial year it
was 50.3c), whereas costs for the business are 54.2c per kilowatt hour (and 41.3c in the
previous year). Primary energy costs have risen 36.1% to 28.1 c per kilowatt hour and now
make up almost half of operating costs. Burnt coal costs also increased by 24.2%. This was
driven by mainly by higher costs and lower output from the mines feeding Eskom power
stations. The lower than requested 8% annual average tariff increase granted by NERSA puts
Eskom under strain.
In terms of demand side management, the Eskom initiative achieved a 2 224 GWh saving,
which brings the cumulative save since 2005 to 3 587 MW. Eskom has constructed its own wind
farm at a cost of R2.4 billion for the Sere project. The purchasing power agreements it has
signed to date are to the value of 2 400MW. Its total contracting from IPPs in 2012 amounts to
1 135 MW (compared with 1 009MW in the previous year).
Factors that impact on the cost of borrowing for Eskom include its reliance on the credit rating of
government; Rand depreciation that increases the cost of imported equipment and the cost of
foreign loans; and any uncertainty regarding the tariff price path; environmental tax increases
(including carbon tax) that cannot be recovered from Eskom’s customers; non-payment of
electricity; inappropriate cash liquidity levels; regulatory uncertainty (especially in terms of ISMO
Bill) and a power system crisis resulting in a lack of confidence from investors (Eskom,
2012)p.56.)
The CAPEX programme of Eskom has had a significant impact on the company financially. It
was initially estimated at R340 billion when it started in 2005. The table below shows the size of
the various projects in the programme. Between 200-2018 the programme will add 11 361 MW
of additional generation capacity by 2019 (Etzinger, 2013).

Page 122 of 137
Table 20: CAPEX Expansion Programme (MW)
Project 2012 2013 2014 2015 2016 2017 2018 2019 Total
Grootvlei (RTS) 30 30
Komati (RTS) 200 100 300
Camden (RTS) 20 30 5 35
Medupi (Coal Fired ) 794 1588 1588 794 4764
Kusile (Coal Fired ) 800 800 800 800 1600 4800
Ingula (Pumped
Storage)
1332 1322
Sere (RE) 100
Total MW 20 260 899 3820 2388 1594 800 1600 11 361
Source: Etzinger, 2012
6.2.3.1 Performance related to the Expansion Programme
For the expansion programme that started in 2005, Eskom has delivered 6017 MW of new
generation capacity, 4 686km of new transmission lines and 23 775 MVA of new substations. It
has also been stated by Eskom that 82.9% of the funding for the build programme has been
secured to date. Information to date on the large scale expansion programme is that 5.8MW of
the planned 17GW expansion programme has been commissioned. Construction of the first
boiler at Kusile power station in Mpumalanga was started in 2012, however delays have been
related to the boiler contract where issues have arisen.
Criticism around the programme relate to the choice of technology and reliance on coal-fired
power as well as the bias toward mega projects. The major cost and complexities in the project
management of the projects are also problematic. Eskom’s argument is that the large-scale
coal powered plants supply cheaper electricity on a levelised cost of electricity (LOCE) basis
and provide a more dependable flow of electricity.
The table below details the progress of the CAPEX programme which is already 3 years behind
schedule. Delays have caused an increase in construction cost also threatening security of
supply. The estimated cost of unserved energy (COUE) in South Africa ranges from ZAR 75
kWh-ZAR 10kWh (Urbach, 2013).
Table 21: Progress on Eskom CAPEX Programme (MW)
Return to
Service Base Load
Peaking &
Renewable Refurbishment
In development
None Nuclear site
development and
front end planning
Biomass
Energy logistics
projects
Sere Wind Farm
(100MW)
CSP plant
(100 MW)
General
refurbishment
Air quality projects
Under
construction
Komati
1000MW)
Medupi (4 764 MW)
Kusile (4 800 MW)
Ankerling (1338, 3
MW)
Arnot capacity
increase (300 MW)

Page 123 of 137
Return to
Service Base Load
Peaking &
Renewable Refurbishment
Camden (1520
MW)
Grootvlei (1180
MW)
Gourikwa (746
MW)
Ingula 1322 MW
Solar PV Installations
(1.62 MW) at MWP,
Lethabo and Kendal
Matla
Kriel
Duvha
Progress at 31
March 2013
Installed 3370
MW or 91% of
total
In construction
330 MW or 8%
100% of 9564 MW
in construction
Installed 2084.3 MW
or 62% of total
In construction 1232.0
MW or 48%
100% of 300 MW
installed
Source: TIPS 2013: GGGI Project
6.2.4 Socio-Economic and Environmental Performance
Socio-economic development goals form part of the imperative to deliver electricity equitably
and responsibly. The regulator has developed pricing mechanism in the form of subsidies and
tariffs that facilitate the provision of electricity to as many South Africans as possible. Beyond
the regulator’s role it is the function of Eskom to scale its electrification programme and expand
its capacity to serve all customers. South Africa has a 75% electrification rate nationwide which
is the highest in sub-Saharan Africa, however only 5% of the rural population has access to
electricity compared with 88% of urban areas (EIA, 2013). It is estimated that South Africa’s total
electricity consumption grew by 20% between 2000 and 2010 while installed capacity grew at a
rate of 7% during the same period (EIA, 2013). Since the launch of the electrification
programme in 1991, more than 4.3 million (2012: 4.2 million) homes have been electrified
(Eskom, 2013) and 144 558 homes were electrified in the last financial year by Eskom. The
socio-economic performance of the ESI has been strong since the 1990s and has consistently
improved. It is one of the areas in which the objective of the ESI is far reaching and broad.
The role of the regulator in terms of environmental outcomes of the ESI is limited. Beyond its
licensing of IPPs and promotion of adherence to technical codes, the regulator does not
determine technology choices for electricity generation or intervene in the use of any specific
technologies. This is guided on a policy and planning level by the DoE. In 2013, South Africa’s
total installed capacity was 41.9 GW of which 85% was supplied by coal fired plants (Eskom
AFS 2013). Collectively nuclear, open-cycle gas turbine, hydro and pumped-storage power
plants comprise the remaining 15 percent (Eskom, 2013a). The electricity generated at coal-
fired power station is also based on the use of low grade coal and the implication of this on the
ESI’s environmental performance is significant. The cost of desulphurisation is a costly process
in electricity generation adding to 20% of generation costs (Newbery and Eberhard 2008). The
use of old power stations and old technology has also added to poor environmental performance
in the ESI with the priority of keeping the lights on driving this, with the introduction of renewable
energy being a welcome shift in policy that should alleviate the pressure on environmental
performance.

Page 124 of 137
6.3. Conclusion
The performance of NERSA in terms of its own key performance indicators is limited to
achieving and competing activities related to its core strategic objectives. While its KPIs seem
to have been satisfactorily met, its impact on the ESI is more far-reaching than the
establishment of guidelines and prescriptions, and are not quite adequately captured by the
current KPI descriptions.
NERSA has been required to take a hard-line approach to matters relating especially to the
financial viability of the sector. The area in which the regulator has had the most significant
impact on the performance of the ESI has been in price determination decisions. It has been
responsible for adjusting downward the requested revenue requirements made by Eskom on
multiple occasions since the implementation of MYPD. Price increases have still however been
above inflation in recent years. NERSA’s role in navigating a sustainable and predictable price
path for the ESI has been its major challenge. Furthermore in understanding the impact of its
pricing decisions on various customer groupings, the regulator has needed to clarify and
investigate the tariff structures of the retail tariffs of both Eskom and municipalities, with limited
allowance to enforce limitations on price increases by municipalities.
NERSA also finds itself in a position where it needs to face the broader development demands
for equitable and increased access to electricity. This is a cost borne by the ESI itself and
achieved through cross-subsidisation in the sector. Accommodating these goals alongside the
objective of efficient and effective economic regulation of the ESI is challenging. It is also
complicated by the dominance of the main electricity player Eskom and the impact of
information asymmetries on NERSA’s decision making. The regulator’s ability to interrogate the
cost of supply and investment implications of Eskom is critical to its role as regulator.
The performance of the regulator in the ESI particularly as independent regulatory in a sector
that has historically been dominated by Eskom, hinges on its ability to make clear and consistent
decisions. It has the challenging task of bringing electricity pricing to a more cost-reflective
levels while understanding the impacts of its price determination and structures.

Page 125 of 137
7. Some conclusions and areas of capacity building
The ESI in South Africa is a complex interaction of institutional and regulatory frameworks, the
development of which has been partly shaped by power relations and competing interests over
the decades. Policy uncertainty and related issues in the regulatory framework of the ESI have
resulted in certain detrimental impacts on the sector and the economy as a whole, particularly
during the 2008 load shedding crises. Sub-optimal investment decisions in terms of timing, size
and technology choices of power plant investments have had negative consequences on the
development of the ESI. The implementation of the 2008 expansion programme has proved that
security of supply is more complicated than merely approving the construction of large mega
power plants. It requires timely planning, procurement and contracting of generation capacity.
Planning processes as well as decision-making mechanisms need to be clarified, streamlined
and strengthened. In addition to the lack of capacity and unclear responsibilities of the DoE and
NERSA, information asymmetry in favour of Eskom which concentrates investment planning
expertise and system information complicates the position of the regulator and must be
addressed.
The unstable policy environment complicates Eskom’s financial planning, in turn increasing their
risk profile and access to (affordable) finance, and ultimately increasing electricity prices.
Regulatory risk resulting from uncertainty, ambiguity or gaps in the legal, regulatory, policy and
trading environment (or the application of the rule), plays an instrumental part in the SoE’s
access to funding as well as its associated cost (interest rate) (Steyn 2012).
The hybrid market structure of the ESI, and dominance of Eskom, further complicates
investment planning, initiation of projects, management of procurement processes and access
of IPPs to the grid. Institutional and regulatory frameworks have failed to recognise the features
of a hybrid market resulting in a contradictory policy landscape, producing a suboptimal planning
system of “non-dynamic IRPs, ministerial determinations and ad hoc procurement via DoE and
National Treasury” (Eberhard 2012).
More importantly, a new vision for the ESI must be elaborated to provide direction and certainty
to all stakeholders in the sector. The electricity crisis has given business, government and
academics an opportunity to think beyond mega-build generation plants and how much IPPs
and renewable energy should be introduced into the system. Modular and smart technologies,
used in conjunction with standard technologies, can provide the tools to rethink energy strategy
in South Africa. The recent developments and NERSA’s role in encouraging competition through
IPPs has been one of the successes in the ESI. Changing behaviour of firms who have
developed a path dependency to cheap energy requires a genuine willingness of firms to evolve
from short-term purely profit maximising behaviour to a more long-term, sustainable, green
growth path.
Notwithstanding operating in this uncertain and conflicting space, NER and NERSA have taken
some bold decisions regarding electricity price increases. They have played an active role in
scrutinising cost components in Eskom’s tariff applications, more often than not granting lower
tariffs than requested. This is particularly important given rate of return type of regulation, where

Page 126 of 137
there are incentives to inflate or pad costs. The process however has also allegedly been
politically influenced and prices in certain periods as a result were sub-economical and not fully
cost-reflective. There is room for building NERSA’s capacity in this regard. There is significant
information asymmetry in favour of Eskom, and NERSA needs to constantly be on top of cost
components in terms of finance, accounting and modelling techniques.
NERSA has also made important strides in making the different Eskom’s tariff structures more
transparent, user friendly and cost-reflective over the years which are positive developments
towards more efficient regulation. However, it appears that NERSA has not seriously engaged in
amending tariffs structures to large industrial users, such as those on Megaflex, as well as those
under special deals, according to changing supply and demand balances and economic
conditions. This may be the reason for the widening gap between industrial customer prices on
the one hand, and residential and rural customer prices on the other. Prices to heavy-users of
electricity should be increasing relative to light users in tight supply situations so as to
discourage the use of electricity and encourage investment in energy efficiency and renewable
energy (albeit that there are differences in costs to serve different customer groups).
NERSA has the power to review long term contracts, such as the BHP Billiton contract, in terms
of the Electricity Regulation Act (ERA) if it safeguards and meets the interests and needs of
present and future electricity customers and end users. There is potentially scope for training to
understand evolving market and economic dynamics of heavy industrial electricity users in
South Africa, which would provide NERSA with a better understanding of the impacts of their
interventions in the economy. This would allow NERSA to take more robust decisions in terms of
industrial policy and employment implications of special schemes Eskom enters into, such as
the electricity buy-back schemes in the ferrochrome industry for instance, or the implications of
municipality electricity pricing on the competitiveness of smaller industrial customers.
Electricity tariff determination by municipalities is a complex area, with much controversy around
NERSA’s mandate to regulate municipality electricity prices. NERSA has made some important
strides in attempting to address the issue of municipality pricing in the face of uncertain
legislation governing this space, including through assisting municipalities to collate their cost
information in a manner that is more cost-reflective. Nonetheless, there are serious concerns
around accurate and standardised cost reporting, as well as repair and maintenance backlogs of
municipalities’ electricity distribution infrastructure, both areas in which NERSA could be more
proactive. NERSA could also play a greater role in attempting to clarify the ‘legislative
misalignment’ around what its role is in setting municipal tariffs.
Economic regulation cannot exist in a vacuum from a country’s other economic, social and
developmental objectives and policies. NERSA therefore has the challenging task of taking
these into account, while pursuing its core mandates in ESI regulation.

Page 127 of 137
References
Abrahams, Y., Fischer, R., Martin, B., McDaid, L., 2013. Smart Electricity Planning: Fast-Tracking Our
Transition to Smart Electricity Supply for All. Electricity Governance Initiative of South Africa.
Aghion, P., Dewatripont, M. Du, L., Harrison, A., and P. Legros, 2012, “Industrial Policy and Competition”, Working Paper 18048, http://www.nber.org/papers/w18048 NBER working paper Altman, M.; Davies, R.; Fleming, D.; Harris, H. and Mather, A. 2008. “The Impact of Electricity Price
Increases and Rationing on the South African Economy” Human Sciences Research Council: Centre for Poverty Employment and Growth. Innovative Employment Strategies
AMEU, 2013. NERSA Workshop: Municipal Tariff Guideline for the 2014/15 Financial Year [WWW
Document]. Assoc. Munic. Electr. Util. URL http://www.ameu.co.za/ejournal/2013/9/30/nersa-
workshop-municipal-tariff-guideline-for-the-201415-fin.html (accessed 12.13.13).
Amra, R., 2013. Back to the drawing board? A critical evaluation of South Africa’s electricity tariff-setting
methodology. Presented at the Biennial conference fo the Economic Society of South Africa.
BHP, 2010. BHP Billiton and Eskom sign an amended agreement for the Mozal smelter in Mozambique- Discussions on South African smelter contracts continue, 30 May 2010 available at http://www.bhpbilliton.com/home/investors/news/Pages/Articles/BHP%20Billiton%20And%20Eskom%20Sign%20An%20Amended%20Agreement%20For%20The%20Mozal%20Smelter%20In%20Mozambique%20-%20Discussions%20On%20South%20Afri.aspx, accessed on 2 July 2013
BHP, 2013. Presentation to National Assembly Portfolio Committee on Trade and Industry, Dr Mkhwanazi, April 2013
Brown, A., Stern, J., Tenenbaum, B., Gencer, D., 2006. Handbook for Evaluating Infrastructure Regulatory Systems.
Business Day, 2014. EDITORIAL: Minister right to give Eskom room available at http://www.bdlive.co.za/opinion/editorials/2014/03/18/editorial-minister-right-to-give-eskom-room
Calvo, G., 1978. On the Time Consistency of Optimal Policy in a Monetary Economy. Econometrica 46, 1411–1428.
Clark, A. and B. van Vuuren (2013). Nelson Mandela Bay Business Chamber NERSA Consultation MYPD3 available at http://www.nersa.org.za/Admin/Document/Editor/file/Consultations/Electricity/Presentations/Nelson%20Mandela%20Bay%20Business%20Chamber.pdf
Creamer, T., 2013. Eskom may approach Nersa as coal costs continue to surge. Polity.org.
Creamer, T., 2014. From the Role of Nuclear to the Position of Gas, IRP Debate is Heating Up [WWW
Document]. Eng. News. URL http://www.engineeringnews.co.za/article/from-the-role-of-nuclear-
to-the-position-of-gas-irp-debate-heats-up-2014-01-20 (accessed 1.21.14).
Davie, E., 2013. What Has Happened to the ISMO Bill? [WWW Document]. Free Mark. Found. URL
http://www.freemarketfoundation.com/issues/feature-article-what-has-happened-to-the-ismo-bill
(accessed 30 01 14).
Deloitte, 2012. ‘The economic impact of electricity price increases on various sectors of the South African economy- A consolidated view based on the findings of existing research.’ DME, 2004. National Energy Regulator Act, Government Gazette.
DME, 2006. Electricity Regulation Act, Government Gazette.
DME, 2008a. National Energy Act, Government Gazette.
DME, 2008b. Electricity Pricing Policy (EPP) of the South African Electricity Supply Industry, Government
Gazette.
DME, 2008c. National Energy Efficiency Strategy of the Republic of South Africa. Department of Minerals
and Energy, Pretoria.
DoE, 2009. Electricity Regulation Act: Electricity Regulations on New Generation Capacity, Government
Gazette.
DoE, 2010a. Terms of Reference - Department of Energy - Integrated Resource Plan Technical Task
Team. Department of Energy, Pretoria.

Page 128 of 137
DoE, 2010b. Stakeholder Information Pack IRP 2010. Department of Energy.
DoE, 2011. Electricity Regulation Second Amendment Bill, Government Gazette.
DoE, 2012. Baseload IPP Procurement Programme. Determination under Section 34(1) of the Electricity
Regulation Act 4 of 2006, Government Gazette.
DoE, 2013a. Integrated Resource Plan for Electricity (IRP) 2010-2030. Update Report 2013. Department
of Energy, Pretoria.
DoE, 2013b. Annual Report 2012/2013. Department of Energy, Pretoria.
DPE, 2012. Annual Performance Plan 2012/13. Department of Public Enterprises, Pretoria.
Eberhard, A., Gratwick, K.., 2008. Demise of the standard model for power sector reform and the
emergence of hybrid power markers. Energy Policy 36.
Eberhard, A. 2013. An Overview of the Restructuring of the South African Electricity Distribution Industry (EDI) SALGA STAKEHOLDER WORKSHOP, available at http://www.gsb.uct.ac.za/files/SALGAWorkshop.pdf
EIA, 2013. Overview of South Africa’s Energy sector. Eskom, 2010. Presentation on ‘Cost of service- a tariff overview.
Eskom, 2012. Integrated Report 2012.
Eskom, 2013a. Legislation [WWW Document]. Eskom. URL
http://www.eskom.co.za/OurCompany/CompanyInformation/Pages/Legislation.aspx (accessed
11.11.13).
Eskom, 2013b. Integrated Report for the Year Ended 31 March 2013. Eskom, Johannesburg.
Eskom, 2007. RSA Distribution Code.
http://www.eskom.co.za/Whatweredoing/Documents/RSADistributionNetworkCodeVer5.1.pdf
GCIS, 2007. Statement on Cabinet meeting of 5 September 2007. Government Communication and
Information System.
Gratwick, K.N., Eberhard, A., 2008. Demise of the Standard Model for Power Sector Reform and the
Emergence of Hybrid Power Markets. Energy Policy 36, 3948–3960.
Hodge, J., van Basten, C., Myburgh, A., Anderson, P., Sheik, F., 2008. A Regulatory Framework for
Economic Regulation of Network Industries in South Africa. Prepared on behalf of the Office of
the Presidency. Genesis Analytics, Johannesburg.
Joskow, P., 2006. Introduction to Electricity Sector Liberalization: Lessons Learned from Cross-Country
Studies, in: Sioshansi, F.P., Pfaffenberger, W. (Eds.), Electricity Market Reform. Elsevier Ltd.,
Oxford.
Joubert, D., 2012. Optimal Product Pricing for Sustainability of Regulated Infrastructure Industries: an
Analusis based on an Examination of the Basic Theory of Life Cycle Financial Dynamics.
Kapika, J., 2012. Assessing Regulatory Performance in Sub-Saharn Africa- Perspectives from the African
Electricity Regulator Peer Review Learning Network.
Kapika, J., Eberhard, A., 2010. Assessing regulatory performance: The case of the Namibian electricity
supply industry. J. Energy South. Afr. 12.
Kessides, I.N., Bogetic, Z., Maurer, L., 2007. Current and Forthcoming Issues in the South African
Electricity Sector (World Bank Policy Research Working Paper No. 4197). World Bank,
Washington, D.C.
Kolver, L/ , .BHP Billiton, analyst differ on power pricing regime for aluminium smelters, available at http://www.miningweekly.com/article/contribution-of-bhp-aluminium-smelters-to-south-african-economy-disputed-2013-07-05, accessed on 11 July 2013
Kydland, F., Prescott, E., 1977. Rules Rather Than Discretion: The Inconsistency of Optimal Plans. J. Polit. Econ. 85, 473–490.
Lasswell, H.D., 1956. The Decision Process: Seven Categories of Functional Analysis. University of
Maryland, College Park, MD.
Louw, D., Electricity Distribution Network Collapse Three Years Away, 2012, Engineering News Daily – 27 July 2012. Accessed in April 2014 at
Page 129 of 137
HTTP://WWW.ENGINEERINGNEWS.CO.ZA/ARTICLE/NETWORK-COLLAPSE-THREE-YEARS-AWAY-2012-07-26.
Marquard, A., 2006. The Origins and Development of South African Energy Policy. University of Cape
Town, Cape Town.
Montmasson-Clair, G., :oilwa, K., Ryan, G., 2014. Regulatory Entities Capacity Building Project Review of
Regulators Orientation and Performance: Review of Renewable Energy Regulation. University of
Johannesburg and Trade and Industrial Policy Strategies, Johannesburg and Pretoria.
Nepal, R., Jamasb, T., 2013. Caught Between Theory and Practice: Government, Market and Regulatory
Failures in Electricity Sector Reforms. University of Cambridge Electricity Policy Research Group,
Cambridge.
NERSA, 2010. NERSA’s Decision on Eskom’s Required Revenue Application - Multi-Year Price
Determination 2010/11 to 2012/13 (MYPD 2). National Energy Regulator of South Africa, Pretoria.
NERSA, 2013a. Annual Report 2012/2013. National Energy Regulator of South Africa, Pretoria.
NERSA, 2013b. NERSA’s Decision on Eskom’s Revenue Application for the Third Multi-Year Price
Determination Period 2013/14 to 2017/18. National Energy Regulator of South Africa, Pretoria.
NERSA, 2013c. Annual Report.
Newberry, D., Eberhard, A., 2008. South African Network Infrastructure Review: Electricity. National
Treasury and Department of Public Enterprises, Pretoria.
Newbury, D., Eberhard, A., 2008. South African Network Infrastructure Review: Electricity.
Noah, A., 2012, Eskom’s Submission on Possible Solutions to Electricity Distribution Industry (EDI) Challenges, Presentation to the Portfolio Committee on Energy, 25 July 2012. Pickering, M., 2010. Towards an Independent System Operation for South Africa. Energy Research
Centre at the University of Cape Town, Cape Town.
Pressly, D., 2013. ANC Mum on Stalled ISMO Bill [WWW Document]. IOL. URL
http://www.iol.co.za/business/news/anc-mum-on-stalled-ismo-bill-1.1607395#.UqgZ3uLpytw
(accessed 12.11.13).
Republic of South Africa, 1996. Constitution of the Republic of South Africa, Statutes of the Republic of
South Africa - Constitutional Law.
Rodrik, D. 2004, “Industrial Policy For The Twenty-First Century”. Paper prepared for UNIDO. Rodrik, D. 2007, “Normalizing Industrial Policy”, Harvard University, John F. Kennedy School of Government Simbalism. 2013. Tariff Structures.
http://www.simbalism.co.za
Steyn, E., 2013. Dawn of a Competitive Electricity Sector for South Africa: The Independent System and
Market Operator Bill B 9-2012 – Context, Content and Comment. Jure 2, 539–556.
Steyn, G., 2003. Administrated Prices: Electricity. National Treasury, Pretoria.
Steyn, G., 2006. Eskom: History’s Unheede Lessons. Bus. Day.
Steyn, G., 2012. The Impact of Economic Regulation on the Management and Performance of South
Africa State Owned Enterprises. Presented at the South African Economic Regulators
Conference, National Energy Regulator of South Africa, Johannesburg.
Steyn, G., 2013. Response to TIPS presentation on “Review of Regulators’ Orientation and Performance:
Electricity.”
Storer, D., Teljeur, E., 2003. Administrtive Prices: Executive Report. National Treasury, Pretoria.
The Royal Swedish Academy of Sciences, 2004. Finn Kydland and Edward Prescott’s Contribution to
Dynamic Macroeconomics: The Time Consistency of Economic Policy and the Driving Forces
Behind Business Cycles. The Royal Swedish Academy of Sciences, Stockholm.
TIPS, GGGI (2014). Impact of Electricity Price Increases on the Competitiveness of Selected Mining
Sector and Smelting Value Chains. Global Green Growth Institute, Economic Development
Department, Department of Trade and Industry, Seoul and Pretoria.

Page 130 of 137
UNFCCC, 2011. Compilation of information on nationally appropriate mitigation actions to be
implemented by Parties not included in Annex I to the Convention.
Unlimited Energy, 2013. Renewable Energy Policy Mapping Study of the Republic of South Africa.
Deutsche Gesellschaft für Internationale Zusammenarbeit (GIZ) and Department of Energy,
Pretoria.
Van Basten, C., 2007a. Economic Regulation of SA’s Public Utilities: A Concept Paper. Trade and
Industrial Policy Strategies (TIPS), Pretoria.
Van Basten, C., 2007b. Economic Regulation of the Electricity Industry: A Balancing Act. Trade and
Industrial Policy Strategies (TIPS), Pretoria.
Van Vuuren, A. J., 2013. Is Eskom’s glass half-empty or half-full?, available at
http://www.citypress.co.za/business/is-eskoms-glass-half-empty-or-half-full/
Whittington G (1983), Inflation Accounting: An Introduction to the Debate, Cambridge, Cambridge
University Press.
(1985), Accounting for State Regulated Enterprises: An Agency Perspective, Accounting and Business Research, 16, 311-325.
_______ (1994), Current Cost Accounting: Its Role in Regulated Utilities, Fiscal Studies, 15, 88-101.
_______ (1998a), Regulatory Asset Value and the Cost of Capital, in Beesley M E (ed) Regulating Utilities: Understanding the Issues, pp91-108, London, Institute of Economic Affairs, (IEA Readings 48).
_______ (1998b), Deprival Value and Price Change Accounting in the U K, Abacus, 34, 28-35.
Whittington G and Pong C K M (1996), The Withdrawal of Current Cost Accounting in the United
Kingdom: A Study of the Accounting Standards Committee, Abacus, 32, 30-53.

Page 131 of 137
Appendix 1: List of Eskom Power Stations

Page 132 of 137
Appendix 2: South African electricity grid map
Taken from EIA 2013
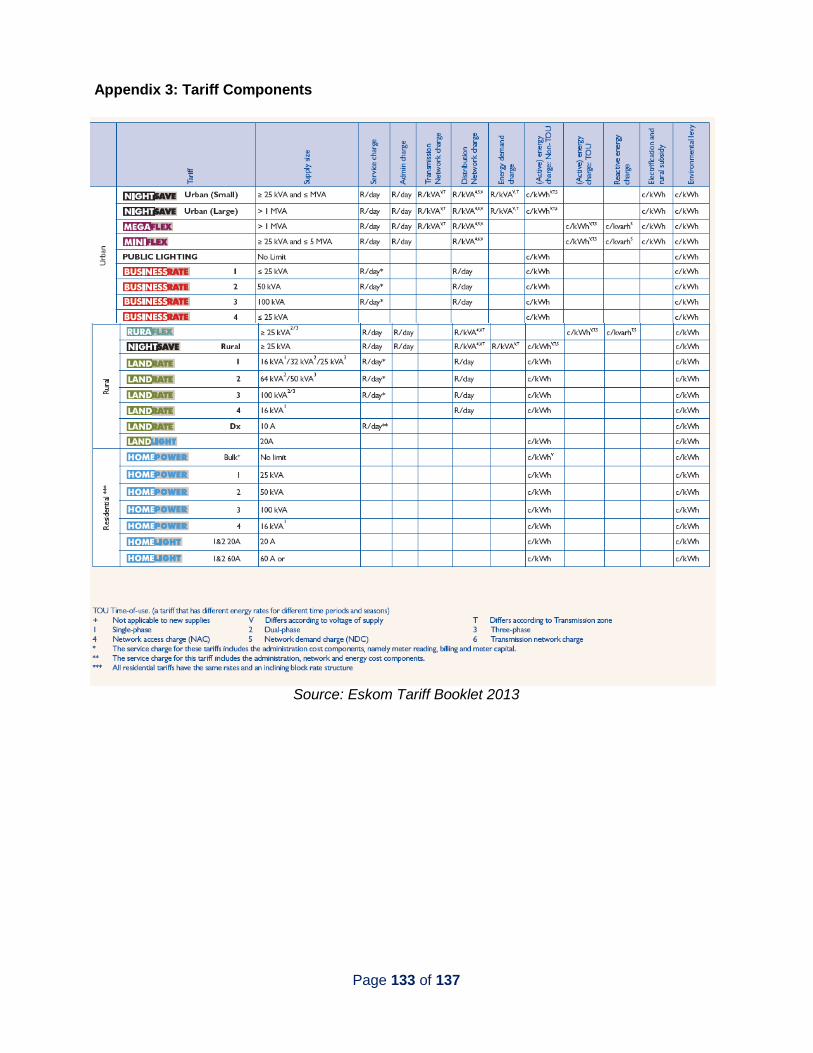
Page 133 of 137
Appendix 3: Tariff Components
Source: Eskom Tariff Booklet 2013

Page 134 of 137
Appendix 4: NERSA interventions in tariff composition
Information on Residential Tariff:
In the continued effort to protect the poor against high price increases, NERSA has reduced the
electricity tariff for low consumption residential customers on inclining block tariffs (IBT).
(Homelight 20A and 60A).
The following decisions were made with regard to Eskom’s Residential Tariff structure:
a) Homelight 20A will change from a four block IBT structure to two blocks.
Block 1: 0-350 kWh and block 2 > 350 kWh.
b) Homelight 60A will change from a four block IBT structure to two blocks.
Block 1: 0-600 kWh and block 2 > 600 kWh.
c) Homepower tariffs will change from four block IBT structure to a tariff with a fixed network
charge and energy recovered through two blocks.
Block 1 0-600 kWh and block 2 > 600 kWh.
d) Revision of the Homepower Bulk structure.
In addition, Nersa has approved the following:
e) Transparent calculation of subsidies against costs.
f) Unbundling of the low voltage subsidy for the Large Power User (LPU) tariffs
g) Unbundling of the affordability subsidy for the LPU urban tariffs
h) Unbundling of the reliability service charge previously included in the energy charges. This
impacts all tariffs except for residential and public lighting.
i) The submission of use-of-system charges for Distribution and Transmission connected
generators and loads, on which the tariff charges are determined.
j) All energy rates, except for residential and public lighting recalculated determined on a
purchase price 1:8 Time of Use (TOU) ratio.
k) Embedding of the environmental levy in the energy rates for all tariffs.
Local authority tariff increase
With reference to the latest tariff book please note the following;

Page 135 of 137
The local authority increases comprise 2 sets of rates. One set applicable for July 2012
to June 2013 at the 2012/13 rates and another set that is the proposed 2013/14 tariffs
from 1 July 2013.
Therefore the average price increases for Apr to June reflect a comparison of 2012/13
rates to the 2011/12 rates.
The July to March average price comparison reflects the submitted rates for 2013/14
compares to 2012/13 for only the 9 months
All municipalities will see for the 2013/14 Eskom financial year (1 April 2013 - 30 March
2014) an average increase of 7.3%. This compromises rates from 1 April 2013 - 30June
2013 at the current rates which includes the previous year’s 16% increase.
The average increase applicable on 1 July to municipality tariffs will be 6.1% - from 1
July 2013 to 30 June 2014. This is the average increase that municipalities will see 1
July.
Non-local authority tariff increase
With reference to the latest tariff book note the following; the urban non-local authority tariffs see
a slightly higher increase than the average increase due to the lower increases to the residential
tariffs, now covered by the affordability subsidy.
Residential tariffs' impact
With reference to Table 1 note the following:
Homelight 20A sees an overall average price reduction after the price increase. This
was due to the average price including revenues from consumption of the higher block
rates, while the price for block 1 was based on the average customer and not the
average price of all customers on Homelight 20A.
Homelight 60A sees a lower than average increase. This was due to the average price
including revenues from consumption of the higher block rates, while the price for block 1
was based on the average customer and not the average price of all customers on
Homelight 20A.
All of Homepower rates were calculated to ensure that the average price increase at the
average consumption equalled the average increase of 8%. It is to be noted, however,
that Homepower 4 high block rate was made equal to the Homelight 60A > 600 kWh rate
to ensure that the two tariffs at higher consumption levels have similar average prices.
This has meant the average impact for Homepower 4 is 6% and not 8%. Homelight 60A,
however, remains cheaper than Homepower 4.

Page 136 of 137
Appendix 5: Employment in the aluminium value chain
Direct
employment
Indirect
employment Source
Upstream
Primary
Hillside and Bayside
3000
(including
contractors) 4000
BHP Presentation to National
Assembly Portfolio Committee on
Trade and Industry, Dr Mkhwanazi,
April 2013, slide 19
Mozal 98
1089 employed, 91% Mozambican
nationals, BHP Billiton presentation,
‘WELCOME TO MOZAL, Together,
we make a difference’, accessed from
BHP Billiton website, slide 34
Secondary and recyclers/merchants
Zimalco 150
Others 150
Phele et al (2005), Secondary
Smelters 4 major companies 300
employees
Aluminium scrap industry 8800
Conningarth Economists, Final
Technical Report, 13 February 2013.
This includes collectors and
recyclers.
Intermediate/midstream
Aluminium foundry industry 1700
250- Autocast
380- Borbet
Hayes Lemmerz and others
breakdown unknown
Fabricators and semi fabricators
Hulamin 2100
Hulamin
Wispeco 1000
Wispeco
Others Unknown
TOTAL ALUMINIUM INDUSTRY 15000 14000
AFSA provided the total industry
estimate, note that this is not the sum
of the individual levels of the value
chain (which amounts to around
17,000)
Complied by TIPS

Page 137 of 137
Appendix 6: List of energy saving and renewable energy initiatives undertaken by
companies in mining and related manufacturing industries (not exhaustive)
Examples of energy effiency initiatives Renwable energy initiatives
Kumba iron ore Solar water heating, lighting and heating, ventilation and air conditioning RE project in Northern Cape
High efficiency motors Aims to take part in the third round of Eskom’s REIPPP
Process optimisation and automation
Diesel management (operational efficiency, drilling and blasting, mine
design and payload)
Conveyor optimisation (variable speed drives)
Compressed air (leak detection and variable speed drives)
Pumping optimisation
Energy recovery (Cogeneration)
Metering/Monitoring
Energy efficient plan design
Changes to the standard fine ore dense medium separation (DMS) flow
lines at Thabazimbi mine as well as replacement of haul trucks
Replacement if dust extraction systems with a dust suppression system
which uses smaller motors
Diesel energy efficiency management system (DEEMS) used to track diesel
performance and to log and track interventions
Evraz Highveld Mapochs iron ore Reduction of electricity use in iron making (through iron ore re sizing)
Kiln efficiency improvements
Variable speed drives (conveyor belts); Lighting
Co-generation
AMSA
Lighting, cooling, compressor optimisation with Eskom Demand Side
Management (DSM)
Integrated Demand Management (IDM) and Standard Offer schemes
Power monitor program software
DSM contracts for moving load out of peak for EAFs by switching out or fuel
switching
ISO 50001 principles as well as process optimisations, across the whole
production process
Co-generation
Jubilee and Northam Platinum
ConRoast (reduces energy in smelting stage- still to be piloted; developed
by Mintek) Northam: Hydropowered equipment
Implats New energy efficient shafts;heat pumps;optimise air networks Coal-to-biomass fuel-switching project being investigated
Amplats
598 metering points in a system installed in 2010 to monitor energy usage;
Ventilation fan settings
Investigating biomass thermal power plant and Solar
photovoltaic power plants through PPAs with IPPs' micro-
hydropower; fuel cells
Lonmin Optimisation and installation of standalone compressors Wind, bio-fuel or solar projects (not yet implemented)
Anglogold Ashanti
Energy effiecient water heating, lighting, ventillation, air conditioning;
Process optimisation, including use of energy efficient motors; Energy
recovery (co-gen)
Harmony Gold
Photovoltaic electricity generation (plans to build in NW
and FS provinces); Solar photovoltaic power plant in the
Vaal; Biomass generation; Hydropower generation using
deep mine and water gravity to generate energy
Exxaro
Long-term and potentially more sustainable initiatives to energy efficiency-
making energy efficiency a requirement for performance, linked to
remuneration
JV with Cennergi to develop Windfarms near Bedford and
Tsitsikama