regulatory and voluntary mortgage portfolio disclosures€¦ · table 4: securitization and...
TRANSCRIPT


Page Page
Notes to Readers 3 Regulatory and voluntary mortgage portfolio disclosures
Table 13: Mortgage principal outstanding – by property type 16
Highlights Table 14: Mortgage principal outstanding – by interest rate type 17
Table 1: Financial highlights 4 Table 15: Mortgage principal outstanding – by province 18
Table 16: Residential mortgage and HELOC principal outstanding – by province 19
Consolidated results of operations Table 17: Residential mortgage principal outstanding – by remaining amortization 20
Table 2: Interim consolidated statements of income 5 Table 18: Uninsured average loan-to-value of newly originated and newly acquired 21
Table 3: Net interest income 6 Table 19: Average loan-to-value of existing residential mortgages 22
Table 4: Securitization and derecognition activity 7 Table 20: Single Family Lending - weighted average beacon score by LTV 23
Table 5: Non-interest expenses and Efficiency Ratio 8 Table 21: Alberta and Saskatchewan portfolios 24
Financial condition Regulatory Basel III capital disclosures
Table 6: Interim consolidated balance sheets 9 Table 22: Modified Capital Disclosure Template - Equitable Bank 25
Table 7: Average balance sheet information 10 Table 23: Leverage Ratio - Equitable Bank 27
Table 8: Mortgage principal under administration – by lending business 11
Table 9: Mortgage originations - by lending business 12 Table 24: ten-year statistical review 28
Table 10: Deposit principal 13
Non-GAAP measures 29
Credit quality
Table 11: Mortgage credit metrics 14 Acronyms 31
Table 12: Allowance for credit losses continuity 15
FOURTH QUARTER 2017
SUPPLEMENTAL INFORMATION AND REGULATORY DISCLOSURES
Table of Contents

Notes to Readers
Purpose of this documentThis Supplemental Information and Regulatory Disclosure Report (the "Report") aims to provide the readers with the following regulatory disclosures and other additional voluntary disclosures that will assist the readers' assessment of business performance of Equitable Group Inc. (the "Company" or "Equitable").
1. Disclosures related to the Company's mortgage portfolio, some of which relate to disclosure requirements outlined in OSFI's Guideline B -20, 'ResidentialMortgage Underwriting Practices and Procedures', effective for Equitable Bank on January 1, 2013.
2. Equitable Bank (the "Bank")’s regulatory capital Basel Pillar III disclosures.
Use of this documentReaders are cautions that financial information contained in this Report include both Generally Accepted Accounting Principles ("GAAP") and non-GAAP measures. The latter often does not have any standardized meaning, and therefore, are not comparable to similar measures presented by other financial institutions.
This Report should be read in conjunction with the Company's 2017 annual report.
Basis of presentationAll amounts in this Report are Canadian dollars. Quarterly numbers are unaudited.
GAAP measures have been prepared in accordance with International Financial Reporting Standards ("IFRS") unless otherwise stated. Non-GAAP measures used in this Report are defined under the Section "Non-GAAP measures".
Comparative figuresCertain prior period comparative numbers have been reclassified to conform with current period presentation.
3

($ THOUSANDS, EXCEPT SHARE, PER SHARE AMOUNTS
AND PERCENTAGES) Q4 Q3 Q2 Q1 Q4 Q3 Q2 Q1 2017 2016
RESULTS OF OPERATIONS
Net income $ 40,446 $ 37,869 $ 38,909 $ 43,393 $ 41,678 $ 35,230 $ 33,410 $ 28,012 $ 160,617 $ 138,330
Net income available to common shareholders 39,256 36,678 37,718 42,202 40,488 34,039 32,219 26,821 155,854 133,567
Net interest income 79,697 71,964 78,349 78,352 77,926 70,827 67,010 63,594 308,362 279,357
Total revenue 197,648 189,290 183,025 181,525 179,939 169,432 162,861 151,691 751,488 663,923
EPS – basic(5)$ 2.38 $ 2.23 $ 2.29 $ 2.56 $ 2.58 $ 2.19 $ 2.07 $ 1.73 $ 9.46 $ 8.57
EPS – diluted(5)$ 2.36 $ 2.21 $ 2.28 $ 2.54 $ 2.56 $ 2.16 $ 2.05 $ 1.71 $ 9.39 $ 8.49
ROE (1)14.9% 14.4% 15.6% 18.4% 19.3% 17.2% 17.1% 14.7% 15.8% 16.9%
Return on average assets(1)0.8% 0.8% 0.8% 0.9% 0.9% 0.8% 0.8% 0.7% 0.8% 0.8%
NIM – TEB(1)
Total Assets 1.59% 1.47% 1.63% 1.66% 1.70% 1.64% 1.61% 1.62% 1.58% 1.64%
Core Lending 2.33% 2.17% 2.41% 2.55% 2.64% 2.60% 2.55% 2.50% 2.36% 2.57%
Securitization Financing 0.24% 0.25% 0.30% 0.22% 0.24% 0.19% 0.22% 0.31% 0.25% 0.23%
Efficiency Ratio – TEB(1)(2)37.3% 37.4% 39.2% 33.2% 33.9% 37.0% 38.2% 43.2% 36.8% 37.8%
BALANCE SHEET
Total assets 20,634,250 20,221,205 19,795,986 19,300,418 18,973,588 18,062,846 17,147,854 16,411,221
Assets Under Management(1)24,652,969 24,274,172 23,641,546 22,959,080 22,277,769 21,024,401 19,709,617 18,616,018
Mortgages receivable 19,298,548 18,787,348 18,263,623 18,164,958 17,783,803 17,049,744 16,244,106 15,540,241
Mortgages Under Management(1)23,233,420 22,753,938 22,013,453 21,743,431 21,004,013 19,922,211 18,723,056 17,668,821
Shareholders' equity 1,138,117 1,098,325 1,060,852 1,023,702 977,150 879,367 843,924 816,049
Liquid assets(1)1,479,429 1,459,711 1,570,532 1,153,174 1,280,591 1,037,259 1,033,634 939,691
Total assets held for regulatory purposes as a % of total
Equitable Bank assets 6.7% 6.7% 7.5% 5.4% 6.2% 5.1% 5.3% 4.9%
Total liquid assets as a % of total assets 7.2% 7.2% 7.9% 6.0% 6.7% 5.7% 6.0% 5.7%
Deposit principal 11,024,720 10,506,896 10,006,735 9,949,511 9,680,163 9,180,647 9,048,465 8,732,113
CREDIT QUALITY
Provision for credit losses 387 40 378 738 870 1,243 105 227 1,543 2,445
Provision for credit losses − rate (1)0.01% 0.001% 0.01% 0.02% 0.02% 0.03% 0.003% 0.01% 0.01% 0.02%
Net impaired mortgages as a % of total mortgage assets(3)0.12% 0.13% 0.16% 0.21% 0.21% 0.19% 0.20% 0.22%
Allowance for credit losses as a % of total mortgage assets 0.17% 0.18% 0.19% 0.19% 0.19% 0.20% 0.20% 0.21%
SHARE CAPITAL
Common shares outstanding 16,503,437 16,479,034 16,477,654 16,475,149 16,460,142 15,599,657 15,566,465 15,551,865
Book value per common share(1)$ 64.57 $ 62.25 $ 59.98 $ 57.73 $ 54.96 $ 51.72 $ 49.55 $ 47.81
Common share price – close $ 71.50 $ 56.00 $ 59.48 $ 69.37 $ 60.46 $ 58.86 $ 55.99 $ 50.76
Common share market capitalization 1,179,996 922,826 980,091 1,142,881 995,180 918,196 871,566 789,413
Dividends declared per:(6)
Common share $ 0.25 $ 0.24 $ 0.23 $ 0.23 $ 0.22 $ 0.21 $ 0.21 $ 0.20 $ 0.95 $ 0.84
Preferred share – Series 3 $ 0.40 $ 0.40 $ 0.40 $ 0.40 $ 0.40 $ 0.40 $ 0.40 $ 0.40 $ 1.59 $ 1.59
EQUITABLE BANK CAPITAL RATIOS(1)
Risk-weighted assets ("RWA")(1)(4)7,035,380 6,814,247 6,561,813 6,739,517 6,385,825 5,968,000 5,664,575 5,433,025
CET1 Ratio 14.8% 14.8% 14.8% 13.9% 14.0% 13.4% 13.5% 13.5%
Tier 1 Capital Ratio 15.9% 15.8% 15.9% 15.0% 15.1% 14.6% 14.8% 14.9%
Total Capital Ratio 16.3% 17.2% 17.4% 16.4% 16.6% 16.2% 16.5% 16.7%
Leverage Ratio 5.4% 5.3% 5.3% 5.3% 5.1% 4.9% 5.0% 5.0%
(1) See Non-GAAP Measures section.(2) Increases in this ratio reflect reduced efficiencies, whereas decreases reflect improved efficiencies.(3) Net impaired mortgages do not include insured mortgages that are less than 365 days in arrears and reflect gross impaired mortgage assets less individual allowances.(4) The RWA in this table is measured on "all-in" basis in accordance with OSFI's CAR Guideline.(5) YTD EPS may not euqal the sum of the quarterly EPS' as a result of rounding.(6) YTD dividends declared per share may not euqal the sum of the quarterly dividends per share as a result of rounding.
YTD
Table 1: Financial highlights
20162017
4

2017 2016
Mortgages – Core Lending $ 139,630 $ 129,372 $ 125,670 $ 121,892 $ 120,714 $ 114,416 $ 107,544 $ 101,419 $ 516,564 $ 444,093
Mortgages – Securitization Financing 44,849 43,368 44,957 45,155 46,159 44,776 45,296 43,607 178,329 179,838
Investments 939 65 1,370 2,128 2,431 2,142 2,372 1,876 4,502 8,821
Other 3,728 4,296 1,715 1,328 1,347 1,087 1,227 1,052 11,067 4,713
189,146 177,101 173,712 170,503 170,651 162,421 156,439 147,954 710,462 637,465
Deposits 56,255 53,025 48,919 46,695 46,393 47,204 46,084 43,659 204,894 183,340
Securitization liabilities 44,961 43,647 42,379 43,933 43,932 41,489 41,354 39,185 174,920 165,960
Bank facilities 6,970 6,536 2,217 274 1,224 1,926 1,040 566 15,997 4,756
Debentures 229 950 950 950 950 950 950 950 3,079 3,800
Other 1,034 979 898 299 226 25 1 - 3,210 252
109,449 105,137 95,363 92,151 92,725 91,594 89,429 84,360 402,100 358,108
79,697 71,964 78,349 78,352 77,926 70,827 67,010 63,594 308,362 279,357
387 40 378 738 870 1,243 105 227 1,543 2,445
79,310 71,924 77,971 77,614 77,056 69,584 66,905 63,367 306,819 276,912
Fees and other income 6,153 7,492 6,853 7,804 6,809 3,873 3,781 3,177 28,302 17,640
Net (losss) gain on investments - (100) (788) - (557) (44) 747 - (888) 146
Gains on securitization activities and income from
securitization retained interests 2,349 4,797 3,248 3,218 3,036 3,182 1,894 560 13,612 8,672
8,502 12,189 9,313 11,022 9,288 7,011 6,422 3,737 41,026 26,458
87,812 84,113 87,284 88,636 86,344 76,595 73,327 67,104 347,845 303,370
Compensation and benefits 15,821 16,495 16,467 16,423 14,863 15,574 15,193 14,650 65,206 60,280
Other 17,252 15,147 18,028 13,397 14,887 13,465 13,179 14,728 63,824 56,259
33,073 31,642 34,495 29,820 29,750 29,039 28,372 29,378 129,030 116,539
54,739 52,471 52,789 58,816 56,594 47,556 44,955 37,726 218,815 186,831
Current 10,360 15,773 7,896 16,191 13,426 8,227 7,875 8,419 50,220 37,947
Deferred 3,933 (1,171) 5,984 (768) 1,490 4,099 3,670 1,295 7,978 10,554
14,293 14,602 13,880 15,423 14,916 12,326 11,545 9,714 58,198 48,501
$ 40,446 $ 37,869 $ 38,909 $ 43,393 $ 41,678 $ 35,230 $ 33,410 $ 28,012 $ 160,617 $ 138,330
Dividends on preferred shares 1,190 1,191 1,191 1,191 1,190 1,191 1,191 1,191 4,763 4,763
Net income available to common shareholders $ 39,256 $ 36,678 $ 37,718 $ 42,202 $ 40,488 $ 34,039 $ 32,219 $ 26,821 $ 155,854 $ 133,567
Common shares outstanding:
Weighted average dilutedWeighted average basic 16,486,677 16,478,314 16,477,456 16,464,170 15,692,833 15,570,678 15,556,836 15,543,952 16,476,721 15,591,297
Weighted average diluted 16,625,927 16,570,256 16,567,699 16,614,221 15,808,124 15,722,532 15,709,456 15,674,734 16,594,492 15,728,988
Basic $ 2.38 $ 2.23 $ 2.29 $ 2.56 $ 2.58 $ 2.19 $ 2.07 $ 1.73 $ 9.46 $ 8.57
Diluted $ 2.36 $ 2.21 $ 2.28 $ 2.54 $ 2.56 $ 2.16 $ 2.05 $ 1.71 $ 9.39 $ 8.49
YTD
Earnings per share:
Interest expense:
Net interest income
Provision for credit losses
Net interest income after provision for credit losses
Other income:
Net interest and other income
Income before income taxes
Income taxes:
Net income
20162017
Q3
Table 2: Interim consolidated statements of income
Non-interest expenses:
Q3 Q2 Q1Q4($ THOUSANDS, EXCEPT SHARE AND PER SHARE AMOUNTS) Q1
Interest income:
Q4 Q2
5

2017 2016
Average Average Revenue/ Average Average Average Average Average Average Average Average
($ THOUSANDS, EXCEPT PERCENTAGES) rate(1) rate(1)Expense rate(1) rate(1) rate(1) rate(1) rate(1) rate(1) rate(1) rate(1)
Core Lending:
Revenues derived from:
Mortgages $ 139,630 4.62% $ 129,372 4.47% $ 125,670 4.46% $ 121,892 4.55% $ 120,714 4.63% $ 114,416 4.65% $ 107,544 4.65% $ 101,419 4.60% $ 516,564 4.52% $ 444,093 4.63%
Liquidity investments 2,322 1.05% 2,089 0.93% 1,397 0.74% 1,604 0.84% 1,611 0.84% 1,428 1.01% 1,573 0.97% 1,161 0.85% 7,412 0.90% 5,773 0.92%
Equity securities − TEB(2) 1,300 5.39% 1,402 5.92% 1,430 5.86% 1,828 6.43% 2,197 7.55% 2,040 6.67% 2,520 7.72% 2,159 6.70% 5,959 5.92% 8,916 7.16%
143,252 4.38% 132,863 4.23% 128,497 4.24% 125,324 4.32% 124,522 4.40% 117,884 4.48% 111,637 4.45% 104,739 4.41% 529,935 4.29% 458,782 4.44%
Expenses related to:
Deposits and bank facilities 53,471 2.07% 50,516 2.06% 46,246 1.98% 43,101 1.98% 43,195 1.98% 44,290 2.09% 42,944 2.13% 41,080 2.15% 193,333 2.02% 171,521 2.08%
Secured backstop funding facility(3)5,336 N/A 5,425 N/A 1,378 N/A - -% - -% - -% - -% - -% 12,139 N/A - -%
Debentures 229 7.22% 950 - 950 5.86% 950 5.93% 950 5.80% 950 5.81% 950 5.88% 950 5.88% 3,079 5.93% 3,800 5.85%
Securitization liabilities 8,449 2.00% 8,089 1.86% 6,604 1.65% 6,616 1.59% 6,025 1.55% 4,485 1.60% 3,643 1.50% 3,306 1.53% 29,759 1.78% 17,471 1.55%
67,485 2.24% 64,980 2.24% 55,178 2.00% 50,667 1.94% 50,170 1.94% 49,725 2.06% 47,537 2.09% 45,336 2.11% 238,310 2.11% 192,792 2.05%
Net interest income − TEB(2) 75,767 2.33% 67,883 2.17% 73,319 2.41% 74,657 2.55% 74,352 2.64% 68,159 2.60% 64,100 2.55% 59,403 2.50% 291,625 2.36% 265,990 2.57%
Taxable Equivalent Basis − adjustment (2) (360) (402) (397) (485) (617) (569) (838) (624) (1,643) (2,648)
Core Lending $ 75,407 $ 67,481 $ 72,922 $ 74,172 $ 73,735 $ 67,590 $ 63,262 $ 58,779 $ 289,982 $ 263,342
Securitization Financing:
Revenues derived from:
Mortgages $ 44,849 2.60% $ 43,368 2.54% $ 44,957 2.60% $ 45,155 2.54% $ 46,159 2.65% $ 44,776 2.61% $ 45,296 2.73% $ 43,607 2.81% $ 178,329 2.57% $ 179,838 2.70%
Liquidity investments 1,405 1.88% 1,272 1.42% 655 0.95% 509 1.19% 587 1.08% 330 1.03% 344 0.89% 232 1.01% 3,841 1.40% 1,493 1.01%
46,254 2.57% 44,640 2.48% 45,612 2.54% 45,664 2.51% 46,746 2.61% 45,106 2.59% 45,640 2.68% 43,839 2.79% 182,170 2.52% 181,331 2.66%
Expenses related to:
Securitization liabilities 36,512 2.46% 35,558 2.36% 35,775 2.36% 37,317 2.43% 37,907 2.51% 37,004 2.54% 37,711 2.60% 35,879 2.62% 145,161 2.40% 148,489 2.57%
Deposits and secured funding facility 5,452 2.03% 4,599 1.85% 4,410 1.76% 4,167 1.62% 4,648 1.70% 4,865 1.70% 4,181 1.79% 3,145 1.64% 18,629 1.82% 16,827 1.71%
41,964 2.39% 40,157 2.29% 40,185 2.27% 41,484 2.31% 42,555 2.39% 41,869 2.40% 41,892 2.49% 39,024 2.50% 163,790 2.32% 165,316 2.44%
Securitization Financing $ 4,290 0.24% $ 4,483 0.25% $ 5,427 0.30% $ 4,180 0.22% $ 4,191 0.24% $ 3,237 0.19% $ 3,748 0.22% $ 4,815 0.31% $ 18,380 0.25% $ 16,015 0.23%
Total interest earning asset − TEB (2) $ 80,057 1.59% $ 72,366 1.47% $ 78,746 1.63% $ 78,837 1.66% $ 78,543 1.70% $ 71,396 1.64% $ 67,848 1.61% $ 64,218 1.62% $ 310,005 1.58% $ 282,005 1.64%
Net interest income $ 79,697 $ 71,964 $ 78,349 $ 78,352 $ 77,926 $ 70,827 $ 67,010 $ 63,594 $ 308,362 $ 279,357
(1) Average rates are calculated based on the daily average balances outstanding during the period.
(2) See Non-GAAP Measures section.
(3) Since its establishment in June 2017, there have been no draws on the $2 billion secured backstop funding facility.
YTD
Revenue/ Revenue/
Expense Expense
Table 3: Net interest income
Q1
Revenue/
Q2
Revenue/Revenue/
Q1 Q4 Q3
Revenue/ Revenue/ Revenue/
Q4
2017
Q2Q3
2016
Expense ExpenseExpenseExpense Expense Expense
Revenue/
Expense
6

Table 4: Securitization and derecognition activity
($ THOUSANDS, EXCEPT PERCENTAGES) 2017 2016
Securitization derecognized - non-prepayable Multis $ 192,703 $ 276,902 $ 273,070 $ 242,542 $ 172,778 $ 130,656 $ 125,432 $ 151,544 $ 985,217 $ 580,410
Securitization derecognized - prepayable mortgages(1)- - - 149,049 198,364 296,626 253,087 - 149,049 748,077
Total principal derecognized $ 192,703 $ 276,902 $ 273,070 $ 391,591 $ 371,142 $ 427,282 $ 378,519 $ 151,544 $ 1,134,266 $ 1,328,487
Gains on sale $ 1,842 $ 2,504 $ 2,717 $ 3,570 $ 2,117 $ 2,505 $ 1,894 $ 1,619 $ 10,633 $ 8,135
Income from securitization activities and retained interests:
Income from retained interests 998 800 495 391 330 238 154 178 2,684 900
Fair value (losses) gains on derivative financial instruments (491) 1,493 36 (743) 589 439 (154) (1,237) 295 (363)
507 2,293 531 (352) 919 677 - (1,059) 2,979 537Gains on securitization activities and income from
securitization retained interests $ 2,349 $ 4,797 $ 3,248 $ 3,218 $ 3,036 $ 3,182 $ 1,894 $ 560 $ 13,612 $ 8,672
Gains on sale margin(2)0.96% 0.90% 0.99% 0.91% 0.57% 0.59% 0.50% 1.07% 0.94% 0.61%
(1) In order to derecognize prepayable mortgages, Equitable needs to securitize the mortgages through CMHC’s CMB or NHA-MBS programs and also then engage in a transaction that transfers the residual risks and rewards to third parties.
This additional transaction is not required to derecognize non-prepayable mortgages.(2) Gains on sale margin represents the gains on sale as a percentage of total principal derecognized.
YTD20162017
Q1Q4 Q1 Q4 Q3 Q2Q2Q3
7

($ THOUSANDS, EXCEPT PERCENTAGES AND FTE) 2017 2016
Compensation and benefits $ 15,821 $ 16,495 $ 16,467 $ 16,423 $ 14,863 $ 15,574 $ 15,193 $ 14,650 $ 65,206 $ 60,280
Technology and system costs 5,490 4,974 5,764 4,809 5,198 4,929 5,046 4,413 21,037 19,586
Regulatory, legal and professional fees 3,538 2,950 2,580 1,974 2,259 2,287 1,881 1,451 11,042 7,878
Marketing and corporate expenses 3,501 2,527 5,178 1,922 3,058 1,946 2,298 4,608 13,128 11,910
Product costs 3,110 3,128 3,020 3,028 2,968 2,808 2,425 2,533 12,286 10,734
Premises 1,613 1,568 1,486 1,664 1,404 1,495 1,529 1,723 6,331 6,151
Total non-interest expenses $ 33,073 $ 31,642 $ 34,495 $ 29,820 $ 29,750 $ 29,039 $ 28,372 $ 29,378 $ 129,030 $ 116,539
Efficiency Ratio − TEB 37.3% 37.4% 39.2% 33.2% 33.9% 37.0% 38.2% 43.2% 36.8% 37.8%
Full-time employee ("FTE") − period average 586 573 569 565 552 542 528 507 573 531
YTD
Q1
2016
Table 5: Non-interest expenses and Efficiency Ratio
Q4 Q3 Q2Q1Q4
2017
Q2Q3
8

($ THOUSANDS)
Assets
Cash and cash equivalents $ 660,930 $ 724,314 $ 811,465 $ 537,645 $ 444,179 $ 383,788 $ 336,237 $ 427,800
Restricted cash 366,038 397,365 412,036 258,599 247,878 238,945 150,691 129,453
Securities purchased under reverse repurchase agreements - - - 4,984 199,401 102,760 150,906 30,346
Investments 107,442 112,255 112,658 170,176 136,718 124,485 130,770 154,397
Mortgages receivable – Core Lending 12,304,741 11,921,274 11,393,045 11,212,879 10,678,452 10,199,787 9,591,449 9,061,191
Mortgages receivable – Securitization Financing 6,993,807 6,866,074 6,870,578 6,952,079 7,105,351 6,849,957 6,652,657 6,479,050
Securitization retained interests 104,429 102,715 98,513 93,975 88,782 87,262 74,563 66,665
Other assets 96,863 97,208 97,691 70,081 72,827 75,862 60,581 62,319
$ 20,634,250 $ 20,221,205 $ 19,795,986 $ 19,300,418 $ 18,973,588 $ 18,062,846 $ 17,147,854 $ 16,411,221
Liabilities and Shareholders' Equity
Liabilities:
Deposits $ 11,114,313 $ 10,594,205 $ 10,099,459 $ 10,047,387 $ 9,763,082 $ 9,268,606 $ 9,148,025 $ 8,845,184
Securitization liabilities 7,565,545 7,730,776 7,750,405 7,793,863 7,762,632 7,258,672 6,807,964 6,576,177
Obligations under repurchase agreements 452,001 316,087 428,985 145,495 112,488 69,290 - -
Deferred tax liabilities 35,802 31,869 43,988 38,004 38,771 37,763 33,663 29,993
Other liabilities 199,601 191,289 205,482 186,967 204,465 85,239 79,278 78,818
Bank facilities 128,871 193,654 141,815 - 50,000 398,909 170,000 -
Debentures - 65,000 65,000 65,000 65,000 65,000 65,000 65,000
19,496,133 19,122,880 18,735,134 18,276,716 17,996,438 17,183,479 16,303,930 15,595,172
Shareholders' equity:
Preferred shares 72,557 72,557 72,557 72,557 72,557 72,557 72,557 72,557
Common shares 198,660 197,488 197,439 197,339 196,608 145,694 144,615 144,159
Contributed surplus 6,012 5,870 5,594 5,322 5,056 5,114 5,099 4,935
Retained earnings 866,109 830,976 798,253 764,325 725,912 688,867 658,098 629,147
Accumulated other comprehensive loss (5,221) (8,566) (12,991) (15,841) (22,983) (32,865) (36,445) (34,749)
1,138,117 1,098,325 1,060,852 1,023,702 977,150 879,367 843,924 816,049
$ 20,634,250 $ 20,221,205 $ 19,795,986 $ 19,300,418 $ 18,973,588 $ 18,062,846 $ 17,147,854 $ 16,411,221
Table 6: Interim consolidated balance sheets
Q3Q1 Q4 Q2 Q1Q4
20162017
Q2Q3
9
($ THOUSANDS) Q4 Q3 Q2 Q1 Q4 Q3 Q2 Q1
Assets
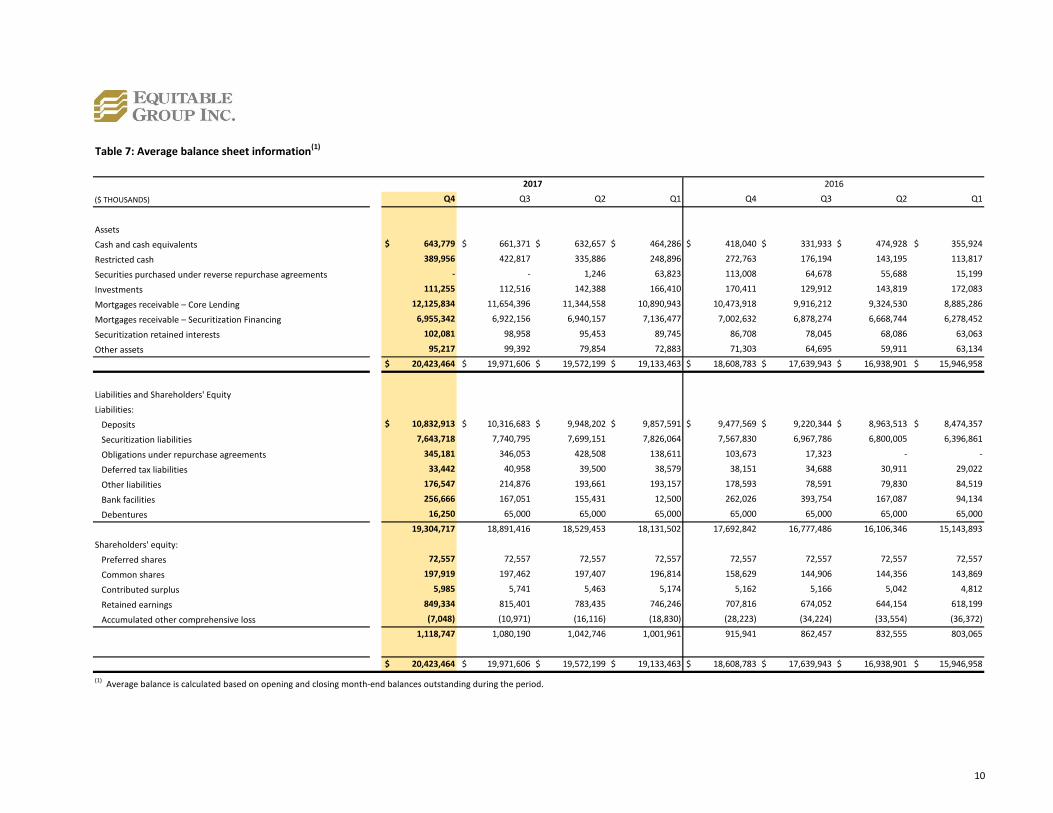
Cash and cash equivalents $ 643,779 $ 661,371 $ 632,657 $ 464,286 $ 418,040 $ 331,933 $ 474,928 $ 355,924
Restricted cash 389,956 422,817 335,886 248,896 272,763 176,194 143,195 113,817
Securities purchased under reverse repurchase agreements - - 1,246 63,823 113,008 64,678 55,688 15,199
Investments 111,255 112,516 142,388 166,410 170,411 129,912 143,819 172,083
Mortgages receivable – Core Lending 12,125,834 11,654,396 11,344,558 10,890,943 10,473,918 9,916,212 9,324,530 8,885,286
Mortgages receivable – Securitization Financing 6,955,342 6,922,156 6,940,157 7,136,477 7,002,632 6,878,274 6,668,744 6,278,452
Securitization retained interests 102,081 98,958 95,453 89,745 86,708 78,045 68,086 63,063
Other assets 95,217 99,392 79,854 72,883 71,303 64,695 59,911 63,134
$ 20,423,464 $ 19,971,606 $ 19,572,199 $ 19,133,463 $ 18,608,783 $ 17,639,943 $ 16,938,901 $ 15,946,958
Liabilities and Shareholders' Equity
Liabilities:
Deposits $ 10,832,913 $ 10,316,683 $ 9,948,202 $ 9,857,591 $ 9,477,569 $ 9,220,344 $ 8,963,513 $ 8,474,357
Securitization liabilities 7,643,718 7,740,795 7,699,151 7,826,064 7,567,830 6,967,786 6,800,005 6,396,861
Obligations under repurchase agreements 345,181 346,053 428,508 138,611 103,673 17,323 - -
Deferred tax liabilities 33,442 40,958 39,500 38,579 38,151 34,688 30,911 29,022
Other liabilities 176,547 214,876 193,661 193,157 178,593 78,591 79,830 84,519
Bank facilities 256,666 167,051 155,431 12,500 262,026 393,754 167,087 94,134
Debentures 16,250 65,000 65,000 65,000 65,000 65,000 65,000 65,000
19,304,717 18,891,416 18,529,453 18,131,502 17,692,842 16,777,486 16,106,346 15,143,893
Shareholders' equity:
Preferred shares 72,557 72,557 72,557 72,557 72,557 72,557 72,557 72,557
Common shares 197,919 197,462 197,407 196,814 158,629 144,906 144,356 143,869
Contributed surplus 5,985 5,741 5,463 5,174 5,162 5,166 5,042 4,812
Retained earnings 849,334 815,401 783,435 746,246 707,816 674,052 644,154 618,199
Accumulated other comprehensive loss (7,048) (10,971) (16,116) (18,830) (28,223) (34,224) (33,554) (36,372)
1,118,747 1,080,190 1,042,746 1,001,961 915,941 862,457 832,555 803,065
$ 20,423,464 $ 19,971,606 $ 19,572,199 $ 19,133,463 $ 18,608,783 $ 17,639,943 $ 16,938,901 $ 15,946,958
(1) Average balance is calculated based on opening and closing month-end balances outstanding during the period.
Table 7: Average balance sheet information(1)
20162017
10

Table 8: Mortgage principal under administration – by lending business
($ THOUSANDS)
Single Family Lending $ 9,341,819 $ 9,054,784 $ 8,541,004 $ 8,208,733 $ 7,855,706 $ 7,540,069 $ 7,155,246 $ 6,751,013
Commercial Lending 2,949,745 2,853,236 2,835,293 3,007,474 2,827,006 2,657,201 2,437,546 2,313,337
Total Core Lending 12,291,564 11,908,020 11,376,297 11,216,207 10,682,712 10,197,270 9,592,792 9,064,350
Multi-unit residential 3,054,406 2,887,769 2,877,556 2,976,847 3,179,312 3,493,318 3,726,566 4,013,890
Prime single family residential 3,868,731 3,905,182 3,914,040 3,891,715 3,837,808 3,270,068 2,841,935 2,385,784
Total Securitization Financing 6,923,137 6,792,951 6,791,596 6,868,562 7,017,120 6,763,386 6,568,501 6,399,674
Total on-balance sheet mortgage principal 19,214,701 18,700,971 18,167,893 18,084,769 17,699,832 16,960,656 16,161,293 15,464,024
Multi-unit residential 4,018,719 4,029,569 3,794,042 3,579,558 3,215,236 2,868,655 2,462,533 2,100,591
Prime single family residential - 23,398 51,518 79,104 88,945 92,900 99,230 104,206
Total derecognized mortgage principal 4,018,719 4,052,967 3,845,560 3,658,662 3,304,181 2,961,555 2,561,763 2,204,797
Mortgages Under Management $ 23,233,420 $ 22,753,938 $ 22,013,453 $ 21,743,431 $ 21,004,013 $ 19,922,211 $ 18,723,056 $ 17,668,821
Single Family Lending $ 9,341,819 $ 9,054,784 $ 8,541,004 $ 8,208,733 $ 7,855,706 $ 7,540,069 $ 7,155,246 $ 6,751,013
Prime single family residential 3,868,731 3,928,580 3,965,558 3,970,819 3,926,753 3,362,968 2,941,165 2,489,990
Commercial Lending 2,949,745 2,853,236 2,835,293 3,007,474 2,827,006 2,657,201 2,437,546 2,313,337
Multi-unit residential 7,073,125 6,917,338 6,671,598 6,556,405 6,394,548 6,361,973 6,189,099 6,114,481
Mortgages Under Management $ 23,233,420 $ 22,753,938 $ 22,013,453 $ 21,743,431 $ 21,004,013 $ 19,922,211 $ 18,723,056 $ 17,668,821
20162017
Q1Q3Q4 Q1 Q4 Q2Q2Q3
11

Table 9: Mortgage originations - by lending business
($ THOUSANDS) 2017 2016
Single Family Lending $ 850,617 $ 1,098,725 $ 938,591 $ 835,780 $ 930,449 $ 1,050,366 $ 952,937 $ 674,417 $ 3,723,713 $ 3,608,169
Commercial Lending 359,479 380,442 201,789 379,996 377,578 367,197 323,061 201,849 1,321,706 1,269,685
Total Core Lending 1,210,096 1,479,167 1,140,380 1,215,776 1,308,027 1,417,563 1,275,998 876,266 5,045,419 4,877,854
Multi-unit residential 386,794 359,422 343,363 287,360 219,653 243,754 245,677 248,773 1,376,939 957,857
Prime single family residential 70,908 133,483 143,258 121,904 651,738 495,598 499,732 444,354 469,553 2,091,422
Total Securitization Financing 457,702 492,905 486,621 409,264 871,391 739,352 745,409 693,127 1,846,492 3,049,279
Total mortgage originations $ 1,667,798 $ 1,972,072 $ 1,627,001 $ 1,625,040 $ 2,179,418 $ 2,156,915 $ 2,021,407 $ 1,569,393 $ 6,891,911 $ 7,927,133
YTD20162017
Q1Q4 Q3Q1 Q4 Q2Q2Q3
12

Table 10: Deposit principal
($ THOUSANDS)
Brokered term deposits (GICs) $ 8,291,682 $ 7,824,106 $ 7,713,588 $ 7,396,728 $ 7,275,675 $ 6,821,166 $ 6,742,096 $ 6,606,137
Brokered HISAs 955,456 949,116 837,246 1,183,324 1,192,046 1,197,125 1,075,208 1,096,641
EQ Bank Savings Plus Accounts 1,627,582 1,583,674 1,305,901 1,219,448 1,062,279 1,012,010 995,645 793,633
Deposit notes 150,000 150,000 150,000 150,011 150,163 150,346 235,516 235,702
Total deposit principal $ 11,024,720 $ 10,506,896 $ 10,006,735 $ 9,949,511 $ 9,680,163 $ 9,180,647 $ 9,048,465 $ 8,732,113
20162017
Q1Q4 Q1 Q4 Q3 Q2Q2Q3
13
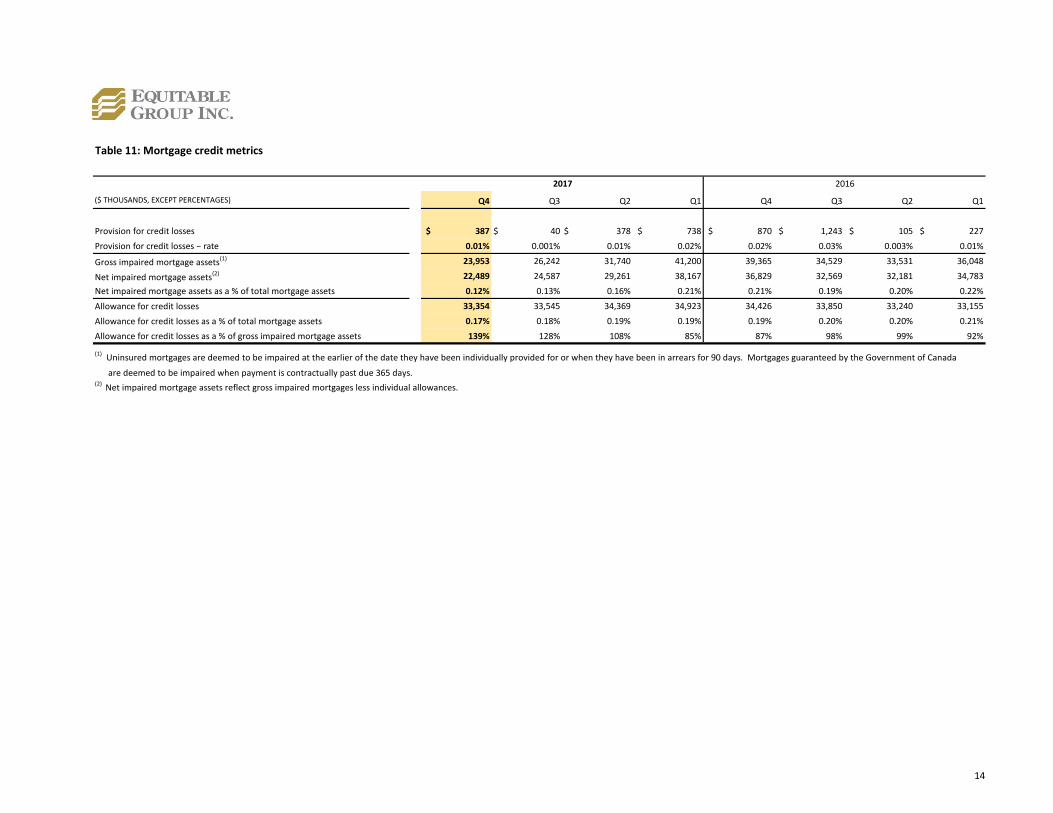
Table 11: Mortgage credit metrics
($ THOUSANDS, EXCEPT PERCENTAGES)
Provision for credit losses $ 387 $ 40 $ 378 $ 738 $ 870 $ 1,243 $ 105 $ 227
Provision for credit losses − rate 0.01% 0.001% 0.01% 0.02% 0.02% 0.03% 0.003% 0.01%
Gross impaired mortgage assets(1) 23,953 26,242 31,740 41,200 39,365 34,529 33,531 36,048
Net impaired mortgage assets(2) 22,489 24,587 29,261 38,167 36,829 32,569 32,181 34,783
Net impaired mortgage assets as a % of total mortgage assets 0.12% 0.13% 0.16% 0.21% 0.21% 0.19% 0.20% 0.22%
Allowance for credit losses 33,354 33,545 34,369 34,923 34,426 33,850 33,240 33,155
Allowance for credit losses as a % of total mortgage assets 0.17% 0.18% 0.19% 0.19% 0.19% 0.20% 0.20% 0.21%
Allowance for credit losses as a % of gross impaired mortgage assets 139% 128% 108% 85% 87% 98% 99% 92%
(1) Uninsured mortgages are deemed to be impaired at the earlier of the date they have been individually provided for or when they have been in arrears for 90 days. Mortgages guaranteed by the Government of Canada
are deemed to be impaired when payment is contractually past due 365 days.(2) Net impaired mortgage assets reflect gross impaired mortgages less individual allowances.
20162017
Q1Q4 Q4Q1 Q3 Q2Q2Q3
14
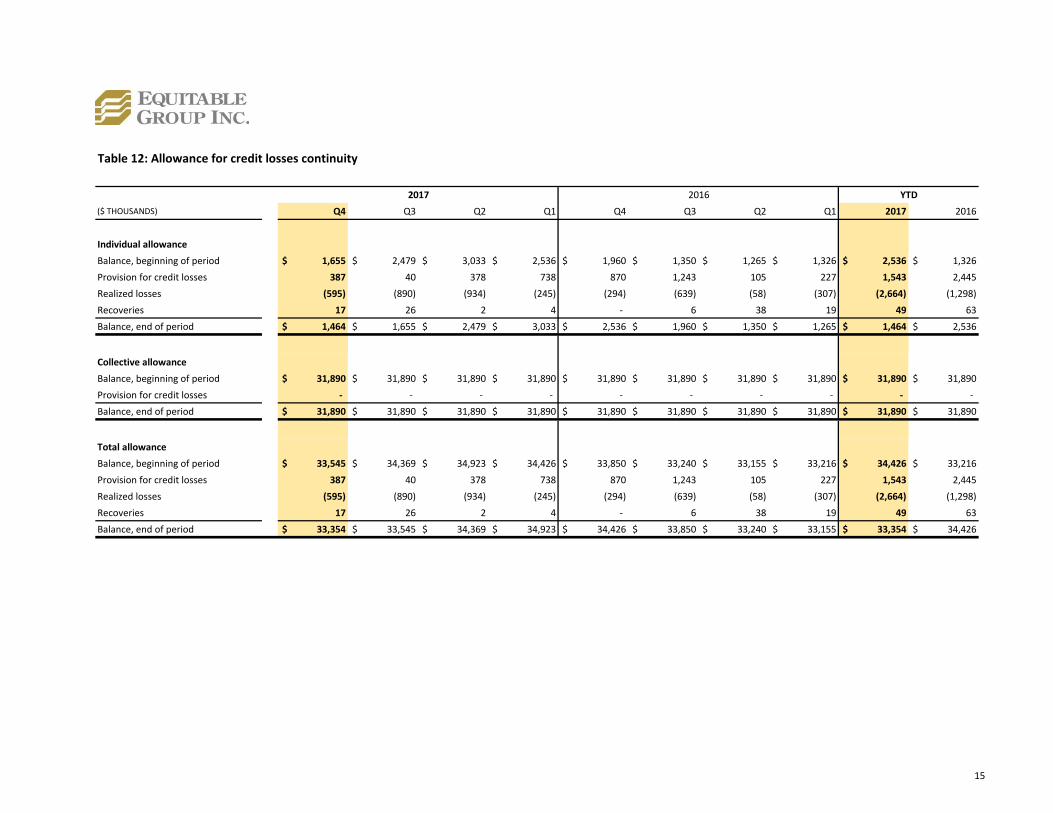
Table 12: Allowance for credit losses continuity
($ THOUSANDS) 2017 2016
Individual allowance
Balance, beginning of period $ 1,655 $ 2,479 $ 3,033 $ 2,536 $ 1,960 $ 1,350 $ 1,265 $ 1,326 $ 2,536 $ 1,326
Provision for credit losses 387 40 378 738 870 1,243 105 227 1,543 2,445
Realized losses (595) (890) (934) (245) (294) (639) (58) (307) (2,664) (1,298)
Recoveries 17 26 2 4 - 6 38 19 49 63
Balance, end of period $ 1,464 $ 1,655 $ 2,479 $ 3,033 $ 2,536 $ 1,960 $ 1,350 $ 1,265 $ 1,464 $ 2,536
Collective allowance
Balance, beginning of period $ 31,890 $ 31,890 $ 31,890 $ 31,890 $ 31,890 $ 31,890 $ 31,890 $ 31,890 $ 31,890 $ 31,890
Provision for credit losses - - - - - - - - - -
Balance, end of period $ 31,890 $ 31,890 $ 31,890 $ 31,890 $ 31,890 $ 31,890 $ 31,890 $ 31,890 $ 31,890 $ 31,890
Total allowance
Balance, beginning of period $ 33,545 $ 34,369 $ 34,923 $ 34,426 $ 33,850 $ 33,240 $ 33,155 $ 33,216 $ 34,426 $ 33,216
Provision for credit losses 387 40 378 738 870 1,243 105 227 1,543 2,445
Realized losses (595) (890) (934) (245) (294) (639) (58) (307) (2,664) (1,298)
Recoveries 17 26 2 4 - 6 38 19 49 63
Balance, end of period $ 33,354 $ 33,545 $ 34,369 $ 34,923 $ 34,426 $ 33,850 $ 33,240 $ 33,155 $ 33,354 $ 34,426
YTD20162017
Q4 Q2 Q1Q1 Q4 Q3Q2Q3
15

Table 13: Mortgage principal outstanding – by property type
($ THOUSANDS, EXCEPT PERCENTAGES)
Uninsured
Single family dwelling $ 7,802,787 $ 7,472,572 $ 6,818,028 $ 7,272,889 $ 6,859,398 $ 6,518,037 $ 6,490,980 $ 6,019,695
Mixed-use property 392,521 406,708 404,911 379,479 381,162 372,145 363,318 368,175
Multi-unit residential 646,855 624,527 484,391 499,384 531,588 507,894 455,987 506,860
Commercial 1,228,136 1,132,917 1,222,938 1,316,334 1,150,223 1,035,485 976,872 868,590
Construction 656,542 661,198 693,673 780,133 728,225 736,701 636,374 564,747
Mortgage principal – Core Lending 10,726,841 10,297,922 9,623,941 10,248,219 9,650,596 9,170,262 8,923,531 8,328,067
Single family dwelling 6,953 21,068 22,750 12,810 5,011 14,991 43,953 70,133
Mortgage principal – Securitization Financing 6,953 21,068 22,750 12,810 5,011 14,991 43,953 70,133
Total mortgage principal outstanding $ 10,733,794 $ 10,318,990 $ 9,646,691 $ 10,261,029 $ 9,655,607 $ 9,185,253 $ 8,967,484 $ 8,398,200
Total mortgage principal outstanding percentage 56% 55% 53% 57% 55% 54% 55% 54%
Insured
Single family dwelling $ 1,537,107 $ 1,580,351 $ 1,721,111 $ 934,964 $ 995,342 $ 1,020,932 $ 663,161 $ 730,160
Multi-unit residential 5,543 5,543 5,543 5,543 6,053 6,076 6,100 6,123
Commercial 22,073 24,204 25,702 27,481 30,721 - - -
Mortgage principal – Core Lending 1,564,723 1,610,098 1,752,356 967,988 1,032,116 1,027,008 669,261 736,283
Single family dwelling 3,861,778 3,884,114 3,891,290 3,878,905 3,832,797 3,255,077 2,797,982 2,315,651
Multi-unit residential 3,054,406 2,887,769 2,877,556 2,976,847 3,179,312 3,493,318 3,726,566 4,013,890
Mortgage principal – Securitization Financing 6,916,184 6,771,883 6,768,846 6,855,752 7,012,109 6,748,395 6,524,548 6,329,541
Total mortgage principal outstanding $ 8,480,907 $ 8,381,981 $ 8,521,202 $ 7,823,740 $ 8,044,225 $ 7,775,403 $ 7,193,809 $ 7,065,824
Total mortgage principal outstanding percentage 44% 45% 47% 43% 45% 46% 45% 46%
Total
Single family dwelling $ 9,339,894 $ 9,052,923 $ 8,539,139 $ 8,207,853 $ 7,854,740 $ 7,538,969 $ 7,154,141 $ 6,749,855
Mixed-use property 392,521 406,708 404,911 379,479 381,162 372,145 363,318 368,175
Multi-unit residential 652,398 630,070 489,934 504,927 537,641 513,970 462,087 512,983
Commercial 1,250,209 1,157,121 1,248,640 1,343,815 1,180,944 1,035,485 976,872 868,590
Construction 656,542 661,198 693,673 780,133 728,225 736,701 636,374 564,747
Mortgage principal – Core Lending 12,291,564 11,908,020 11,376,297 11,216,207 10,682,712 10,197,270 9,592,792 9,064,350
Single family dwelling 3,868,731 3,905,182 3,914,040 3,891,715 3,837,808 3,270,068 2,841,935 2,385,784
Multi-unit residential 3,054,406 2,887,769 2,877,556 2,976,847 3,179,312 3,493,318 3,726,566 4,013,890
Mortgage principal – Securitization Financing 6,923,137 6,792,951 6,791,596 6,868,562 7,017,120 6,763,386 6,568,501 6,399,674
Total mortgage principal outstanding $ 19,214,701 $ 18,700,971 $ 18,167,893 $ 18,084,769 $ 17,699,832 $ 16,960,656 $ 16,161,293 $ 15,464,024
Total mortgage principal outstanding percentage 100% 100% 100% 100% 100% 100% 100% 100%
20162017
Q1Q4 Q1 Q4 Q3 Q2Q2Q3
16

Table 14: Mortgage principal outstanding – by interest rate type
Q4 Q3 Q2 Q1 Q4 Q3 Q2 Q1
Fixed rate mortgages 82% 81% 82% 80% 81% 81% 82% 82%
Floating rate mortgages with interest rate floors(1) 8% 8% 7% 8% 8% 8% 7% 7%
Floating rate mortgages without interest rate floors 10% 11% 11% 12% 11% 11% 11% 11%
Total 100% 100% 100% 100% 100% 100% 100% 100%
(1) Floating rate mortgages with interest rate floors represent mortgages whose rate are allowed to move up or down by way of reference to an index rate, but are subject to a minimum fixed rate.
20162017
17

Table 15: Mortgage principal outstanding – by province(1)
($ THOUSANDS, EXCEPT PERCENTAGES) Amount % Amount % Amount % Amount % Amount % Amount % Amount % Amount %
Single Family Lending
Ontario $ 7,174,374 37% $ 6,997,722 37% $ 6,594,278 36% $ 6,320,385 35% $ 6,041,673 34% $ 5,795,737 34% $ 5,485,009 34% $ 5,184,491 34%
Alberta 919,129 5% 917,045 5% 905,573 5% 914,717 5% 908,923 5% 908,084 5% 919,447 6% 914,251 6%
Quebec 334,339 2% 305,401 2% 282,795 2% 254,991 1% 237,147 1% 219,094 1% 198,040 1% 163,888 1%
British Columbia 680,162 4% 610,759 3% 540,772 3% 503,640 3% 454,921 3% 406,187 2% 346,034 2% 284,356 2%
Saskatchewan 73,305 0% 72,614 0% 71,882 0% 73,658 0% 74,129 0% 75,008 0% 74,752 0% 76,435 0%
Other Provinces 160,509 1% 151,243 1% 145,704 1% 141,342 1% 138,913 1% 135,959 1% 131,964 1% 127,592 1%
$ 9,341,819 49% $ 9,054,784 48% $ 8,541,004 47% $ 8,208,733 45% $ 7,855,706 44% $ 7,540,069 44% $ 7,155,246 44% $ 6,751,013 44%
Commercial Lending
Ontario $ 1,711,459 9% $ 1,746,286 9% $ 1,787,408 10% $ 1,957,638 11% $ 1,774,822 10% $ 1,751,776 10% $ 1,574,719 10% $ 1,465,093 9%
Alberta 348,675 2% 310,428 2% 291,164 2% 310,119 2% 317,138 2% 252,803 1% 272,609 2% 267,008 2%
Quebec 583,632 3% 527,332 3% 540,833 3% 505,370 3% 505,500 3% 432,674 3% 423,578 3% 393,323 3%
British Columbia 208,509 1% 188,026 1% 128,725 1% 144,571 1% 147,488 1% 117,179 1% 72,468 0% 50,886 0%
Saskatchewan 21,689 0% 21,428 0% 20,608 0% 19,360 0% 12,920 0% 27,288 0% 13,929 0% 39,429 0%
Other Provinces 75,781 0% 59,736 0% 66,555 0% 70,416 0% 69,138 0% 75,482 0% 80,243 0% 97,598 1%
$ 2,949,745 15% $ 2,853,236 15% $ 2,835,293 16% $ 3,007,474 17% $ 2,827,006 16% $ 2,657,201 16% $ 2,437,546 15% $ 2,313,337 15%
Total mortgage principal - Core Lending $ 12,291,564 64% $ 11,908,020 64% $ 11,376,297 63% $ 11,216,207 62% $ 10,682,712 60% $ 10,197,270 60% $ 9,592,792 59% $ 9,064,350 59%
Multi-unit residential
Ontario $ 1,192,426 6% $ 1,083,762 6% $ 1,120,353 6% $ 1,134,626 6% $ 1,239,383 7% $ 1,294,661 8% $ 1,458,201 9% $ 1,560,075 10%
Alberta 631,878 3% 622,571 3% 585,807 3% 639,895 4% 643,096 4% 665,201 4% 641,089 4% 673,371 4%
Quebec 647,070 3% 557,317 3% 549,105 3% 572,546 3% 652,594 4% 749,873 4% 790,335 5% 880,665 6%
British Columbia 322,871 2% 349,481 2% 345,644 2% 344,791 2% 332,856 2% 396,951 2% 403,411 2% 410,498 3%
Saskatchewan 65,225 0% 65,655 0% 63,949 0% 70,308 0% 72,683 0% 117,051 1% 154,093 1% 158,013 1%
Other Provinces 194,935 1% 208,983 1% 212,698 1% 214,680 1% 238,700 1% 269,582 2% 279,436 2% 331,268 2%
$ 3,054,406 16% $ 2,887,769 15% $ 2,877,556 16% $ 2,976,847 16% $ 3,179,312 18% $ 3,493,318 21% $ 3,726,566 23% $ 4,013,890 26%
Prime single family residential
Ontario $ 2,078,446 11% $ 2,106,015 11% $ 2,123,293 12% $ 2,134,377 12% $ 2,106,296 12% $ 1,851,495 11% $ 1,564,574 10% $ 1,280,348 8%
Alberta 769,999 4% 762,374 4% 746,953 4% 731,153 4% 716,591 4% 614,090 4% 571,655 4% 514,056 3%
Quebec 52,227 0% 52,931 0% 53,391 0% 54,010 0% 54,451 0% - 0% - 0% - 0%
British Columbia 515,112 3% 529,742 3% 543,359 3% 535,075 3% 534,267 3% 429,616 3% 362,871 2% 285,527 2%
Saskatchewan 171,066 1% 173,198 1% 168,471 1% 165,853 1% 159,454 1% 142,410 1% 128,991 1% 117,454 1%
Other Provinces 281,880 1% 280,922 2% 278,573 2% 271,247 1% 266,749 2% 232,457 1% 213,844 1% 188,399 1%
$ 3,868,731 20% $ 3,905,182 21% $ 3,914,040 22% $ 3,891,715 22% $ 3,837,808 22% $ 3,270,068 19% $ 2,841,935 18% $ 2,385,784 15%
Total mortgage principal - Securitization Financing $ 6,923,137 36% $ 6,792,951 36% $ 6,791,596 37% $ 6,868,562 38% $ 7,017,120 40% $ 6,763,386 40% $ 6,568,501 41% $ 6,399,674 41%
Total
Ontario $ 12,156,705 63% $ 11,933,785 64% $ 11,625,332 64% $ 11,547,026 64% $ 11,162,174 63% $ 10,693,668 63% $ 10,082,504 62% $ 9,490,008 61%
Alberta 2,669,681 14% 2,612,418 14% 2,529,497 14% 2,595,884 14% 2,585,748 15% 2,440,179 14% 2,404,800 15% 2,368,686 15%
Quebec 1,617,269 8% 1,442,981 8% 1,426,124 8% 1,386,917 8% 1,449,692 8% 1,401,641 8% 1,411,952 9% 1,437,876 9%
British Columbia 1,726,655 9% 1,678,008 9% 1,558,500 9% 1,528,078 8% 1,469,532 8% 1,349,933 8% 1,184,784 7% 1,031,267 7%
Saskatchewan 331,285 2% 332,895 2% 324,910 2% 329,179 2% 319,186 2% 361,756 2% 371,766 2% 391,330 3%
Other Provinces 713,106 4% 700,884 4% 703,530 4% 697,685 4% 713,500 4% 713,480 4% 705,487 4% 744,857 5%
Total mortgage principal $ 19,214,701 100% $ 18,700,971 100% $ 18,167,893 100% $ 18,084,769 100% $ 17,699,832 100% $ 16,960,656 100% $ 16,161,293 100% $ 15,464,024 100%
(1) Geographic location based on the address of the property mortgaged.
20162017
Q2Q3 Q2 Q1Q3Q4 Q1 Q4
18

Table 16: Residential mortgage and HELOC principal outstanding – by province(1)
Total
Uninsured Uninsured
Total % Total % Total % Total %
($ THOUSANDS, EXCEPT PERCENTAGES) Q4 2017
Ontario $ 3,274,488 25% $ 5,945,063 45% $ 32,279 80% $ 5,977,342 45%
Alberta 954,012 7% 730,372 6% 3,879 10% 734,251 6%
British Columbia 578,424 4% 614,029 5% 2,821 7% 616,850 5%
Manitoba 109,786 1% 65,637 0% 436 1% 66,073 1%
Saskatchewan 191,655 1% 52,437 0% 279 1% 52,716 0%
Other Provinces 290,520 2% 361,818 3% 690 1% 362,508 3%
Total residential mortgages $ 5,398,885 40% $ 7,769,356 60% $ 40,384 100% $ 7,809,740 60%
Downtown Toronto condominiums(4)$ 56,451 0% $ 123,445 1% $ 267 1% $ 123,712 1%
($ THOUSANDS, EXCEPT PERCENTAGES) Q4 2016
Ontario $ 2,886,711 25% $ 5,239,191 45% $ 21,982 79% $ 5,261,173 45%
Alberta 838,068 7% 783,100 7% 3,463 12% 786,563 7%
British Columbia 574,761 5% 412,923 4% 1,503 5% 414,426 4%
Manitoba 88,244 1% 70,772 1% 310 1% 71,082 1%
Saskatchewan 174,512 1% 58,736 1% 335 1% 59,071 1%
Other Provinces 265,843 2% 271,841 2% 253 2% 272,094 2%
Total residential mortgages $ 4,828,139 41% $ 6,836,563 59% $ 27,846 100% $ 6,864,409 60%
Downtown Toronto condominiums(4)$ 5,256 0% $ 108,196 1% $ 193 1% $ 108,389 1%
(1) Geographic location based on the address of the property mortgaged.(2) HELOC represents the drawn amount of the secured line of credit.(3) Insured by either CMHC or Genworth. (4) Represents single family residential condominium mortgages and are included in Ontario totals above.
Residential mortgages HELOC(2)
Insured(3) Uninsured
19

Table 17: Residential mortgage principal outstanding – by remaining amortization(1)
<5 5 - <10 10 - <15 15 - <20 20 - <25 25 - <30 30 - <35 >=35
($ THOUSANDS, EXCEPT PERCENTAGES) years years years years years years years Total
Q4 2017
Total residential $ 2,269 $ 18,170 $ 100,080 $ 539,669 $ 3,295,980 $ 9,159,661 $ 52,126 $ 286 $ 13,168,241
mortgages 0.02% 0.14% 0.76% 4.10% 25.03% 69.56% 0.39% 0.00% 100%
Q3 2017
Total residential $ 2,606 $ 16,111 $ 93,513 $ 458,850 $ 3,278,994 $ 8,974,313 $ 95,526 $ 501 $ 12,920,414
mortgages 0.02% 0.12% 0.72% 3.56% 25.38% 69.46% 0.74% 0.00% 100%
Q2 2017
Total residential $ 2,212 $ 15,092 $ 82,989 $ 434,169 $ 3,249,051 $ 8,577,977 $ 57,801 $ 650 $ 12,419,941
mortgages 0.02% 0.12% 0.67% 3.50% 26.16% 69.07% 0.46% 0.00% 100%
Q1 2017
Total residential $ 2,138 $ 14,247 $ 74,626 $ 388,877 $ 3,154,107 $ 8,354,957 $ 79,289 $ 312 $ 12,068,553
mortgages 0.02% 0.12% 0.62% 3.22% 26.13% 69.23% 0.66% 0.00% 100%
Q4 2016
Total residential $ 1,609 $ 14,625 $ 71,136 $ 341,291 $ 3,070,607 $ 8,083,902 $ 80,487 $ 1,045 $ 11,664,702
mortgages 0.01% 0.13% 0.61% 2.93% 26.32% 69.30% 0.69% 0.01% 100%
Q3 2016
Total residential $ 1,387 $ 13,330 $ 63,004 $ 275,504 $ 2,663,536 $ 7,658,853 $ 107,857 $ 1,100 $ 10,784,571
mortgages 0.01% 0.12% 0.58% 2.55% 24.70% 71.02% 1.00% 0.02% 100%
Q2 2016
Total residential $ 831 $ 11,857 $ 55,950 $ 247,111 $ 2,434,154 $ 7,088,276 $ 132,704 $ 1,521 $ 9,972,404
mortgages 0.01% 0.12% 0.56% 2.48% 24.41% 71.08% 1.33% 0.01% 100%
Q1 2016
Total residential $ 1,095 $ 10,686 $ 44,659 $ 221,261 $ 2,170,411 $ 6,525,904 $ 138,318 $ 1,735 $ 9,114,069
mortgages 0.01% 0.12% 0.49% 2.43% 23.81% 71.60% 1.52% 0.02% 100%
(1) The above residential mortgage balances do not include HELOC amount.
years
20

Table 18: Uninsured average loan-to-value of newly originated and newly acquired(1)
Q4 Q3
Residential Residential Residential Residential Residential Residential Residential Residential
mortgages HELOC(2)mortgages HELOC(2)
mortgages HELOC(2)mortgages HELOC(2)
mortgages HELOC(2)mortgages HELOC(2)
mortgages HELOC(2)mortgages HELOC(2)
Ontario 72% 10% 71% 19% 70% 6% 72% 6% 73% 5% 74% 5% 73% 5% 73% 7%
Alberta 72% 2% 71% 32% 72% 8% 71% 4% 71% 13% 72% 6% 73% 2% 72% 4%
British Columbia 69% 6% 69% 3% 70% 3% 69% 6% 69% 3% 69% 3% 69% 5% 71% 6%
Manitoba 71% 6% 70% 13% 76% 1% 74% 6% 74% 4% 73% 9% 77% 1% 75% 1%
Saskatchewan 69% 1% 68% 3% 69% 1% 69% 3% 74% 8% 71% 2% 72% 2% 69% 2%
Other Provinces 71% 12% 70% 2% 71% 3% 70% 6% 71% 3% 71% 1% 71% 18% 71% 3%
Total Canada 71% 9% 70% 18% 70% 6% 72% 6% 72% 5% 73% 5% 73% 5% 73% 7%
Total Canada HELOC - Excluding SHELOC(2)
5% 5% 6% 6% 5% 5% 5% 7%
Downtown Toronto condominiums(3)
63% 18% 63% 2% 65% 2% 64% 22% 67% 2% 66% 3% 69% 5% 64% 2%
(1) Geographic location based on the address of the property mortgaged.
(2) During Q3 2017, we launched a new Standalone HELOC ("SHELOC") product. The existing non-standalone HELOC and the new SHELOC are collectively referred to as "HELOC" above.
The loan-to-value ("LTV") of the HELOC represents the authorized HELOC amount as a percentage of the original property value. In the case of non-standalone HELOCs, there are mortgages associated with most of these properties,
but the aggregate LTVs are not presented on this chart. Aggregate LTVs do not exceed 80%. For SHELOCs, there are no mortgages associated to these properties. Excluding SHELOCs, the Q4 2017 LTV for Total Canada would have been 5%.(3) Included in Ontario totals above.
20162017
Q1 Q4 Q3 Q2 Q1Q2
21

Table 19: Average loan-to-value of existing residential mortgages(1)(3)(4)
Insured(2)(5)
Uninsured(2)
Total(2)
Insured(2)
Uninsured(2)
Total(2)
Insured(2)
Uninsured(2)
Total(2)
Insured(2)
Uninsured(2)
Total(2)
Ontario 61% 64% 63% 65% 61% 62% 68% 59% 62% 74% 61% 65%
Alberta 75% 65% 71% 79% 64% 73% 80% 65% 74% 83% 67% 75%
British Columbia 66% 64% 65% 75% 62% 69% 77% 61% 70% 79% 63% 72%
Manitoba 77% 67% 73% 81% 68% 76% 82% 69% 77% 83% 69% 77%
Saskatchewan 70% 57% 67% 81% 55% 75% 83% 55% 77% 84% 58% 78%
Other Provinces 72% 64% 68% 82% 63% 72% 83% 63% 73% 86% 65% 75%
Total Canada 66% 64% 65% 71% 61% 65% 73% 60% 66% 77% 62% 68%
Insured(2) Uninsured(2) Total(2) Insured(2) Uninsured(2) Total(2) Insured(2) Uninsured(2) Total(2) Insured(2) Uninsured(2) Total(2)
Ontario 74% 62% 66% 72% 62% 66% 75% 64% 68% 74% 67% 69%
Alberta 83% 66% 75% 82% 67% 74% 83% 67% 75% 85% 70% 77%
British Columbia 79% 63% 73% 78% 63% 71% 80% 64% 72% 76% 62% 69%
Manitoba 83% 69% 77% 82% 68% 75% 83% 69% 76% 82% 70% 76%
Saskatchewan 85% 59% 78% 84% 59% 77% 86% 60% 78% 83% 63% 77%
Other Provinces 87% 66% 77% 85% 66% 74% 87% 66% 75% 87% 70% 77%
Total Canada 78% 63% 69% 75% 63% 68% 78% 65% 70% 78% 67% 71%
(1) Geographic location based on the address of the property mortgaged.(2)
Based on current property values. Current values are estimated using a Housing Price Index.(3)
The LTV of our HELOC products is not included in this chart.(4) Equitable has arrangements with other lenders to participate in its single family residential loans in certain circumstances, namely if Equitable wants to cap the value of its own
exposure to stay within the boundaries of its risk appetite while still meeting a borrower’s needs. The arrangements, which have been entered into in the normal course of business
at arm’s length and on market terms, are structured such that the other lenders’ participation would always bear the first loss on the mortgage. The loan-to-value ratios above
therefore do not take into account the other lenders’ participation in order to reflect both the substance and legal form of Equitable’s exposure. Equitable underwrites the loans
based on the total value of its own advance and the other lender’s participation to ensure that the borrower is able to service the aggregate amount of the loan. Other lenders’
participation in Equitable’s single family residential loans was $52.2 million at December 31, 2017 (December 31, 2016 - $49.9 million).(5) Commencing in Q4 2017, there was a LTV methodology change with respect to third party purchased insured mortgages.
Q2 Q1Q3Q4
2016
Q4 Q3 Q2 Q1
2017
22
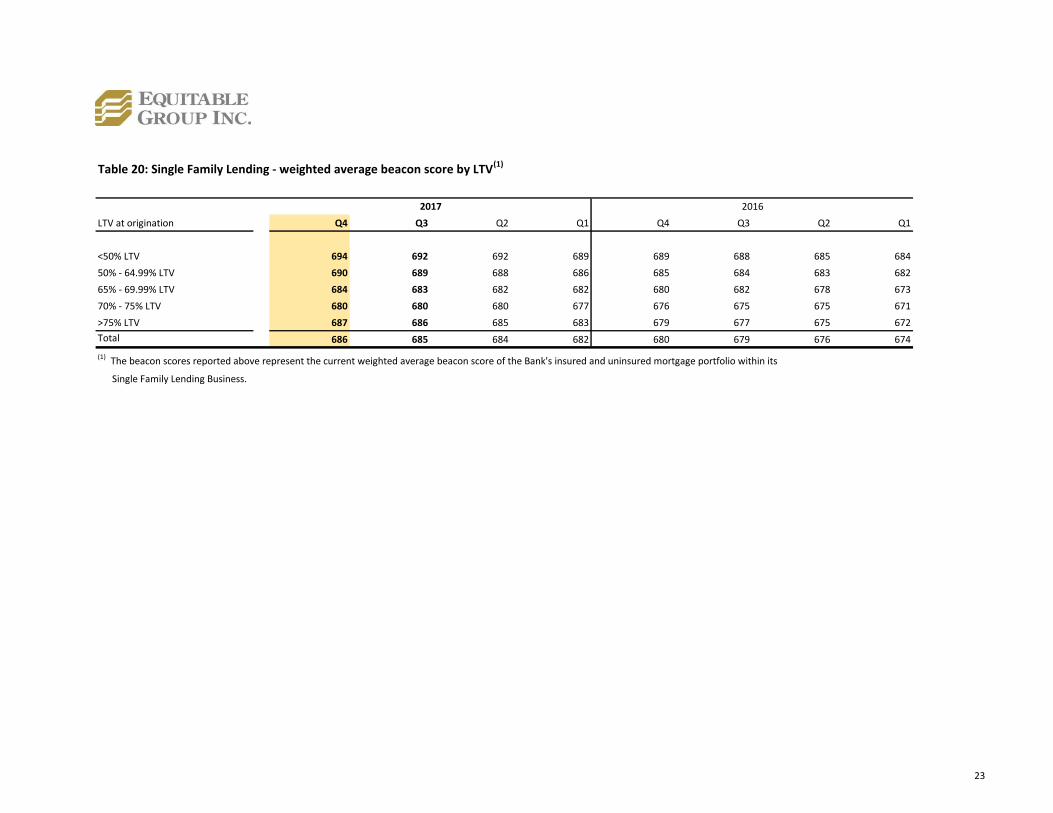
Table 20: Single Family Lending - weighted average beacon score by LTV(1)
LTV at origination Q4 Q3 Q2 Q1 Q4 Q3 Q2 Q1
<50% LTV 694 692 692 689 689 688 685 684
50% - 64.99% LTV 690 689 688 686 685 684 683 682
65% - 69.99% LTV 684 683 682 682 680 682 678 673
70% - 75% LTV 680 680 680 677 676 675 675 671
>75% LTV 687 686 685 683 679 677 675 672
Total 686 685 684 682 680 679 676 674
(1) The beacon scores reported above represent the current weighted average beacon score of the Bank's insured and uninsured mortgage portfolio within its
Single Family Lending Business.
20162017
23

Table 21: Alberta and Saskatchewan portfolios
($ THOUSANDS, EXCEPT PERCENTAGES) Residential Commercial(2) Total % Residential(3) % Commercial(4) % Total % Total %
Q4 2017
Alberta $ 954,012 5% $ 631,878 3% $ 1,585,890 8% $ 734,251 4% $ 349,540 2% $ 1,083,791 6% $ 2,669,681 14%
Saskatchewan 191,655 1% 65,225 0% 256,880 1% 52,716 0% 21,689 0% 74,405 0% 331,285 1%
Other provinces 4,253,218 22% 2,384,919 12% 6,638,137 35% 7,022,773 37% 2,552,825 13% 9,575,598 50% 16,213,735 84%
Total Mortgage Principal $ 5,398,885 28% $ 3,082,022 16% $ 8,480,907 44% $ 7,809,740 41% $ 2,924,054 15% $ 10,733,794 56% $ 19,214,701 100%
Included in Alberta:
Greater Edmonton $ 358,622 2% $ 364,637 2% $ 723,259 4% $ 300,017 2% $ 121,051 1% $ 421,068 2% $ 1,144,327 6%
Greater Calgary 379,793 2% 203,962 1% 583,755 3% 394,801 2% 202,694 1% 597,495 3% 1,181,250 6%
$ 738,415 4% $ 568,599 3% $ 1,307,014 7% $ 694,818 4% $ 323,745 2% $ 1,018,563 5% $ 2,325,577 12%
Included in Saskatchewan:
Regina $ 61,095 0% $ 39,515 0% $ 100,610 0% $ 28,889 0% $ 17,559 0% $ 46,448 0% $ 147,058 0%
Saskatoon 80,520 1% $ 20,810 0% 101,330 1% 17,768 0% 4,130 0% 21,898 0% 123,228 1%
$ 141,615 1% $ 60,325 0% $ 201,940 1% $ 46,657 0% $ 21,689 0% $ 68,346 0% $ 270,286 1%
($ THOUSANDS, EXCEPT PERCENTAGES) Q4 2016
Alberta $ 838,068 5% $ 643,096 4% $ 1,481,164 8% $ 786,563 4% $ 318,021 2% $ 1,104,584 6% $ 2,585,748 14%
Saskatchewan 174,512 1% 72,683 0% 247,195 1% 59,071 0% 12,920 0% 71,991 0% 319,186 1%
Other provinces 3,815,559 22% 2,500,307 14% 6,315,866 36% 6,018,775 34% 2,460,257 14% 8,479,032 48% 14,794,898 84%
Total Mortgage Principal $ 4,828,139 27% $ 3,216,086 18% $ 8,044,225 45% $ 6,864,409 39% $ 2,791,198 16% $ 9,655,607 55% $ 17,699,832 100%
Included in Alberta:
Greater Edmonton $ 340,314 2% $ 371,792 2% $ 712,106 4% $ 331,794 2% $ 101,362 1% $ 433,156 2% $ 1,145,262 6%
Greater Calgary 366,599 2% 222,423 1% 589,022 3% 412,094 2% 177,690 1% 589,784 3% 1,178,806 6%
$ 706,913 4% $ 594,215 3% $ 1,301,128 7% $ 743,888 4% $ 279,052 2% $ 1,022,940 6% $ 2,324,068 13%
Included in Saskatchewan:
Regina $ 56,467 0% $ 40,416 0% $ 96,883 0% $ 31,574 0% $ 12,920 0% $ 44,494 0% $ 141,377 0%
Saskatoon 77,049 1% $ 23,220 0% 100,269 1% 22,039 0% - 0% 22,039 0% 122,308 1%
$ 133,516 1% $ 63,636 0% $ 197,152 1% $ 53,613 0% $ 12,920 0% $ 66,533 0% $ 263,685 1%
(1) Insured by either CMHC or Genworth.(2) Insured Commercial mortgages are all multi-unit residential mortgages. (3) Uninsured residential includes $40.4 million (December 31, 2016 - $27.8 million) HELOC principal outstanding.(4) There are no multi-units residential mortgages in the uninsured commercial portfolio.
Insured(1) Uninsured
24

Table 22: Modified Capital Disclosure Template - Equitable Bank
All-in Transitional All-in Transitional All-in Transitional All-in Transitional
1 Directly issued qualifying common share capital (and equivalent for non-joint stock companies) plus related stock surplus $ 200,990 $ 199,968 $ 199,918 $ 199,819 2 Retained earnings 868,966 833,441 800,273 765,883 3 Accumulated other comprehensive income (and other reserves) (8,748) (11,577) (12,874) (13,159)4 Directly issued capital subject to phase out from CET1 (only applicable to non-joint stock companies) - - - - 5 Common share capital issued by subsidiaries and held by third parties (amount allowed in group CET1) - - - - 6 Common Equity Tier 1 capital before regulatory adjustments $ 1,061,208 $ 1,021,832 $ 987,317 $ 952,543
28 Total regulatory adjustments to Common Equity Tier 1 $ (17,046) $ (16,299) $ (15,325) $ (14,557)29 Common Equity Tier 1 capital (CET1) $ 1,044,162 $ 1,049,321 $ 1,005,533 $ 1,011,108 $ 971,992 $ 977,632 $ 937,986 $ 943,529
30 Directly issued qualifying Additional Tier 1 instruments plus related stock surplus $ - $ - $ - $ - 31 of which: classified as equity under applicable accounting standards - - - - 32 of which: classified as liabilities under applicable accounting standards - - - - 33 Directly issued capital instruments subject to phase out from Additional Tier 1 72,554 72,554 72,554 72,554 34 Additional Tier 1 instruments (and CET1 instruments not included in row 5) issued by subsidiaries and held by third parties (amount allowed in group AT1) - - - - 35 of which: instruments issued by subsidiaries subject to phase out - - - - 36 Additional Tier 1 capital before regulatory adjustments $ 72,554 $ 72,554 $ 72,554 $ 72,554
43 Total regulatory adjustments to Additional Tier 1 capital $ - $ - $ - $ - 44 Additional Tier 1 capital (AT1) 72,554 72,554 72,554 72,554 45 Tier 1 capital (T1 = CET1 + AT1) $ 1,116,716 $ 1,120,125 $ 1,078,087 $ 1,081,347 $ 1,044,546 $ 1,047,611 $ 1,010,540 $ 1,013,451
46 Directly issued qualifying Tier 2 instruments plus related stock surplus $ - $ - $ - $ - 47 Directly issued capital instruments subject to phase out from Tier 2 - 62,891 62,891 62,891 48 Tier 2 instruments (and CET1 and AT1 instruments not included in row 5 or 34) issued by subsidiaries and held by third parties (amount allowed in group Tier 2) - - - - 49 of which: instruments issued by subsidiaries subject to phase out - - - - 50 Collective allowances 31,890 31,890 31,890 31,890 51 Tier 2 capital before regulatory adjustments $ 31,890 $ 94,781 $ 94,781 $ 94,781
57 Total regulatory adjustments to Tier 2 capital $ - $ - $ - $ - 58 Tier 2 capital (T2) 31,890 94,781 94,781 94,781 59 Total capital(TC = T1 +T2) $ 1,148,606 $ 1,152,015 $ 1,172,868 $ 1,176,128 $ 1,139,327 $ 1,142,391 $ 1,105,321 $ 1,110,340
60 Total risk-weighted assets $ 7,035,380 $ 7,043,725 $ 6,814,247 $ 6,822,315 $ 6,561,813 $ 6,569,557 $ 6,739,517 $ 6,745,938
61 Common Equity Tier 1 (as a percentage of risk-weighted assets) 14.8% 14.9% 14.8% 14.8% 14.8% 14.9% 13.9% 14.0%62 Tier 1 (as a percentage of risk-weighted assets) 15.9% 15.9% 15.8% 15.9% 15.9% 15.9% 15.0% 15.0%63 Total capital (as a percentage of risk-weighted assets) 16.3% 16.4% 17.2% 17.2% 17.4% 17.4% 16.4% 16.5%
69 Common Equity Tier 1 capital all-in target ratio 7.0% 7.0% 7.0% 7.0%70 Tier 1 capital all-in target ratio 8.5% 8.5% 8.5% 8.5%71 Total capital all-in target ratio 10.5% 10.5% 10.5% 10.5%
80 Current cap on CET1 instruments subject to phase out arrangements N/A N/A N/A N/A81 Amounts excluded from CET1 due to cap (excess over cap after redemptions and maturities) N/A N/A N/A N/A82 Current cap on AT1 instruments subject to phase out arrangements N/A N/A N/A N/A83 Amounts excluded from AT1 due to cap (excess over cap after redemptions and maturities) - - - - 84 Current cap on T2 instruments subject to phase out arrangements - 62,891 62,891 62,891
85 Amounts excluded from T2 due to cap (excess over cap after redemptions and maturities) - 2,110 2,110 2,110
Q1
2017
Capital ratios
OSFI all-in target
Q4 Q2Q3
Capital instruments subject to phase-out arrangements (only applicable between 1 Jan 2013 and 1 Jan 2022)
($ THOUSANDS, EXCEPT PERCENTAGES)
Common Equity Tier 1 capital: instruments and reserves
Common Equity Tier 1 capital: regulatory adjustments
Additional Tier 1 capital : instruments
Additional Tier 1 capital : regulatory adjustments
Tier 2 capital: instruments and allowances
Tier 2 capital: regulatory adjustments
25

Table 22: Modified Capital Disclosure Template - Equitable Bank
1 Directly issued qualifying common share capital (and equivalent for non-joint stock companies) plus related stock surplus2 Retained earnings3 Accumulated other comprehensive income (and other reserves)4 Directly issued capital subject to phase out from CET1 (only applicable to non-joint stock companies)5 Common share capital issued by subsidiaries and held by third parties (amount allowed in group CET1)6 Common Equity Tier 1 capital before regulatory adjustments
28 Total regulatory adjustments to Common Equity Tier 1 29 Common Equity Tier 1 capital (CET1)
30 Directly issued qualifying Additional Tier 1 instruments plus related stock surplus31 of which: classified as equity under applicable accounting standards32 of which: classified as liabilities under applicable accounting standards33 Directly issued capital instruments subject to phase out from Additional Tier 134 Additional Tier 1 instruments (and CET1 instruments not included in row 5) issued by subsidiaries and held by third parties (amount allowed in group AT1)35 of which: instruments issued by subsidiaries subject to phase out36 Additional Tier 1 capital before regulatory adjustments
43 Total regulatory adjustments to Additional Tier 1 capital44 Additional Tier 1 capital (AT1)45 Tier 1 capital (T1 = CET1 + AT1)
46 Directly issued qualifying Tier 2 instruments plus related stock surplus47 Directly issued capital instruments subject to phase out from Tier 248 Tier 2 instruments (and CET1 and AT1 instruments not included in row 5 or 34) issued by subsidiaries and held by third parties (amount allowed in group Tier 2)49 of which: instruments issued by subsidiaries subject to phase out50 Collective allowances51 Tier 2 capital before regulatory adjustments
57 Total regulatory adjustments to Tier 2 capital58 Tier 2 capital (T2)59 Total capital(TC = T1 +T2)
60 Total risk-weighted assets
61 Common Equity Tier 1 (as a percentage of risk-weighted assets)62 Tier 1 (as a percentage of risk-weighted assets)63 Total capital (as a percentage of risk-weighted assets)
69 Common Equity Tier 1 capital all-in target ratio70 Tier 1 capital all-in target ratio71 Total capital all-in target ratio
80 Current cap on CET1 instruments subject to phase out arrangements81 Amounts excluded from CET1 due to cap (excess over cap after redemptions and maturities)82 Current cap on AT1 instruments subject to phase out arrangements83 Amounts excluded from AT1 due to cap (excess over cap after redemptions and maturities)84 Current cap on T2 instruments subject to phase out arrangements
85 Amounts excluded from T2 due to cap (excess over cap after redemptions and maturities)
Capital ratios
OSFI all-in target
Capital instruments subject to phase-out arrangements (only applicable between 1 Jan 2013 and 1 Jan 2022)
($ THOUSANDS, EXCEPT PERCENTAGES)
Common Equity Tier 1 capital: instruments and reserves
Common Equity Tier 1 capital: regulatory adjustments
Additional Tier 1 capital : instruments
Additional Tier 1 capital : regulatory adjustments
Tier 2 capital: instruments and allowances
Tier 2 capital: regulatory adjustments
All-in Transitional All-in Transitional All-in Transitional All-in Transitional
$ 199,089 $ 148,175 $ 147,096 $ 146,640 727,265 689,789 659,063 629,783 (20,210) (24,133) (26,392) (26,605)
- - - - - - - -
$ 906,144 $ 813,831 $ 779,767 $ 749,818
$ (15,037) $ (14,687) $ (14,495) $ (13,951)$ 891,107 $ 905,206 $ 799,144 $ 814,672 $ 765,272 $ 798,224 $ 735,867 $ 752,089
$ - $ - $ - $ - - - - - - - - -
72,554 72,554 72,554 72,554 - - - - - - - -
$ 72,554 $ 72,554 $ 72,554 $ 72,554
$ - $ - $ - $ - 72,554 72,554 72,554 72,554
$ 963,661 $ 969,676 $ 871,698 $ 877,573 $ 837,826 $ 848,656 $ 808,421 $ 814,001
$ - $ - $ - $ - 65,000 65,000 65,000 65,000
- - - - - - - -
31,890 31,890 31,890 31,890 $ 96,890 $ 96,890 $ 96,890 $ 96,890
$ - $ - $ - $ - 96,890 96,890 96,890 96,890
$ 1,060,551 $ 1,066,565 $ 968,588 $ 974,462 $ 934,716 $ 945,545 $ 905,311 $ 910,890
$ 6,385,825 $ 6,395,488 $ 5,968,000 $ 5,975,788 $ 5,664,575 $ 5,680,450 $ 5,433,025 $ 5,440,496
14.0% 14.2% 13.4% 13.6% 13.5% 14.1% 13.5% 13.8%15.1% 15.2% 14.6% 14.7% 14.8% 14.9% 14.9% 15.0%16.6% 16.7% 16.2% 16.3% 16.5% 16.6% 16.7% 16.7%
7.0% 7.0% 7.0% 7.0%8.5% 8.5% 8.5% 8.5%
10.5% 10.5% 10.5% 10.5%
N/A N/A N/A N/AN/A N/A N/A N/AN/A N/A N/A N/A
- - - - 75,469 75,469 75,469 75,469
- - - -
Q1Q2Q3Q4
2016 2016
26

Table 23: Leverage Ratio - Equitable Bank(1)
Q4 Q3 Q2 Q1 Q4 Q3 Q2 Q1
On-balance sheet exposure1 On-balance sheet items (excluding derivatives, SFTs and grandfathered securitization exposures but including collateral) $ 20,278,798 $ 19,833,924 $ 19,374,722 $ 18,866,332 $ 18,313,889 $ 17,476,260 $ 16,486,914 $ 15,853,0572 (Asset amounts deducted in determining Basel III “all-in” Tier 1 capital) (20,572) (19,310) (15,207) (11,875) (12,263) (5,955) (4,441) (5,807)3 Total on-balance sheet exposures (excluding derivatives and SFTs) (sum of lines 1 and 2) $ 20,258,226 $ 19,814,614 $ 19,359,515 $ 18,854,457 $ 18,301,626 $ 17,470,305 $ 16,482,473 $ 15,847,250
Derivative exposures4 Replacement cost associated with all derivative transactions (i.e. net of eligible cash variation margin) $ 17,963 $ 16,229 $ 18,199 $ 12,117 $ 13,752 $ 4,006 $ 1,775 $ 6275 Add-on amounts for PFE associated with all derivative transactions 30,102 26,785 19,743 18,722 15,113 12,361 9,113 13,4766 Gross up for derivatives collateral provided where deducted from the balance sheet assets pursuant to the operative accounting framework - - - - - - - - 7 (Deductions of receivables assets for cash variation margin provided in derivative transactions) - - - - - - - - 8 (Exempted CCP-leg of client cleared trade exposures) - - - - - - - - 9 Adjusted effective notional amount of written credit derivatives - - - - - - - -
10 (Adjusted effective notional offsets and add-on deductions for written credit derivatives) - - - - - - - - 11 Total derivative exposures (sum of lines 4 to 10) $ 48,065 $ 43,014 $ 37,942 $ 30,839 $ 28,865 $ 16,367 $ 10,888 $ 14,103
12 Gross SFT assets recognised for accounting purposes (with no recognition of netting), after adjusting for sale accounting transactions $ - $ - $ - $ 4,984 $ 200,986 $ 102,760 $ 150,906 $ 30,346
13 (Netted amounts of cash payables and cash receivables of gross SFT assets) - - - - - - - - 14 Counterparty credit risk (CCR) exposure for SFTs - - - - - - - - 15 Agent transaction exposures - - - - - - - - 16 Total securities financing transaction exposures (sum of lines 12 to 15) $ - $ - $ - $ 4,984 $ 200,986 $ 102,760 $ 150,906 $ 30,346
Other off-balance sheet exposures17 Off-balance sheet exposure at gross notional amount $ 1,294,335 $ 1,223,803 $ 1,326,412 $ 1,102,267 $ 1,074,497 $ 1,041,986 $ 1,104,870 $ 657,18118 (Adjustments for conversion to credit equivalent amounts) (924,242) (869,867) (982,930) (771,282) (758,512) (780,234) (826,196) (408,910)19 Off-balance sheet items (sum of lines 17 and 18) $ 370,093 $ 353,936 $ 343,482 $ 330,985 $ 315,985 $ 261,752 $ 278,674 $ 248,271
Capital and Total Exposure20 Tier 1 capital $ 1,116,716 $ 1,078,087 $ 1,044,546 $ 1,010,540 $ 963,661 $ 871,698 $ 837,826 $ 808,42121 Total Exposures (sum of lines 3, 11, 16 and 19) $ 20,676,384 $ 20,211,564 $ 19,740,939 $ 19,221,265 $ 18,847,462 $ 17,851,184 $ 16,922,941 $ 16,139,970
Leverage Ratios22 Basel III Leverage Ratio 5.4% 5.3% 5.3% 5.3% 5.1% 4.9% 5.0% 5.0%
(1) This table has been extracted from and should be read in conjunction with the BCBS Leverage Ratio Framework and OSFI’s Leverage Requirements guideline.
2016($ THOUSANDS, EXCEPT PERCENTAGES)
2017
27
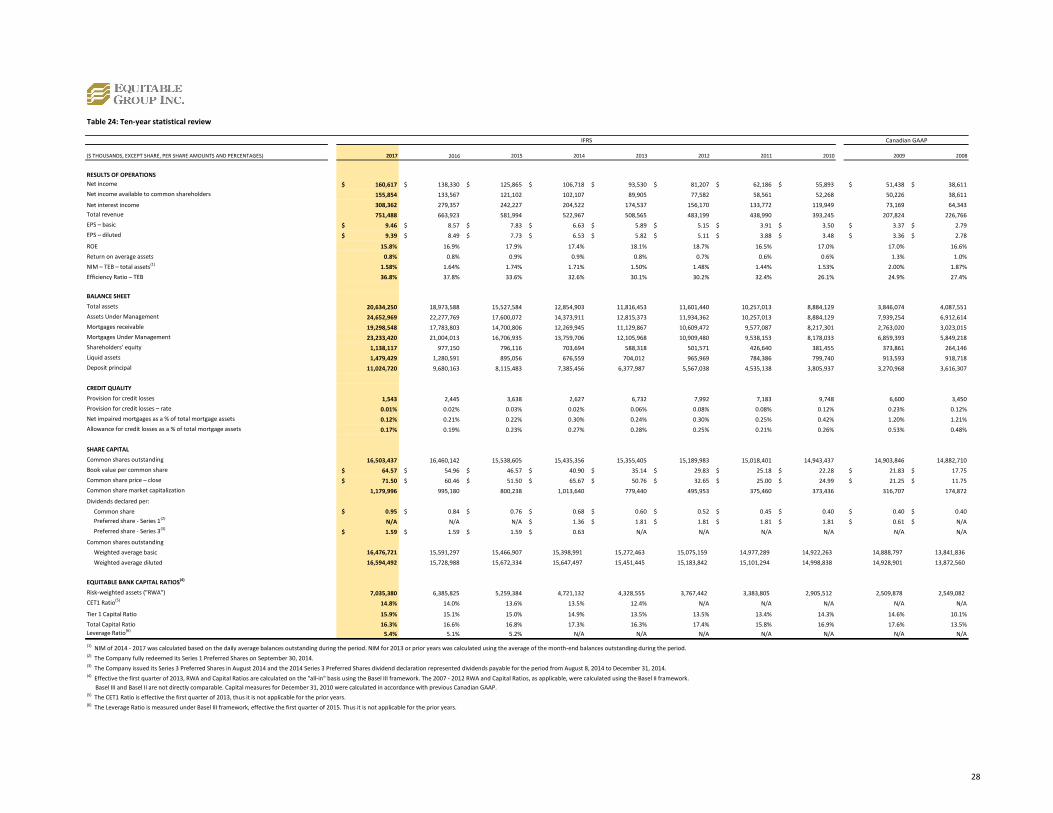
($ THOUSANDS, EXCEPT SHARE, PER SHARE AMOUNTS AND PERCENTAGES) 2017 2015 2014 2013 2012 2011 2010 2009 2008
RESULTS OF OPERATIONS
Net income $ 160,617 $ 138,330 $ 125,865 $ 106,718 $ 93,530 $ 81,207 $ 62,186 $ 55,893 $ 51,438 $ 38,611
Net income available to common shareholders 155,854 133,567 121,102 102,107 89,905 77,582 58,561 52,268 50,226 38,611
Net interest income 308,362 279,357 242,227 204,522 174,537 156,170 133,772 119,949 73,169 64,343
Total revenue 751,488 663,923 581,994 522,967 508,565 483,199 438,990 393,245 207,824 226,766
EPS – basic $ 9.46 $ 8.57 $ 7.83 $ 6.63 $ 5.89 $ 5.15 $ 3.91 $ 3.50 $ 3.37 $ 2.79
EPS – diluted $ 9.39 $ 8.49 $ 7.73 $ 6.53 $ 5.82 $ 5.11 $ 3.88 $ 3.48 $ 3.36 $ 2.78
ROE 15.8% 16.9% 17.9% 17.4% 18.1% 18.7% 16.5% 17.0% 17.0% 16.6%
Return on average assets 0.8% 0.8% 0.9% 0.9% 0.8% 0.7% 0.6% 0.6% 1.3% 1.0%
NIM – TEB – total assets(1) 1.58% 1.64% 1.74% 1.71% 1.50% 1.48% 1.44% 1.53% 2.00% 1.87%
Efficiency Ratio – TEB 36.8% 37.8% 33.6% 32.6% 30.1% 30.2% 32.4% 26.1% 24.9% 27.4%
BALANCE SHEET
Total assets 20,634,250 18,973,588 15,527,584 12,854,903 11,816,453 11,601,440 10,257,013 8,884,129 3,846,074 4,087,551
Assets Under Management 24,652,969 22,277,769 17,600,072 14,373,911 12,815,373 11,934,362 10,257,013 8,884,129 7,939,254 6,912,614
Mortgages receivable 19,298,548 17,783,803 14,700,806 12,269,945 11,129,867 10,609,472 9,577,087 8,217,301 2,763,020 3,023,015
Mortgages Under Management 23,233,420 21,004,013 16,706,935 13,759,706 12,105,968 10,909,480 9,538,153 8,178,033 6,859,393 5,849,218
Shareholders' equity 1,138,117 977,150 796,116 703,694 588,318 501,571 426,640 381,455 373,861 264,146
Liquid assets 1,479,429 1,280,591 895,056 676,559 704,012 965,969 784,386 799,740 913,593 918,718
Deposit principal 11,024,720 9,680,163 8,115,483 7,385,456 6,377,987 5,567,038 4,535,138 3,805,937 3,270,968 3,616,307
CREDIT QUALITY
Provision for credit losses 1,543 2,445 3,638 2,627 6,732 7,992 7,183 9,748 6,600 3,450
Provision for credit losses – rate 0.01% 0.02% 0.03% 0.02% 0.06% 0.08% 0.08% 0.12% 0.23% 0.12%
Net impaired mortgages as a % of total mortgage assets 0.12% 0.21% 0.22% 0.30% 0.24% 0.30% 0.25% 0.42% 1.20% 1.21%
Allowance for credit losses as a % of total mortgage assets 0.17% 0.19% 0.23% 0.27% 0.28% 0.25% 0.21% 0.26% 0.53% 0.48%
SHARE CAPITAL
Common shares outstanding 16,503,437 16,460,142 15,538,605 15,435,356 15,355,405 15,189,983 15,018,401 14,943,437 14,903,846 14,882,710
Book value per common share $ 64.57 $ 54.96 $ 46.57 $ 40.90 $ 35.14 $ 29.83 $ 25.18 $ 22.28 $ 21.83 $ 17.75
Common share price – close $ 71.50 $ 60.46 $ 51.50 $ 65.67 $ 50.76 $ 32.65 $ 25.00 $ 24.99 $ 21.25 $ 11.75
Common share market capitalization 1,179,996 995,180 800,238 1,013,640 779,440 495,953 375,460 373,436 316,707 174,872
Dividends declared per:
Common share $ 0.95 $ 0.84 $ 0.76 $ 0.68 $ 0.60 $ 0.52 $ 0.45 $ 0.40 $ 0.40 $ 0.40
Preferred share - Series 1(2)N/A N/A N/A $ 1.36 $ 1.81 $ 1.81 $ 1.81 $ 1.81 $ 0.61 $ N/A
Preferred share - Series 3(3)$ 1.59 $ 1.59 $ 1.59 $ 0.63 N/A N/A N/A N/A N/A N/A
Common shares outstanding
Weighted average basic 16,476,721 15,591,297 15,466,907 15,398,991 15,272,463 15,075,159 14,977,289 14,922,263 14,888,797 13,841,836
Weighted average diluted 16,594,492 15,728,988 15,672,334 15,647,497 15,451,445 15,183,842 15,101,294 14,998,838 14,928,901 13,872,560
EQUITABLE BANK CAPITAL RATIOS(4)
Risk-weighted assets ("RWA") 7,035,380 6,385,825 5,259,384 4,721,132 4,328,555 3,767,442 3,383,805 2,905,512 2,509,878 2,549,082
CET1 Ratio(5)14.8% 14.0% 13.6% 13.5% 12.4% N/A N/A N/A N/A N/A
Tier 1 Capital Ratio 15.9% 15.1% 15.0% 14.9% 13.5% 13.5% 13.4% 14.3% 14.6% 10.1%
Total Capital Ratio 16.3% 16.6% 16.8% 17.3% 16.3% 17.4% 15.8% 16.9% 17.6% 13.5%
Leverage Ratio(6)5.4% 5.1% 5.2% N/A N/A N/A N/A N/A N/A N/A
(1) NIM of 2014 - 2017 was calculated based on the daily average balances outstanding during the period. NIM for 2013 or prior years was calculated using the average of the month-end balances outstanding during the period.(2) The Company fully redeemed its Series 1 Preferred Shares on September 30, 2014.(3) The Company issued its Series 3 Preferred Shares in August 2014 and the 2014 Series 3 Preferred Shares dividend declaration represented dividends payable for the period from August 8, 2014 to December 31, 2014.(4) Effective the first quarter of 2013, RWA and Capital Ratios are calculated on the "all-in" basis using the Basel III framework. The 2007 - 2012 RWA and Capital Ratios, as applicable, were calculated using the Basel II framework.
Basel III and Basel II are not directly comparable. Capital measures for December 31, 2010 were calculated in accordance with previous Canadian GAAP.(5) The CET1 Ratio is effective the first quarter of 2013, thus it is not applicable for the prior years.(6) The Leverage Ratio is measured under Basel III framework, effective the first quarter of 2015. Thus it is not applicable for the prior years.
Table 24: Ten-year statistical review
IFRS Canadian GAAP
2016
28

Non-GAAP measures
Assets Under Management ("AUM")is the sum of total assets reported on the consolidated balance sheet and mortgage principal derecognized but still managed by the Company.
Book value per common shareis calculated by dividing common shareholders’ equity by the number of common shares outstanding.
Common Equity Tier 1 Capital ("CET1 Capital") is defined as shareholders’ equity plus any qualifying other non-controlling interest in subsidiaries less preferred shares issued and outstanding, any goodwill, otherintangible assets and cash flow hedge reserve components of accumulated other comprehensive income.
CET1 Ratiois defined as CET1 Capital as a percentage of total RWA. This ratio is calculated for the Bank on the "all-in" basis in accordance with the guidelines issued by OSFI.
Efficiency Ratiois derived by dividing non-interest expenses by the sum of net revenue. A lower efficiency ratio reflects a more efficient cost structure.
Leverage Ratiois calculated by dividing Tier 1 Capital by an exposure measure. The exposure measure consists of total assets (excluding items deducted from Tier 1 Capital) and certainoff-balance sheet items converted into credit exposure equivalents. Adjustments are also made to derivatives and secured financing transactions to reflect credit and other risks.This ratio is calculated for the Bank on the "all-in" basis in accordance with the guidelines issued by OSFI.
Liquid assetsis a measure of the Company’s cash or assets that can be readily converted into cash, which are held for the purposes of funding mortgages, deposit maturities, and theability to collect other receivables and settle other obligations.
Mortgages Under Management ("MUM")is the sum of mortgage principal reported on the consolidated balance sheet and mortgage principal derecognized but still managed by the Company.
Net interest margin ("NIM")is calculated on an annualized basis by dividing net interest income – TEB by the average total interest earning assets for the period.
Net revenueis calculated as the sum of net interest income, other income, and the TEB adjustment.
Provision for credit losses − rateis calculated on an annualized basis and is defined as the provision for credit losses as a percentage of average loan portfolio outstanding during the period.
Return on average assetsis calculated on an annualized basis and is defined as net income as a percentage of average month-end total assets balances outstanding during the period.
Return on shareholders’ equity ("ROE")is calculated on an annualized basis and is defined as net income available to common shareholders as a percentage of the weighted average common equity outstanding during the period.
Risk-weighted assets (“RWA”)represents the Bank’s assets and off-balance sheet exposures, weighted according to risk as prescribed by OSFI under the CAR Guideline.
Securitization Financing MUMis the sum of Securitization Financing mortgage principal reported on the consolidated balance sheet and Securitization Financing mortgage principal derecognized but still managed by the Company.
29

Non-GAAP measures
Taxable equivalent basis ("TEB")The TEB methodology grosses up tax-exempt income, such as dividends from equity securities, by an amount which makes this income comparable on a pre-tax basis toregular taxable income such as mortgage interest.
Tier 1 Capitalis calculated by adding non-cumulative preferred shares to CET1 Capital.
Tier 2 Capitalis equal to the sum of the Bank’s collective allowance and subordinated debentures.
Tier 1 Ratiois calculated by dividing Tier 1 Capital by Total RWA. This ratio is calculated for the Bank on the "all-in" basis in accordance with the guidelines issued by OSFI.
Total Capitalequals to Tier 1 plus Tier 2 Capital.
Total Capital Ratiois calculated by dividing Total Capital by Total RWA. This ratio is calculated for the Bank on the "all-in" basis in accordance with the guidelines issued by OSFI.
30

Acronyms
AOCI
Accumulated Other Comprehensive Income (Loss)
BCBS
Basel Committee on Banking Supervision
CAR
Capital Adequacy Requirements
CMB
Canada Mortgage Bond
CMHC
Canada Mortgage and Housing Corporation
EPS
Earnings per Share
GAAP
Generally Accepted Accounting Principles
GICs
Guaranteed Investment Certificates
HELOC
Home Equity Line of Credit
HISAs
High Interest Savings Accounts
LTV
Loan-to-Value ratio
MBS
Mortgage-backed securities
NHA
National Housing Act
OSFI
Office of the Superintendent of Financial Institutions Canada
TFSAs
Tax-Free Savings Accounts
31