regulatory and political climate of biotechnology in … 25, 2013 · regulatory and political...
TRANSCRIPT

| 1
Regulatory and Political Climate of Biotechnology in the EU
| 1
USDA Outlook ForumFebruary 21, 2013
Constance Cullman

2
Global Operations
Rapid worldwide expansion.Facilities in more than 40 countries Products sold in more than 130 countries.More than 7,700 employees worldwide.
Dots represent locations, not the number of sites in each location.

Biotechnology – The Global PictureStatus in the EUEU Regulatory
Framework Political Aspects TrendsConclusions
Overview


Source: Marshall, A. (2012) Existing AgBiotech Traits continue Global March. Nature Biotechnology 30, 207
Rapid Growth of Global Transgenic Seed Market

Biotechnology in the European Union

Source: James, C. (2011) Global Status of Commercialized Biotech/GM Crops
Evolution of biotech cultivation in the EU

Cultivation
No cultivation
Bans in place
Cultivation of biotech crops in the EU

3 GM Maize products with corn rootworm
resistance have been in
the EU approval system since
2005…
A growing problem: Corn rootworm moving through Europe
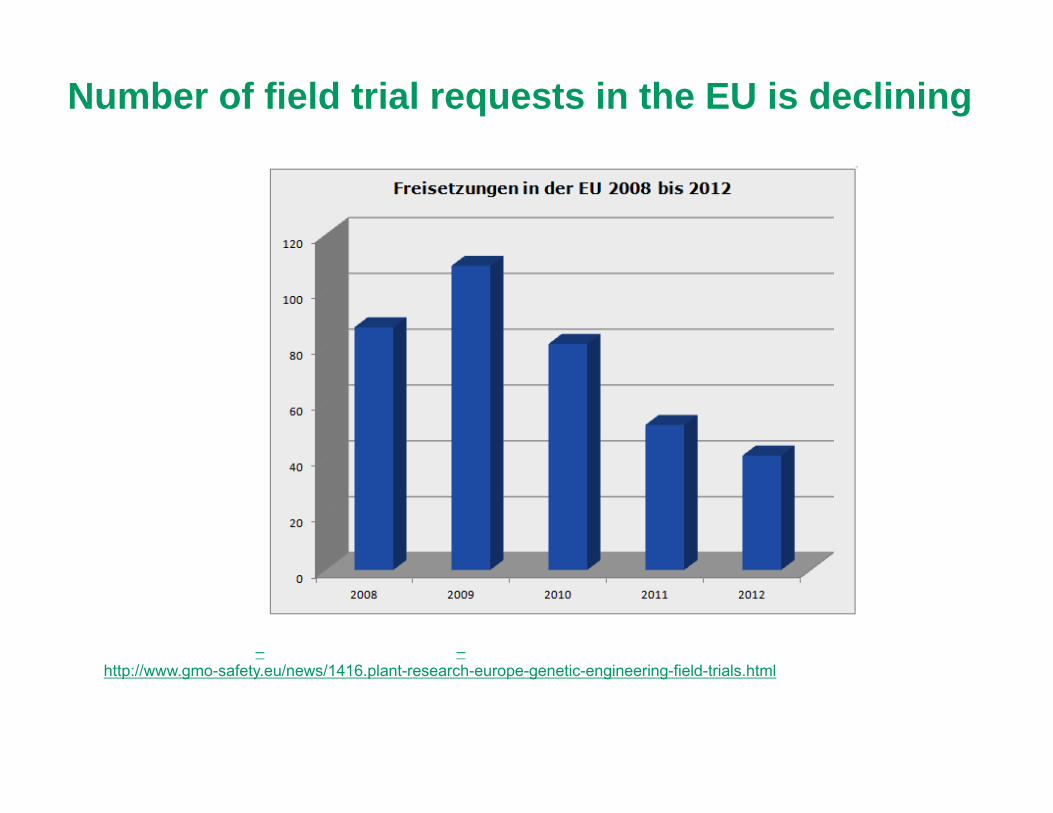
Source: GMO Safety – GMO Research in Europe – Few new GM Plants http://www.gmo-safety.eu/news/1416.plant-research-europe-genetic-engineering-field-trials.html
Number of field trial requests in the EU is declining

The EU regulatory framework for biotech…

EU Principles: •Safety (case-by-case
evaluations)•freedom of choice
• labeling and traceability
A completed legislative framework
Cultivating biotech crops:
• Directive 2001/18 on the deliberate release of GMOs into the environment
• Coexistence Recommendation (2010/C 200/01):− Guidelines to ensure
coexistence of GM crops with conventional and organic farming

Using Biotech Food or Feed
• Regulation 1829/2003/EC on genetically modified food and feed• foods that are biotech and processed foods derived from
biotechnology• applies to food and feed and addresses effects on human or
animal health • Regulation 1830/2003/EC
• Traceability/ labeling of biotechnology, traceability of food/ feed products produced from biotechnology
• Regulation 1946/2003 on the transboundary movements of biotechnology• EU Principles: Safety, freedom of choice, labeling and traceability
A completed legislative framework

• Import> Maize: 26> Oilseed rape: 3 > Soybean: 8> Cotton: 8> Sugar beet:1
• Cultivation> Maize:1 (1998)> Potato:1 (2010)
The EU has approved 46 biotech events for import, only two for cultivation
Products approved in the EU

Biotech Product Submissions and Authorizations
Source: EuropaBio, 2012

23 products for cultivation> 17 maize> 3 potato> 1 soybean> 1 sugarbeet> 1 cotton
52 products for food, feed, import & processing> 17 maize> 12 cotton> 15 soybean> 7 rapeseed> 1 rice
75 Biotech Products are currently in the EU approval process
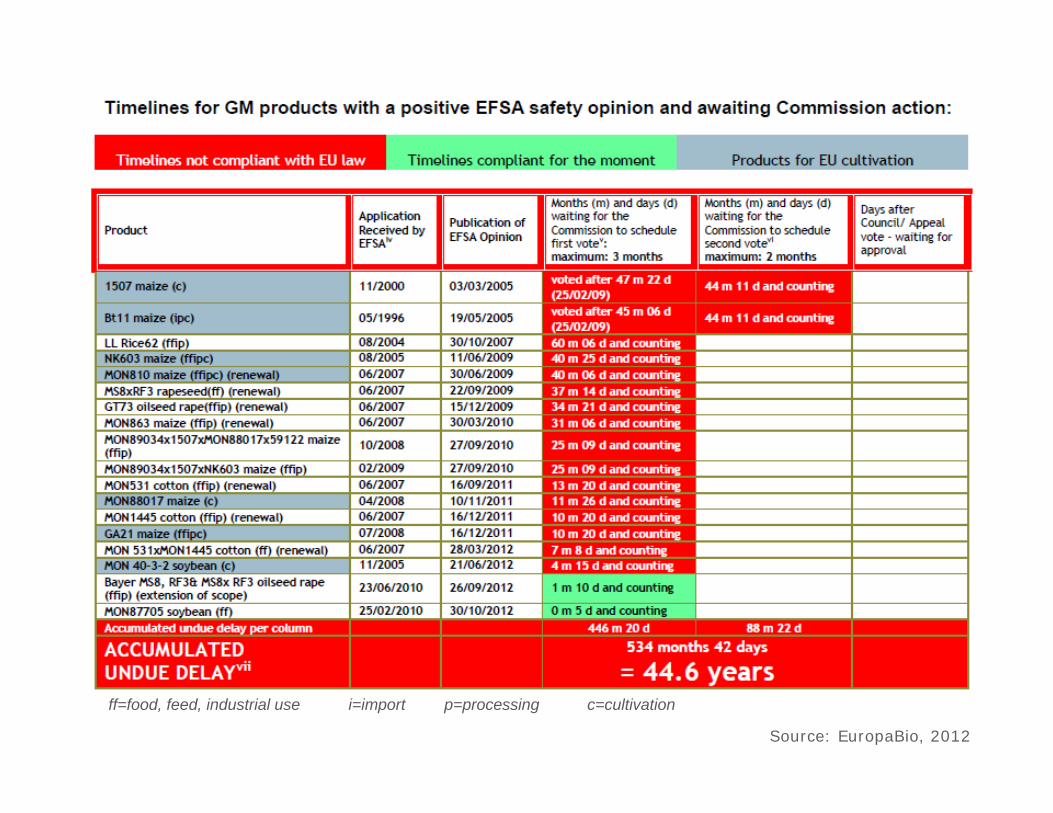
Source: EuropaBio, 2012
ff=food, feed, industrial use i=import p=processing c=cultivation

18
Regulatory Hurdles• The EU process for biotechnology product authorization takes
substantially longer than comparable systems
• For cultivation consideration, the authorization system has never been properly implemented
• Several EU governments vote against EFSA scientific determinations for political reasons
• Every year twice as many biotechnology products enter the system than exit
• New assessment requirements lacking scientific basis are frequently introduced for political reasons
• In 2012, the EU’s Rapid Alert System for Food and Feed detected 40 unauthorized events: 31 rice incidents from China, India and Pakistan, and 9 papaya incidents from Thailand
18

19
High regulatory costs – major marketbarrier for small firms
Brain drain – the best researchers and labs go to more welcoming places
No incentives for SMEs operating in field
Block for certain types of innovation, especially for small market crops or traits
European seed firms competitivenessdecline (access to high-yieldinggermplasm)
Field trial research is significantly lagging
Negative effects of overregulation oninnovation
20
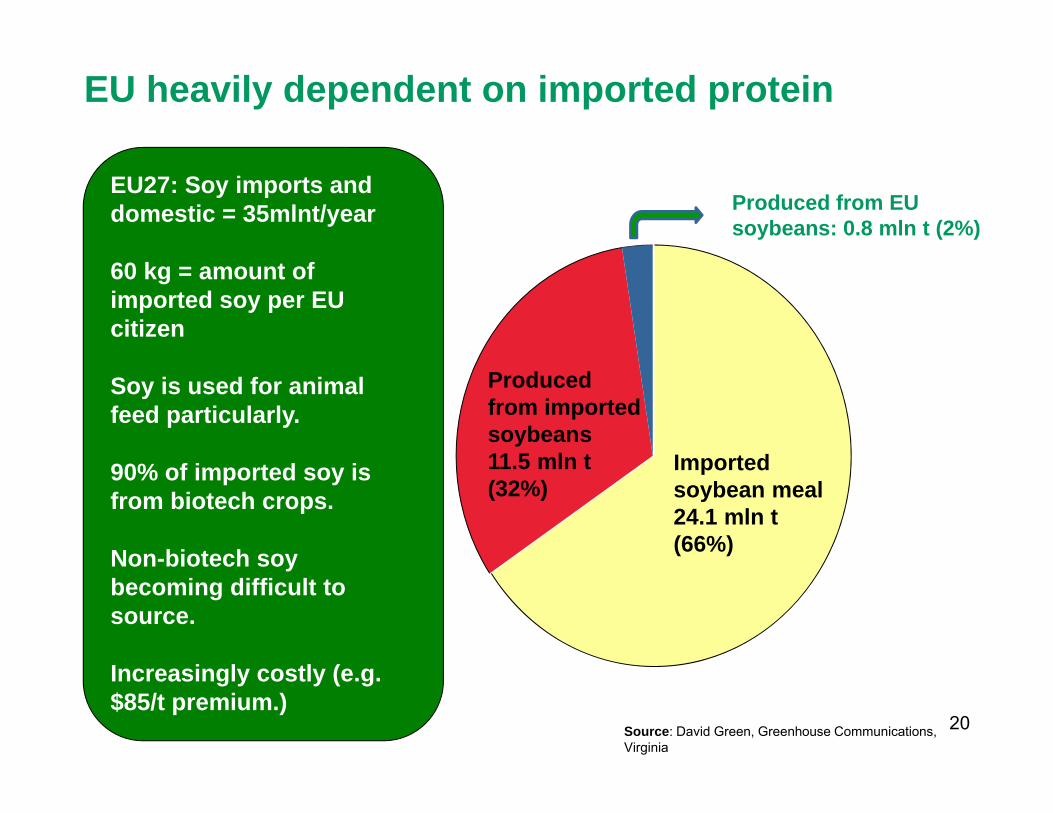
EU heavily dependent on imported protein
Produced from EU soybeans: 0.8 mln t (2%)
Imported soybean meal 24.1 mln t (66%)
Produced from imported soybeans 11.5 mln t (32%)
EU27: Soy imports and domestic = 35mlnt/year
60 kg = amount of imported soy per EU citizen
Soy is used for animal feed particularly.
90% of imported soy is from biotech crops.
Non-biotech soy becoming difficult to source.
Increasingly costly (e.g. $85/t premium.)
Source: David Green, Greenhouse Communications, Virginia

Source: Copa-Cogeca
Trend: EU ‘importing’ more land
Commerce
Bien-être des animaux
Agriculture
Chaîne alimentaire
Environnement0
10
20
30
40
50
1999/2000 2007/2008
Arable land exported
0
10
20
30
40
50
1999/2000 2007/2008
Arable land imported Wheat
Corn
Coarse Grains
Rice
Soya
Palm
Other Oilseeds
Sugar crops
Coffee, Cocoa, Tea
Fruits
Vegetables
Others
EU uses 35 million hectares outside EU to feed 500 million consumers

22
Estimated benefits to EU of adoption of biotechcrops each year
Benefit to EU farmers if they were allowed to grow available GM crops (estimate)€443 and €929 million each year.
Source: The impact of the EU regulatory constraint of transgenic crops on farm income; Julian Park, Ian McFarlane, Richard Phippsand Graziano Ceddia, New Biotechnology; March 2011
Global trends
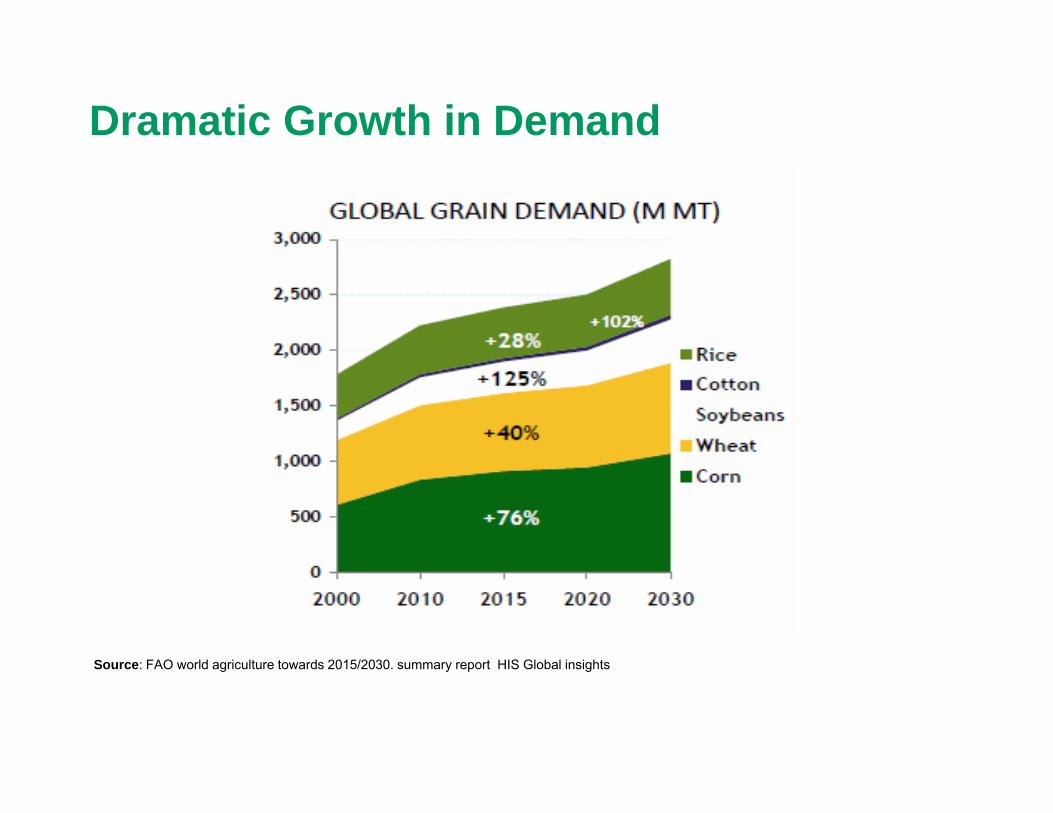
Source: FAO world agriculture towards 2015/2030. summary report HIS Global insights
Dramatic Growth in Demand

Source: W. Jones – OECD -Food security: contribution to the global food supply and the increasing need of biomass for various uses
Slower global output growth

Crop protection – The big picture

Crop protection – The big picture

Source: Trends in Industry R&D – April 2012 PhillipsMcDougall Newsletter – AgriService

Conclusions• Success has led to increased global investment and
adoption
• Most rapidly adopted crop technology in recent history
• Second generation traits are beginning to emerge
• New breeding techniques close to adoption
• Current EU regulatory framework technically workable however political intervention in the process has impeded predictable implementation
• Europe risks becoming innovation backwater
• More international coordination is needed

Thank You!
Special thanks to Filip Cnudde, Dow AgroSciences
EU Government Affairs and Science Policy Leader for the development of this presentation