regulation of vitamin c transport in...
TRANSCRIPT

REGULATION OF VITAMIN C TRANSPORT IN BRAIN
By
Marquicia Regineé Pierce
Dissertation
Submitted to the Faculty of the
Graduate School of Vanderbilt University
in partial fulfillment of the requirements
for the degree of
DOCTOR OF PHILOSOPHY
in
Molecular Physiology & Biophysics
May 2014
Nashville, TN
Approved:
Charles Cobb, PhD
Roger Colbran, PhD
Aurelio Galli, PhD
Kristina Hill, PhD
Danny Winder, PhD

ii
DEDICATION
To God and Family:
Especially my parents, Mark & Regina, for being such a beautiful example of faith, love and strength
And to my siblings, Renyshia, Mark II and Edwin
Dr. Sarah M. Johnson & M. Jean Springs,
Thank you for being there every step of the way

iii
ACKNOWLEDGEMENTS It is with a grateful heart that I acknowledge the many people who have made this dissertation
possible.
First, I would like to thank my mentor, Dr. James May for granting me the opportunity to train in
his laboratory. Thank you for your patience and kind heart. I have learned so many things from
you.
I am incredibly thankful for my dissertation committee: Drs. Charles Cobb, Danny Winder,
Aurelio Galli, Kristina Hill, and Roger Colbran. They have really encouraged me when the
journey became difficult and have challenged me to do my best.
I would like to thank past mentors of the May Laboratory, Drs. Lying Li and Fiona Harrison.
Thank you for your guidance and support. I am also thankful for past members in the lab that
have contributed to the progress of my project, Drs. Zhichao Qu, Huan Qiao, Xiumei Chi,
Richard Whitesell, Seth Weaver and Semiha Dede. A special thanks to Elizabeth Meredith, the
best bay-mate one could ask for. I had the privilege to work with several undergraduates during
my time in the May laboratory: Danielle DiAsio, Laurisa Rodrigues, Amita Raj and L. Nora
Zeidan. Thank you for your hard work and enthusiasm. Also thanks to William Parker, for being
my late-night-at-the-lab working buddy.
I am incredibly thankful to Dr. Masakazu Shiota for always lending an encouraging ear
throughout my studies. I appreciate that your door is always and your support has been
invaluable. Other scientists that have been priceless are Drs. Maureen Hahn and Jana Shirley-
Rice, Beth Ann McLaughlin, and Jeannette Stankowski along with Rebecca Klar and Katherine

iv
Betke. They have provided me with the technical support and skills to tackle the synaptosome
studies. Special thanks to the members of the Galli Lab who allowed me to participate at lab
meetings and especially, Drs. Heiner Matthies and Kevin Erreger for their scientific expertise in
transporter studies.
Dr. Alyssa Hasty has been a great Director of Graduate Studies and has always made sure that
the students obtain the support they need from the program. Thank you Angie Pernell, who
helped with so many aspects of planning and for always listening. I would like to especially
acknowledge the BRET office, especially Drs. Kim Petrie and Roger Chalkley for providing so
many wonderful opportunities to obtain great career advice.
There are countless Nashville friends and families who helped me along this journey with their
encouraging words, needed distractions and uplifting gifts. Words cannot express my sincerest
gratitude.
I would also like to thank my undergraduate mentor, Dr. Richard Gregory and the Ronald E.
McNair coordinators, Dr. Kathryn Wilson and Vicki Bonds for all of your professional support
and encouragement. You have contributed so much to my training as a scientist.
Last, but not least, funding for this research has been provided by the Molecular Endocrinology
Training Grant, 5T32DK07563 (PI: Richard O’Brien), 5 T32 AR59039 (PI: Thomas Ward) and
National Institutes of Health grant NS 057674 (PI: James May).

v
TABLE OF CONTENTS
Page
DEDICATION ............................................................................................................................... ii
ACKNOWLEDGEMENTS ........................................................................................................... iii
LIST OF FIGURES .................................................................................................................... viii
LIST OF TABLES ......................................................................................................................... x
TABLE OF ABBREVIATIONS .................................................................................................... xi
CHAPTER I. INTRODUCTION ................................................................................................................... 1
OVERVIEW OF VITAMIN C IN HEALTH .............................................................................. 1
History of Vitamin C ........................................................................................................... 1 Chemistry of Vitamin C ...................................................................................................... 2 Vitamin C Functions ........................................................................................................... 4
Antioxidant functions ...................................................................................................... 4 Recycling: Vitamins C and E function as co-antioxidants in lipid peroxidation ............... 4 Vitamin C and Tetrahydrobiopterin Recycling ................................................................ 5 Vitamin C serves as a co-factor for monoxygenases and dioxygenases. ...................... 6 Adequate amounts of vitamin C ..................................................................................... 9
State of Vitamin C status in the US and effects on health ............................................... 10 Importance of Vitamin C in the brain ................................................................................ 11
VITAMIN C TRANSPORT REGULATION ........................................................................... 12 Regulation of Brain Vitamin C Uptake ............................................................................. 12
Glucose Transporters ................................................................................................... 12 Sodium Dependent Vitamin C Transporters ................................................................. 13 SVCT2 Background ...................................................................................................... 14
Regulation of Vitamin C Efflux in Brain ............................................................................ 17 Volume-Regulated Anion Channels ............................................................................. 18 Ascorbate-ascorbate homeoexchange ......................................................................... 19 Glutamate-ascorbate heteroexchange ......................................................................... 19
Investigating vitamin C regulation and its effects on behavior ......................................... 20 SPECIFIC AIMS .................................................................................................................. 21
II. MATERIALS AND METHODS ............................................................................................ 22
ANIMAL MODELS ............................................................................................................... 22

vi
Wild type (Gulo+/+; SVCT2 +/+) .......................................................................................... 22 L-gulonolactone oxidase deficient mice (Gulo-/-) .............................................................. 22 Sodium-dependent Vitamin C Transport Type 2 heterozygous mice (SVCT2+/-) ............. 22 L-gulonolactone oxidase and SVCT2 deficient mice (Gulo-/-; SVCT2+/-) .......................... 23
EXPERIMENTAL DIETS ..................................................................................................... 24 BEHAVIORAL ASSESSMENTS .......................................................................................... 25
Weight .............................................................................................................................. 25 Motor & Strength Assessments ....................................................................................... 25
Gait Analysis ................................................................................................................ 25 Locomotor Activity ........................................................................................................ 25 Inverted Screen ............................................................................................................ 25 Rota-rod Activity ........................................................................................................... 26 Wire Hang .................................................................................................................... 26 Horizontal Beam ........................................................................................................... 26 Zero Maze .................................................................................................................... 26 Y-Maze ......................................................................................................................... 27
SYNAPTOSOME PREPARATIONS AND FUNCTIONAL ASSESSMENTS ....................... 28 Crude Synaptosome Preparation ..................................................................................... 28 Enriched Synaptosome Preparation ................................................................................ 29 Synaptosome Fractionation ............................................................................................. 30 Concentration of cytosolic/perisynaptic and presynaptic fractions ................................... 31 Fura Red-AM Assay ......................................................................................................... 31
BIOCHEMICAL ASSESSMENTS ........................................................................................ 32 Tissue Preparations and Assays ..................................................................................... 32
Protein determination ................................................................................................... 32 Western blot analysis ................................................................................................... 33 Genotyping ................................................................................................................... 34
Antioxidant Analysis ......................................................................................................... 35 Vitamin C ...................................................................................................................... 35 Vitamin E ...................................................................................................................... 35 Reduced glutathione .................................................................................................... 35
Oxidative Stress Analysis ................................................................................................ 35 F4-neuroprostanes and F2-isoprostanes ....................................................................... 35
STATISTICAL ANALYSIS ................................................................................................... 36 Behavioral Data .............................................................................................................. 36 Biochemical and oxidative stress markers ...................................................................... 36
III. COMBINED VITAMIN C AND E DEFICIENCY INDUCES MOTOR DEFECTS IN GULO−/−/SVCT2+/− ............................................................................................................... 38
INTRODUCTION ................................................................................................................. 38 PILOT STUDY ..................................................................................................................... 40 EXPERIMENTAL DESIGN AND BEHAVIOR ASSESSMENT SCHEDULE ........................ 43
Experiment 1 Design ........................................................................................................ 43 Experiment 1 Behavior Assesment Schedule .................................................................. 45 Experiment 2 Design ........................................................................................................ 45 Experiment 2 Behavior Assesment Schedule .................................................................. 47
RESULTS ............................................................................................................................ 47 Experiment 1 - Combined vitamin C & E deficiency in Gulo-/- mice ................................. 47
Body Weight and general appearance ......................................................................... 47

vii
Behavioral Assessment ................................................................................................ 47 VC and α-Tocopherol measurements of brain cortex, and liver ................................... 50 Measures of oxidative stress ........................................................................................ 51
Experiment 2 - Combined vitamin C & E deficiency in gulo-/-/SVCT2+/- mice ................... 54 Body Weight and general appearance ......................................................................... 54 Behavioral Assessment ................................................................................................ 54 Vitamin C & E content of brain cortex, cerebellum and liver ........................................ 58 Measures of oxidative stress ........................................................................................ 59
DISCUSSION ...................................................................................................................... 62 IV. VITAMIN C TRANSPORT AT THE NERVE TERMINAL .................................................... 67
INTRODUCTION ................................................................................................................. 67 RESULTS ............................................................................................................................ 70
Neuronal SVCT2 localization ........................................................................................... 70 SVCT2 expression at the cortical pre-synaptic terminal .................................................. 72 SVCT2 function in crude cortical synaptosomes ............................................................. 74
Net VC uptake .............................................................................................................. 74 Kinetic characterization of VC uptake .......................................................................... 76
Net VC efflux out of cortical synaptosomes ..................................................................... 76 Temperature dependence of spontaneous VC efflux ................................................... 76 Hypotonic-Induced VC Efflux ....................................................................................... 79 Glutamate-Induced VC Efflux ....................................................................................... 80
DISCUSSION ...................................................................................................................... 82 V. SUMMARY AND CONCLUSIONS ...................................................................................... 87 BACKGROUND .................................................................................................................... 87 COMBINED VITAMIN C AND E DEFICIENCY ALONG WITH DECREASED SVCT2 EXPRESSION CAUSES MOTOR COORDINATION DEFECTS ......................................... 88
Possible causes of neurobehavioral changes in cellular vitamin C deficiency. ............... 90 Acute generalized (whole body) scurvy ........................................................................ 90 Imbalance in energy homeostasis ................................................................................ 90 Dysregulation of vitamin C uptake via altered neuronal SVCT2 expression impairs neuronal function. ......................................................................................................... 91
TRANSPORT OF VITAMIN C IS TIGHTLY REGULATED AT THE NERVE TERMINAL IN THE CNS ..................................................................................................... 92
What implications does this research have for in vivo models? ....................................... 95 APPENDIX ................................................................................................................................. 97
PILOT STUDY BIOCHEMICAL AND BEHAVIOR ASSESMENT ........................................ 97
REFERENCES ......................................................................................................................... 100

viii
LIST OF FIGURES
Figure Page 1.1 VC Metabolism ................................................................................................................... 3 1.2 Visualization of In situ hybridization staining for SVCT2 gene expression in mouse brain. .................................................................................................................... 15 1.3 Structural model of SVCT2 . ........................................................................................... 17 2.1 Flowchart of Overall Synaptosome Preparation ........................................................... 28 2.2 Flowchart of Synaptosome Fractionation ..................................................................... 31 3.1 Experimental Scheme 1, Combined vitamin C & E deficient diets ............................. 44 3.2 Experimental Scheme 2, Combined vitamin deficiency effects on gulo-/- SVCT2 +/- mice. .................................................................................................................................. 46 3.3 Behavioral phenotype of combined vitamin C & E deficiency .................................... 49 3.4 Combined vitamin C & E deficiency decreases antioxidant levels in cortex and liver ................................................................................................................................... 52 3.5 Vitamin E deficiency induces oxidative stress ............................................................. 53 3.6 Genetic modification of gulo-/-/SVCT2+/- alters behavioral phenotype ........................ 57 3.7 Combined vitamin C & E deficiency decreases antioxidants in cortex, cerebellum and liver in gulo-/-/SVCT2+/- .............................................................................................. 60

ix
3.8 Combined vitamin C & E deficiency increases oxidative stress in cortex and liver in gulo-/-/SVCT2+/- ..................................................................................................... 61 4.1 Immunostaining of the SCG presynaptic bouton ......................................................... 73 4.2 SVCT2 is localized in pre-synaptic fractions ................................................................ 73 4.3 Net Vitamin C uptake in cortical crude synaptosomes ................................................ 75 4.4 Synaptosome membrane integrity is maintained during the course of experiment. 77 4.5 Spontatneous Vitamin C Efflux. ..................................................................................... 78 4.6 Hypotonic solution-induced vitamin C efflux ............................................................... 79 4.7 Glutamate concentration curve. ..................................................................................... 80 4.8 Glutamate Induced Vitamin C Efflux .............................................................................. 81 4.9 Model of Vitamin C Uptake and Efflux at a Representative Nerve Terminal .............. 86
x
LIST OF TABLES Table Page
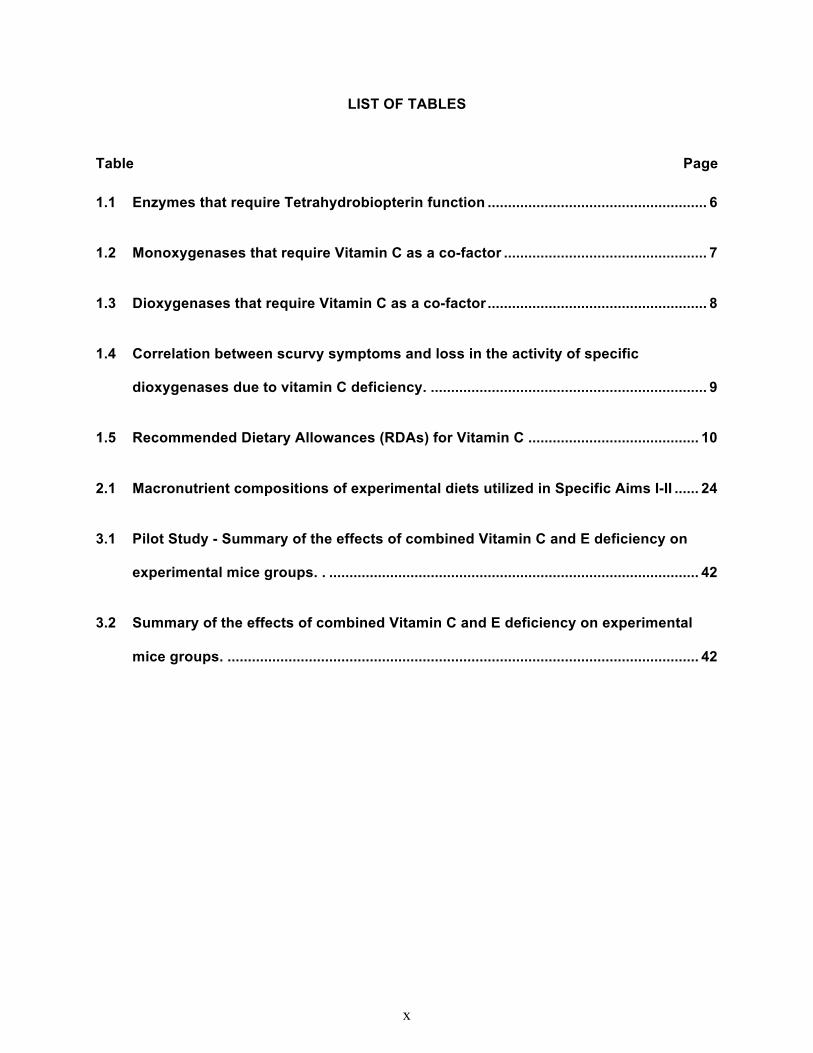
1.1 Enzymes that require Tetrahydrobiopterin function ...................................................... 6 1.2 Monoxygenases that require Vitamin C as a co-factor .................................................. 7 1.3 Dioxygenases that require Vitamin C as a co-factor ...................................................... 8 1.4 Correlation between scurvy symptoms and loss in the activity of specific dioxygenases due to vitamin C deficiency. .................................................................... 9 1.5 Recommended Dietary Allowances (RDAs) for Vitamin C .......................................... 10 2.1 Macronutrient compositions of experimental diets utilized in Specific Aims I-II ...... 24 3.1 Pilot Study - Summary of the effects of combined Vitamin C and E deficiency on experimental mice groups. . ........................................................................................... 42 3.2 Summary of the effects of combined Vitamin C and E deficiency on experimental mice groups. .................................................................................................................... 42

xi
LIST OF ABBREVIATIONS AMP adenosine monophosphate AMPA α-amino-3-hydroxy-5-methyl-4-isoxazolepropionic acid AMPK 5' adenosine monophosphate-activated protein kinase BCA bicinchoninic acid BH4 tetrahydrobiopterin BSA bovine serum albumin CNS central nervous system CSF cerebral spinal fluid DDF dideoxforskolin DHA dehydroascorbic acid DHPG (S)-3,5-dihydroxyphenylglycine DIDS 4,4′- diisothiocyanatostilbene-2,2′-disulfonic acid DMSO dimethyl sulfoxide DOPA 3,4-hydroxyphenyl alanine EAAC1 excitatory amino-acid carrier 1 GABA γ-aminobutyric acid GAPDH glyceraldehyde 3-phosphate dehydrogenase GLAST glutamate aspartate transporter GLT-1 glutamate transporter-1 GLU glutamate GLUT glucose transporter GPβ G-protein β subunit GSH reduced glutathione Gulo gulonolactone oxidase enzyme HEK human embryonic kidney 293 cells HEPES 4-(2-hydroxyethyl)-1-piperazineethanesulfonic acid HPLC high-performance liquid chromatography iGluR inotropic glutamate receptors KRH Krebs-ringer HEPES buffer MDA malondialdehyde mGluR metabotropic glutamate receptor NADPH nicotinamide adenine dinucleotide phosphate-oxidase NET norepinephrine Transporter NMDAR-1 N-methyl-D-aspartate Receptor NPPB 5-nitro-2-(3-phenylpropylamino) benzoic acid PLN phloretin PSD-95 postsynaptic density protein 95 RDA recommended dietary allowance RNS reactive nitrogen species ROS reactive oxygen species SCG superior cervical ganglion
xii
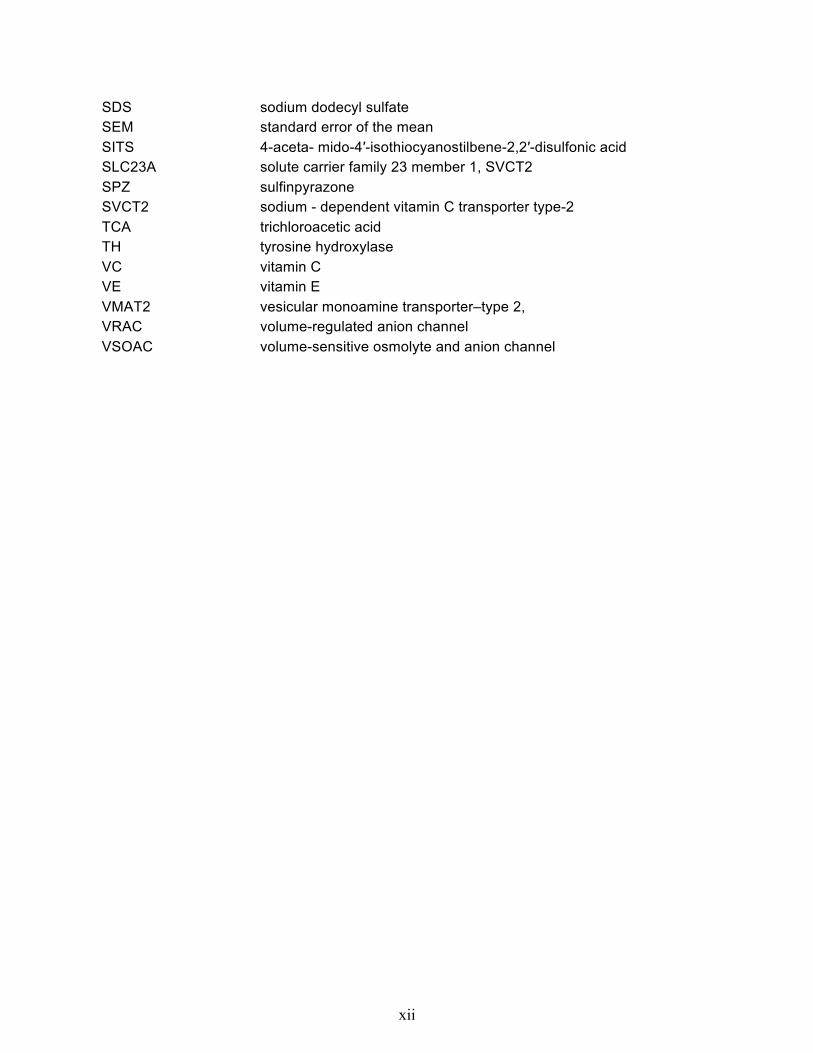
SDS sodium dodecyl sulfate SEM standard error of the mean SITS 4-aceta- mido-4′-isothiocyanostilbene-2,2′-disulfonic acid SLC23A solute carrier family 23 member 1, SVCT2 SPZ sulfinpyrazone SVCT2 sodium - dependent vitamin C transporter type-2 TCA trichloroacetic acid TH tyrosine hydroxylase VC vitamin C VE vitamin E VMAT2 vesicular monoamine transporter–type 2, VRAC volume-regulated anion channel VSOAC volume-sensitive osmolyte and anion channel

CHAPTER I
INTRODUCTION
OVERVIEW OF VITAMIN C IN HEALTH
History of Vitamin C
As with most medical breakthrough discoveries, the beginning of vitamin C (VC) research was
initiated by necessity and urgency. VC is an essential micronutrient for humans as its deficiency
leads to scurvy, a life-threating condition characterized by fatigue, hemorrhages, bleeding gums,
and eventually death. Early accounts of the disease may date as far back as the ancient
Egyptians (1-3). Since then, the cure for scurvy seems to have been discovered, forgotten and
rediscovered numerous times (4). For decades, sailors suffered from the disease after long
voyages at sea. In 1753, James Lind, a Scottish physician aboard the H.M.S. Salisbury,
performed the first recorded clinical trial that investigated whether dietary intervention could
offer his disease-stricken crewmates some reprieve (5). At the time, it was postulated that acid
or malt wort contained the cure (5). He assessed the effects of six different remedies in two
seaman each that spanned six days: [1] a quart of cider, [2] twenty-five drops of elixir vitriol
(mixture of sulfuric acid, alcohol, and aromatics - usually ginger and cinnamon), [3] two
spoonful’s of vinegar, [4] a course of sea-water, [5] two oranges and a lemon, and [6] a nutmeg,
garlic, and mustard seed concoction. He documented that citrus fruits, particularly lemons and
oranges, were the only food that relieved the sailors’ symptoms and afforded them full recovery.
He concluded that an “anti-scorbutic factor” in these food items was the key to preventing
scurvy (6). After decades of the British Navy disregarding Lind’s findings, lemon or lime juices
were finally incorporated into sailors’ rations in the mid-1800’s.

2
It was not until the first half of the 20th century when various conditions began to be described
as diseases due to deficiency of an essential nutrient. In 1912, Casmir Funk proposed a list of
“vitamins”; compounds not synthesized within the body whose deficiency lead to severe
diseases. In this list he used the letter “C” to denote the still unidentified factor known to cure
scurvy (7). In 1929, the factor was isolated and identified. A research team led by the Hungarian
chemist Albert Szent-Gyorgyi described the molecule’s ability to inhibit biological oxidation
reactions (8). It was originally called L-hexuronic acid, but when it was found to have anti-scurvy
activity in animals, the suggestion was made to rename the compound to ascorbic acid, derived
from a- (meaning "no") and scorbutus (scurvy). Szent-Gyorgyi later shared the Nobel Prize for
his discovery of the structure of ascorbic acid.
Both animals and plants need ascorbic acid to live. All plants and most mammals can
synthesize ascorbic acid from glucose in liver. In 1957, Albert Lehninger determined that unlike
most species, humans are not able to perform the crucial last step in the synthesis pathway:
conversion of l-gulono-γ-lactone into ascorbic acid via the gulonolactone oxidase enzyme.
Nishikimi & Yagi (9) discovered that the gene responsible for coding the enzyme is present but
non-functional due to several mutations. In fact, gorillas, chimps, orangutans, some monkeys,
guinea pigs and select bats have this phenotype. Therefore, ascorbic acid is only a true
“vitamin” to a select few species and must simply be considered an essential nutrient in others.
Chemistry of Vitamin C
Ascorbic acid, the reduced form of VC, is the species that contains all known biological activity.
It is water-soluble and at neutral pH it is ionized at the C-3 hydroxyl group (Figure 1.1) (4). At
the heart of its versatility is the capacity to donate up to two electrons to other compounds. The
one-electron oxidation of ascorbic acid results in the relatively inactive ascorbate free radical

3
being formed. NADH- and NADPH-dependent reductases within the cell are able to reduce this
radical back to ascorbic acid. However, when the radical accumulates, two of these molecules
can dismutate, resulting in one molecule of ascorbic acid and one molecule of dehydroascorbic
acid (DHA). Due to the structural stress on the molecule caused by three ketone groups, the
half-life of DHA is very short in physiologic buffers (~6 mins) (10;11). The cell can readily reduce
DHA back to ascorbic acid by glutathione (GSH), thiol transferases or NADPH-dependent
reductases (12). The name ‘vitamin C’ refers to the combination of all three molecules (ascorbic
acid, ascorbate free radical and dehydroascorbic acid) in biological systems since all of the
oxidized states of ascorbic acid are eventually reduced to active form. Over 98% of VC in
plasma exists as ascorbic acid, with dehydroascorbate concentrations on the order of 1-2 µM
(13). Therefore, for simplicity I will refer to ascorbate and ascorbic acid as VC whenever the
distinction between the two is irrelevant.
Figure 1.1: VC Metabolism. Adapted from (4)

4
Vitamin C Functions
Antioxidant functions
Oxidative stress arises from the imbalance of oxidants and antioxidants in favor of the former.
Accumulation of these molecules can lead to damage to lipids, proteins or DNA and can
eventually cause cellular death. VC is one of the most important low molecular weight
antioxidants. Chain-breaking donor antioxidants, like VC, provide an electron, often with an
accompanying proton, to reduce radical species (Figure 1.1). This slows or eliminates
potentially damaging oxidative chain reactions after they begin. VC also acts as a direct
antioxidant to scavenge end-phase oxidants, such as peroxynitrite, which would otherwise
damage cellular proteins. It reacts both with endogenous (14) and exogenous reactive oxygen
species (ROS) and to a certain extent, reactive nitrogen species (15-17).
Recycling: Vitamins C and E function as co-antioxidants in lipid peroxidation
A synergistic relationship exists between water-soluble VC and lipid-soluble vitamin E (VE),
particularly α-tocopherol. While the vitamins partition to different parts of the cell, the phenol
group of tocopherol, the site of antioxidant action, is at the water-membrane interface and easily
accessible to VC (18). VC donates an electron to the α-tocopheroxyl radical and thus restores
its ability to intercept carbon- or oxygen-based radicals in the lipid phase. The physiologic
implications have been demonstrated in numerous in vitro and in vivo studies in which VC has
been shown to preserve or at least spare α-tocopherol in lipid micelles, cell membranes, and in
human erythrocytes. It has been more difficult to show sparing in vivo, but two more recent
studies have strongly suggested this synergism between the two vitamins.
In guinea pigs, which cannot make either vitamin, Hill, et al. (19) found that after 3 weeks of a
VE-deficient diet, as little as 5 days of VC deprivation led to an ascending paralysis and a

5
respiratory death in most animals. This phenotype may reflect the neuronal damage associated
with VE deficiency, not scurvy. No changes were observed in guinea pigs deficient in only a
single vitamin. Surprisingly, although F2-isoprostanes in liver and brain were increased in the
doubly deficient animals, this increase was modest. Nonetheless, subsequent studies (20)
confirmed the neurologic damage due to inflammation by showing widespread destruction of the
long-track neurons in the pons and spinal cord in the doubly deficient animals, but no sign of
damage in either single deficiency. Indeed, VC prevents loss of α-tocopherol and decreases
lipid peroxidation in cultured neuron cells subjected to oxygenated medium (21). Together,
these studies suggested that a modest decrease in CNS VC significantly accelerated VE
deficiency syndrome.
More recently, evidence for a sparing effect of VC on α-tocopherol has been found in human
smokers (22). In this study, smokers were found to have decreased plasma α- and γ-tocopherol
levels that were completely restored to normal after 3 days of supplementation with 500 mg of
VC daily. These results could reflect scavenging of smoke-derived radicals to spare α-
tocopherol, but also support the notion derived from in vitro and animal studies that VC recycles
VE.
Vitamin C and Tetrahydrobiopterin Recycling
VC also recycles an important enzyme cofactor, tetrahydrobiopterin (BH4), thus keeping it in its
reduced state to allow for full catalytic activity (23;24). BH4 reduces Fe3+ back to Fe2+ to maintain
activation and by so doing preserves the catalytic iron of several dioxygenase enzymes in the
active ferrous form (25). Table 1.1 lists known enzymes that require BH4 to function properly.

6
Vitamin C serves as a co-factor for monoxygenases and dioxygenases.
Oxygenases incorporate one or two atoms of dioxygen in a variety of substrates in metabolic
pathways. Monooxygenases are enzymes that incorporate one hydroxyl group as two atoms of
dioxygen are reduced to one hydroxyl group and one H2O molecule by the concomitant
oxidation of NADPH. Dioxygenases are enzymes that incorporate two dioxygen atoms into
substrates (26). Oxygenases are involved in many pathways including catecholamine,
neuropeptide, and collagen synthesis. VC serves as a co-factor for both monooxygenases
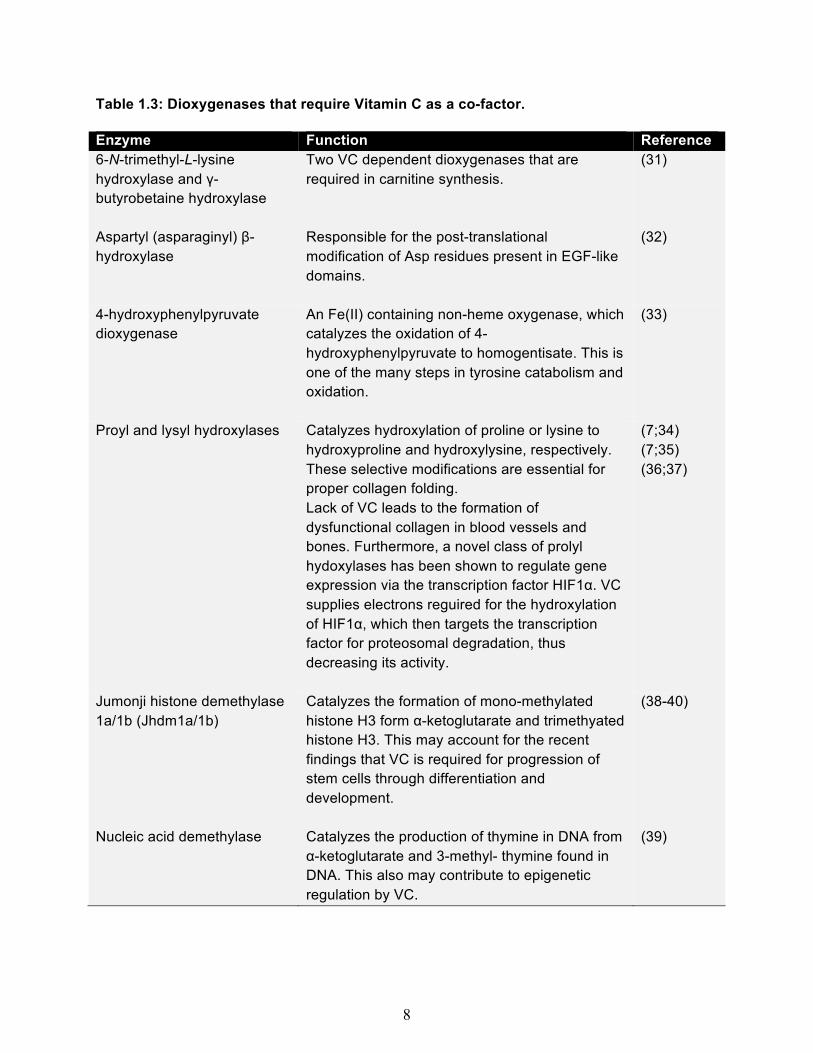
(Table 1.3) and dioxygenases (Table 1.3). Indeed, scurvy is a disease caused by the
malfunction of several key dioxygenases. (Table 1.4).
Table 1.1: Enzymes that require Tetrahydrobiopterin function. Enzyme Function Tyrosine hydroxylase (TH) Responsible of the conversion of tyrosine to 3,4-
hydroxyphenyl alanine (DOPA), the first and rate-limiting step of norepinephrine synthesis
Phenylalanine hydroxylase Catalyzes L-tyrosine from L-phenylalanine. Its deficiency causes phenylketonuria.
Tryptophan hydroxylase First and rate-limiting step in serotonin synthesis, catalyzing the production of 5-hydroxy-tryptophan from L-tryptophan
Alklglycerol monooxygenase Catalyzes the formation of 1-hydroxyalkyl-sn-glycerol from 1-alkyl-sn-glycerol
Nitric oxide synthase Catalyzes production of L-citrulline and nitric oxide from L-arginine and is key for nitric oxide generation

7
Table 1.2: Monoxygenases that require Vitamin C as a co-factor. Enzyme Function Reference Dopamine-β-hydroxylase Catalyzes the conversion of dopamine to
norepinephrine. It is soluble within vesicles and also exists as a constituent of the membranes of secretory vesicles of norepinephrine-producing neurons in the CNS, sympathetic ganglia and adrenal medulla cells. It requires copper as a cofactor and oxygen and VC as co-substrates.
(27;28) (29)
Peptidylglycine α-amidating monoxygenase
Catalyzes the production of α-amidated peptides from neuroendocrine peptides and is crucial for neurotransmitter synthesis as well
(30)
8
Table 1.3: Dioxygenases that require Vitamin C as a co-factor. Enzyme Function Reference 6-N-trimethyl-L-lysine hydroxylase and γ- butyrobetaine hydroxylase
Two VC dependent dioxygenases that are required in carnitine synthesis.
(31)
Aspartyl (asparaginyl) β-hydroxylase
Responsible for the post-translational modification of Asp residues present in EGF-like domains.
(32)
4-hydroxyphenylpyruvate dioxygenase
An Fe(II) containing non-heme oxygenase, which catalyzes the oxidation of 4-hydroxyphenylpyruvate to homogentisate. This is one of the many steps in tyrosine catabolism and oxidation.
(33)
Proyl and lysyl hydroxylases Catalyzes hydroxylation of proline or lysine to hydroxyproline and hydroxylysine, respectively. These selective modifications are essential for proper collagen folding. Lack of VC leads to the formation of dysfunctional collagen in blood vessels and bones. Furthermore, a novel class of prolyl hydoxylases has been shown to regulate gene expression via the transcription factor HIF1α. VC supplies electrons reguired for the hydroxylation of HIF1α, which then targets the transcription factor for proteosomal degradation, thus decreasing its activity.
(7;34) (7;35) (36;37)
Jumonji histone demethylase 1a/1b (Jhdm1a/1b)
Catalyzes the formation of mono-methylated histone H3 form α-ketoglutarate and trimethyated histone H3. This may account for the recent findings that VC is required for progression of stem cells through differentiation and development.
(38-40)
Nucleic acid demethylase Catalyzes the production of thymine in DNA from α-ketoglutarate and 3-methyl- thymine found in DNA. This also may contribute to epigenetic regulation by VC.
(39)

9
Table 1.4: Correlation between scurvy symptoms and loss in the activity of specific dioxygenases due to vitamin C deficiency. Adapted from (31) Symptom Putative Target affected Dioxygenase(s) Involved Hemorrhages/ Spots Blood vessels
Various collagen types (III,IV)
Prolyl/lysyl hydroxylase
Rotten or loose teeth Dentin Various collagen types (I, II, IV)
Prolyl/lysyl hydroxylase
Rigid tendons Various collagen types (I, XII, XIV)
Prolyl/lysyl hydroxylase
Bone/ Cartilage fragility Various collagen types (I, II, IX, X, XI) Prolyl/lysyl hydroxylase Lassitude
Carnitine biosynthesis
Trimethyl-lysine dioxygenase butyrobetaine dioxygenase
Vision problems Synthesis of vitamin A β-carotene 15-15’ dioxygenase
Neurological disorders Noradrenaline/ dopamine biosynthesis
Tyrosine hydroxylase dopamine hydroxylase
Adequate amounts of vitamin C
Due to the critical roles played by VC, obtaining and sustaining adequate cellular concentrations
is essential. In humans, a physiologic deficiency of VC will occur in about 90 days when normal
body stores, usually ~1500 mg, decrease below 350 mg or serum levels reach <11.4 µM (2).
As little as 10 mg/day of VC is needed to maintain stores > 11.4 µM and prevent scurvy,
however saturation of plasma and tissue levels occurs at 200 mg/day (70 µM) (41). Excess
amounts will be excreted as unmetabolized VC in the urine (42). Fruits and vegetables are the
best sources of VC. Citrus fruits, tomatoes and tomato juice, and potatoes are major
contributors of VC to the American diet (43). Currently in the U.S., the Recommended Dietary

10
Allowance (RDA) for VC is 120% of the estimated average requirement and therefore is 90
mg/day for adult men and 75 mg/day for adult women. This concentration was set based on
levels needed to maintain near-maximal neutrophil concentration with minimal urinary excretion
of VC (42). There is growing evidence that the amount needed for optimal health is far more
than that. In scenarios where there is an increase of oxidative stress and the subsequent
metabolic turnover of VC, such as smoking, lactation, pregnancy, the requirement is increased
by 35 mg/day (43).
Table 1.5: Recommended Dietary Allowances (RDAs) for Vitamin C. Taken from (41) Age Male Female Pregnancy Lactation 0–6 months 40 mg* 40 mg* 7–12 months 50 mg* 50 mg* 1–3 years 15 mg 15 mg 4–8 years 25 mg 25 mg 9–13 years 45 mg 45 mg 14–18 years 75 mg 65 mg 80 mg 115 mg 19+ years 90 mg 75 mg 85 mg 120 mg Smokers
Individuals who smoke require 35 mg/day more VC than nonsmokers.
* Adequate Intake (AI)
State of Vitamin C status in the US and effects on health
In the 2012 National Report of Biochemical Indicators of Diet and Nutrition in U.S Population,
(http://www.cdc.gov/nutritionreport/pdf/Nutrition) serum VC concentrations were reported to be
deficient (< 11.4 µM) in 6% of the population 6 years and older. This is estimated to be 15.8
million people. At least the same amount of people had low (11.4 - 23 µM) VC levels. Although
overt scurvy manifestation is rare, it is likely that this population may develop a form of latent
scurvy characterized by fatigue, dull aches and irritability (2;44). Furthermore, since scurvy is
relativity uncommon in the US, occasionally it is misdiagnosed based on symptoms. Low levels
11
of VC can lead to loss of bone mass, inadequate collagen formation, hemorrhaging, decline in
cellular energy status, impaired neurotransmitter production and eventually death (45). This is
especially relevant for individuals with low intake due to psychiatric disorders or alcoholism that
present to clinicians with rheumatologic or dermatologic complaints that mask the underlying
signs of early scurvy (45-47). Therefore, awareness of the disease is essential to make the
proper diagnosis.
Importance of Vitamin C in the brain
The brain is perhaps one of the most sheltered organs during progression of VC deficiency,
having both some of the highest levels of VC in any organ, achieved by a unique two-step
concentrative mechanism (discussed below). For example, whereas cells within most organs
have VC levels of 1-2 mM, those within brain can be as high as 4-6 mM (48). Further, neurons
have rates of oxidative metabolism as high at ten-fold those of other tissues (49) and thus are
likely to generate more ROS than other cell types. The burden of oxidative stress warrants the
high antioxidant VC levels in neural tissues. This may be especially important in
neurodegenerative diseases such as Alzheimer’s, Huntington’s, and Parkinson’s, in which there
is oxidative stress due to secondary inflammation (50;51). Another factor in both health and
disease is likely the role of VC as co-factor for several crucial dioxygenase enzymes in the CNS,
as described above. Finally VC has been implicated in neurotransmitter regulation (52), as will
be discussed below.
However, there is a huge gap in the understanding the role of VC in brain health and disease
due to the lack of information on the mechanisms involved in tissue distribution and
homeostasis. It is this lack that prompted the selection of this thesis project, first to determine
whether vitamins C and E interact to support behavior in vivo, then to dissect potential
mechanisms at the sub-cellular level by studying VC uptake, efflux, and metabolism in the

12
neuronal synapse. Key to both of these topics is what is known of brain and VC homeostasis.
Although most information relates to VC uptake by the brain and CNS, our work also suggests a
role for efflux in of the vitamin, at least in synapses. Accordingly the next sections will discuss
VC transport regulation, with emphasis on the brain and neurons.
VITAMIN C TRANSPORT REGULATION
Plasma VC levels depend on dietary absorbance and/or hepatic synthesis and ultimately
determine the concentration available for all tissues (41;42). Therefore all species depend on
transport of VC across cell membranes for redistribution into other tissues. VC transport
between tissues is a balance of uptake and efflux. While VC uptake mechanisms are well
established, identification of the proteins mediating efflux still remains elusive. The brain, as
noted above, is unique among organs in having a two-step uptake mechanism that derives from
its transporter, the Sodium-dependent VC Transporter type 2 (SVCT2) (53). Although the
SVCT2 is likely to be the primary mechanism by which the brain acquires VC, there is another
mechanism, as described next.
Regulation of Brain Vitamin C Uptake
Glucose Transporters
DHA represents less than 5% of total VC in plasma and can be transported across the
membrane via glucose transporters (54). A number of GLUTs: GLUT1, GLUT3, and GLUT4
(55;56) recognize DHA because of structural similarity to glucose. However, these proteins do
not recognize ascorbic acid. Facilitative transport of DHA is similar to glucose in that it is
transported down a concentration gradient into cells. The affinity of glucose transporters for
DHA is similar to that for glucose (57;58), thus, there is competition between the two substrates.

13
At normal physiologic glucose concentrations (5 mM), DHA uptake is likely very low, considering
that its extracellular concentrations are very low micromolar, as noted previously. Although DHA
can be transported across the blood-brain barrier when concentrations are high (59),
competition with glucose deters this from being is not a major mechanism for VC entry into the
brain (53). However, once DHA is in the cells, reduction mechanisms convert DHA to ascorbic
acid very efficiently (17;60) and this mechanism could become important in cases of severe
oxidative stress, such as in the periumbral area of stroke, where there is reperfusion after
ischemia. Nonetheless, most brain VC under normal circumstances is acquired on the SVCT2,
as described next.
Sodium Dependent Vitamin C Transporters
Ascorbic acid represents ~95% of total VC in plasma and is transported into tissues solely by
SVCT’s. The Hediger group cloned two SVCT type transporters (61) from the solute carrier (Slc)
transporter family. The Slc23a1 gene encodes the SVCT1 protein, and Slc23a2 encodes the
SVCT2 protein. The two transporters share 65% amino acid identity with minor differences
between species (61). They both have 12 trans-membrane spanning motifs with the N- and C-
termini located on the cytoplasmic side of the membrane and several putative sites for post-
translational modification. These transporters are stereospecific for L-ascorbic acid and are
driven by the Na+ electrochemical gradient. In a two- step manner, SVCT1 and SVCT2 work in
concert to maintain proper levels of VC within the body. These isoforms have different tissue
distribution, and functional properties depending on the cell, tissue and species.
SVCT1 (slc23A1) mRNA is found in epithelial tissues involved in VC absorption (intestine) and
re-absorption (kidney). SVCT1 has a low affinity for VC (apparent Km 66-237 µM) and higher
capacity (Vmax) compared to SVCT2 (62). SVCT1-deficient mice have VC levels about half
normal, but appear to develop normally and have sufficient VC tissue levels to prevent scurvy.

14
Once VC is in the plasma, SVCT2 helps distribute the vitamin to all of the other cell types. Two
other SVCT orphan transporters (SVCT3 and SVCT4) have been cloned, but are most likely
nucleobase transporters and are not known to transport VC (63).
SVCT2 Background
SVCT2 depends on Na+ ions as replacement with K+, Li+ or choline abolishes uptake (64). The
transport cycle for SVCT2 is characterized by the transport of 2 molecules of Na+ for every one
molecule of VC. Na+ increases the transport rate of VC in a cooperative manner by decreasing
the transport Km without affecting the Vmax. Therefore, SVCT2 (in most cells) has a relatively
high affinity for VC (Km = 20-40 µM), reflective of plasma concentrations (30-50 µM). Godoy, et
al. showed that Ca2+ and Mg2+ ions are also required for SVCT2 function (65).
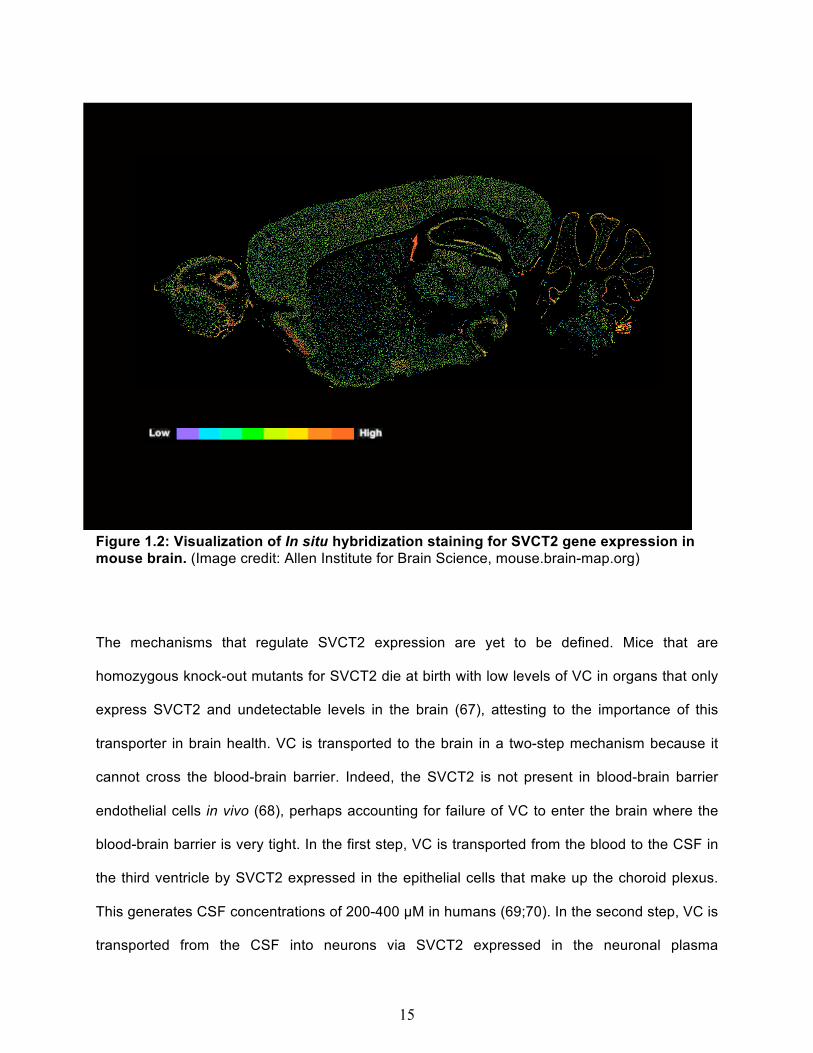
SVCT2 (slc23a2) mRNA and protein expression is evident in liver, lung, placenta, eye, and
spleen. However, the highest expression is in brain in areas of high neuronal density like the
hippocampus and cerebellum (66). The heterogeneous distribution of SVCT2 in the brain can
be appreciated in the visualization of SVCT2 gene expression provided by the in situ
hybridization staining depicted in the Allan Brain Atlas (Figure 1.2).
15
Figure 1.2: Visualization of In situ hybridization staining for SVCT2 gene expression in mouse brain. (Image credit: Allen Institute for Brain Science, mouse.brain-map.org)
The mechanisms that regulate SVCT2 expression are yet to be defined. Mice that are
homozygous knock-out mutants for SVCT2 die at birth with low levels of VC in organs that only
express SVCT2 and undetectable levels in the brain (67), attesting to the importance of this
transporter in brain health. VC is transported to the brain in a two-step mechanism because it
cannot cross the blood-brain barrier. Indeed, the SVCT2 is not present in blood-brain barrier
endothelial cells in vivo (68), perhaps accounting for failure of VC to enter the brain where the
blood-brain barrier is very tight. In the first step, VC is transported from the blood to the CSF in
the third ventricle by SVCT2 expressed in the epithelial cells that make up the choroid plexus.
This generates CSF concentrations of 200-400 µM in humans (69;70). In the second step, VC is
transported from the CSF into neurons via SVCT2 expressed in the neuronal plasma
16
membrane. This two-step mechanism contributes to neuronal VC concentration of ~3-10 mM,
depending on neuronal density (71). Indeed, although neurons express the SVCT2 in
abundance, glial cells do not express the protein in vivo, and thus likely have much lower VC
contents (48).
Currently, there are no biochemical or structural data for SVCT2 due to the fact that purified
proteins have not been obtained. Primary amino acid sequence and Western blot analysis is the
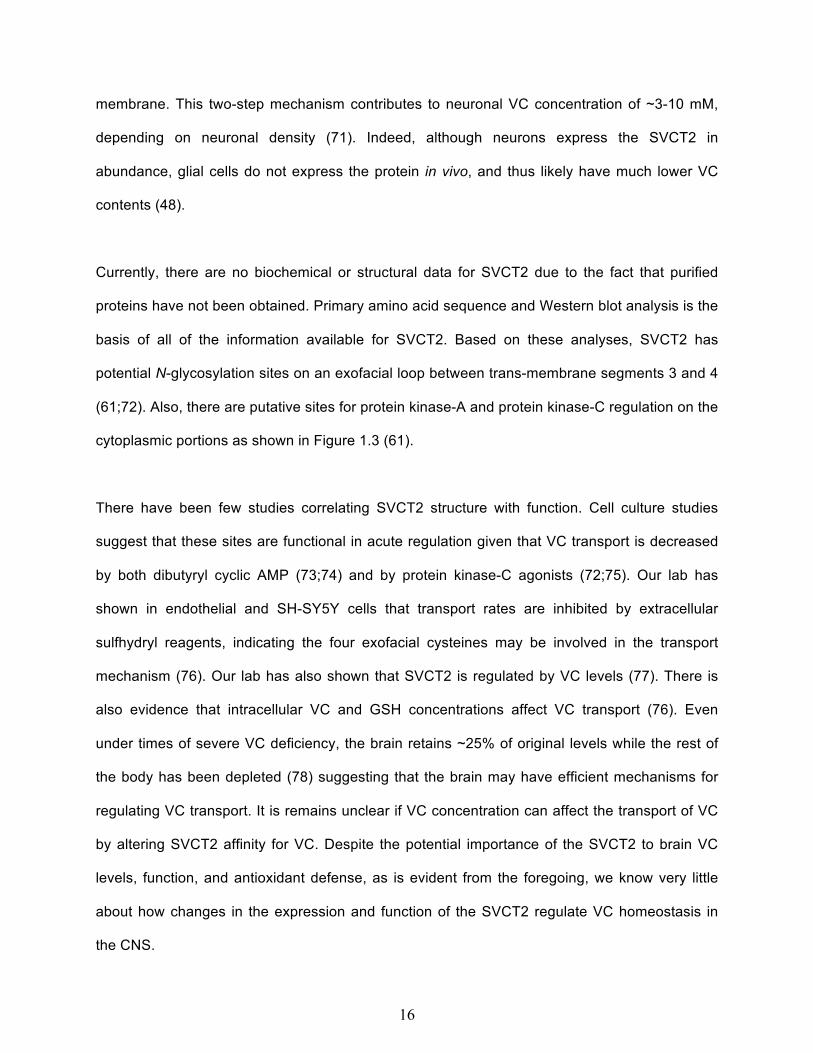
basis of all of the information available for SVCT2. Based on these analyses, SVCT2 has
potential N-glycosylation sites on an exofacial loop between trans-membrane segments 3 and 4
(61;72). Also, there are putative sites for protein kinase-A and protein kinase-C regulation on the
cytoplasmic portions as shown in Figure 1.3 (61).
There have been few studies correlating SVCT2 structure with function. Cell culture studies
suggest that these sites are functional in acute regulation given that VC transport is decreased
by both dibutyryl cyclic AMP (73;74) and by protein kinase-C agonists (72;75). Our lab has
shown in endothelial and SH-SY5Y cells that transport rates are inhibited by extracellular
sulfhydryl reagents, indicating the four exofacial cysteines may be involved in the transport
mechanism (76). Our lab has also shown that SVCT2 is regulated by VC levels (77). There is
also evidence that intracellular VC and GSH concentrations affect VC transport (76). Even
under times of severe VC deficiency, the brain retains ~25% of original levels while the rest of
the body has been depleted (78) suggesting that the brain may have efficient mechanisms for
regulating VC transport. It is remains unclear if VC concentration can affect the transport of VC
by altering SVCT2 affinity for VC. Despite the potential importance of the SVCT2 to brain VC
levels, function, and antioxidant defense, as is evident from the foregoing, we know very little
about how changes in the expression and function of the SVCT2 regulate VC homeostasis in
the CNS.
17
Figure 1.3: Structural model of SVCT2 based on its hydropathy profile. Taken from (79) Schematic diagram based on the proposed sequence and hydropathy analysis of the human SVCT2 (64). The human SVCT2 is predicted to have 12 membrane-spanning regions with intracellular amino (NH2-) and carboxy (HOOC-) termini. Locations of potential extracellular glycosylation sites are noted in brown, cysteine residues are noted in green and sites for protein kinase C phosphorylation are noted in yellow.
Regulation of Vitamin C Efflux in Brain
The extracellular concentration of VC in the CSF has been shown to have significant impact on
physiologic functions as discussed later in this chapter. Simple diffusion of VC out of cells
across the plasma membrane is not thermodynamically probable due its size and negative
charge. Furthermore, although DHA is more hydrophobic than VC and could exit on glucose
transporters, DHA intracellular concentrations are low (12) and not likely to be the source of
extracellular VC. As aforementioned, VC uptake is homeostatically regulated and there is
increasing evidence that VC efflux mechanisms are regulated as well. Even though there has

18
been very little research devoted to elucidating these efflux mechanisms, a few possible
pathways have arisen including: [1] volume-sensitive anion channels, [2] ascorbate-ascorbate
homeoexchange, and [3] glutamate-ascorbate heteroexchange.
Volume-Regulated Anion Channels
A number of physiologic scenarios can cause cells to swell, during which the intracellular
volume increases. Volume-Sensitive Osmolyte and Anion Channels (VSOACs) and Volume-
Regulated Anion Channels (VRACs) are anion channels located in the plasma membrane that
mediate the compensatory decrease of intracellular volume and prevent the cell from bursting.
While the molecular identities of the channels are uncertain (80), electrophysiological studies
have shown that VC may be transported through these types of channels (81). This type of VC
efflux mechanism has been mostly studied in neurons and astrocytes and has received the
most experimental support out of the three mechanisms mentioned (82;83). A variety cell types
including hepatocyte-like HepG2 cells (84), coronary artery endothelial cells (85), K562 cells
(86), astrocytes (87), and SH-SY5Y neuroblastoma cells (83) have shown VC efflux that is
sensitive to anion channel blockers, suggesting that such channels facilitate this pathway.
These studies use generic anion channel inhibitors such as 4,4′- diisothiocyanatostilbene-2,2′-
disulfonic acid (DIDS) and 4-aceta- mido-4′-isothiocyanostilbene-2,2′-disulfonic acid (SITS), and
the VSOAC-inhibitors dideoxforskolin (DDF) and 5-nitro-2-(3-phenylpropylamino) benzoic acid
(NPPB). More relevant to the likely function of these channels in cells, it has also been shown in
astrocytes that hypotonic solutions can stimulate VC release in astrocytes by cell swelling (88).

19
Ascorbate-ascorbate homeoexchange
The ascorbate-ascorbate homeoexchange theory is based on the observation that the addition
of extracellular VC prompts the release of preloaded intracellular VC from adrenal cortical cells
(89). Our lab has published a similar study using EA.hy926 endothelial cells, in which dose-
dependent release of preloaded 14C-VC was induced by the addition of unlabeled VC (90). A
single transporter capable of this moving VC both in and out of cells has not been identified. An
alternative explanation for this phenomenon is that SVCT2 is bidirectional, depending on local
conditions. While this activity is characteristic of facilitative diffusion transporters, such as the
GLUTs, it is less likely to be a property of an energy and Na+-dependent transporter, such as
the SVCT2. Further research is necessary to determine which, if any, physiologic conditions can
allow this type of function.
Glutamate-ascorbate heteroexchange
The excitatory neurotransmitter L-glutamate activates glutamate receptors on the cell surface
and synaptic cleft. Proper clearance of glutamate via uptake is essential as over-activation of
these receptors causes oxidative stress and excitotoxicity. It has been shown that the uptake of
extracellular glutamate stimulates VC efflux in astrocytes (52). Glutamate uptake is also
associated with ischemia-induced efflux of VC from neurons and glia (71;91;92). This data
suggests that these two processes, glutamate uptake and VC efflux, may be linked in a single
mechanism. The glutamate-ascorbate heteroexchange theory postulates that glutamate uptake
is dependent on VC release and that there is a heteroexchange of the two molecules within the
intracellular and extracellular space via one or more transporters (52;93;94). However, while
Wilson and colleagues confirmed that glutamate increases VC efflux from cerebral astrocytes,
intracellular VC did not have an effect on glutamate uptake, suggesting that heteroexchange
may not be the correct mechanism (95). Later, Wilson concluded that the release of VC was
attributed to glutamate-induced cell swelling followed by opening of the aforementioned anion

20
channels (88). Our lab found similar results in SH-SY5Y neuroblastoma cells: glutamate
caused release of intracellular VC, but neither intra- nor extracellular VC affected glutamate
uptake, and does not support a heteroexchange mechanism (83).
Investigating vitamin C regulation and its effects on behavior
Rebec noted that extracellular VC had an effect on the behavior in rats. In electrophysiological
studies he observed that increased extracellular VC stimulated behavior and also that
conversely, a decrease in extracellular VC inhibited behavior (96;97). It has long been
suggested that depressive behavior and despair is one of the earliest signs of scurvy (2). There
is now emerging evidence in rodents and humans that VC supplements can alter behavior with
specific reference to mood. In several studies in stressed mice (despite their ability to make VC),
supplements of the vitamin improved behavior and synergized with the effect of fluoxetine in the
tail suspension test, considered am appropriate test of behavioral despair (98-100). Two human
studies also support a role for replenishing VC to improve mood and depression. In the first,
college students known to be very low in VC levels due to poor dietary intake had improved
mood following VC supplements in a randomized controlled clinical trial (101). Further,
hospitalized patients supplemented with VC at a dose of 1 gram daily had significantly improved
mood and decreased depression compared to a matched control group of patients who received
an identical tablet containing vitamin D. The physiologic implications of VC transport and efflux
mechanisms are that not only VC concentrations are carefully regulated but are also important
for molecular neuronal function, cognition and behavior. Dysregulation of VC may lead to an
impaired neurobehavioral phenotype. One way to gain insight on VC’s role in behavior is to
elucidate its regulation in the highly specialized region of the neuron, the synaptic terminal,
where the biochemical signal propagation occurs. VC regulation in this region has received little
attention. Thus, I have conducted the following studies for my thesis and investigated whether

21
dysregulation of VC leads to an altered neurobehavioral phenotype and also whether and how
VC is regulated at the nerve terminal.
SPECIFIC AIMS
Specific Aim 1: To determine if and by what mechanism increased oxidative stress by combined
vitamin C and E effects neuronal SVCT2 function and/or expression.
Specific Aim 2: To determine if and by what mechanism increased oxidative stress effects
vitamin C regulation at the nerve terminal.

22
CHAPTER II
MATERIALS AND METHODS
ANIMAL MODELS
Wild type (Gulo+/+; SVCT2 +/+)
Mice denoted as “wild-type mice” are from C57BL/6J background. These mice were originally
obtained from Jackson laboratories (stock #000664) and a colony was maintained in-house. All
animals were housed in tub cages in a temperature- and humidity-controlled vivarium on a
12:12-h light:dark cycle with lights on at 6AM. All procedures conformed to Institutional IACUC
guidelines. Mice had free access to food and water for the duration of experiment.
L-gulonolactone oxidase deficient mice (Gulo-/-)
Mice heterozygous for the gulonolactone oxidase gene were originally obtained from Mutant
Mouse Regional Resource Centers (http://www.mmrrc.org, #000015-UCD) and maintained on a
C57BL/6J background. Gulo-/- mice are unable to synthesize VC and were supplied with 0.33g/L
VC in their drinking water except during experimental manipulations. This supplementation level
provides adult (non-pregnant) gulo−/− mice with approximately wild-type levels of VC in tissues
(102;103). To minimize oxidation of VC, deionized water was supplemented with 0.01 mmol/L
EDTA.
Sodium-dependent Vitamin C Transport Type 2 heterozygous mice (SVCT2+/-)
Mice that were heterozygous for slc23a2 gene that encodes for SVCT2 mice were originally
provided by Dr. Robert Nussbaum on the 129/SvEvTac background and were backcrossed more
than 10 generations to the C57BL/6J background as described (104).

23
L-gulonolactone oxidase and SVCT2 deficient mice (Gulo-/-; SVCT2+/-)
To enable both systemic and intracellular VC depletion, gulo-/- mice were crossed with mice
lacking one allele of the SVCT2 (SVCT2+/-) (67) to generate gulo-/-/SVCT2+/+ ; gulo-/-/SVCT2+/-
and gulo-/-/SVCT2/- littermates. These were bred separately from both the Gulo+/+ and SVCT2+/+
groups.
Genotypes of each mouse were confirmed using PCR as outlined in genotyping.
All animals were housed in tub cages in a temperature- and humidity-controlled vivarium on a
12:12-h light:dark cycle with lights on at 6AM. All procedures conformed to Institutional IACUC
guidelines. Mice had free access to food and water for the duration of experiment.

24
EXPERIMENTAL DIETS
Table 2.1: Macronutrient compositions of experimental diets utilized in Specific Aims I-II. Normal Chow Western Diet*
(VE+) Western Diet* (VE-)
Supplier Southern Agriculture Harlan Teklad Harlan Teklad Catalog No. 5001 TD.07310 TD.07310 Macronutrient (% Calories Provided)
Fat 12.1 33.6 33.6 Protein 28.0 17.1 17.1 Carbohydrate 59.8 49.3 49.3 Lard -- 16 16** Sucrose 3.7 34 34 Cholesterol 0.2 0.2 Vitamin E, IU/kg 49 50-150 0 Vitamin C, mg/gm 0 0 0 *An atherogenic diet **“Vitamin-Free” Test Casein (alcohol-extracted) and tocopherol-stripped lard are used to limit endogenous vitamin E Normal rodent chow that contained essentially no VC and 42 IU/kg of VE (total tocopherols) (Lab Diet, #5001). VE-deficient and supplemented diets were custom made by Harlan Teklad (TD.07310 and TD.07311 respectively). Western diet (16% lard, 34% sucrose, 0.2 cholesterol), (TD.07310)

25
BEHAVIORAL ASSESSMENTS
Weight
Scurvy in mice typically manifests after 5-6 weeks of VC deprivation (102;103) and early
signs include weight loss. Mice were weighed on a standard gram scale twice per week and
observed for signs of overt scurvy.
Motor & Strength Assessments
Gait Analysis
Shorter stride length can be indicative of muscle weakness or ataxia. To assess this, hind-foot
printing was performed to monitor changes in stride length. Prior to the session, non-toxic ink
was applied to the hind paws of the mice. The mice were then allowed to walk freely along a
narrow 5-inch corridor lined with paper. Average stride length was calculated as the distance
between two consecutive footprints, averaged from 3 strides as described (103;104).
Locomotor Activity
In each 10 min session, the mice were allowed to individually explore an open 27.9 X 27.9 cm
chamber (Med Associates, OFA-510). Locomotor activity (distance traveled and velocity) was
automatically recorded by the breaking of infra-red beams as described (103). After each mouse
the chamber was cleaned with 10% alcohol solution. Mice were tested in the same chamber for
their repeated trials.
Inverted Screen
Mice were assessed for general muscle grip strength in the inverted screen test. In each 5 min
trial, mice were placed on a one-centimeter wire mesh and slowly inverted completely over a
collection box. The latency to fall was recorded for each mouse.
26
Rota-rod Activity
All groups were tested for motor coordination on the Rota-rod. Mice with severe coordination
problems will have difficulty remaining on the Rota-rod even at low speeds. Performance
generally improves across subsequent trials; therefore a training session was conducted. In each
5 min trial, mice were placed on a ridged, rotating beam that slowly accelerated from 4 rpm to 40
rpm. The time it took the mouse to fall was recorded. If the mice simply clung to the beam and
rotated along with it without falling this was recorded as a ‘rotation’.
Wire Hang
In each 60 sec trial, mice were placed to hang by their front legs in the middle of a plastic wire
suspended horizontally between two platforms. A score indicating the activity of the mouse is
displayed as: 4 = stabilized itself within 30 sec; 3.5 = stabilized itself within 60 sec; 3 = attempts
to stabilize itself but fails to do so within 60 sec; 2 = remains hanging from the wire for 60 sec; 0
= falls from wire within 60 sec.
Horizontal Beam
Similar to the wire hang, in each 60 sec trial, mice were placed to hang by their front legs in the
middle of a plastic beam suspended horizontally between two platforms. A score indicating the
activity of the mouse is displayed as the following: 4 = stabilized itself to a four-paw grip position
within 30 sec; 3.5 = stabilized itself to a four-paw grip position within 60 sec; 3 = attempts to
stabilize itself but fails to do so with 60 sec; 2 = remains hanging from the beam for 60 sec; 0 =
falls from wire within 60 sec as described (103).
Zero Maze
Anxiety was assessed by exploration patterns in the elevated zero maze. In each 5 min session,
mice were placed on an elevated circular platform with two opposite quadrants enclosed and two

27
open. Mice were allowed to explore the maze and activity was recorded with an overhead
camera and analyzed with Any-Maze computer software (Stoelting, USA).
Y-Maze
In each 5 min session, mice were placed in one arm of a clear Plexiglas Y-maze consisting of
three identical arms void of visual cues. As the mouse explored the maze, the sequence of
consecutive individual arm entries was recorded with an overhead camera. An alternation was
recorded as a ratio of the number of three non-repeated entries divided by the total number of
entries minus two.
Behavioral Assessments and data analysis were performed in part through the use of the Murine
Neurobehavior Core Laboratory at the Vanderbilt University Medical Center.
28
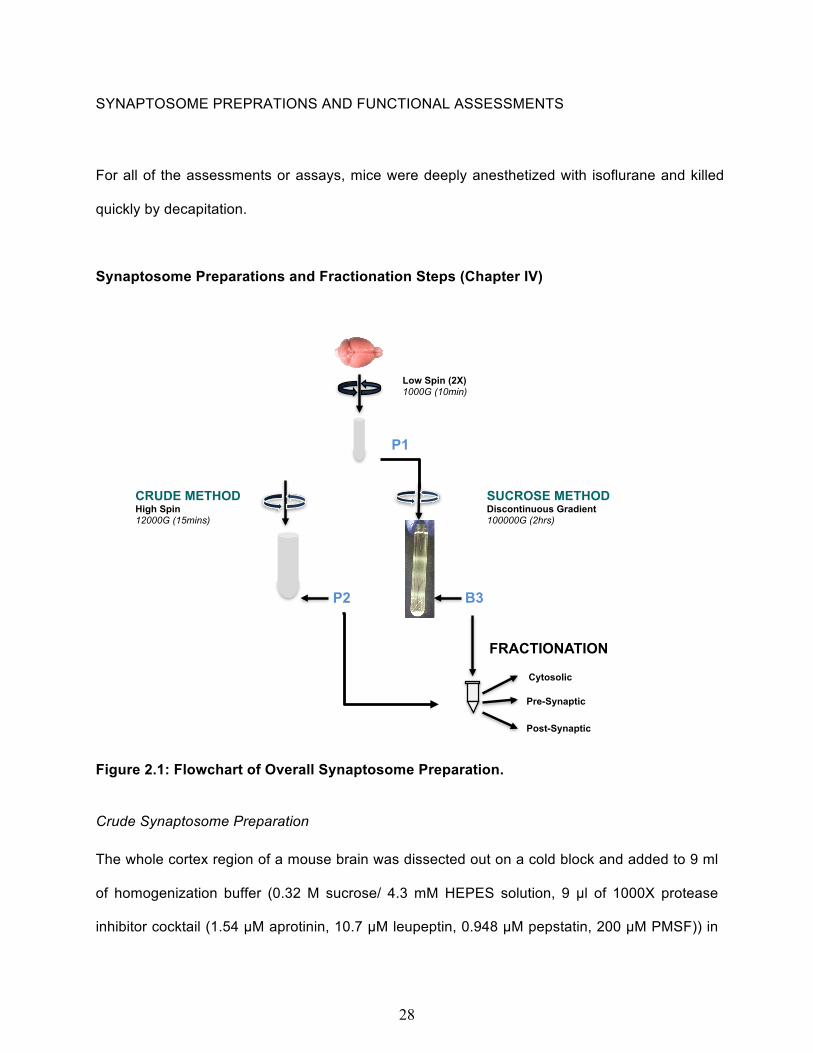
SYNAPTOSOME PREPRATIONS AND FUNCTIONAL ASSESSMENTS
For all of the assessments or assays, mice were deeply anesthetized with isoflurane and killed
quickly by decapitation.
Synaptosome Preparations and Fractionation Steps (Chapter IV)
Figure 2.1: Flowchart of Overall Synaptosome Preparation.
Crude Synaptosome Preparation
The whole cortex region of a mouse brain was dissected out on a cold block and added to 9 ml
of homogenization buffer (0.32 M sucrose/ 4.3 mM HEPES solution, 9 µl of 1000X protease
inhibitor cocktail (1.54 µM aprotinin, 10.7 µM leupeptin, 0.948 µM pepstatin, 200 µM PMSF)) in
Low Spin (2X) 1000G (10min)
SUCROSE METHOD Discontinuous Gradient 100000G (2hrs)
P1
CRUDE METHOD High Spin 12000G (15mins)
B3
Cytosolic
Pre-Synaptic
Post-Synaptic
FRACTIONATION
P2

29
a 10 ml glass homogenizer tube. The mixture was homogenized with a hand-held Teflon pestle
(approximately 7 strokes). The homogenate was then transferred to a 15 ml plastic tube for
centrifugation at 1000X G for 5 min at 4°C. The supernatant (S1) was then transferred to a 15
ml plastic tube and then centrifuged at 12,000X G for 15 min at 4°C. The pellet was suspended
in assay buffer (1300 µl of Krebs-Ringer Hepes buffer (10 mM HEPES, 128 mM, 5.2 mM KCl, 1
mM NaH2PO4, 10 mM Glucose, 2.2 mM MgSO4 1.2 mM CaCl2)) and then transferred to an
Eppendorf tube for assays.
Enriched Synaptosome Preparation
Prefrontal cortex brain tissue (half or the cortex) was homogenized as above in 10 ml of 0.32 M
homogenization buffer (0.32 M sucrose in 4.2 mM Hepes (pH 7.4), 0.1 mM CaCl2, 1 mM MgCl2,
1.54 µM aprotinin, 10.7 µM leupeptin, 0.948 µM pepstatin, 200 µM PMSF) in a 15 ml conical
tube. The homogenate was removed and centrifuged at 1000 g (2250 rpm) on a tabletop
centrifuge at 4° C for 10 min to pellet nuclei and membrane debris (P1a). Supernatant was
transferred to clean 50 ml conical tube on ice (S1a). P1a pellets were gently resuspended in 10
ml of 0.32 M sucrose solution the centrifugation step was repeated (P1b). Supernatant (S1b)
was transferred to 50 ml conical tube containing S1a. The supernatant was brought 20 ml with
0.32 M sucrose solution and centrifuged at 10,000XG at 4° C for 20 minutes to produce P2
pellet (contains crude synaptosomes, mitochondria, and microsomes). P2 pellets were gently
suspended in 3.4 ml of 0.32 M sucrose solution and aliquot was taken for Western blotting.
The remaining suspension of P2 pellet was applied to a discontinuous sucrose gradient. This
was prepared in Beckman 14 ml polycarbonate tubes in which 3 ml of 0.8 M, 1.0 M and 1.2 M
sucrose solutions were slowly layered in that order. Three milliliters of crude synaptosome
sample were layered on top of gradient and balanced with 0.32 M sucrose solution. Samples
were then centrifuge in Beckman ultracentrifuge (Optima LE-80K) using an SW 40 Ti rotor at

30
100,000XG (23712 rpm) at 4° C for 2 hours. Enriched synaptosomes were collected from
interface of the 1.0 M and 1.2 M solutions and transferred to clean 15 ml conical tube. Fractions
were diluted with 3 ml of the 0.32 M sucrose solution and centrifuged in same rotor at
100,000XG for 30 min at 4° C.
Synaptosome Fractionation
Pre- and post-synaptic fractions in both enriched and crude synaptosome preparations were
obtained by the following protocol. The P2 pellet from an enriched or crude synaptosome
preparation was gently suspended in 4 ml hypotonic lysis buffer (Hypotonic lysis buffer: 20 mM
Tris (pH 6.0), 0.1 mM CaCl2, 1 mM MgCl2, 1% Triton, 1.54 µM aprotinin, 10.7 µM leupeptin,
0.948 µM pepstatin, and 200 µM phenylmethyl sulfonyl fluoride (PMSF)). This was incubated on
ice for 20 minutes to lyse membranes and transferred to 5 ml ultracentrifuge tubes (Beckman
Ultra Clear, catalog #344057). Samples were centrifuged at 100,000 XG (28,700 rpm) in a SW
55 Ti rotor in a Beckman centrifuge (Optima LE-80K) for 120 minutes at 4ºC. The supernatant
(S3), which contains cytosolic proteins from both pre- and post- synaptic terminals, was
transferred to another tube and placed on ice. Pellet P3 was suspended in 1 ml of Tris buffer,
pH 8.0 (Tris Buffer: 20 mM Tris (pH 8.0), 1% Triton X-100, 1.54 µM aprotinin, 10.7 µM leupeptin,
0.948 µM pepstatin, and 200 µM PMSF). This was transferred to plastic 2 ml Eppendorf tubes
and incubated on ice for 20 minutes. The samples were centrifuged at 10,000XG for 30 minutes
at 4ºC, then the supernatant (S4) containing the presynaptic fraction was transferred to
Eppendorf tubes. The pellet (P4) was suspended in 200 µl of 1x PBS/1% SDS and centrifuged
at 10,000XG for 30 minutes to obtain the supernatant (S5) containing the post-synaptic fraction,
as described in Figure 2.2.

31
Concentration of cytosolic/perisynaptic and presynaptic fractions
To ensure adequate amounts of protein were studied, samples were concentrated using 3K
concentrator tubes (Amincon Ultra, Millipore) that were centrifuged at 3400 rpm at 4°C until
volumes reach ~250 µl. Once the correct volume was reached, membranes were washed with
homogenization buffer, and transferred to new Ependorff tubes for assays.
Figure 2.2: Flowchart of Synaptosome Fractionation.
Fura Red-AM Assay
Crude synaptosome preparations were centrifuged at 13,000 rpm for 2 min at 4°C to pellet
synaptosomes. The pellet was then suspended in 1300 µL of the Fura Red-AM (Invitrogen,
Lysis Buffer (1% Triton) 20min
100,000G, 120min, 4°C
Cytosolic
Supernatant Pellet
Lysis Buffer (1% Triton) 20min
10,000G, 30min, 4°C
Supernatant Pellet
Pre-Synaptic
Post-Synaptic
PBS 1% SDS
10,000G, 30min, 4°C
Supernatant
pH shift
Pre-Synaptic
Post-Synaptic
Cytosolic

32
F3021) solution (1300 µL of assay buffer with glucose and 5.3 µL of 1 mM Fura Red-AM dye).
The mixture was then incubated in a 37°C bath for 30 minutes and centrifuged again at 13,000
rpm for 2 min at 4°C. The supernatant was removed and the pellet was suspended in 1300 µL
of the assay buffer with glucose. Following this, 50 µL of the preparation treated as noted in text
at 37°C. At the end of each incubation period samples were treated with 1 mL of ice-cold assay
buffer (-glucose), centrifuged at 13,000 rpm for 2 min at 4°C, and the supernatant discarded.
This was followed by addition of 250 µL of 60% methanol in water to lyse the synaptosomes.
After a brief centrifugation to clear undissolved material, 100 µL aliquots were transferred to a
clear plate in a microtiter plate reader and fluorescence was read at excitation 420/emission 610
nm.
BIOCHEMICAL ASSESSMENTS
Tissue Preparations and Assays
If fresh tissues were not needed, cortex, cerebellum and liver were removed and frozen in dry-ice
and stored at -80 °C until needed.
Protein determination
The Pierce BCA Protein Assay Kit (Thermoscientific Cat No. 23225) is based on bicinchoninic
acid (BCA) and allows for the colorimetric detection and quantitation of total protein within a
tissue sample. Prior to determination assay, tissues were homogenized with a rubber policeman
in RIPA buffer (10 mM Tris-Cl (pH 8.0),1 mM EDTA, 0.5 mM EGTA, 1% Triton X-100, 0.1%
sodium deoxycholate, 0.1% SDS, and 140 mM NaCl). According to the manufacturer’s
instructions, 2.5 µL of the unknown protein sample was added to a 96-well microplate. The assay
working reagents (Reagent A and Reagent B) were mixed in a 1:50 ratio and 200 µL was added
to each well. A bovine serum albumin (BSA) standard curve (0, 0.5, 1.0, 2.0, 5.0, 10.0, 20.0
33
µg/ml) was also added to the plate. The plate was covered in Parafilm and incubated in a 37°C
bath for 10min. After cooling to room temperature the plate was then read with a
spectrophotometer at an absorbance of 562 nm.
Western blot analysis
Appropriate amounts of protein samples were mixed with 4X Sample Buffer and loaded into a
well on a gel (5-20 µg total protein per lane) along with a Kaleidoscope Precision Plus Protein
Standard (Bio- Rad). Samples were subjected to denaturing electrophoresis on a 7.5%
acrylamide gel. Protein samples were transferred Immobilon PVDF membrane (pore size 0.45),
according to the manufacturer’s instructions (Millipore). Membranes were blocked in blocking
buffer (5% BSA or dry milk, 0.5% Tween 20) for 1-hour at room temperature or overnight at 4°C.
Membranes were then incubated with primary antibodies (diluted 1:200-1000) in blocking buffer
at 4 °C with gentle rocking overnight. Blots were washed (3 times for 10 min each) at room
temperature in TBS-T (Tris-Buffered Saline; 150 mM NaCl, 20 mM Tris pH 7.5 with 0.5% (v/v)
Tween 20; Sigma Aldrich; St. Louis, MO). Then, blots were incubated with species-specific
horseradish peroxidase (HRP)-conjugated secondary antibody (diluted 1:10000) in blocking
buffer for 1-hour at room temperature and subsequently, washed in TBS-T (3 times for 10 min).
Antibody detection was performed with Western Lightening Plus-ECL Enhanced
Chemiluminescence Substrate Kit (Perkin Elmer) and Carestream Kodak BioMax MR Film
(Kodak, Rochester, NY). Band intensity from X-ray film detection was analyzed by densitometry
using ImageJ software from the National Institutes of Health.
Primary antibodies used for immunoblotting are the following: SVCT2 (S-19), VMAT2 (H-90),
Actin (I-19), (all from Santa Cruz Biotechnology). GAPDH (Milllipore, MAB-374), NMDAR1 (BD
Pharmingen, 556308), PSD-95 (Neuromab, 75-028), GβP (Santa Cruz, SC-378) for the
synaptosome fractionation studies were kindly provided by Katherine Betke in Dr. Heidi Hamm’s

34
laboratory (Vanderbilt University). Secondary antibodies used at a 1:10000 dilution for
immunodetection are the following: anti-rabbit IgG HRP and anti-goat IgG HRP conjugate
purchased from Santa Cruz Biotechnology.
Genotyping
Tail clippings were added to 100 µL extraction buffer and 25 µL tissue buffer. Samples were
incubated 20 minutes at room temperature and then 3 minutes at 95°. The reaction was stopped
with the addition of 100 µL neutralization buffer. Each PCR reaction contained 10 uL PCR
Master Mix, 2 µL RNA/ DNAase free water, 1 µL of each primer according to gene probe (SVCT
2 or Gulo). Samples were processed in DNA Engine® Peltier Thermal Cycler (Bio-Rad). 10 µL
of sample was loaded in each well and run on 1.5% agarose gel (1.5 g agarose, 100 ml 1X TAE,
and 10 µL Ethidium Bromide) at 95V for 30mins.
Primers were purchased from Integrated DNA Technologies (Coralville, IA)
Gulo Primer 1: 5’- CGC GCC TTA ATT AAG GAT CC -3’
Gulo Primer 2: 5’- GTC GTG ACA GAA TGT CTT GC -3’
Gulo Primer 3: 5’- GCA TCG CAG TGA CTA AGG AT -3’
SVCT2 Primer (50): 5’- CAT CTG TGC GTG CAT AGT AGC -3’
SVCT2 Primer (51): 5’- CAC CGT GGC CCT CAT TG -3’
SVCT2 Primer (54): 5’- TCT GAG CCC AGA AAG CGA AG -3’
SVCT2 Primer (55): 5’- GAT GGA CGG CAT ACA AGT TC -3’

35
Antioxidant Analysis
Vitamin C
In both chapters, VC was measured as ascorbic acid in metaphosphoric acid extracts of tissues
as described (103) using ion-pair HPLC with electrochemical detection.
Vitamin E
In both chapters, VE was measured as α-tocopherol in extraction buffer containing reagent
alcohol, 10 mg/ml butylated hydroxytoluene, 3% SDS and hexane and subjected to HPLC
analysis as described (105).
Reduced glutathione
Vitamin C tissue extracts were used to also measure reduced glutathione by an adaptation of the
o-phthalaldehyde method as described (106). Data for all assays were expressed per gram
tissue weight (wet weight).
Oxidative Stress Analysis
Malondialdehyde
To assess lipid peroxidation, malondialdehyde was measured by homogenizing samples in 5%
TCA solution and reacted with thiobarbituric acid as described (106).
F4-neuroprostanes and F2-isoprostanes
Tissue contents of esterified F4-neuroprostanes and F2-isoprostanes were quantified by stable
isotope dilution negative ion chemical ionization gas chromatography/mass spectrometry (107).
These analyses were performed in the Vanderbilt University Eicosanoid Core Laboratory.

36
STATISTICAL ANALYSIS
Behavioral Data: (Chapter III)
In Experiment 1, for all assessments that were conducted at both time points, repeated
measures ANOVA was conducted with Time as the repeated variable (Test 1, Test 2) and
vitamin C status (VC+, VC-) and vitamin E status (VE+, VE-) as the between groups variables.
For the inverted screen test an univariate ANOVA was conducted with vitamin C status (VC+,
VC-) and vitamin E status (VE+, VE-) as the between groups variables. In Experiment 2,
Repeated measures ANOVA were conducted with Time as the repeated variable (Test 1, Test 2,
Test 3) and genotype of the gulonolactone oxidase gene (gulo+/+, gulo-/-) and vitamin C
transporter (SVCT2+/+, SVCT2+/-) as the between groups variables.
Biochemical and oxidative stress markers: (Chapter III, In Experiment 1)
Univariate ANOVA was conducted for each independent measure with vitamin C status (VC+,
VC-) and vitamin E status (VE+, VE-) as the between groups variables. In Experiment 2,
univariate ANOVA was conducted with genotype of the gulonolactone oxidase gene (gulo+/+,
gulo-/-) and transporter (SVCT2+/+, SVCT2+/-) as the between groups variables.
A P-value of < 0.05 was considered statistically significant. Significant results from the omnibus
ANOVA were followed by the Bonferroni–corrected pairwise comparisons and are reported in
the text with interaction effects denoted as factor X factor. Due to the limitations of the statistical
tests performed, in each experiment direct comparisons between the control groups and the
double deficient group (VC+VE+ and VC-VE- or Gulo+/+/SVCT2+/+ and Gulo-/-/SVCT2+/-) could
not be assessed. Figures indicate significant differences between group variables noted in their

37
respective figure legend. All statistical analyses were performed by IBM SPSS Statistics
Software (Version 19).
38
CHAPTER III
COMBINED VITAMIN C AND E DEFICIENCY INDUCES MOTOR DEFECTS IN
GULO−/−/SVCT2+/−
Adapted from Pierce, M. R., DiAsio, D. L., Rodrigues, L. M., Harrison, F. E., & May, J. M. (2013).
Combined vitamin C and E deficiency induces motor defects in gulo−/−/SVCT2+/− mice.
Nutritional Neuroscience, 16(4), 160-173.
INTRODUCTION
Oxidative stress is a key feature of normal aging, and is markedly increased in stroke and certain
neurodegenerative conditions. Neurons are especially prone to oxidative stress due to their high
metabolic activity (49). Chief among the central nervous system’s defenses against oxidative
stress are low molecular weight antioxidants such as vitamins E and C. VE (mostly α-tocopherol)
is lipid-soluble and provides protection in cellular membranes. Vitamin C (VC) is water-soluble
and is transported from blood into the cerebrospinal fluid (CSF) and from the CSF in ventricles
into neurons by the Sodium-dependent Vitamin C Transporter – type 2 (SVCT2) (61). This
transporter is responsible for generating VC concentrations up to 2-6 mM in neurons (53). Mice
that are homozygous for the SVCT2 gene deletion die shortly after birth with undetectable VC
levels in the brain (67). This demonstrates the importance both of VC content and regulation by
SVCT2 in brain.

39
In vitro (108) and in vivo (19) studies have demonstrated a synergistic relationship between VC
and VE that helps to preserve neuronal function and survival (21). Guinea pigs, like humans, are
unable to synthesize VC and have long served as a model for study of both VE and VC
deficiencies. Using this model, it was demonstrated that first, high dietary fat and cholesterol
exacerbated chronic VC deficiency by both decreasing VC levels and increasing its oxidation
ratio (109). Second, a diet deficient in both vitamins had greater oxidative stress than animals
deficient in either vitamin alone (19). Lastly, the doubly deficient animals developed a phenotype
of progressive paralysis and death due to neuronal and fiber loss in the long tracks of the spinal
cord (20). This severe phenotype precluded further studies with guinea pigs.
To develop a more tractable model that could also be genetically manipulated, we have adapted
the double vitamin deficiency model to gulo-/- mice. These mice lack functional gulonolactone
oxidase (gulo) (102), which is required for VC synthesis. VC tissue levels in these mice can be
readily manipulated by dietary means (102;103). VE can also be removed from their diets, thus
yielding a combined VC and VE deficient model for whole-body oxidative stress. In addition to
decreasing dietary antioxidants, we also increased fat and sucrose components, as both of these
dietary factors have also been shown to increase oxidative stress (110;111). This model is
physiologically relevant because humans deficient in one vitamin are often marginal in the other.
Furthermore, those most likely to have VC deficiency tend to eat a diet low in fruits and
vegetables (112;113) and high in triglycerides and cholesterol.
The purpose of this study was to determine the effect of oxidative stress due to combined VC
and VE dietary deficiency on the neurological phenotype of mice. The first experiment induced
both single and double vitamin deficiencies then assessed the subsequent impact on motor and
cognitive skills in gulo-/- mice. The second experiment, designed to establish a more severe

40
oxidative stress and specifically deplete intracellular VC, induced double vitamin deficiency in
gulo mice that also lacked one allele for the SVCT2 and included further behavioral testing.
PILOT STUDY
Our laboratory initially developed the double-deficient model of neurological damage in guinea
pigs, as noted above. The double-deficient diet was adapted to mice with the goal of developing
a sustainable oxidative stress to assess responsiveness of the SVCT2 expression and
distribution. Since the SVCT2 determines VC localization, the goal was to determine how the
brain responds to combined VC deficiency and oxidative stress due to lower dietary antioxidants
in terms of VC distribution and function. A pilot study was conducted to determine the optimal
time for the vitamin deficiencies since the combined VE and VC deficient diet should produce
more oxidative stress than the VE deficient diet alone.
In contrast to guinea pigs, mice can synthesize VC. Therefore, in the mouse double-deficient
model, all mice have targeted deletion of gulonolactone oxidase (Gulo-/-). This enzyme catalyzes
the last step in the synthesis of VC and is missing in humans and guinea pigs. When mice were
not on an experimental diet they were supplemented with VC (0.33 g/L) in their drinking water
(~2.5 mg/mouse), which provided levels equal to wild-type control. Treatments were made in
de-ionized water with 0.01 M EDTA to increase VC stability.
To establish the mouse double-deficient model, five week-old Gulo-/- mice were placed on a VE
and VC deficient diet (Harlan Teklad, diet #TD88163). Gulo-/- mice that are not provided VC
supplementation develop scurvy in about 4-5 weeks (102). Therefore, 3 weeks of VC deficiency
was chosen to ensure low VC levels but to avoid scurvy. Mice are relatively resistant to VE

41
deficiency, requiring more than 10 months on a solely VE-deficient diet before they develop
symptoms including shaking of the head and ataxia. Therefore, 2, 4, and 6 months of VE
deficiency was the time-points chosen as assessment points which were then followed by the
complete removal of VC.
Table 3.1 shows that both VC and VE were decreased to levels about 10% of normal in brain
cortex and liver by the diets. The formation of malondialdehyde (MDA) was measured to assess
lipid peroxidative stress in these mice. Cortex MDA levels were increased at both 2 and 4
months of VE deficiency. Liver MDA levels were increased at all time points. These results
confirm increased oxidative stress in these mice. Liver F2-isoprostane levels showed a similar
trend and further indicate increased oxidant stress generation. Because there was no significant
increase in MDA at 6 months and since there was weight loss observed in the 6 month group
before VC was removed, we concluded 6 months was not optimal and focused on the 2 and 4
month groups, which both had increased MDA levels in cortex and liver. Between these two
groups there were more motor defects in the 4-month group. In wild-type C57/B6 adult mice (20
g female; 25 g male) stride length is ~58 mm (103). However, in my study, gait was adversely
affected in the combined VC and VE group. In the 2 month group the average gait length was
~46 mm in the control group and ~36 mm in the 4 month group. Locomotor activity was normal
for age and strain; there was no difference between 2 and 4 months indicating that they were
not grossly affected by scurvy. Therefore, I concluded that 4 months was the optimal time for
VE-deficiency.
These data demonstrate that combined dietary depletion of the two vitamins in mice unable to
make VC causes detectable behavioral changes associated with increased oxidant stress in
brain cortex. These results also demonstrate the feasibility of using this in vivo model of oxidant
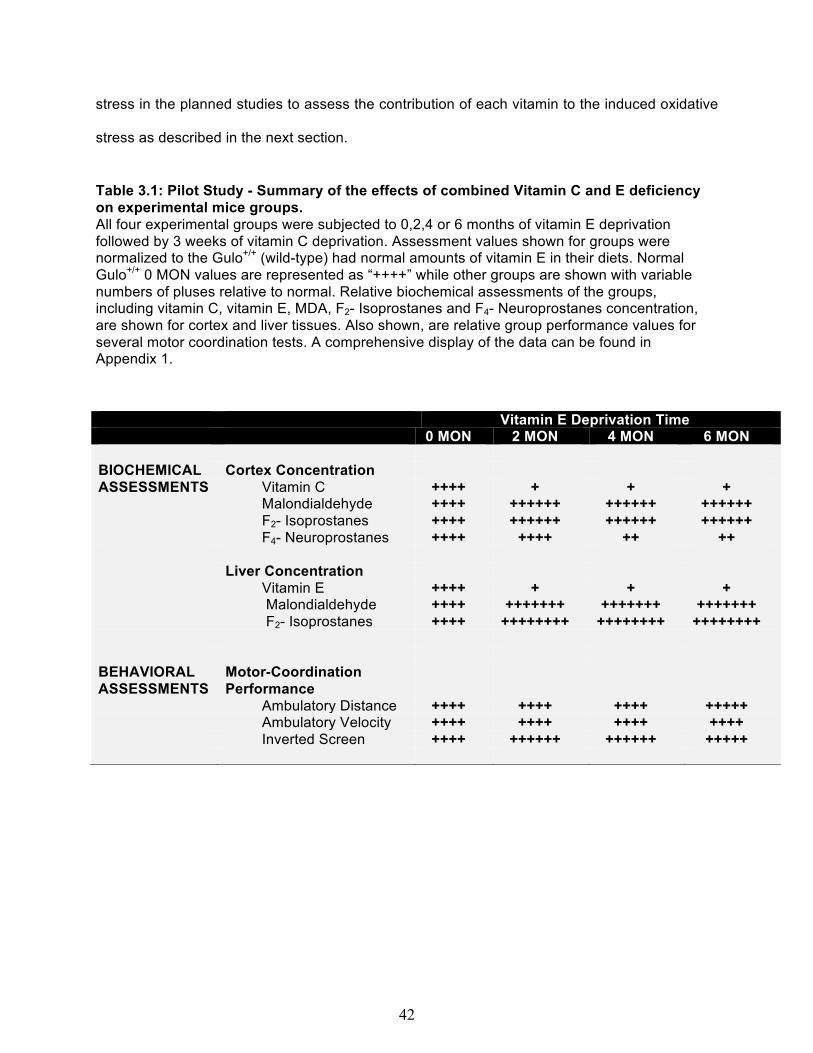
42
stress in the planned studies to assess the contribution of each vitamin to the induced oxidative
stress as described in the next section.
Table 3.1: Pilot Study - Summary of the effects of combined Vitamin C and E deficiency on experimental mice groups. All four experimental groups were subjected to 0,2,4 or 6 months of vitamin E deprivation followed by 3 weeks of vitamin C deprivation. Assessment values shown for groups were normalized to the Gulo+/+ (wild-type) had normal amounts of vitamin E in their diets. Normal Gulo+/+ 0 MON values are represented as “++++” while other groups are shown with variable numbers of pluses relative to normal. Relative biochemical assessments of the groups, including vitamin C, vitamin E, MDA, F2- Isoprostanes and F4- Neuroprostanes concentration, are shown for cortex and liver tissues. Also shown, are relative group performance values for several motor coordination tests. A comprehensive display of the data can be found in Appendix 1.
Vitamin E Deprivation Time 0 MON 2 MON 4 MON 6 MON
BIOCHEMICAL Cortex Concentration ASSESSMENTS Vitamin C ++++ + + + Malondialdehyde ++++ ++++++ ++++++ ++++++ F2- Isoprostanes ++++ ++++++ ++++++ ++++++ F4- Neuroprostanes ++++ ++++ ++ ++ Liver Concentration Vitamin E ++++ + + + Malondialdehyde ++++ +++++++ +++++++ +++++++ F2- Isoprostanes ++++ ++++++++ ++++++++ ++++++++ BEHAVIORAL ASSESSMENTS
Motor-Coordination Performance
Ambulatory Distance ++++ ++++ ++++ +++++ Ambulatory Velocity ++++ ++++ ++++ ++++ Inverted Screen ++++ ++++++ ++++++ +++++

43
EXPERIMENTAL DESIGN AND BEHAVIOR ASSESSMENT SCHEDULE
Experiment 1 Design:
Male and female gulo-/- mice were maintained on a normal rodent chow that contained
essentially no VC and 42 IU/kg of VE (total tocopherols). At 4-5 weeks of age, the mice were
randomly divided into four groups on a Western diet (16% lard, 34% sucrose, 0.2 cholesterol).
This was to increase oxidative stress and to provide a physiologic condition relevant to humans,
as those deficient in these vitamins are likely to also consume a diet high in saturated fats and
sucrose.
The four treatment groups each consisted of 16 weeks of VE treatment via diet followed by 3
weeks of VC treatment via water supplementation: (1) control group - VE treatment as 150 IU/kg
with continued supplementation of VC at 0.33 g/L; VE+VC+ (N=9), (2) VC deficient group - VE
treatment as 150 IU/kg and a final VC treatment of 0 g/L; VE+VC- (N=8), (3) VE deficient group -
VE treatment as 0 IU/kg with continued VC supplementation of 0.33 g/L; VE-VC+ (N=6), and (4)
doubly deficient group - VE treatment as 0 IU/kg with a final VC treatment 0 g/L VE-VC- (N=8).
The four groups, containing approximately equal males and females, are shown in Experimental
Scheme 1 (Figure 3.1).

44
Figure 3.1: Experimental Scheme 1, Combined vitamin C & E deficient diets. Mice started VE treatments at 4-5 weeks of age with continued VC supplementation. After 16 weeks of VE treatments mice were tested (Test 1) to observe changes in behavior. VC treatment lasted 3 weeks, after which another set of behavior tests were performed (Test 2). Mice were then sacrificed for biochemical analysis.
45
Experiment 1 Behavior Assessment Schedule:
Experiment 1: To determine the effect of VE deprivation only, an initial behavior assessment
(Test 1) was conducted after 16 weeks of the respective VE treatments. A second assessment
(Test 2) was performed after 3 weeks of the respective VC treatments to determine the effect of
the combined vitamin deficiency, as shown in Experimental Scheme 1. Each assessment
spanned two consecutive days. Day one included a Rota-rod training session to acclimate the
mice to the task. Day two included gait testing, locomotor activity, inverted screen, and the Rota-
rod test session.
Experiment 2 Design:
To enable both systemic and intracellular VC depletion, gulo-/- mice were crossed with mice
lacking one allele of the SVCT2 (SVCT2+/-) to generate gulo-/-/SVCT2+/- mice. Additional groups
assessed included two single mutant genotypes (gulo-/- and SVCT2+/- mice), as well as wild- type
C57BL/6J mice (gulo+/+/SVCT2+/+).
At 4-5 weeks of age, all mice were placed on the VE-deficient, Western diet (TD.07310) and
were provided with 0.33 g/L VC in their drinking water for 16 weeks. The mice were then all
deprived of VC for 3 weeks before sacrifice. Thus, the four groups containing approximately
equal males and females were wild-type control; gulo+/+/SVCT2+/+ (N=10), Gulo; gulo-/-/SVCT2+/+
(N=5), SVCT2; gulo+/+/SVCT2+/- (N=9) and gulo/SVCT2; gulo-/-/SVCT2+/- (N=10) as shown in
Experiment Scheme 2 (Figure 3.2).

46
Figure 3.2: Experimental Scheme 2, Combined vitamin deficiency effects on gulo-/- SVCT2 +/- mice. Mice started VE deprivation at 4-5 weeks of age with continued VC supplementation. After 16 weeks mice were tested (Test1) to observe changes in behavior. VC treatment lasted 3 weeks, after which another set of behavior tests were performed after 2 weeks and followed-up with another at 3 weeks (Test 2 and 3 respectively). Mice were then sacrificed for biochemical analysis.
47
Experiment 2 Behavior Assessment Schedule:
This experiment was designed to confirm the findings from experiment 1 and expand the results
to include three additional genotypes. The first assessment (Test 1) was done at 16 weeks after
VE deficient diet followed by two separate assessments at weeks 2 and 3 of the VC treatment
phase which corresponds to 18 and 19 weeks of VE deficiency, (Test 2 and Test 3, respectively),
as shown in Experimental Scheme 2. Each assessment spanned two consecutive days with the
more energy demanding tasks on day 2. Day one included one session of locomotor activity,
zero-maze, inverted screen, and Rota-rod training, sequentially. Day two included one session of
gait, Y-maze, horizontal beam, wire-hang, and Rota-rod test, sequentially.
All behavioral tests were performed under similar lighting. Repeated testing of cohorts was
performed at the same time of day (morning or afternoon).
RESULTS
Experiment 1 - Combined vitamin C & E deficiency in Gulo-/- mice
Body Weight and general appearance
As expected, the weights of all mice increased with age. During VC deprivation all the groups
except for the control decreased slightly (P<0.01); however, there were no significant interaction
effects with time for the groups (P= 0.56) (Figure 3.3A). There were no physical signs of early
scurvy in any of the mice following VC removal (hair loss, hunched posture, or lethargy).
Behavioral Assessment

48
Gait analysis for changes in stride length showed no main effects of time, VE or VC status, and
no VE X VC, or Time X VE interactions (P’s>0.062). There were, however, significant interaction
effects of Time X VC and of Time X VC X VE (P’s<0.038) (Figure 3.3B). Follow-up analyses
showed that the VE+VC- group was the only group to show altered gait with time, with a
decreased stride length between test 1 and test 2 (P<0.01). At test 1, VE+VC- mice had a slightly
longer gait than VE+VC+ mice (P<0.05), but at test 2 the direction of this difference was reversed
(P<0.05).
As expected, the distance traveled during locomotor activity testing decreased at least 35% in
test 2 in all groups indicating normal habituation to the chamber as supported by the main effect
of Time (P<0.01) (Figure 3.3C). Both VC deficient groups (indicated by the dashed lines)
explored less than the VC-supplemented groups at test 2 (P<0.01) (Figure 3.3C). Compared to
the control group (VE+VC+), all of the mice maintained similar locomotor velocity during both test
sessions except for the VE+VC- group, which decreased in test 2 as evident from an interaction
effect of Time X VC X VE (P<0.01) (Figure 3.3D). Follow-up analyses confirmed a significant
effect of time in the VE+VC- group (P<0.01) but not in any of the other groups (P’s> 0.181).
On the inverted screen, both of the single and double vitamin deficient groups had shorter
latencies to fall than the VE+VC+ group. There was a main effect of VC status (P<0.01) (Figure
3.3E). Results in Figure 3.3F are from the Roto-rod probe trial only (day 2 of each 2-day test
session). VE deprivation alone did not lead to any differences among the groups in latency to fall
from the rod (Test 1). All of the groups maintained their performance over time; however, the VC
deficient groups had lower baseline level of performance as shown by a shorter latency to fall at
both testing points compared to VC supplemented mice (P<0.01) (Figure 3.3F).
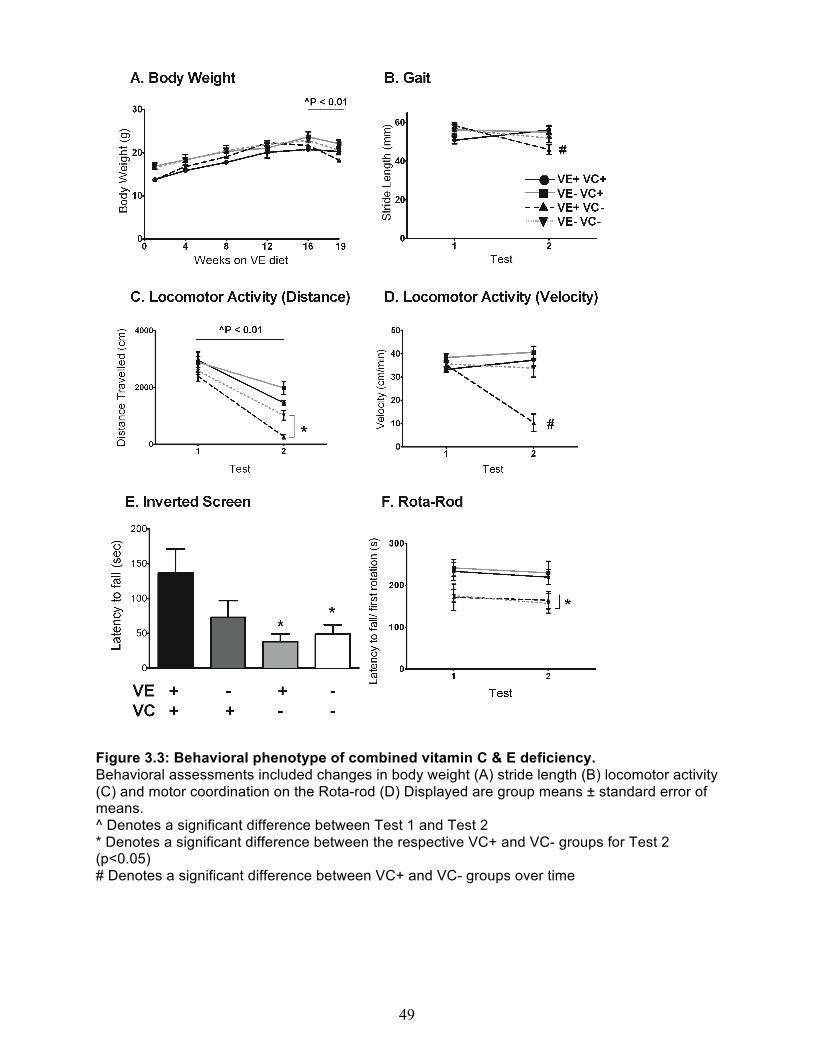
49
Figure 3.3: Behavioral phenotype of combined vitamin C & E deficiency. Behavioral assessments included changes in body weight (A) stride length (B) locomotor activity (C) and motor coordination on the Rota-rod (D) Displayed are group means ± standard error of means. ^ Denotes a significant difference between Test 1 and Test 2 * Denotes a significant difference between the respective VC+ and VC- groups for Test 2 (p<0.05) # Denotes a significant difference between VC+ and VC- groups over time

50
VC and α-Tocopherol measurements of brain cortex, and liver
VC and α-tocopherol were measured in both brain and liver to determine the effectiveness of
deprivation treatments. The liver was studied to reflect whole body VC status, since it receives
dietary VC from the portal system and does not synthesize the vitamin in gulo-/- mice. As
expected, VC deprivation for 3 weeks regardless of VE treatment lowered the VC contents of
cortex and liver. In cortex, VC levels decreased 86% in VE+VC- and VE-VC- groups compared to
the VE+VC+ group (P<0.01) (Figure 3.4A). Liver VC decreased 73% and 78% in the VE+VC-
and VE-VC- groups, respectively (Figure 3.4B). In addition to the main effect of VC status
(P<0.01) and VE status (P<0.05), there was also interaction between the two factors (P=0.038)
in liver. Pairwise comparisons revealed that in addition to the decreased VC in liver of both
groups of VC-deprived mice (P’s<0.05), VE deprivation without VC deprivation lowered VC in
VE-VC+ compared to VE+VC+ (P<0.05).
As expected, VE deprivation for 16 weeks lowered α-tocopherol in cortex (Figure 3.4C) and liver
(Figure 3.4D). In cortex, there were main effects of both VC (P<0.05) and VE (P<0.01) status,
with no significant VC X VE status interaction (P=0.356). In liver, there were main effects of VE
and VC deprivation (P’s<0.01). A significant VC X VE status interaction in liver (P=0.01)
indicated that although deprivation of either vitamin led to decreases in liver α-tocopherol levels
compared to control (P’s<0.01), no differences were found in VE- groups according to VC status
or in VC- groups according to VE status (P’s>0.27). Thus, deprivation of either vitamin led to a
significant decrease in α-tocopherol levels in liver. In both tissues, VE was decreased in mice
deficient of VC by at least 80% (P<0.01). VE-VC- decreased 88% and 97% in cortex and liver
tissue, respectively.

51
Measures of oxidative stress
Diets did not affect GSH contents in cortex or liver (P’s>0.448) (Figure 3.4E and F). MDA levels
in cortex and liver were increased in the VE-VC- group compared to the groups with normal VE
intakes (Figure 3.5A and B). VC deprivation increased MDA in the cortex (P<0.05). In liver there
was an increase in MDA following removal of both VC (P<0.01) and VE (P<0.01), with no
interaction between the groups (P=0.547). F2-isoprostanes increased almost 3-fold in cortex in
groups deprived of VE compared to groups on adequate VE (P<0.01; Figure 3.5C). F2-
isoprostanes, derived from non-enzymatic peroxidation of arachidonic acid, were also increased
in cortex to a lesser extent with VC deprivation, leading to a main effect of VC status (P<0.05). A
similar result was observed in liver with VE-VC+ and VE-VC- group levels 7-fold higher than
controls. This was reflected in a main effect of VE (P<0.01). However there was no main effect of
VC status (Figure 3.5D). F4-neuroprostanes, derived from peroxidation of docosahexaenoic acid,
were about 30-fold higher than those of F2-isoprostanes (compare Figure 3.5C to 5E). Similar to
F2-isoprostanes, VE deprivation increased F4-neuroprostanes in cortex (P<0.05) (Figure 3.5E).
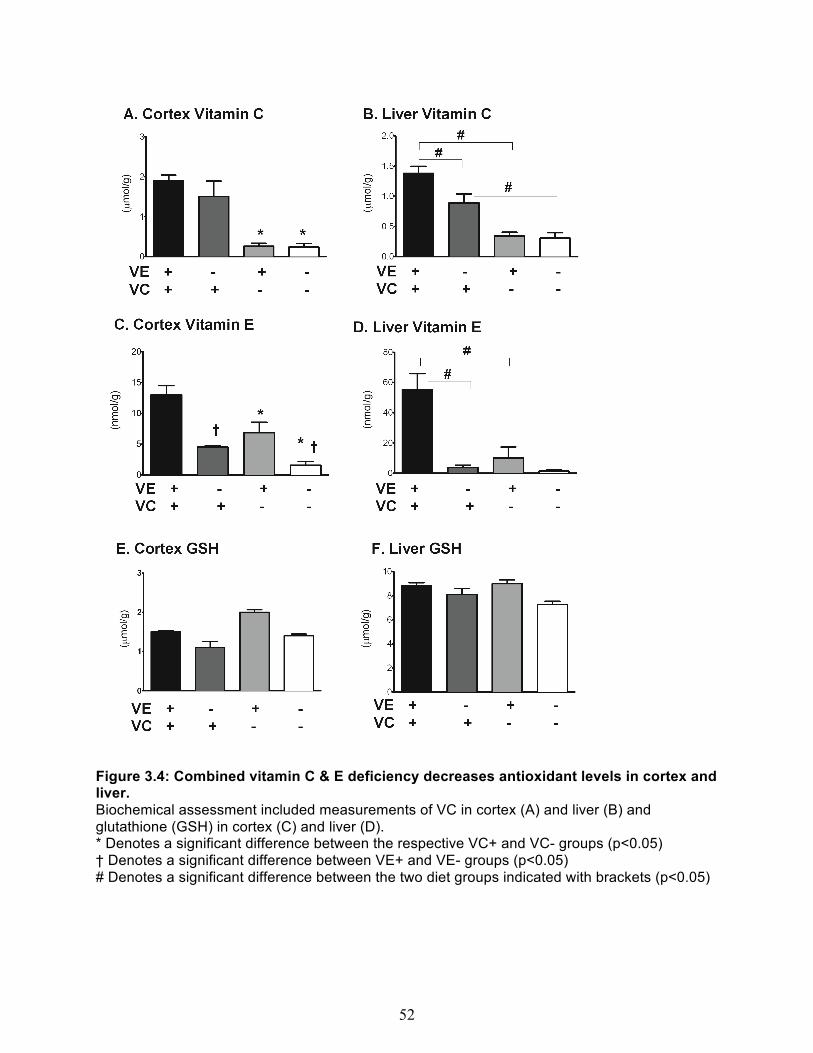
52
Figure 3.4: Combined vitamin C & E deficiency decreases antioxidant levels in cortex and liver. Biochemical assessment included measurements of VC in cortex (A) and liver (B) and glutathione (GSH) in cortex (C) and liver (D). * Denotes a significant difference between the respective VC+ and VC- groups (p<0.05) † Denotes a significant difference between VE+ and VE- groups (p<0.05) # Denotes a significant difference between the two diet groups indicated with brackets (p<0.05)

53
Figure 3.5: Vitamin E deficiency induces oxidative stress. Biochemical assessment included measurements of malondialdehyde in cortex (A) and liver (B); F2- isoprostanes in cortex (C) and liver (D); and F4- neuroprostanes in cortex (E). * Denotes a significant difference between VC+ and VC- groups (p<0.05) † Denotes a significant difference between VE+ and VE- groups (p<0.05)

54
Experiment 2 - Combined vitamin C & E deficiency in gulo-/-/SVCT2+/- mice
In Experiment 2, a cellular VC deficiency was added to the systemic VC deficiency, using gulo-/-
mice that had been crossed with mice heterozygous for the VC transporter SVCT2 (SVCT2+/-).
All mice were on the same Western diet and were deprived of VE for 16 weeks, followed by VC-
deficient intakes as described for Experiment 1. This experiment was designed to confirm the
effects observed in the VC- and E-depleted gulo-/- mice in Experiment 1 and to expand motor
testing by adding further tests (wire hang, horizontal beam), an anxiety task, and also
biochemical assessments of cerebellum to relate the behavioral phenotype to a brain region
most associated with motor coordination.
Body Weight and general appearance
Weights of all mice increased with age at the time points measured and there were no
differences between the groups (Figure 3.6A). None of the mice had overt signs of severe
scurvy, although gulo-/-/SVCT2+/- mice lost weight following 3 weeks of VC deficiency (P<0.01).
Behavioral Assessment
Changes in behavioral phenotype were observed during the last 3 weeks of the diet treatments.
Mice were assessed both under normal VC supplementation (Test 1) and after 2 (Test 2) and 3
(Test 3) weeks of VC deprivation (Experimental Scheme 2, Figure 3.2).
There was a significant main effect of time on gait as stride length of all the groups tended to
decrease by week 3 compared to weeks 1 and 2 (P<0.01) (Figure 3.6B). There was a main effect
of SVCT2 genotype (P<0.05), but not of gulo genotype (P=0.17), and also a Gulo X SVCT2
interaction (P<0.05). Therefore, stride length was shorter in gulo-/-SVCT2+/- than in
gulo+/+SVCT2+/- mice, but there was no effect of gulo genotype in SVCT2+/+ mice. Similarly,

55
lacking one allele for SVCT2 shortened stride length in gulo-/- mice but did not affect gait in
gulo+/+ mice. The greatest changes in stride length were thus seen in gulo-/-/SVCT2+/- mice. There
were no other interactions among the factors of Time, Gulo and SVCT2 (P’s>0.38).
Analysis of locomotor activity revealed significant main effects of time, both gulo and SVCT2
genotype and a Time X Gulo interaction (P’s<0.05) (Figure 3.6C). However, these effects were
all subsumed by a significant 3-way interaction among the factors (Time x Gulo X SVCT2,
P<0.01). All mice explored less across test sessions (P’s<0.01) except the gulo+/+SVCT2+/- mice
(P=0.32). There was no clear pattern of differences among the groups across the first two testing
sessions. At test 3, when the greatest differences were expected, the gulo-/-SVCT2+/- genotype
combination again had the greatest effect on behavior as these mice explored less than the other
groups (P’s<0.05). The Time X Gulo X SVCT2 interaction for locomotor velocity (P<0.05)
showed only that the gulo-/-SVCT2+/- were faster than the other groups during test 1 (supporting
the greater distance travelled at this time point). There were no other velocity differences among
the groups.
On the inverted screen test, there was a Time X Gulo X SVCT2 interaction (P<0.05), although
there were no main effects of any of the individual factors of time, or gulo or SVCT2 genotype
(P’s>0.1) (Figure 3.6D). Across the test sessions, Gulo-/-SVCT2+/- mice showed progressively
shorter fall latencies (P<0.01), whereas the other groups either improved or showed no change.
As expected, the wild type, gulo-/-, and SVCT2+/- groups improved or maintained latency to fall or
first rotation with training on the Rota-rod from test 1 to test 2 despite VC deprivation in the gulo-/-
group (Figure 3.6E). During this period a decrease in fall latency was observed in the gulo-/-
/SVCT2+/- group. There was interaction of Time X Gulo X SVCT2 (P<0.05). The gulo-/-/SVCT2+/-
group was the only group that performed more poorly on the Rota-rod across 3 weeks of VC

56
deprivation (P<0.01). This group also demonstrated shorter fall latencies compared to other test
groups at the final session (P’s<0.05). Gulo+/+/SVCT2+/- also performed more poorly than
Gulo+/+/SVCT2+/+ control mice on day 3 (P<0.05) supporting the role of SVCT2 genotype in
performance of the Rota-rod task under these conditions.
Horizontal beam results produced a similar pattern (Figure 3.6F), with a Time X Gulo X SVCT2
interaction (P<0.01) for test score. Again, the gulo-/-/SVCT2+/- mice were the only group to show
diminishing performance across test sessions (P<0.01), these mice also performed more poorly
than the other three groups at Test 3 (P’s<0.01). Although a similar trend was observed in the
wire hang test (Figure 3.6G), the differences did not reach statistical significance. There were
main effects of SVCT2 genotype (P<0.01) because the SVCT2+/- mice performed more poorly
(higher scores) than wild-type mice, and of Time (P<0.05) because overall scores diminished
over the test session. Although this latter result was likely driven by the poorer performance of
the gulo-/-SVCT2+/- mice, all other interactions between the factors were non-significant
(P’s>0.062) (Figure 3.6G). Together, these results point to consistent deficits in motor and
coordination skills in the gulo-/-/SVCT2+/- mice.
A decrease in locomotor activity could also indicate increased anxiety. However, there were no
significant differences in the in the percent of time mice in each group spent in the open arm of
the zero maze indicating no evidence of increased anxiety (Figure 3.6H). Alternation behavior in
the Y-maze was normal, and did not differ according to genotype (60%-65% alternation for each
group; P>0.05), indicating intact spatial working memory on this task in all groups of mice (results
not shown). However, the total number of arm entries was lower in gulo-/-/SVCT2+/- group,
consistent with their decreased tendency to explore (Figure 3.6C).
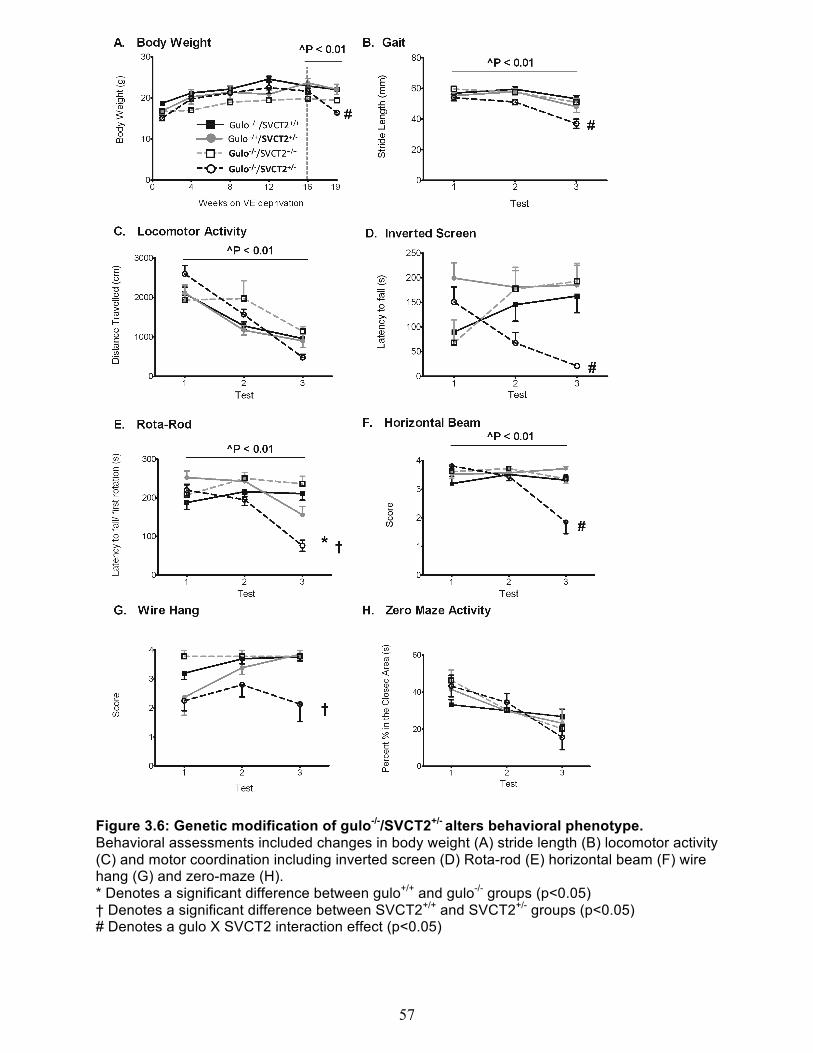
57
Figure 3.6: Genetic modification of gulo-/-/SVCT2+/- alters behavioral phenotype. Behavioral assessments included changes in body weight (A) stride length (B) locomotor activity (C) and motor coordination including inverted screen (D) Rota-rod (E) horizontal beam (F) wire hang (G) and zero-maze (H). * Denotes a significant difference between gulo+/+ and gulo-/- groups (p<0.05) † Denotes a significant difference between SVCT2+/+ and SVCT2+/- groups (p<0.05) # Denotes a gulo X SVCT2 interaction effect (p<0.05)

58
Vitamin C & E content of brain cortex, cerebellum and liver
The VC content of cortex, cerebellum and liver tissues was decreased in gulo+/+/SVCT2+/- mice
compared to wild-type (gulo+/+/SVCT2+/+) mice, despite the fact that these mice can synthesize
their own VC. As in Experiment 1, placing gulo-/- mice on a VC-free diet for 3 weeks decreased
VC in each tissue type by 95%, 85% and 87%, respectively. In the cortex, overall VC was lower
in gulo-/- compared to gulo+/+ mice (P<0.01), and lower in SVCT2+/- compared to SVCT2+/+ mice
(P<0.05). There was also an interaction between Gulo X SVCT2 (P<0.05) because VC was
decreased in all SVCT2+/- mice. Similarly, in gulo-/- mice, there was no further effect of SVCT2
genotype on VC level (P=0.93), but being heterozygous for SVCT2 did lead to lower VC in gulo+/+
cortex (P<0.05) (Figure 3.7A). Further, in cerebellum, there was a main effect of both gulo
(P<0.01), and SVCT2 status (P<0.01), while the interaction effect between the two genotypes
was not significant (P=0.073) (Figure 3.7B). In liver, lower VC was seen in gulo-/- mice than in
gulo+/+ controls (P<0.01) (Figure 3.7C).
As expected, α-tocopherol levels in both cortex and liver were markedly decreased in all groups
in this experiment, since all groups were on the VE-deficient diet (compare Figure 3.4D and E to
Figure 3.7D and F). In addition to this lowering due to VE-deficient diets alone, α-tocopherol
levels were significantly decreased in cortex (but not cerebellum and liver) in the 3 experimental
groups compared to wild-type mice. In cortex, there was a main effect of both gulo and SVCT2
genotypes (P<0.01), while in cerebellum there was only a main effect of gulo status (P<0.05). VE
appears to be retained in the cerebellum slightly better than the other tissues with the gulo-/-
/SVCT2+/- group having less than a 50% decrease in content compared to the control mice
(Figure 3.7D-F), however, overall levels were lower in the cerebellum than the cortex. Liver VE
levels were often undetectable and no different between the groups (Figure 3.7F).

59
Measures of oxidative stress
Cortex GSH levels in were increased in gulo-/-/SVCT2+/- mice deprived of VC compared to wild
type and to SVCT2+/- mice (Figure 3.8A). There was a main effect of both gulo and SVCT2
genotypes (P’s<0.01). A similar trend was observed in cerebellum with the highest levels in the
gulo-/-/SVCT2+/- mice; however the interaction between Gulo X SVCT2 was not significant
(P=0.070) (Figure 3.8B). The same effect was not observed in liver (Figure 3.8C). MDA levels
were increased in cortex in all of the gulo-/- mice (P<0.01) mice after VC deprivation compared to
the other two gulo+/+ groups (Figure 3.8D). There were no additional effects of SVCT2 genotype.
MDA levels were not different in cerebellum among the genotypes, consistent with the slight
changes in VE content. In liver, MDA was increased compared to wild type in the two VC-
deprived groups (Figure 3.8F). There was a main effect of both gulo and SVCT2 (P’s<0.01).
Together, these results show that VC deprivation, especially in the gulo-/-/SVCT2+/- mice, causes
a modest increase in oxidative stress in cortex and liver.
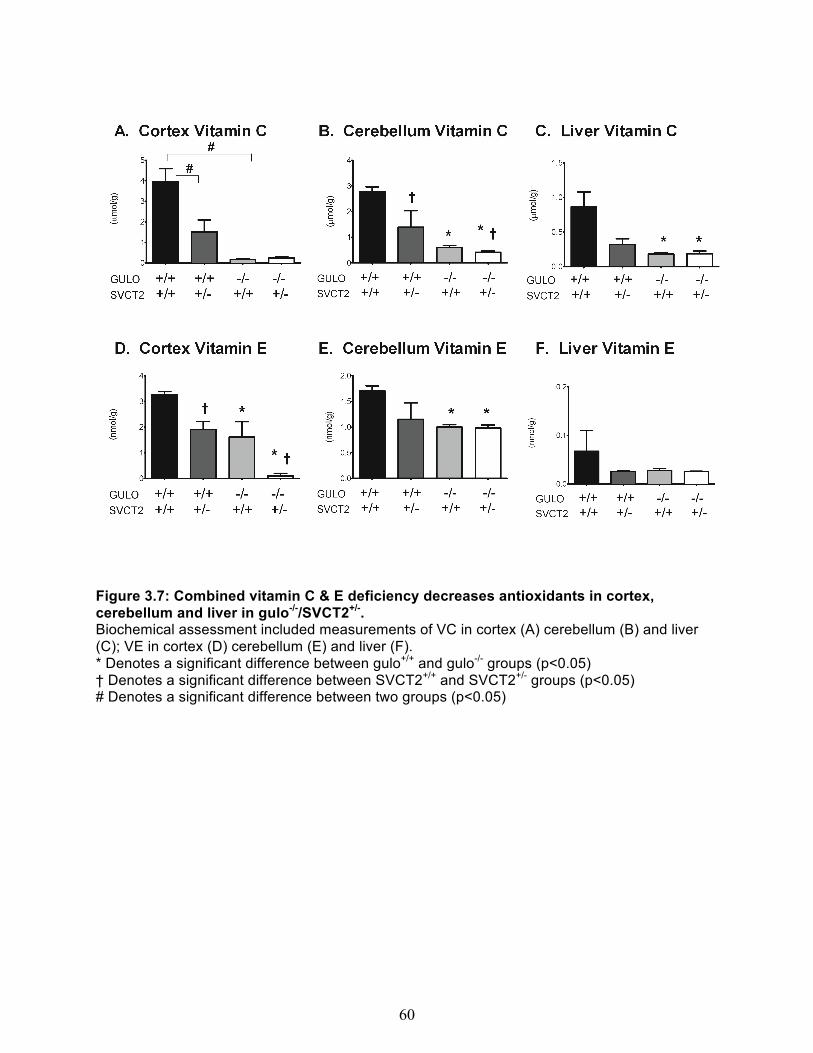
60
Figure 3.7: Combined vitamin C & E deficiency decreases antioxidants in cortex, cerebellum and liver in gulo-/-/SVCT2+/-. Biochemical assessment included measurements of VC in cortex (A) cerebellum (B) and liver (C); VE in cortex (D) cerebellum (E) and liver (F). * Denotes a significant difference between gulo+/+ and gulo-/- groups (p<0.05) † Denotes a significant difference between SVCT2+/+ and SVCT2+/- groups (p<0.05) # Denotes a significant difference between two groups (p<0.05)
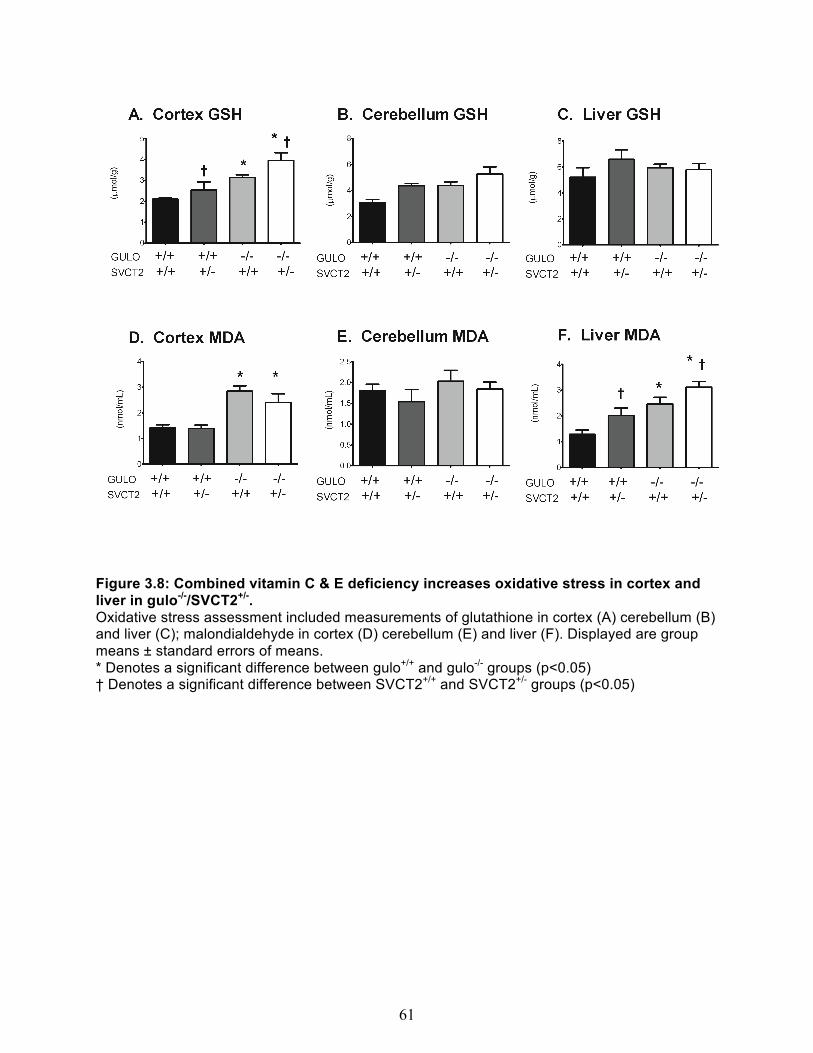
61
Figure 3.8: Combined vitamin C & E deficiency increases oxidative stress in cortex and liver in gulo-/-/SVCT2+/-. Oxidative stress assessment included measurements of glutathione in cortex (A) cerebellum (B) and liver (C); malondialdehyde in cortex (D) cerebellum (E) and liver (F). Displayed are group means ± standard errors of means. * Denotes a significant difference between gulo+/+ and gulo-/- groups (p<0.05) † Denotes a significant difference between SVCT2+/+ and SVCT2+/- groups (p<0.05)
62
DISCUSSION
In Experiment 1, we investigated the effects of a combined VE & VC deficient diet on the
neurobehavioral phenotype and oxidative stress measures in mice unable to synthesize their
own VC. In contrast to guinea pigs, mice were more tolerant of combined VE and VC deprivation
in terms of neurological deficits and survival. VE deficiency takes approximately 10 months to
cause motor symptoms in mice compared to just 4-5 weeks in guinea pigs (114). In guinea pigs
deprived of VE for only 2 weeks and VC for only 5-6 days, an ascending paralysis leading to
death was observed (19), whereas as long as 10 months of VE deprivation in normal mice does
not shorten stride or impair Rota-rod performance, despite an 80% decrease in VE levels in
cortex and liver (115). Thus, it was not surprising that in the present study a VE-deficient diet
alone for 16 weeks had no discernible effect on mouse gait or coordination, although it did
decrease the latency to fall in the inverted screen test.
VC deprivation alone in Experiment 1 decreased locomotor velocity and impaired inverted screen
test performance. Normal habituation to the testing chamber, as evidenced by decreased
exploration, was accentuated by VC deficiency alone in the current study. Although this change
could be attributable to increased habituation in this group, it is more likely to reflect decreased
voluntary locomotor activity due to physical weakness. Both VC-deprived groups showed poor
performance on the Rota-rod. However, this difference was already apparent following the VE
deprivation period, suggesting that it occurred by chance and was unrelated to the VC deficiency.
Thus, although there were motor performance defects in this experiment, they did not confirm
that the combined deficiency at this level of deprivation worsened strength or coordination
compared to the single deficiencies.

63
In contrast, VE deprivation alone did increase both cortex and liver F2-isoprostanes, an
established and sensitive marker of lipid peroxidation due to oxidative stress (116). Cortex F4-
neuroprostanes were also modestly increased by VE deprivation independently of VC status. For
both markers, this could relate to the location of VE in the lipid bilayer of cellular membranes,
where it can readily convert lipid peroxide radicals to the less damaging hydroperoxides. Other
markers of oxidative stress, including MDA, and GSH were variably affected by dietary
deprivation of either vitamin. Although these findings support the contention that VE deprivation
in this manner causes a modest increase in brain lipid peroxidation, motor skills defects induced
by short-term VC deprivation were not worsened by VE deficiency. VC deprivation consistently
decreased VE content in both the cortex and liver. These results support those of in vitro studies
showing that VC can recycle oxidized VE as α-tocopherol in lipid bilayers (108). Despite this role,
VC deficiency in mice did not increase F2-iso- or F4-neuroprostanes, the most specific markers of
lipid peroxidation (116), irrespective of VE depletion.
Since deficiency of VC rather than VE was related to defects in motor performance in Experiment
1, to accentuate this, a cellular deficit in VC was added to the systemic deficiency of both
vitamins in Experiment 2 by crossing gulo-/- mice with SVCT2+/- mice. These mice on the doubly
deficient diet had clear and consistent defects in all of the motor coordination skills tests. Only
stride length and locomotor velocity remained unaffected. Decreased performance following VC
deprivation on the horizontal beam and Rota-rod suggest that the defects were not simply due to
decreased strength, but rather to a motor coordination defect reflecting neurologic impairment.
Although an increase in anxiety could have confounded the coordination tests and accounted for
the decrease in locomotor activity observed (117), data from the zero-maze test failed to show
this, since the gulo-/-/SVCT2+/- mice spent a similar percentage of time in the closed area to the
other groups. α-Tocopherol levels were substantially decreased in all mice in Experiment 2
compared to the VE-supplemented groups in Experiment 1, so it is possible that this exacerbated

64
the motor skills defects. However, since VE deprivation did not affect motor performance
independently of VC in Experiment 1, the contribution of VE deficiency to the observed motor
skills defects would seem to be minimal.
VC levels in cortex, cerebellum, and liver were decreased by about 50% in the gulo+/+/SVCT2+/-
mice. This shows that this transporter is rate-limiting for VC uptake and content in both brain and
liver. This is surprising (and unexplained) for liver, since these mice can synthesize their own VC
in this organ. VC levels were more severely decreased in both brain areas and liver when the
SVCT2+/- genotype was combined with the gulo-/- mice that were deprived of VC. However, VC
contents of cortex and liver, although low, were no different than in gulo-/- mice deprived of VC.
Considering that the defects in motor performance observed might arise in the cerebellum, we
measured levels of both vitamins, GSH, and MDA in cerebellum. Although levels of both vitamins
were decreased as expected, both GSH and MDA were increased in cortex and not cerebellum,
indicative of a greater oxidative stress in cortex. In previous studies with Gulo-/- mice deprived of
VC, the cerebellum had better retention of VC and fewer changes in F2-isoprostane levels
compared to the cortex (103). Data in the present study support the idea that the cerebellum is
better protected against VC depletion and subsequent increased oxidative stress.
The present results suggest that although VE deficiency for more than 16 weeks modestly
increased lipid peroxidation in mouse brain and liver, it did not worsen the small and inconsistent
motor skills deficits due to VC deficiency. Motor skills deficits became more extensive when
cellular VC deficiency due to a decrease in cellular VC uptake was superimposed on VE
deprivation and then followed by an acute deprivation of VC. Even though the mice in this study
had no overt physical signs of scurvy beyond weight loss, it is likely that cellular deficiency of VC
due to partial loss of the SVCT2 in the gulo-/-/SVCT2+/- mice hastened deficits in motor and
coordination skills. The latter are likely to be early manifestations of acute scurvy. A recent study

65
of whole-body VC deficiency in zebrafish showed altered cellular energy metabolism
homeostasis by activation of the purine nucleotide cycle (118). This suggests that VC deficiency
may lead to inadequate energy production, which could also contribute to the behavioral deficits
observed in this study. Further studies will have to be performed to determine to role of energy
homeostasis in this behavioral model.
Although adult gulo-/- mice require significant systemic and cellular VC deficiency to manifest
motor and coordination skills defects, developing mice appear to be more sensitive. In fact, gulo-/-
dams that have been mated with gulo-/- sires have progeny that manifest similar motor skill
defects as young adults, with increases in oxidative stress markers (103). In this study, all gulo-/-
mice were derived from such matings. Although these mice may not be as capable as wild type
mice would be in completing the motor skills tasks, the dietary and genetic modifications in adult
gulo-/- mice in the present study clearly worsened any existing defects.
In conclusion, in regard to our original question of whether there is a neurological phenotype that
is associated with oxidative stress and/ or VC deficiency, our results show that a 16-week
deficiency of VE modestly increased oxidative stress markers, but did not affect mouse motor
skills or coordination. VC deficiency in addition to VE deficiency only minimally increased
oxidative stress markers compared to the single deficiency model. However, VC deficiency did
begin to impair motor and coordination skills, deficits in which become more evident when the
cellular uptake of VC is decreased. A summary of the observed phenotypes respective of the
genotypes is shown in Table 3.2. Whereas the latter may be an early manifestation of scurvy, its
mechanism does not appear to be due to an increase in lipid peroxidation and remains to be
determined.

66
! !
GU
LO +
/+
GU
LO +
/+
GU
LO -/
- G
ULO
-/-
SVC
T2 +
/+
SVC
T2 +
/- SV
CT2
+/+
SV
CT2
+/-
BIO
CH
EMIC
AL
Cor
tex
Con
cent
ratio
n
A
SSES
SMEN
TS
V
itam
in C
++
++
++
+ +
Vita
min
E
++++
++
+ ++
+ +
Glu
tath
ione
++
++
++++
++
+++
++++
+++
Mal
ondi
alde
hyde
++
++
++++
++
++++
++
++++
Cer
ebel
lum
Con
cent
ratio
n
V
itam
in C
++
++
+++
++
+
V
itam
in E
++
++
+++
++
++
Glu
tath
ione
++
++
++++
++
++
++++
M
alon
dial
dehy
de
++++
++
++
++++
++
++
Li
ver C
once
ntra
tion
Vita
min
C
++++
++
+
+
V
itam
in E
++
++
++
++
++
Glu
tath
ione
++
++
++++
++
++
++++
M
alon
dial
dehy
de
++++
++
++++
++
++++
++
++++
++
BEH
AVI
OR
AL
Mot
or-C
oord
inat
ion
Perf
orm
ance
A
SSES
SMEN
TS
G
ait L
engt
h ++
++
++++
++
++
+++
Loco
mot
or A
ctiv
ity
++++
++
++
++++
++
In
verte
d S
cree
n ++
++
++++
++
++
+
R
ota-
Rod
++
++
+++
++++
+
Hor
izon
tal B
eam
++
++
++++
++
++
++
Wire
Han
g
++++
++
++
++++
++
Anx
iety
Tes
t Per
form
ance
Y
-Maz
e A
ltera
tions
++
++
++++
++
++
++++
Ze
ro-M
aze
Ope
n/C
lose
Rat
io
++++
++
++
++++
++
++
Tabl
e 3.
2: S
umm
ary
of th
e ef
fect
s of
com
bine
d Vi
tam
in C
and
E d
efic
ienc
y on
exp
erim
enta
l mic
e gr
oups
. A
ll fo
ur e
xper
imen
tal g
roup
s w
ere
subj
ecte
d to
4 m
onth
s of
vita
min
E d
epriv
atio
n fo
llow
ed b
y 3
wee
ks o
f vita
min
C d
epriv
atio
n.
Ass
essm
ent v
alue
s sh
own
for g
roup
s w
ere
norm
aliz
ed to
the
Gul
o+/+ /S
VC
T2+/
+ (wild
-type
) gro
up. N
orm
al G
ulo+/
+ /SV
CT2
+/+ v
alue
s ar
e re
pres
ente
d as
“+++
+” w
hile
oth
er g
roup
s ar
e sh
own
with
var
iabl
e nu
mbe
rs o
f plu
ses
rela
tive
to n
orm
al. R
elat
ive
bioc
hem
ical
as
sess
men
ts o
f the
gro
ups,
incl
udin
g vi
tam
in C
, vita
min
E, G
SH
, and
MD
A c
once
ntra
tion,
are
sho
wn
for c
orte
x, c
ereb
ellu
m a
nd
liver
tiss
ues.
Als
o sh
own,
are
rela
tive
grou
p pe
rform
ance
val
ues
for s
ever
al m
otor
coo
rdin
atio
n an
d an
xiet
y te
sts.

67
CHAPTER IV
VITAMIN C TRANSPORT AT THE NERVE TERMINAL
Manuscript in Preparation
INTRODUCTION
Vitamin C (VC), an antioxidant not biosynthesized in humans, is an essential nutrient in the
central nervous system (CNS) and neurons (49;119). Facilitated transport of VC across the
plasma membrane of the neuron is a balance of two transport systems: uptake of VC inside the
cell into the cytoplasm and efflux of VC outside the cell into the extracellular CSF. Dysregulation
of VC concentrations on either side of the plasma membrane can lead to increased oxidative
stress and abnormal neuronal development and function (53). Many cell models have been
used to characterize the mechanisms for each transport system including neuron primary
culture, neuroblastoma cell lines, human embryonic kidney (HEK) cells, and endothelial cells.
However, how VC is transported in specialized regions within cells has received less attention.
The most active region of the neuron is arguably the synapse, or nerve terminal, yet there are
very few studies that investigate VC transport in this area. Neuronal pre-synaptic release sites
are highly metabolically active and undergo a considerable amount of oxidative stress.
Understanding the contribution for each transport system, uptake and efflux, at the nerve
terminal is essential for fully appreciating the role of VC in neuronal health.

68
It is well established that the primary mechanism of VC uptake in the brain is mediated by the
Sodium-dependent Vitamin C Transporter-type 2 (SVCT2) (53). Driven by the Na+
electrochemical gradient, the SVCT2 transports one molecule of VC along with 2 molecules of
Na+ into the intercellular space (65). Mice that are homozygous for the SVCT2 knockout gene
mutation have very low levels of VC in brain tissue despite the ability to synthesize the vitamin
on their own (67). Equally as important as the function of the SVCT2 is its localization within the
cell. In situ hybridization studies have shown that the SVCT2 mRNA is most neuronal cell types
however, not glia (71). Studies with primary culture of mouse hippocampal neurons suggested
that the SVCT2 was localized to the plasma membrane of the cell body and punctate areas in
axons (120). Although these results suggest that the SVCT2 may reside in vesicular structures
in neurons, they do not shed light on if the SVCT2 is present or functional specifically at the
nerve terminals.
Cellular models for VC efflux in brain include astrocytes (87;88) and SH-SY5Y neuroblastoma
cells (83). The mechanisms for VC efflux in the brain are unclear but some appear to be
mediated by channel proteins (82). Protein-mediated VC efflux from cells may occur
spontaneously (temperature-dependent), within a heteroexchange system with other molecules
or be glutamate-induced, which is observed when cells are stimulated with the excitatory
neurotransmitter, glutamate. Concerning the latter, it is postulated that glutamate uptake causes
cell swelling that in turn triggers volume-regulated anion channels (VRACs) to release
osmolytes to prevent swelling-induced cell lysis. VC appears to be one of the substances
released by VRACs in astrocytes (87) and neurons (83). This type of glutamate-induced VC
efflux may be of physiologic relevance as glutamate is the most common excitatory
neurotransmitter and comprises ~95% of the neuronal projections in cortex tissue (121).
Furthermore, electrophysiologic studies in rats showed that glutamate-induced VC efflux was
associated with neurobehavioral changes (96;122). Although most VC efflux mechanism studies

69
have been performed in astrocytes, it is unclear if similar mechanisms exist within neurons as
well. This is especially relevant considering that most of the brain’s VC is concentrated in
neurons.
The physiologic link between how neuronal VC transport is regulated in culture and it is
regulated in vivo may lie in the VC uptake and efflux systems maintained at the synapse.
Synaptic sites are specialized regions that may have distinct mechanisms to regulate VC uptake
and efflux to ensure proper neuronal function. Synaptosome preparations are an established
model for studying synaptic mechanisms as these pinched off nerve terminals contain all the
required protein machinery for synaptic function. VC uptake and efflux has been partially
described in synaptosomes (123). These studies observed that VC could be taken up by
synaptosomes when incubated with an excess of VC concentration. Furthermore, VC efflux
from synaptosomes could occur spontaneously or following incubation with physiologic
glutamate concentrations. However, the mechanisms in each of the systems have not yet been
characterized. Therefore, the studies described in this paper investigate the SVCT2 expression
and function in VC uptake in synaptosomes. Also, we investigated the potential role of VRACs
in glutamate-induced VC efflux from synaptosomes.
70
RESULTS
Neuronal SVCT2 localization
To localize the SVCT2 in neurons with regard to known neuronal transporters, cultured mouse
superior cervical ganglia (SCG) were immunostained with antibodies to the norepinephrine
transporter (NET) (Figure 4.1A), the SVCT2 (Figure 4.1B), and to the vesicular monoamine
transporter-2 (VMAT2) (Figure 1C). The rationale was that co-localization of the SVCT2 with
either of these two transporters would help to identify the vesicles containing the SVCT2. The
SVCT2 antibody stained fibers and particulate structures that corresponded in many areas with
nerve fiber staining of the NET (Figure 4.1D). On the other hand, the SVCT2 and the VMAT2
co-localized to particulate structures within nerve fibers (Figure 4.1E).
The superior cervical ganglion has relatively large presynaptic boutons (~5 µm). Using confocal
fluorescence imaging, it is possible to take a section through the base of the bouton that forms
the presynaptic side of the synaptic cleft (graphic representation, Figure 4.1F). Since it shows
proteins located in the presynaptic bouton membrane and in vesicles just below it, this approach
can be used to determine whether proteins or transporter co-localize in this important region.
When such a sectioned bouton was examined, all three transporters co-localized (inset to
Figure 4.1D and E), suggesting that the SVCT2 co-localizes with both the norepinephrine and
VMAT2 transporters in the presynaptic bouton membrane. This shows that the vesicles
containing both transporters, as well as the VMAT2 transporter, have fused with the presynaptic
membrane.

71
F
D
NE
T an
d S
VC
T2
E
S
VC
T2 a
nd V
MAT
2
Mer
ge
Mer
ge
A
NE
T B
SV
CT2
C
VM
AT2
F
Figu
re 4
.1:
Imm
unos
tain
ing
of th
e SC
G p
resy
napt
ic b
outo
n.
Top
pane
l: Im
mun
osta
inin
g fo
r [A
] Nor
epin
ephr
ine
Tran
spor
ter (
NE
T), [
B] S
VC
T2 a
nd [C
] ves
icul
ar m
onoa
min
e Tr
ansp
orte
r Ty
pe 2
(VM
AT2
). B
otto
m p
anel
: C
o-lo
caliz
atio
n of
tran
spor
ters
, mer
ging
of i
mm
unos
tain
ing
imag
es o
f [D
] NE
T an
d S
VC
T2
and
[E] S
VC
T2 a
nd V
MA
T2. [
F] G
raph
ic re
pres
enta
tion
of b
outo
n st
ruct
ures
in in
sets
for p
anel
s D
and
E.

72
SVCT2 expression at the cortical pre-synaptic terminal
To assess the location of SVCT2 protein within the nerve terminal we prepared synaptosomes
from cortical tissue of male wild-type mice 4-6 months of age. Enriched synaptosome
preparations were separated into three fractions: [1] cytosolic, which contains mostly detergent-
soluble cytosolic proteins including synaptic vesicles and peri-synaptic membrane fragments; [2]
pre-synaptic, and [3] post-synaptic. The latter two fractions contain detergent-resistant
membrane fragments of the active zone that are soluble at a pH of 6.0 and 8.0, respectively.
The relative enrichment of synaptic proteins was compared to whole synaptosomes
(unfractionated preparation) and assessed by Western immunoblots (Figure 4.2A and B). The
cytosolic marker Glyceraldehyde 3-Phosphate Dehydrogenase, (GAPDH, Figure 4.2C), was
enriched in the cytosolic fraction. VMAT2 (Figure 4.2D), was also found in the cytosolic fraction,
but was more prominent in the pre-synaptic fraction. Two proteins located in the post-synaptic
terminal, N-methyl-D-aspartate Receptor, (NMDAR1, Figure 4.2E) and Postsynaptic Density
Protein 95 (PSD-95, Figure 4.2F) were enriched in the post-synaptic fraction. These markers
confirmed that the fractionation procedure enriches sub-cellular proteins found in these parts of
the synapse. Under these conditions, SVCT2 was predominantly enriched in the pre-synaptic
fraction (Figure 4.2G), suggesting that SVCT2 is indeed localized at the synapse, at the pre-
synaptic terminal specifically.

73
Figure 4.2: SVCT2 is localized in pre-synaptic fractions. [A] Western immunoblots of cortical synaptosome preparations and fractionated samples. Samples containing 5µg of protein were subjected to SDS-PAGE. Samples were probed for cytosolic protein, Glyceraldehyde 3-Phosphate Dehydrogenase (GAPDH); pre-synaptic protein, Vesicular Monoamine Transporter (VMAT2); and two post-synaptic proteins, N-methyl-D-aspartate Receptor (NMDAR1) and Postsynaptic Density Protein 95 (PSD-95). [B] Samples containing 30µg of protein were subjected to SDS-PAGE under same fractionation conditions and probed for SVCT2. Bands in each lane were normalized by G-protein β subunit expression and compared to the initial crude synaptosome preparation (first lane). Quantification of [C] GAPDH, [D] VMAT2, [E] NMDAR1, [F] PSD-95 and [G] SVCT2 are represented as the mean ± SEM of two different experiments.
GA
PDH
Nor
mal
ized
Ban
d D
ensi
ty
WHOLE CYTO PRE POST0.0
0.5
1.0
1.5
2.0
2.5
VMAT
2N
orm
aliz
ed B
and
Den
sity
WHOLE CYTO PRE POST0.0
0.5
1.0
1.5
NM
DA
R1
Nor
mal
ized
Ban
d D
ensi
ty
WHOLE CYTO PRE POST0
1
2
3
PSD
-95
Nor
mal
ized
Ban
d D
ensi
ty
WHOLE CYTO PRE POST0.0
0.5
1.0
1.5
2.0
2.5
SVC
T2N
orm
aliz
ed B
and
Den
sity
WHOLE CYTO PRE POST0.0
0.5
1.0
1.5
2.0
Pre-
syna
ptic
Fra
ctio
n
Post
-syn
aptic
Fra
ctio
n
Cyto
solic
Fra
ctio
n
Crud
e Sy
napt
osom
es
GAPDH&
VMAT2&
NMDAR1&
PSD/95&
GPβ&
GPβ&
SVCT2&
/100&
/100&
/37&kDa&
/37&&
/37&&
/75&&
/75&
A& C& D&
E& F&
G&B&

74
SVCT2 function in crude cortical synaptosomes
Net VC uptake
To determine if SVCT2 functions at the nerve terminal, we performed experiments to
characterize net VC uptake. We found that crude synaptosomes contained endogenous VC at
~80 nmol/g (Figure 4.3A). Upon incubation for 30 min with 250 µM unlabeled VC, a two-fold
increase in VC content was observed (Figure 4.3A). Two known SVCT2 inhibitors,
sulfinpyrazone and phloretin prevented this uptake (Figure 4.3A). Similar results were observed
in studies using radiolabeled 14C-VC, which also showed net uptake of 14C-VC uptake at ~80-
100 nmol/g when incubated for 30 min (Figure 4.3B). Radiolabeled VC uptake was also
inhibited by sulfinpyrazone and phloretin, as well as by replacement of sodium with choline. It
has been shown that the oxidized form of VC, dehydroascorbic acid (DHA) can be transported
on the GLUTs in neurons and astrocytes (54). However, the GLUT transporter competitive
inhibitor, 3-0-methylglucose at a concentration that will substantially compete for
dehydroascorbic acid, did not affect 14C-VC uptake. This indicated that 14C-VC uptake was
independent of GLUT function.
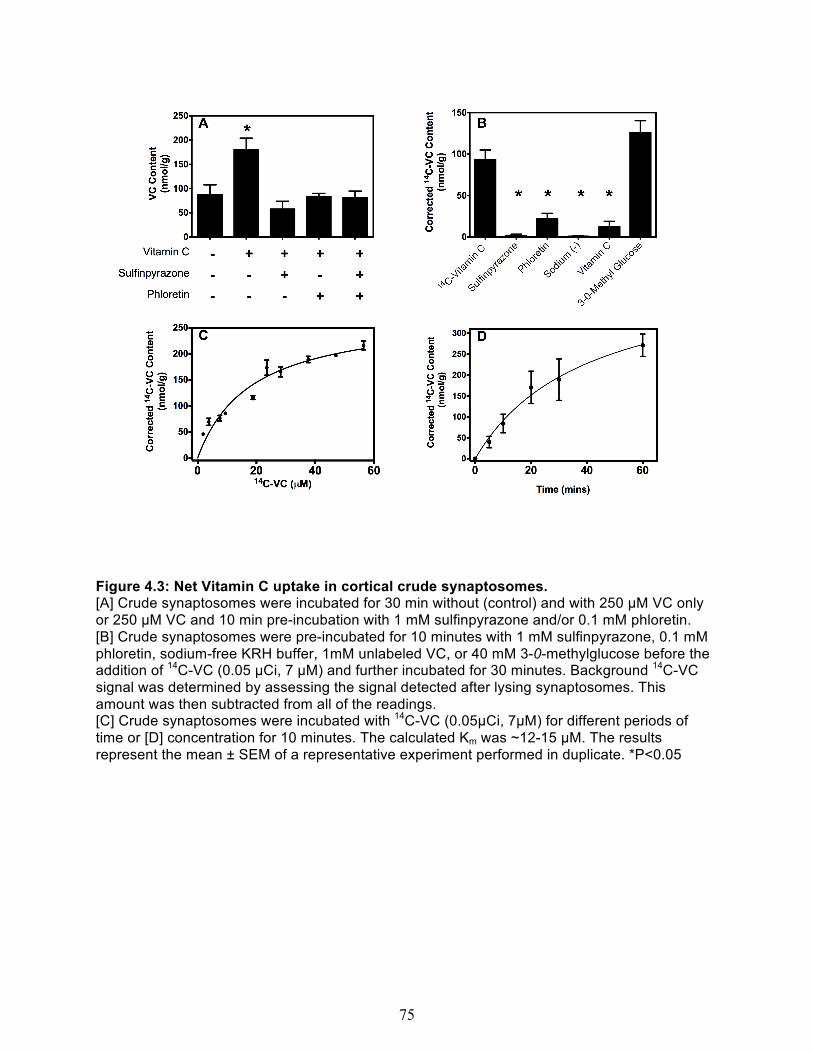
75
Figure 4.3: Net Vitamin C uptake in cortical crude synaptosomes. [A] Crude synaptosomes were incubated for 30 min without (control) and with 250 µM VC only or 250 µM VC and 10 min pre-incubation with 1 mM sulfinpyrazone and/or 0.1 mM phloretin. [B] Crude synaptosomes were pre-incubated for 10 minutes with 1 mM sulfinpyrazone, 0.1 mM phloretin, sodium-free KRH buffer, 1mM unlabeled VC, or 40 mM 3-0-methylglucose before the addition of 14C-VC (0.05 µCi, 7 µM) and further incubated for 30 minutes. Background 14C-VC signal was determined by assessing the signal detected after lysing synaptosomes. This amount was then subtracted from all of the readings. [C] Crude synaptosomes were incubated with 14C-VC (0.05µCi, 7µM) for different periods of time or [D] concentration for 10 minutes. The calculated Km was ~12-15 µM. The results represent the mean ± SEM of a representative experiment performed in duplicate. *P<0.05
76
Kinetic characterization of VC uptake
To determine if the kinetic properties of VC uptake in synaptosomes were similar to those
expected if transport occurred via SVCT2, time and concentration curves were performed using
radiolabeled VC. The uptake of 14C-VC was linear for about 20 min (Figure 3C). Using an
incubation time in the linear phase of uptake (10 min), uptake was saturable the and apparent
Km and Vmax of 18.31 ± 4.7 µM and 277 ± 28.15 nmol/g/30 min, respectively. These data
suggest that the VC uptake in synaptosomes is consistent with SVCT2 function.
Net VC efflux out of cortical synaptosomes
VC transport is a balance between uptake and efflux. In order to assess the contribution of VC
movement out of synaptosomes, a series of efflux studies were performed to observe the
release of endogenous VC from non-loaded synaptosomes over time. Two types of VC efflux
mechanisms were studied: spontaneous and glutamate-induced. Spontaneous endogenous VC
efflux was measured since net uptake would depend on efflux occurring at 37°C. We also
assessed glutamate-induced VC efflux because of its physiologic relevance.
Temperature dependence of spontaneous VC efflux
No VC efflux was observed at 4°C, whereas at 37°C, the endogenous VC concentration steadily
decreased over time and after 30 min had decreased to ~80 – 100 nmol/g, comparable to the
uptake experiments over the similar time frame (Figure 4.4A). To determine the contribution of
SVCT2 to VC efflux, synaptosomes were incubated with the SVCT2 inhibitors, phloretin and
sulfinpyrazone, for 30 min at 37°C. The presence of these inhibitors did not inhibit efflux but
rather enhanced efflux by 25% and 50%, respectively (Figure 4.4C and E). This is likely due to
the decrease in net VC uptake caused by the inhibition of the SVCT2, resulting in an apparent
increase of net efflux. This suggests that the SVCT2 is not responsible for VC efflux, but that
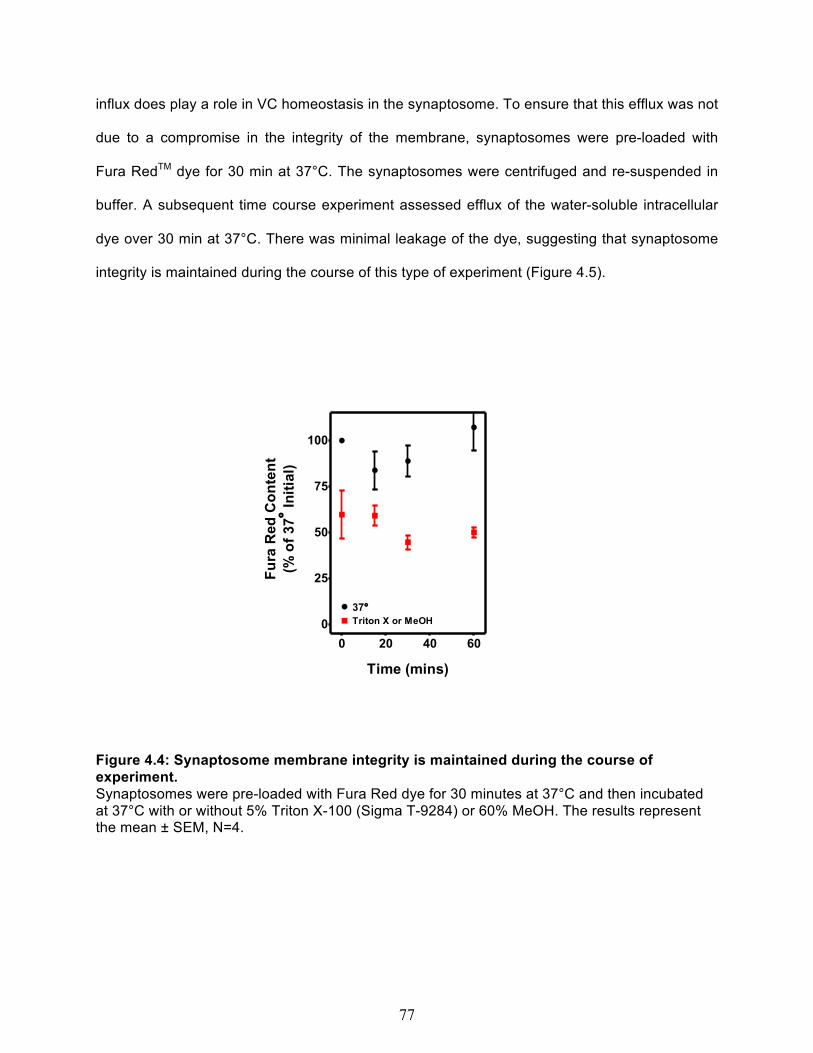
77
influx does play a role in VC homeostasis in the synaptosome. To ensure that this efflux was not
due to a compromise in the integrity of the membrane, synaptosomes were pre-loaded with
Fura RedTM dye for 30 min at 37°C. The synaptosomes were centrifuged and re-suspended in
buffer. A subsequent time course experiment assessed efflux of the water-soluble intracellular
dye over 30 min at 37°C. There was minimal leakage of the dye, suggesting that synaptosome
integrity is maintained during the course of this type of experiment (Figure 4.5).
Figure 4.4: Synaptosome membrane integrity is maintained during the course of experiment. Synaptosomes were pre-loaded with Fura Red dye for 30 minutes at 37°C and then incubated at 37°C with or without 5% Triton X-100 (Sigma T-9284) or 60% MeOH. The results represent the mean ± SEM, N=4.
Time (mins)
Fura
Red
Con
tent
(% o
f 37°
Initi
al)
0 20 40 600
25
50
75
100
37°Triton X or MeOH

78
Figure 4.4: Spontaneous Vitamin C Efflux. Time course of spontaneous VC efflux. [A] Relative VC content over 30 min at 4°C (closed circles) and 37°C (open circles). The initial synaptosomal VC concentration was ~250-300 nmol/g. [B] Logarithmic transformation of data in panel A where (*) denotes a significant difference between the slopes of the two lines. [C] Relative VC content over 30mins of efflux at 37°C with (open circles) and without (closed circles) 1 mM sulfinpyrazone [D] Logarithmic transformation of data in panel C where (*) denotes a significant difference between the slopes of the two lines. [E] Relative VC content over 30mins of efflux at 37°C with (open circles) and without (closed circles) 100 µM phloretin [F] Logarithmic transformation of data in panel C where (*) denotes a significant difference between the slopes of the two lines.
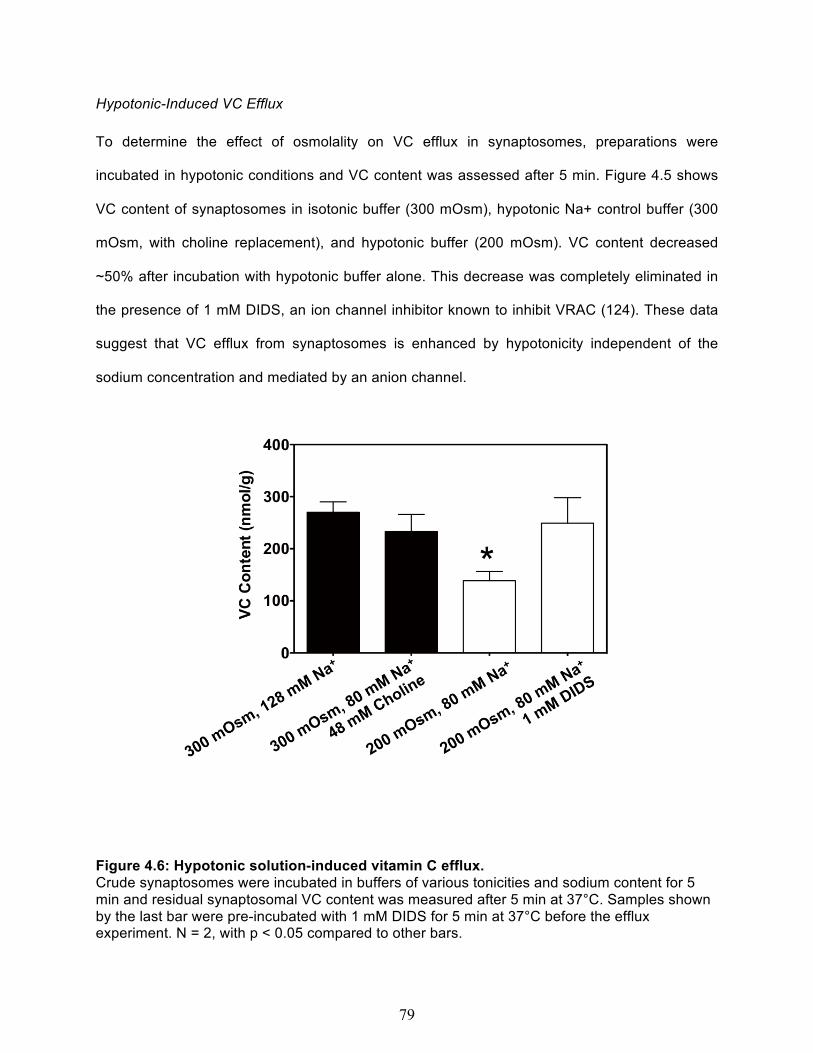
79
Hypotonic-Induced VC Efflux
To determine the effect of osmolality on VC efflux in synaptosomes, preparations were
incubated in hypotonic conditions and VC content was assessed after 5 min. Figure 4.5 shows
VC content of synaptosomes in isotonic buffer (300 mOsm), hypotonic Na+ control buffer (300
mOsm, with choline replacement), and hypotonic buffer (200 mOsm). VC content decreased
~50% after incubation with hypotonic buffer alone. This decrease was completely eliminated in
the presence of 1 mM DIDS, an ion channel inhibitor known to inhibit VRAC (124). These data
suggest that VC efflux from synaptosomes is enhanced by hypotonicity independent of the
sodium concentration and mediated by an anion channel.
Figure 4.6: Hypotonic solution-induced vitamin C efflux. Crude synaptosomes were incubated in buffers of various tonicities and sodium content for 5 min and residual synaptosomal VC content was measured after 5 min at 37°C. Samples shown by the last bar were pre-incubated with 1 mM DIDS for 5 min at 37°C before the efflux experiment. N = 2, with p < 0.05 compared to other bars.

80
Glutamate-Induced VC Efflux
To determine the mechanism for glutamate-induced VC efflux in synaptosomes, preparations
were incubated with increasing concentrations of glutamate (Figure 4.6). A decrease of about
50% was observed when 200 µM glutamate was incubated with the synaptosomes for 30 min.
Therefore, this concentration was chosen for subsequent experiments. Time course
experiments confirmed that there was a significant increase in VC efflux at 37°C in the presence
of glutamate (200 µM) resulting in an additional 15% decrease in VC content by the end of 30
min compared to 37° at 30min (Figure 4.7A and B). Pre-treatment of synaptosomes with 1 mM
DIDS before the addition of 200 µM glutamate significantly decreased VC-efflux compared to
200 µM glutamate alone (Figure 4.7C and D). These data suggest that glutamate-induced VC
efflux in cortical synaptosomes may occur on volume-regulated anion channels, as it is sensitive
to the VRAC inhibitor, DIDS. As a control for the DIDS effect on basal (spontaneous) VC efflux,
synaptosomes were incubated with DIDS (1mM) for 30 min at 37°C. The presence of DIDS
failed to either inhibit or enhance efflux.
Figure 4.7: Glutamate concentration curve. Vitamin C content of synaptosomes incubated with increasing concentrations of glutamate (0-400 µM), expressed as a fraction of control. N=3.
Glutamate (µM)
VC
Con
tent
(% o
f Ini
tial)
0 100 200 300 4000
50
100
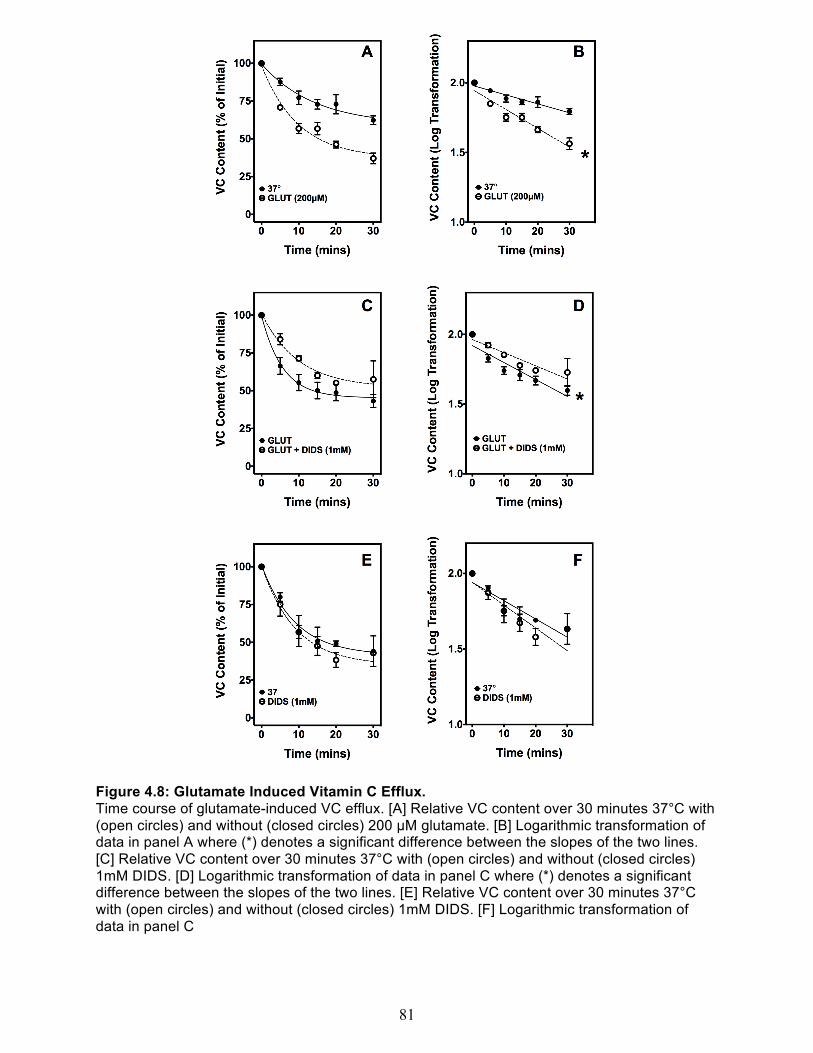
81
Figure 4.8: Glutamate Induced Vitamin C Efflux. Time course of glutamate-induced VC efflux. [A] Relative VC content over 30 minutes 37°C with (open circles) and without (closed circles) 200 µM glutamate. [B] Logarithmic transformation of data in panel A where (*) denotes a significant difference between the slopes of the two lines. [C] Relative VC content over 30 minutes 37°C with (open circles) and without (closed circles) 1mM DIDS. [D] Logarithmic transformation of data in panel C where (*) denotes a significant difference between the slopes of the two lines. [E] Relative VC content over 30 minutes 37°C with (open circles) and without (closed circles) 1mM DIDS. [F] Logarithmic transformation of data in panel C

82
DISCUSSION
Neuronal VC concentration depends on VC transport across the plasma membrane is critical for
proper neuronal function. VC is highly concentrated in neurons compared to surrounding glia
cells that lack SVCT2 in vivo (71). VC transport has been extensively studied in several cell
lines however, the physiologic link between how neuronal VC transport is regulated in culture
and it is regulated in vivo may lie in the VC uptake and efflux systems maintained at the
synapse. Using synaptosomes as a model to investigate VC regulation at the nerve terminal,
this paper describes the SVCT2 expression and function in VC uptake and also the potential
role of VRACs in glutamate-induced VC efflux.
First, we determined that the SVCT2 is expressed at the nerve terminal of superior cervical
ganglia cells in the peripheral nervous system. Immunostaining of these cells showed
colocalization of the SVCT2 with both the NET and VMAT2 at the presynaptic bouton. This data
is not the first to show localization of the SVCT2 in catecholamine excreting cells. SVCT2 is also
present in adrenal chromaffin cells, and likely accounts for their high intra-vesicular VC
concentrations (125). Furthermore, Bornstein et al. (126) showed that adrenal chromaffin cell
function is severely impaired and had morphological abnormalities in SVCT2 null mice. Based
what is known about VMAT2 localization (127), these results may support the notion that the
SVCT2 is carried in regulated dense core vesicles that are stored at presynaptic release sites.
In order to determine if the SVCT2 was expressed in nerve terminals in the CNS, enriched
cortical synaptosome preparations were used. Uptake of VC in primary culture neurons is
dependent on SVCT2 expression (120). Thus it was not surprising that SVCT2 was present in
cortical synaptosome preparations. We determined the SVCT2 expression at the nerve terminal
to be localized primarily in the presynaptic fraction some expression in the cytosolic fraction.
This may indeed imply SVCT2 localization in several distinct compartments, as the cytosolic
83
fraction contains proteins that are localized peri-synaptically and in membrane-bound organelles
including synaptic vesicles and mitochondria. It has recently been shown that HEK-293
mitochondria express SVCT2 (128).
In order to determine if the SVCT2 was functional at nerve terminals in the CNS, crude cortical
synaptosome preparations were used. While the role of SVCT2 has been established in whole
neurons, this study is the first to characterize its function at the nerve terminal. SVCT2 may
function to reuptake VC after depolarization at the pre-synaptic terminal and actively transport
VC inside the secretory vesicles in the cytosolic compartment. To determine if VC uptake in
synaptosomes was consistent with SVCT2 function we performed uptake studies. Consistent
with previous studies, VC uptake plateaued and saturated over time and concentration,
characteristic of facilitated transport on a protein transporter rather than a channel. Kinetic
analysis of VC uptake in synaptosomes showed that the apparent Km was similar to that of the
SVCT2 in neuronal cell systems. Furthermore, known SVCT2 inhibitors, sulfinpyrazone and
phloretin inhibited VC uptake in synaptosomes. Therefore, SVCT2 likely mediates VC transport
at the nerve terminal.
Extracellular VC concentration in the CNS is maintained homeostatically (129). Meile and
Fillenz reported that extracellular VC is regulated homeostatically in vivo, in awake, behaving
animals (130). In these studies, 100 –1000 µM VC was perfused through a microdialysis probe,
with voltammetric detection of extracellular VC in the tissue adjacent to the probe.
Concentrations that were lower than 400 µM caused extracellular VC to fall, whereas higher
concentrations caused an increase in extracellular VC. After each perturbation, extracellular VC
recovered within a few minutes, which demonstrates homeostasis. Homeostatic regulation of
extracellular VC suggests that the extracellular compartment of brain tissue might be an
important site of action for VC (71). To determine role of the SVCT2 in VC efflux, we

84
investigated spontaneous efflux from synaptosomes. Spontaneous VC efflux occurred at 37°C
but not at 4°C. This is consistent with results of previous studies of VC efflux from rat
synaptosomes (123). While SVCT2 appeared to mediate VC uptake into synaptosomes, it
opposed efflux, since the latter was increased by its inhibition. Spontaneous VC efflux most
likely does not involve SVCT2. Additional studies will have to be performed to determine the
mechanism of spontaneous VC efflux.
There have been several papers published recently that have emphasized VC release in
conjunction with a number of neurotransmitters including glutamate (131-133). Glutamate-
induced VC efflux has been studied in astrocytes but the proteins mediating this process in
neurons and synaptosome model are unknown. However, there is growing evidence that
suggests that VRAC might be involved in glutamate-induced VC efflux particularly after cell
swelling in astrocytes (88). We hypothesize that a similar process is happening at the nerve
terminal and that VC efflux was occurring on VRACs in synaptosomes as well.
Our data shows glutamate indeed stimulates VC efflux and that co-incubation with VRAC
inhibitor, DIDS, attenuates glutamate-induced VC efflux. These data suggest DIDS-sensitive
VRACs could mediate glutamate-induced VC efflux at the nerve terminal. Recent studies by
Lane and Lawen (133) demonstrated that the effects of glutamate on VC efflux in astrocytes are
not due to the isolated activation of iGluRs, or mGluRs, since the release of VC from astrocytes
cannot be emulated by agonists that are selective for NMDA and AMPA iGluRs or group 1
mGluRs. It is unclear if group II or III mGluRs are involved. This supports the concept that
glutamate uptake is essential for VC efflux.
One caveat to this study is that DIDS in a non-specific anion channel inhibitor that could inhibit
glutamate uptake and thus subsequently VC efflux (134;135). Therefore we investigated the

85
effect of osmolality on VC efflux. To determine if the change in osmolality associated with the
adding glutamate could be responsible for VC efflux, we assessed VC efflux in a hypotonic
buffer. Hypotonicity-induced VC efflux indeed occurred, and was attenuated with DIDS
suggesting that DIDS-sensitive VRACs could mediate VC efflux due to swelling. This also
indicates a glutamate-independent inhibition of VC efflux by DIDS, and DIDS had no effect on
spontaneous VC efflux. This data also indicates that DIDS influence on VC efflux is independent
of glutamate uptake.
In conclusion, we were able to provide evidence that SVCT2 protein is expressed predominately
at the pre-synaptic terminal and functions to mediate VC uptake at the synapse. VC efflux from
synaptosomes occurs in several conditions including spontaneous induction and glutamate-
induction. While the mechanisms for VC efflux are not completely clear, our studies suggest that
VRACs are likely to have a contribution in glutamate-induced VC efflux. Additional studies will
need to be performed to determine if other types of VC efflux, including depolarization-induced
VC efflux occurs via similar processes (Figure 4.8).
Understanding transport mechanisms for VC are crucial to understanding VC’s role at the
synapse. Currently, lack of molecular identification of VRACs is a significant drawback in the
assessment of their role in VC efflux. Furthermore, as putative VRACs contribution accounts for
less than 50% of the VC efflux by many of the cells tested, including hepatocyte-like Hep-G2
cells (84), SH-SY5Y neuroblastoma cells (83), and K562 cells (86), other release pathways are
probably significant contributors. Further studies will have to be performed in order to
characterize proteins involved in VC efflux.

86
Figure 4.9: Model of Vitamin C Uptake and Efflux at a Representative Nerve Terminal. VC transport is a balance between uptake and efflux. SVCT2 protein is expressed predominately at the pre-synaptic terminal and functions to mediate VC uptake at the synapse. VC efflux occurs in several conditions including (1) spontaneous induction, (2) glutamate-induction and (3) depolarization-induction. There are several proteins that could mediate glutamate uptake in neurons including EAAC1 and GLAST (136). glutamate-induced VC efflux is associated with synaptosome swelling which trigger VC permeable DIDS-sensitive VRACs. Depolarization induces VC efflux by exocytosis of VC contain secretory vesicles.
!!!!!!!!!!!!
!!!!!!!!!!!!
Vitamin C
SVCT2
!!!!!!!!!!!!
aa!
Pre-Synaptic
!!!!!!!!!!!!
!!!!!!!!!!!!
!!!!!!!!!!!!
!!!!!!!!!!!!Post-Synaptic
Spontaneous Glutamate Depolarization
!!!!!!!!!!!!
SVCT2
VRAC
!!!!!!!!!!!!
!!!!!!!!!!!!
VRAC
SPZ
PHL
DIDS
(swelling)
!!!!!!!!!!!!
!!!!!!!!!!!!
Non-SVCT2
Glutamate uptake
Efflux of Anions including VC via VRACs
VC TRANSPORT SUMMARY
Synapse Swelling
Efflux of VC via VRACs and exocytosis
Synapse Swelling
Pre-Synaptic

87
CHATPER V
SUMMARY AND CONCLUSIONS
BACKGROUND
We know a great deal about VC, but its function is as elusive as it is ubiquitous. The full picture
of VC’s contribution to human health has yet to be seen. There has always been a sense of
urgency to understand this molecule and with its discovery, the dogma was born: the body needs
just enough VC to prevent deficiency or scurvy to be healthy. Albert Szent-Gyorgyi, however,
championed the notion that there was a wide gap between scurvy and full health. Linus Pauling,
a renowned leader in the study of VC function, postulated that animals capable of synthesizing
VC made more than the amount required for optimum health because of the burden of metabolic
processes. Furthermore, these amounts could be used to calculate the ideal amount for human
consumption, and suggested the RDA for VC should be 250 – 4000 mg per day based on his
observation that many population groups were not ingesting enough VC for full saturation of
tissues (137). Mark Levine, the leading expert on optimal VC concentration in tissues, may not
support VC intakes as high as Pauling, but nonetheless has reinforced the idea of tissue
saturation by assessing the pharmacokinetics of VC absorption. Currently, the paradigm is
beginning to shift to appreciate the importance of adequate VC concentrations for optimal health
as well as the necessity for a more comprehensive understanding of how VC impacts normal
physiology (138). To date, we have determined VC’s antioxidant and non-antioxidant roles in
processes that vary widely from the integrity of tissue structure (collagen), to regulation of DNA
function and transcription, and to the essential defense from ROS and RNS in virtually every cell

88
type. In this document I have initiated an investigation of a mechanism that couples the
regulation of VC transport with motor coordination and proper neuronal function.
COMBINED VITAMIN C AND E DEFICIENCY ALONG WITH DECREASED SVCT2
EXPRESSION CAUSES MOTOR COORDINATION DEFECTS
First, it is debatable if the RDA of VC is sufficient for optimal health. Although fully developed
scurvy is not as prevalent in the US, VC deficiency and “marginal status,” defined as less than
(20%) and (10%) of RDA value, respectively, is a condition that effects up to 30% of the US
population (113;139). To further complicate the problem, populations that are deficient in VC are
also likely to have a diet that is deficient in other vitamins, low on fruits vegetables and high in fat
and sucrose. These caveats are known to influence the bioavailability and subsequently the
regulation of VC. In order to elucidate how these conditions of low VC levels affect neuronal
health it is important to understand how VC is regulated in the brain.
The role of VC as an antioxidant has received more attention than the other biological functions
of VC. Oxidative stress has been implicated in many neurodegenerative diseases. However, the
mechanisms of how dietary deficiencies of antioxidant contribute to pathology of these diseases
are not fully understood. Therefore, in specific aim 1, we initially evaluated if oxidative stress due
to combined VC and VE deficiency had a neurobehavioral phenotype. A pilot study was
conducted to determine the optimal parameters for adapting the well-known guinea pig model to
mice. We employed the use the Gulo-/- mouse model because of its physiologic relevance, as
these mice, like humans, were dependent on dietary VC. Results from the pilot study indicated
the optimal time to assess behavior was after 4 months of VE deprivation followed by 3 weeks of
VC deprivation. At this time, mice are asymptomatic because scurvy has not fully developed

89
despite the 80% and 75% decrease in VE and VC respectively. These conditions were used in
subsequent studies to determine the individual contribution of each vitamin deficiency and also
the effect of the combined vitamin deficiencies to oxidative stress.
In a second study, we expanded the biochemical and behavioral assessment of the experimental
mice to include VC, VE, GSH and MDA in cortex, cerebellum and liver tissues as well and
anxiety test. We concluded that the combined vitamin deficiency resulted in only a modest
increase of oxidative stress, particularly lipid-peroxidation. However, as observed in our pilot
study, there were no major alterations in behavior. It was not until SVCT2 protein expression was
decreased that a more extensive motor skills deficit was observed. The model using Gulo-/-
/SVTC2+/- was intended to further decrease cellular VC by limiting uptake of the vitamin.
However, this was not observed, as overall VC concentrations in the cortex and cerebellum were
not drastically different. Furthermore, oxidative stress, as measured by MDA, was not markedly
increased. Nonetheless, the combined vitamin deficiency produced a profound effect on the
neurologic phenotype in these mice that included motor-coordination defects.
Therefore, in regard to our original question of whether there is a neurological phenotype that is
associated with oxidative stress and/ or VC deficiency, our results show that a 16-week
deficiency of VE modestly increased oxidative stress markers, but did not affect mouse motor
skills or coordination. VC deficiency in addition to VE deficiency only minimally increased
oxidative stress markers compared to the single deficiency model. However, VC deficiency alone
did begin to impair motor and coordination skills, deficits in which become more evident when the
cellular uptake of VC is decreased. The mechanism does not appear to be due to an increase in
lipid peroxidation and remains to be determined.
90
Possible causes of neurobehavioral changes in cellular vitamin C deficiency.
Acute generalized (whole body) scurvy
Although the mice in this study had no overt physical signs of scurvy beyond weight loss, it is
clear that cellular deficiency of VC due to partial loss of the SVCT2 in the gulo-/-/SVCT2+/- mice
hastened deficits in motor and coordination skills. The latter could be early manifestations of
acute or latent scurvy characterized by fatigue, dull aches and irritability. This may explain poor
performance on behavioral tasks. Therefore, even if the deficits are due to latent scurvy, this
provides evidence that VC deficiencies associated with the earliest stages of scurvy could have
cognitive or neurobehavioral effects. In the human population, symptoms of acute scurvy are
similar, but there are very few studies that look at the effect of low VC levels on motor-
coordination (2;140). Indeed scurvy does cause severe lassitude (lack of physical or mental
energy) and asthenia (weakness) in humans, however the terminal symptomatology of scurvy is
mostly due to vessel and organ rupture because of collagen defects rather than neurological
deficits. This is likely because VC is retained in the brain even under severe VC depletion
(78;141). As noted earlier, such retention in the brain may suggest important neural function.
Although the disease has been associated with paraparesis (partial paralysis of the lower limbs)
in humans, death appears to be due more to complications of systemic collagen dysfunction and
not to a clear neurologic syndrome (44).
Imbalance in energy homeostasis
Kirkwood, et al. (118) used the zebrafish model to investigate the role of VC in energy
homeostasis. This model is useful, as it does not require genetic manipulation because zebrafish,
like humans, cannot make VC. They concluded that whole-body VC deficiency in zebrafish
altered cellular energy-metabolism homeostasis by activation of the purine nucleotide cycle.
Their studies showed that VC decreased adenosine monophosphate (AMP) levels by elevating

91
AMP deaminase (AMPD) activity, however it is unclear if recruitment of the AMP receptor is
altered. This suggests that VC deficiency may lead to inadequate energy production, which could
also contribute to the behavioral deficits observed in our studies in specific aim 1. In a follow-up
(142) study by the same group, it was shown that VE deficiency caused an increase in oxidative
stress that led to depletion of VC. Subsequent damage to the muscle fibers resulted in impaired
muscle function. While we do not think that the oxidative stress in the combined VC and VE
deficient Gulo-/- mouse model was severe enough to cause extensive muscle damage in the
short time-span of our experiments, further studies will have to be performed to determine the
role of VC in energy homeostasis, Furthermore, any effects of VC on the activity of AMPK should
be investigated, as it may have a broader impact on cellular energy metabolism.
DYSREGULATION OF VITAMIN C UPTAKE VIA ALTERED NEURONAL SVCT2
EXPRESSION IMPAIRS NEURONAL FUNCTION.
In the studies for specific aim 1, it appeared that regulation of VC uptake, not necessarily VC
concentration alone, had a substantial contribution to behavior. This was evidenced by the fact
that the Gulo-/-/SVCT2+/+ group and the Gulo-/-/SVCT2+/- group on the same combined VC- and
VE-deficient diet had decidedly different behavioral phenotypes, despite the fact that VC
concentrations in cortex or cerebellum tissue were not significantly different. There is a growing
body of evidence that suggests that not only VC concentration matters, but also local, acute
transport of VC in and out of neurons affects their function (82). Limitations of the studies
performed in specific aim 1 include not being able to determine how VC is compartmentalized
within the brain tissues. Thus, localized severe VC deficiencies in crucial brain areas or even
cells (e.g., Purkinje cerebellar neurons) could have caused the motor and behavioral changes
observed. This caveat should also be considered at the sub-cellular level for what is arguably the
92
most important region for neural signal propagation, the nerve terminal. Decreases in synaptic
VC transport by the SVCT2 protein could lead to acute impaired neuronal function. Evidence for
this possibility derives from functional SVCT2 and electrophysiology studies in hippocampal
neuronal culture. Qiu et al. in the May lab (120) showed that neurons from SVCT2-/- mice
displayed miniature excitatory post-synaptic currents (mEPSC) that were smaller in amplitude
and occurred less frequently compared to wild-type neurons, suggesting that SVCT2 activity is
required for normal glutamatergic function. This paralleled a decrease in the number of dendritic
branches. Furthermore, it was observed that SVCT2-/- neurons expressed fewer GluR1 clusters,
indicating that the transporter is required for normal development of glutamatergic function of
cultured hippocampal neurons. These changes, coupled with the aforementioned localization of
the SVCT2 in the presynaptic bouton in superior cervical ganglion neurons of the peripheral
nervous system, led me to investigate whether SVCT2 was expressed and functional at nerve
terminals in the central nervous system (CNS) in specific aim 2.
TRANSPORT OF VITAMIN C IS TIGHTLY REGULATED AT THE NERVE TERMINAL IN THE
CNS
There are no studies to date that have investigated the mechanisms of VC transport at the
neuronal synapse in the CNS. Therefore, the goal of specific aim 2 was to determine how VC
transport was regulated at the cortical nerve terminal. We employed the use of synaptosomes,
which have long served as a model of the nerve terminal (143;144). These pinched off nerve
endings are fully functional and can be used to investigate transport of molecules at the nerve
terminal. It has been established that VC is transported in and out of synaptosomes (123), but
how this occurred has not been fully characterized.

93
Although it is well established that the SVCT2 was the primary mediator of VC uptake in
neurons (53), the studies described in this document were the first study to demonstrated that
SVCT2 was indeed present in pre-synaptic fraction of synaptosomal preparations. With a series
of uptake studies with inhibitors we were able to characterize VC uptake and conclude that it is
likely mediated by SVCT2. The inhibitors sulfinpyrazone and phloretin, while not specific for
SVCT2, are well-documented inhibitors of VC uptake (82). The fact that the transporter is
present and functional in this specialized region of the neuron is supporting evidence for
compartmentalized non-antioxidant roles of VC within the neuron.
VC efflux has been characterized in many cell types, as noted previously. However, the proteins
that mediate VC transport out of most cells are still unknown. With a series of inhibitor studies in
hepatocytes, Upston, et al. (84) were able to distinguish proteins that mediated DHA uptake
from those that mediated VC release, but the latter were not identified. In the brain, it has long
been established by the studies of Rebec and others that VC uptake and efflux is highly
correlated with changes in behavior (52), For example, the level of behavioral activation in
rodents is correlated with the level of striatal VC release (145). These changes were thought to
be mediated by the striatal glutamatergic system (146). In vivo studies using voltammetric
electrode recordings showed that extracellular VC signals were directly related to the amounts
of microinjected glutamate. This signal was dependent on glutamate reuptake as it was
eliminated in the presence of inhibitors of glutamate uptake, homocysteic acid and d,l-threo-β-
hydroxy-aspartic acid (147).
At the cellular level, studies to elucidate the mechanisms of VC efflux have been carried out
mainly in primary cultures of rat astrocytes. Wilson, et al. (87) hypothesized that glutamate
uptake triggered the release of VC. Using primary cultures of rat cerebral astrocytes they
observed that extracellular glutamate increased VC efflux. Hypertonic media inhibited this efflux.

94
Wilson’s group did not find evidence that glutamate-ascorbate heteroexchange mechanism was
involved, since levels of intracellular VC did not affect glutamate uptake. They proposed rather
that the tonicity of the extracellular fluid was one determinant of VC efflux. The anion channel
inhibitors 4,4’-diisothiocyanatostilbene-2,2’-disulfonic acid (DIDS) inhibited both Na+-dependent
glutamate uptake and VC efflux. These studies were able to distinguish between mediating
proteins as two other inhibitors of volume-sensitive organic anion channels (1,9-dideoxyforskolin
and 5-nitro-2-(3-phenylpropylamino) benzoic acid) (NPPB) did not slow glutamate uptake but
prevented stimulation of VC efflux (87). This prompted them to propose that glutamate causes
cell swelling, which then allows VC efflux on volume-sensitive or –regulated anion channels.
Using these experiments as a guide, I hypothesized that a similar mechanism could mediate
efflux in synaptosomes. Our studies showed that indeed spontaneous and glutamate-induced
VC efflux occurred in synaptosomes. In our spontaneous studies we observed that net VC
transport was a combination of uptake and efflux. SVCT2 inhibition had a greater concentration-
dependence on apparent VC efflux then we originally expected, as a drastic decrease in VC
content was observed. While the mechanism behind this type of efflux was not fully
characterized, the inhibitor study showed that SVCT2 largely mediates uptake and does not
function bi-directionally. Furthermore, VRACs may not contribute to spontaneous efflux, as
incubation with DIDS did not affect VC concentrations during the time course experiments.
My studies of glutamate-induced VC efflux suggest that VRACs may mediate efflux as DIDS did
inhibit decreases in VC levels. Furthermore, this effect was recapitulated with hypotonic
solutions without glutamate. However, future studies should include the use of additional
inhibitors to gain a clearer understanding of the types of channels involved in efflux. For
example, the inhibitor IAA-94 targets different chloride ion channels (CLIC) that may contribute
to VC efflux. Synaptosomes appeared to be more sensitive to the use of inhibitor solvents such
95
as DMSO and ethanol as even low concentrations seem to lyse the synaptosomes and preclude
uptake studies with NPPB and niflumic acid, which target ClC-1 and ClC-2, respectively. The
next steps for the continuation of the work will include inhibitor studies with 1,9-dideoxyforskolin
as well as studies leading to identification of VRAC proteins involved. Currently, none of the
presumed VRACs have been identified and therefore there is no antibody known to be specific
for these channels. Once identified, it will be necessary to determine using siRNA and knockout
experiments whether the channel(s) in question in fact mediate VC efflux and under what
conditions, including changes in osmolality and glutamate stimulation.
What implications does this research have for in vivo models?
The fact that spontaneous VC efflux appeared to level off after ~50% decrease in VC suggests
that intracellular VC levels may regulate its transport. In vivo models have shown changes in
SVCT2 protein levels in response to intracellular VC concentration in brain tissue (77). In an
attempt to determine whether and how intracellular VC levels may alter SVCT2 protein
expression at the nerve terminal, I compared SVCT2 expression in enriched synaptosome
fractions prepared from Gulo-/- mice on VC deficient diet with that of Gulo-/- that were
supplemented with VC. However, there was no change in protein levels in any of the fractions.
Furthermore, I was not able to detect a consist increase in VC uptake in crude synaptosome
preparations from these mice. Although, I did not observe an effect of intracellular VC
concentration by assessing SVCT2 uptake in Gulo-/- mice with or without VC supplementations,
an interesting assessment would be the comparison of VC uptake in synaptosomes prepared
from mice with different protein expression levels of SVCT2 (SVCT2+/- and SVCT2-Transgenic).
This research can impact human health by providing insight on how VC is regulated in the brain,
particularly the cortical neuron. Understanding how this antioxidant’s contributes to the bigger

96
picture of brain health and function is crucial for the advancement of therapeutic options that
can combat specific forms of oxidative stress that are implicated in neurodegeneration.

97
APPENDIX
PILOT STUDY BIOCHEMICAL AND BEHAVIOR ASSESMENT
Wildtype (Gulo+/+; SVCT2+/+) mice were subject to 0, 2, 4 or 6 months of vitmain E deprivation followed by 3 weeks of vitamin C deprivation.
0 MON 2 MON 4 MON 6 MON0
1
2
3
4
Cortex Vitamin C
VE Deprivation Time
(µm
ol/g
)
0 MON 2 MON 4 MON 6 MON0
5
10
15
Cortex F2-Isoprostanes
VE Deprivation Time
(ng/
g)
0 MON 2 MON 4 MON 6 MON0.0
0.5
1.0
1.5
2.0
2.5
Cortex MDA
VE Deprivation Time
(nm
ol/m
L)
0 MON 2 MON 4 MON 6 MON0
50
100
150
200
250
Cortex F4-Neuroprostanes
VE Deprivation Time
(ng/
g)

98
0 MON 2 MON 4 MON 6 MON0
5
10
15
20
25
Liver Vitamin E
VE Deprivation Time
(nm
ol/g
)
0 MON 2 MON 4 MON 6 MON0
50
100
150
200
Liver Isoprostanes
VE Deprivation Time
(ng/
g)
0 5 10 150
10
20
30
Weight 2 MON
Time (weeks)
Wei
ght (
g)
MalesFemales
0 10 20 3015
20
25
30
35
Weight 6 MON
Time (weeks)
Wei
ght (
g)
0 5 10 15 200
10
20
30
Weight 4 MON
Time (weeks)
Wei
ght (
g)
MalesFemales

99
0 MON 2 MON 4 MON 6 MON0
2000
4000
6000
8000
Ambulatory Distance
VE Deprivation Time
Am
bula
troy
Dis
tanc
e (c
m)
0 M 2 MON 4 MON 6 MON0
100
200
300
Inverted Screen
VE Deprivation Time
Late
ncy
to F
all (
sec)
0 MON 2 MON 4 MON 6 MON0
10
20
30
40
50
Ambulatory Velocity
VE Deprivation Time
Am
bula
troy
Vel
ocity
(cm
2 )
0 MON 2 MON 4 MON 6 MON0
20
40
60
80
Gait
VE Deprivation Time
Strid
e Le
ngth
(mm
)

100
REFERENCES
1. Dolberg,O.J., Elis,A., and Lishner,M. 2010. Scurvy in the 21st century. Isr. Med. Assoc. J. 12:183-184.
2. Hodges,R.E., Hood,J., Canham,J.E., Sauberlich,H.E., and Baker,E.M. 1971. Clinical manifestations of ascorbic acid deficiency in man. Am. J Clin. Nutr. 24:432-443.
3. Olmedo,J.M., Yiannias,J.A., Windgassen,E.B., and Gornet,M.K. 2006. Scurvy: a disease almost forgotten. Int. J. Dermatol. 45:909-913.
4. Levine,M. 1986. New concepts in the biology and biochemistry of ascorbic acid. N. Engl. J. Med. 314:892-902.
5. Lind,J. 1772. A Treatise on the Scurvy. The Classics of Medicine Library, Gryphon Editions, Ltd. Birmingham, AL. 245 pp.
6. Hughes,R.E. 1975. James Lind and the cure of scurvy: an experimental approach. Med. Hist 19:342-351.
7. De Tullio,M.C., and Arrigoni,O. 2004. Hopes, disillusions and more hopes from vitamin C. Cell. Mol. Life Sci. 61:209-219.
8. SVIRBELY,J.L., and Szent-Gyorgyi,A. 1932. The chemical nature of vitamin C. Biochem. J. 26:865-870.
9. Nishikimi,M., and Yagi,K. 1991. Molecular basis for the deficiency in humans of gulonolactone oxidase, a key enzyme for ascorbic acid biosynthesis. Am. J. Clin. Nutr. 54:1203S-1208S.
10. Deutsch,J.C., and Santhosh-Kumar,C.R. 1996. Dehydroascorbic acid undergoes hydrolysis on solubilization which can be reversed with mercaptoethanol. J. Chromatogr. A 724:271-278.
11. Tolbert,B.M., and Ward,J.B. 1982. Dehydroascorbic acid. In Ascorbic Acid: Chemistry, Metabolism, and Uses. P.A.Seib, and Tolbert,B.M., editors. American Chemical Society. Washington, D.C. 101-123.
12. May,J.M., and Asard,H. 2004. Ascorbate Recycling. In Vitamin C. Functions and biochemistry in animals and plants. H.Asard, May,J.M., and Smirnoff,N., editors. Bios Scientific Publishers. London. 139-158.
13. Levine,M., Wang,Y.H., and Rumsey,S.C. 1999. Analysis of ascorbic acid and dehydroascorbic acid in biological samples. Methods Enzymol. 299:65-76.
14. Ames,B.N., Shigenaga,M.K., and Hagen,T.M. 1993. Oxidants, antioxidants, and the degenerative diseases of aging. Proc. Natl. Acad. Sci. U. S. A 90:7915-7922.

101
15. Carr,A., and Frei,B. 1999. Does vitamin C act as a pro-oxidant under physiological conditions? FASEB J. 13:1007-1024.
16. Frei,B., England,L., and Ames,B.N. 1989. Ascorbate is an outstanding antioxidant in human blood plasma. Proc. Natl. Acad. Sci. USA 86:6377-6381.
17. May,J.M., Qu,Z.C., Neel,D.R., and Li,X. 2003. Recycling of vitamin C from its oxidized forms by human endothelial cells. Biochim. Biophys. Acta Mol. Cell Res. 1640:153-161.
18. Buettner,G.R. 1993. The pecking order of free radicals and antioxidants: lipid peroxidation, alpha-tocopherol, and ascorbate. Arch. Biochem. Biophys. 300:535-543.
19. Hill,K.E., Montine,T.J., Motley,A.K., Li,X., May,J.M., and Burk,R.F. 2003. Combined deficiency of vitamins E and C causes paralysis and death in guinea pigs. Am. J. Clin. Nutr. 77:1484-1488.
20. Burk,R.F., Christensen,J.M., Maguire,M.J., Austin,L.M., Whetsell,W.O., Jr., May,J.M., Hill,K.E., and Ebner,F.F. 2006. A combined deficiency of vitamins E and C causes severe central nervous system damage in guinea pigs. J. Nutr. 136:1576-1581.
21. Li,X., Huang,J., and May,J.M. 2003. Ascorbic acid spares alpha-tocopherol and decreases lipid peroxidation in neuronal cells. Biochem. Biophys. Res. Commun. 305:656-661.
22. Bruno,R.S., Leonard,S.W., Atkinson,J., Montine,T.J., Ramakrishnan,R., Bray,T.M., and Traber,M.G. 2006. Faster plasma vitamin E disappearance in smokers is normalized by vitamin C supplementation. Free Radic. Biol. Med. 40:689-697.
23. D'Uscio,L.V., Milstien,S., Richardson,D., Smith,L., and Katusic,Z.S. 2003. Long-term vitamin C treatment increases vascular tetrahydrobiopterin levels and nitric oxide synthase activity. Circ. Res. 92:88-95.
24. Smith,A.R., Visioli,F., and Hagen,T.M. 2002. Vitamin C matters: increased oxidative stress in cultured human aortic endothelial cells without supplemental ascorbic acid. FASEB J. 16:1102-1104.
25. May,J.M., and Harrison,F.E. 2013. Role of Vitamin C in the Function of the Vascular Endothelium. Antioxid. Redox. Signal.
26. Harayama,S., Kok,M., and Neidle,E.L. 1992. Functional and evolutionary relationships among diverse oxygenases. Annu. Rev. Microbiol. 46:565-601.
27. Ahn,N.G., and Klinman,J.P. 1987. Activation of dopamine beta-monooxygenase by external and internal electron donors in resealed chromaffin granule ghosts. J. Biol. Chem. 262:1485-1492.
28. Diliberto,E.J., Jr., and Allen,P.L. 1981. Mechanism of dopamine-beta-hydroxylation. Semidehydroascorbate as the enzyme oxidation product of ascorbate. J. Biol. Chem. 256:3385-3393.

102
29. Friedman,S., and Kaufman,S. 1965. 3,4-dihydroxyphenylethylamine beta-hydroxylase. Physical properties, copper content, and role of copper in the catalytic acttivity. J Biol. Chem. 240:4763-4773.
30. Eipper,B.A., and Mains,R.E. 1991. The role of ascorbate in the biosynthesis of neuroendocrine peptides. Am. J Clin. Nutr. 54:1153S-1156S.
31. Arrigoni,O., and De Tullio,M.C. 2002. Ascorbic acid: much more than just an antioxidant. Biochim. Biophys. Acta Gen. Subj. 1569:1-9.
32. Jia,S., McGinnis,K., VanDusen,W.J., Burke,C.J., Kuo,A., Griffin,P.R., Sardana,M.K., Elliston,K.O., Stern,A.M., and Friedman,P.A. 1994. A fully active catalytic domain of bovine aspartyl (asparaginyl) beta-hydroxylase expressed in Escherichia coli: characterization and evidence for the identification of an active-site region in vertebrate alpha-ketoglutarate-dependent dioxygenases. Proc. Natl. Acad. Sci. U. S. A. 91:7227-7231.
33. Moran,G.R. 2005. 4-Hydroxyphenylpyruvate dioxygenase. Arch. Biochem. Biophys. 433:117-128.
34. Englard,S., and Seifter,S. 1986. The biochemical functions of ascorbic acid. Annu. Rev. Nutr. 6:365-406.
35. Clark,A.G., Rohrbaugh,A.L., Otterness,I., and Kraus,V.B. 2002. The effects of ascorbic acid on cartilage metabolism in guinea pig articular cartilage explants. Matrix Biol. 21:175-184.
36. Boulahbel,H., Duran,R.V., and Gottlieb,E. 2009. Prolyl hydroxylases as regulators of cell metabolism. Biochem. Soc. Trans. 37:291-294.
37. Bruick,R.K., and McKnight,S.L. 2001. A conserved family of prolyl-4-hydroxylases that modify HIF. Science 294:1337-1340.
38. Chung,T.L., Turner,J.P., Thaker,N.Y., Kolle,G., Cooper-White,J.J., Grimmond,S.M., Pera,M.F., and Wolvetang,E.J. 2010. Ascorbate promotes epigenetic activation of CD30 in human embryonic stem cells. Stem Cells 28:1782-1793.
39. Chung,T.L., Brena,R.M., Kolle,G., Grimmond,S.M., Berman,B.P., Laird,P.W., Pera,M.F., and Wolvetang,E.J. 2010. Vitamin C Promotes Widespread Yet Specific DNA Demethylation of the Epigenome in Human Embryonic Stem Cells. Stem Cells 28:1848-1855.
40. Shi,Y., Zhao,Y., and Deng,H. 2010. Powering reprogramming with vitamin C. Cell Stem Cell 6:1-2.
41. Levine,M., Conry-Cantilena,C., Wang,Y.H., Welch,R.W., Washko,P.W., Dhariwal,K.R., Park,J.B., Lazarev,A., Graumlich,J.F., King,J. et al 1996. Vitamin C pharmacokinetics in healthy volunteers: Evidence for a recommended dietary allowance. Proc. Natl. Acad. Sci. USA 93:3704-3709.

103
42. Levine,M., Wang,Y.H., Padayatty,S.J., and Morrow,J. 2001. A new recommended dietary allowance of vitamin C for healthy young women. Proc. Natl. Acad. Sci. USA 98:9842-9846.
43. Levine,M., Dhariwal,K.R., Welch,R.W., Wang,Y.H., and Park,J.B. 1995. Determination of optimal vitamin C requirements in humans. Am. J. Clin. Nutr. 62 Suppl.:1347S-1356S.
44. Kinsman,R.A., and Hood,J. 1971. Some behavioral effects of ascorbic acid deficiency. Am. J. Clin. Nutr. 24:455-464.
45. Hirschmann,J.V., and Raugi,G.J. 1999. Adult scurvy. J. Am. Acad. Dermatol. 41:895-906.
46. DeSantis,J. 1993. Scurvy and psychiatric symptoms. Perspect. Psychiatr. Care 29:18-22.
47. Gan,R., Eintracht,S., and Hoffer,L.J. 2008. Vitamin C deficiency in a university teaching hospital. J. Am. Coll. Nutr. 27:428-433.
48. Rice,M.E., and Russo-Menna,I. 1998. Differential compartmentalization of brain ascorbate and glutathione between neurons and glia. Neuroscience 82:1213-1223.
49. Wilson,J.X. 1997. Antioxidant defense of the brain: a role for astrocytes. Can. J. Physiol Pharmacol. 75:1149-1163.
50. Halliwell,B. 2006. Oxidative stress and neurodegeneration: where are we now? J. Neurochem. 97:1634-1658.
51. May,J.M. 2012. Vitamin C transport and its role in the central nervous system. Subcell. Biochem. 56:85-103.
52. Rebec,G.V., and Pierce,R.C. 1994. A vitamin as neuromodulator: Ascorbate release into the extracellular fluid of the brain regulates dopaminergic and glutamatergic transmission. Prog. Neurobiol. 43:537-565.
53. Harrison,F.E., and May,J.M. 2009. Vitamin C function in the brain: Vital role of the ascorbate transporter (SVCT2). Free Radic. Biol Med. 45:719-730.
54. Vera,J.C., Rivas,C.I., Fischbarg,J., and Golde,D.W. 1993. Mammalian facilitative hexose transporters mediate the transport of dehydroascorbic acid. Nature 364:79-82.
55. Rumsey,S.C., Daruwala,R., Al Hasani,H., Zarnowski,M.J., Simpson,I.A., and Levine,M. 2000. Dehydroascorbic acid transport by GLUT4 in Xenopus oocytes and isolated rat adipocytes. J. Biol. Chem. 275:28246-28253.
56. Rumsey,S.C., Kwon,O., Xu,G.W., Burant,C.F., Simpson,I., and Levine,M. 1997. Glucose transporter isoforms GLUT1 and GLUT3 transport dehydroascorbic acid. J. Biol. Chem. 272:18982-18989.
57. Bigley,R., Wirth,M., Layman,D., Riddle,M., and Stankova,L. 1983. Interaction between glucose and dehydroascorbate transport in human neutrophils and fibroblasts. Diabetes 32:545-548.

104
58. Bigley,R.H., and Stankova,L. 1974. Uptake and reduction of oxidized and reduced ascorbate by human leukocytes. J. Exp. Med. 139:1084-1092.
59. Agus,D.B., Gambhir,S.S., Pardridge,W.M., Speilholz,C., Baselga,J., and Vera,J.C. 1997. Vitamin C crosses the blood-brain barrier in the oxidized form through the glucose transporters. J. Clin. Invest. 100:2842-2848.
60. May,J.M., Qu,Z., and Morrow,J.D. 2001. Mechanisms of ascorbic acid recycling in human erythrocytes. Biochim. Biophys. Acta 1528:159-166.
61. Tsukaguchi,H., Tokui,T., Mackenzie,B., Berger,U.V., Chen,X.-Z., Wang,Y.X., Brubaker,R.F., and Hediger,M.A. 1999. A family of mammalian Na+-dependent L-ascorbic acid transporters. Nature 399:70-75.
62. Liang,W.J., Johnson,D., and Jarvis,S.M. 2001. Vitamin C transport systems of mammalian cells. Mol. Membr. Biol. 18:87-95.
63. Hediger,M.A., Romero,M.F., Peng,J.B., Rolfs,A., Takanaga,H., and Bruford,E.A. 2004. The ABCs of solute carriers: physiological, pathological and therapeutic implications of human membrane transport proteins - Introduction. Pflugers Arch. 447:465-468.
64. Rajan,D.P., Huang,W., Dutta,B., Devoe,L.D., Leibach,F.H., Ganapathy,V., and Prasad,P.D. 1999. Human placental sodium-dependent vitamin C transporter (SVCT2): Molecular cloning and transport function. Biochem. Biophys. Res. Commun. 262:762-768.
65. Godoy,A., Ormazabal,V., Moraga-Cid,G., Zuniga,F.A., Sotomayor,P., Barra,V., Vasquez,O., Montecinos,V., Mardones,L., Guzman,C. et al 2006. Mechanistic insights and functional determinants of the transport cycle of the ascorbic acid transporter SVCT2. Activation by sodium and absolute dependence on bivalent cations. J. Biol. Chem. 282:615-624.
66. García,M.L., Salazar,K., Millán,C., Rodríguez,F., Montecinos,H., Caprile,T., Silva,C., Cortes,C., Reinicke,K., Vera,J.C. et al 2005. Sodium vitamin C cotransporter SVCT2 is expressed in hypothalamic glial cells. Glia 50:32-47.
67. Sotiriou,S., Gispert,S., Cheng,J., Wang,Y.H., Chen,A., Hoogstraten-Miller,S., Miller,G.F., Kwon,O., Levine,M., Guttentag,S.H. et al 2002. Ascorbic-acid transporter Slc23a1 is essential for vitamin C transport into the brain and for perinatal survival. Nature Med. 8:514-517.
68. Qiao,H., and May,J.M. 2008. Development of ascorbate transport in brain capillary endothelial cells in culture. Brain Res. 1208:79-86.
69. Reiber,H., Ruff,M., and Uhr,M. 1993. Ascorbate concentration in human cerebrospinal fluid (CSF) and serum. Intrathecal accumulation and CSF flow rate. Clin. Chim. Acta 217:163-173.
70. Schippling,S., Kontush,A., Arlt,S., Buhmann,C., Sturenburg,H.J., Mann,U., Muller-Thomsen,T., and Beisiegel,U. 2000. Increased lipoprotein oxidation in Alzheimer's disease. Free Radic. Biol. Med. 28:351-360.

105
71. Rice,M.E. 2000. Ascorbate regulation and its neuroprotective role in the brain. Trends Neurosci. 23:209-216.
72. Liang,W.J., Johnson,D., Ma,L.S., and Jarvis,S.M. 2002. Regulation of the human vitamin C transporters and expressed in COS-1 cells by protein kinase C. Am. J. Physiol. Cell Physiol. 283:C1696-C1704.
73. Korcok,J., Yan,R., Siushansian,R., Dixon,S.J., and Wilson,J.X. 2000. Sodium-ascorbate cotransport controls intracellular ascorbate concentration in primary astrocyte cultures expressing the SVCT2 transporter. Brain Res. 881:144-151.
74. Siushansian,R., and Wilson,J.X. 1995. Ascorbate transport and intracellular concentration in cerebral astrocytes. J. Neurochem. 65:41-49.
75. Daruwala,R., Song,J., Koh,W.S., Rumsey,S.C., and Levine,M. 1999. Cloning and functional characterization of the human sodium-dependent vitamin C transporters hSVCT1 and hSVCT2. FEBS Lett. 460:480-484.
76. May,J.M., and Qu,Z.C. 2004. Redox regulation of ascorbic acid transport: Role of transporter and intracellular sulfhydryls. Biofactors 20:199-211.
77. Meredith,M.E., Harrison,F.E., and May,J.M. 2011. Differential regulation of the ascorbic acid transporter SVCT2 during development and in response to ascorbic acid depletion. Biochem. Biophys. Res. Commun. 414:737-742.
78. Hughes,R.E., Hurley,R.J., and Jones,P.R. 1971. The retention of ascorbic acid by guinea-pig tissues. Br. J. Nutr. 26:433-438.
79. May,J.M. 2011. The SLC23 family of ascorbate transporters: ensuring that you get and keep your daily dose of vitamin C. Br. J Pharmacol. 164:1793-1801.
80. Davies,A.R., Belsey,M.J., and Kozlowski,R.Z. 2004. Volume-sensitive organic osmolyte/anion channels in cancer: novel approaches to studying channel modulation employing proteomics technologies. Ann. N. Y. Acad. Sci. 1028:38-55.
81. Furst,J., Gschwentner,M., Ritter,M., Botta,G., Jakab,M., Mayer,M., Garavaglia,L., Bazzini,C., Rodighiero,S., Meyer,G. et al 2002. Molecular and functional aspects of anionic channels activated during regulatory volume decrease in mammalian cells. Pflugers. Arch. 444:1-25.
82. Wilson,J.X. 2005. Regulation of vitamin C transport. Annu. Rev. Nutr. 25:105-125.
83. May,J.M., Li,L., Hayslett,K., and Qu,Z.C. 2006. Ascorbate transport and recycling by SH-SY5Y neuroblastoma cells: Response to glutamate toxicity. Neurochem. Res. 31:785-794.
84. Upston,J.M., Karjalainen,A., Bygrave,F.L., and Stocker,R. 1999. Efflux of hepatic ascorbate: a potential contributor to the maintenance of plasma vitamin C. Biochem. J. 342:49-56.
106
85. Davis,K.A., Samson,S.E., Best,K., Mallhi,K.K., Szewczyk,M., Wilson,J.X., Kwan,C.Y., and Grover,A.K. 2006. Ca(2+)-mediated ascorbate release from coronary artery endothelial cells. Br. J. Pharmacol. 147:131-139.
86. Lane,D.J., and Lawen,A. 2008. Non-transferrin iron reduction and uptake are regulated by transmembrane ascorbate cycling in K562 cells. J. Biol. Chem. 283:12701-12708.
87. Wilson,J.X., Peters,C.E., Sitar,S.M., Daoust,P., and Gelb,A.W. 2000. Glutamate stimulates ascorbate transport by astrocytes. Brain Res. 858:61-66.
88. Siushansian,R., Dixon,S.J., and Wilson,J.X. 1996. Osmotic swelling stimulates ascorbate efflux from cerebral astrocytes. J. Neurochem. 66:1227-1233.
89. Padayatty,S.J., Doppman,J.L., Chang,R., Wang,Y., Gill,J., Papanicolaou,D.A., and Levine,M. 2007. Human adrenal glands secrete vitamin C in response to adrenocorticotrophic hormone. Am. J. Clin. Nutr. 86:145-149.
90. May,J.M., and Qu,Z.C. 2009. Ascorbic acid efflux and re-uptake in endothelial cells: maintenance of intracellular ascorbate. Mol. Cell Biochem. 325:79-88.
91. Hillered,L., Persson,L., Bolander,H.G., Hallstrom,A., and Ungerstedt,U. 1988. Increased extracellular levels of ascorbate in the striatum after middle cerebral artery occlusion in the rat monitored by intracerebral microdialysis. Neurosci. Lett. 95:286-290.
92. Miele,M., Boutelle,M.G., and Fillenz,M. 1994. The physiologically induced release of ascorbate in rat brain is dependent on impulse traffic, calcium influx and glutamate uptake. Neuroscience 62:87-91.
93. Grünewald,R.A. 1993. Ascorbic acid in the brain. Brain Res. Rev. 18:123-133.
94. Yusa,T. 2001. Increased extracellular ascorbate release reflects glutamate re-uptake during the early stage of reperfusion after forebrain ischemia in rats. Brain Res. 897:104-113.
95. Wilson,J.X., Jaworski,E.M., Kulaga,A., and Dixon,S.J. 1990. Substrate regulation of ascorbate transport activity in astrocytes. Neurochem. Res. 15:1037-1043.
96. Rebec,G.V., and Wang,Z. 2001. Behavioral activation in rats requires endogenous ascorbate release in striatum. J Neurosci. 21:668-675.
97. Sandstrom,M.I., and Rebec,G.V. 2007. Extracellular ascorbate modulates glutamate dynamics: role of behavioral activation. BMC. Neurosci. 8:32.
98. Moretti,M., Colla,A., de Oliveira,B.G., Dos Santos,D.B., Budni,J., de Freitas,A.E., Farina,M., and Severo Rodrigues,A.L. 2012. Ascorbic acid treatment, similarly to fluoxetine, reverses depressive-like behavior and brain oxidative damage induced by chronic unpredictable stress. J Psychiatr. Res. 46:331-340.
99. Moretti,M., Freitas,A.E., Budni,J., Fernandes,S.C., Balen,G.O., and Rodrigues,A.L. 2011. Involvement of nitric oxide-cGMP pathway in the antidepressant-like effect of ascorbic acid in the tail suspension test. Behav. Brain Res. 225:328-333.
107
100. Moretti,M., Budni,J., Dos Santos,D.B., Antunes,A., Daufenbach,J.F., Manosso,L.M., Farina,M., and Rodrigues,A.L. 2013. Protective effects of ascorbic Acid on behavior and oxidative status of restraint-stressed mice. J Mol. Neurosci. 49:68-79.
101. Brody,S. 2002. High-dose ascorbic acid increases intercourse frequency and improves mood: a randomized controlled clinical trial. Biol. Psychiatry 52:371-374.
102. Maeda,N., Hagihara,H., Nakata,Y., Hiller,S., Wilder,J., and Reddick,R. 2000. Aortic wall damage in mice unable to synthesize ascorbic acid. Proc. Natl. Acad. Sci. USA 97:841-846.
103. Harrison,F.E., Yu,S.S., Van Den Bossche,K.L., Li,L., May,J.M., and McDonald,M.P. 2008. Elevated oxidative stress and sensorimotor deficits but normal cognition in mice that cannot synthesize ascorbic acid. J. Neurochem. 106:1198-1208.
104. Harrison,F.E., Dawes,S.M., Meredith,M.E., Babaev,V.R., Li,L., and May,J.M. 2010. Low vitamin C and increased oxidative stress cell death in mice that lack the sodium-dependent vitamin C transporter SVCT2. Free Radic. Biol. Med. 49:821-829.
105. Lang,J.K., Gohil,K., and Packer,L. 1986. Simultaneous determination of tocopherols, ubiquinols, and ubiquinones in blood, plasma, tissue homogenates, and subcellular fractions. Anal. Biochem. 157:106-116.
106. Harrison,F.E., Hosseini,A.H., Dawes,S.M., Weaver,S., and May,J.M. 2009. Ascorbic acid attenuates scopolamine-induced spatial learning deficits in the water maze. Behav. Brain Res. 205:550-558.
107. Milne,G.L., Yin,H., Brooks,J.D., Sanchez,S., Jackson,R.L., and Morrow,J.D. 2007. Quantification of f2-isoprostanes in biological fluids and tissues as a measure of oxidant stress. Methods Enzymol. 433:113-126.
108. Kagan,V.E., Serbinova,E.A., Forte,T., Scita,G., and Packer,L. 1992. Recycling of vitamin E in human low density lipoproteins. J. Lipid Res. 33:385-397.
109. Frikke-Schmidt,H., Tveden-Nyborg,P., Birck,M.M., and Lykkesfeldt,J. 2011. High dietary fat and cholesterol exacerbates chronic vitamin C deficiency in guinea pigs. Br. J. Nutr. 105:54-61.
110. Zhang,X., Dong,F., Ren,J., Driscoll,M.J., and Culver,B. 2005. High dietary fat induces NADPH oxidase-associated oxidative stress and inflammation in rat cerebral cortex. Exp. Neurol. 191:318-325.
111. Suttorp,N., Weber,U., Welsch,T., and Schudt,C. 1993. Role of phosphodiesterases in the regulation of endothelial permeability in vitro. J Clin. Invest 91:1421-1428.
112. Wrieden,W.L., Hannah,M.K., Bolton-Smith,C., Tavendale,R., Morrison,C., and Tunstall-Pedoe,H. 2000. Plasma vitamin C and food choice in the third Glasgow MONICA population survey. J Epidemiol. Community Health 54:355-360.

108
113. Hampl,J.S., Taylor,C.A., and Johnston,C.S. 2004. Vitamin C deficiency and depletion in the United States: the Third National Health and Nutrition Examination Survey, 1988 to 1994. Am. J. Public. Health. 94:870-875.
114. Hill,K.E., Motley,A.K., Li,X., May,J.M., and Burk,R.F. 2001. Combined selenium and vitamin E deficiency causes fatal myopathy in guinea pigs. J. Nutr. 131:1798-1802.
115. Yokota,T., Igarashi,K., Uchihara,T., Jishage,K., Tomita,H., Inaba,A., Li,Y., Arita,M., Suzuki,H., Mizusawa,H. et al 2001. Delayed-onset ataxia in mice lacking α -tocopherol transfer protein: model for neuronal degeneration caused by chronic oxidative stress. Proc. Natl. Acad. Sci. U. S. A 98:15185-15190.
116. Kadiiska,M.B., Gladen,B.C., Baird,D.D., Germolec,D., Graham,L.B., Parker,C.E., Nyska,A., Wachsman,J.T., Ames,B.N., Basu,S. et al 2005. Biomarkers of oxidative stress study II: are oxidation products of lipids, proteins, and DNA markers of CCl4 poisoning? Free Radic. Biol Med. 38:698-710.
117. Crawley,J.N. 2008. Behavioral phenotyping strategies for mutant mice. Neuron 57:809-818.
118. Kirkwood,J.S., Lebold,K.M., Miranda,C.L., Wright,C.L., Miller,G.W., Tanguay,R.L., Barton,C.L., Traber,M.G., and Stevens,J.F. 2012. Vitamin C deficiency activates the purine nucleotide cycle in zebrafish. J Biol. Chem. 287:3833-3841.
119. Hediger,M.A. 2002. New view at C. Nat. Med. 8:445-446.
120. Qiu,S., Li,L., Weeber,E.J., and May,J.M. 2007. Ascorbate transport by primary cultured neurons and its role in neuronal function and protection against excitotoxicity. J. Neurosci. Res. 85:1046-1056.
121. Molyneaux,B.J., Arlotta,P., Menezes,J.R., and Macklis,J.D. 2007. Neuronal subtype specification in the cerebral cortex. Nat. Rev. Neurosci. 8:427-437.
122. Kiyatkin,E.A., and Rebec,G.V. 1998. Heterogeneity of ventral tegmental area neurons: single-unit recording and iontophoresis in awake, unrestrained rats. Neuroscience. 85:1285-1309.
123. Grunewald,R.A., and Fillenz,M. 1984. Release of ascorbate from a synaptosomal fraction of rat brain. Neurochem. Int. 6:491-500.
124. Wilson,J.X., and Dixon,S.J. 1989. Ascorbic acid transport in mouse and rat astrocytes is reversibly inhibited by furosemide, SITS, and DIDS. Neurochem. Res. 14:1169-1175.
125. Ingebretsen,O.C., Terland,O., and Flatmark,T. 1980. Subcellular distribution of ascorbate in bovine adrenal medulla. Evidence for accumulation in chromaffin granules against a concentration gradient. Biochim. Biophys. Acta 628:182-189.
126. Bornstein,S.R., Yoshida-Hiroi,M., Sotiriou,S., Levine,M., Hartwig,H.G., Nussbaum,R.L., and Eisenhofer,G. 2003. Impaired adrenal catecholamine system function in mice with deficiency of the ascorbic acid transporter (SVCT2). FASEB J 17:1928-1930.
109
127. Matthies,H.J., Han,Q., Shields,A., Wright,J., Moore,J.L., Winder,D.G., Galli,A., and Blakely,R.D. 2009. Subcellular localization of the antidepressant-sensitive norepinephrine transporter. BMC. Neurosci. 10:65.
128. Munoz-Montesino,C., Roa,F.J., Pena,E., Gonzalez,M., Sotomayor,K., Inostrosa,E., Munoz,C., Gonzalez,I., Maldonado,M., Soliz,C. et al 2014. Mitochondrial ascorbic acid transport is mediated by a low-affinity form of the sodium-coupled ascorbic acid transporter-2. Free. Radic. Biol. Med.
129. Schenk,J.O., Miller,E., Gaddis,R., and Adams,R.N. 1982. Homeostatic control of ascorbate concentration in CNS extracellular fluid. Brain Res. 253:353-356.
130. Miele,M., and Fillenz,M. 1996. In vivo determination of extracellular brain ascorbate. J. Neurosci. Methods 70:15-19.
131. Sun,J.Y., Yang,J.Y., Wang,F., Wang,J.Y., Song,W., Su,G.Y., Dong,Y.X., and Wu,C.F. 2011. Lesions of nucleus accumbens affect morphine-induced release of ascorbic acid and GABA but not of glutamate in rats. Addict. Biol. 16:540-550.
132. Corti,A., Casini,A.F., and Pompella,A. 2010. Cellular pathways for transport and efflux of ascorbate and dehydroascorbate. Arch. Biochem. Biophys. 500:107-115.
133. Lane,D.J., and Lawen,A. 2012. The Glutamate Aspartate Transporter (GLAST) Mediates L: -Glutamate-Stimulated Ascorbate-Release Via Swelling-Activated Anion Channels in Cultured Neonatal Rodent Astrocytes. Cell Biochem. Biophys.
134. Sitar,S.M., Hanifi-Moghaddam,P., Gelb,A., Cechetto,D.F., Siushansian,R., and Wilson,J.X. 1999. Propofol prevents peroxide-induced inhibition of glutamate transport in cultured astrocytes. Anesthesiology 90:1446-1453.
135. Bellocchio,E.E., Reimer,R.J., Fremeau,R.T., Jr., and Edwards,R.H. 2000. Uptake of glutamate into synaptic vesicles by an inorganic phosphate transporter. Science. 289:957-960.
136. Rothstein,J.D., Martin,L., Levey,A.I., Dykes-Hoberg,M., Jin,L., Wu,D., Nash,N., and Kuncl,R.W. 1994. Localization of neuronal and glial glutamate transporters. Neuron 13:713-725.
137. Pauling,L. 1968. Orthomolecular psychiatry. Varying the concentrations of substances normally present in the human body may control mental disease. Science. 160:265-271.
138. Padayatty,S.J., and Levine,M. 2001. New insights into the physiology and pharmacology of vitamin C. Can. Med. Assoc. J. 164:353-355.
139. Kositsawat,J., and Freeman,V.L. 2011. Vitamin C and A1c Relationship in the National Health and Nutrition Examination Survey (NHANES) 2003-2006. J Am. Coll. Nutr. 30:477-483.
140. Hodges,R.E., Baker,E.M., Hood,J., Sauberlich,H.E., and March,S.C. 1969. Experimental scurvy in man. Am. J. Clin. Nutr. 22:535-548.

110
141. Hornig,D. 1975. Distribution of ascorbic acid, metabolites and analogues in man and animals. Ann. NY Acad. Sci. 258:103-118.
142. Lebold,K.M., Lohr,C.V., Barton,C.L., Miller,G.W., Labut,E.M., Tanguay,R.L., and Traber,M.G. 2013. Chronic vitamin E deficiency promotes vitamin C deficiency in zebrafish leading to degenerative myopathy and impaired swimming behavior. Comp. Biochem. Physiol. C. Toxicol. Pharmacol. 157:382-389.
143. Whittaker,V.P., Michaelson,I.A., and Kirkland,R.J. 1964. The separation of synaptic vesicles from nerve-ending particles ('synaptosomes'). Biochem. J. 90:293-303.
144. Whittaker,V.P. 1993. Thirty years of synaptosome research. J. Neurocytol. 22:735-742.
145. O'Neill,R.D., Fillenz,M., Sundstrom,L., and Rawlins,J.N. 1984. Voltammetrically monitored brain ascorbate as an index of excitatory amino acid release in the unrestrained rat. Neurosci. Lett. 52:227-233.
146. Rebec,G.V., Witowski,S.R., Sandstrom,M.I., Rostand,R.D., and Kennedy,R.T. 2005. Extracellular ascorbate modulates cortically evoked glutamate dynamics in rat striatum. Neurosci. Lett. 378:166-170.
147. Cammack,J., Ghasemzadeh,B., and Adams,R.N. 1991. The pharmacological profile of glutamate-evoked ascorbic acid efflux measured by in vivo electrochemistry. Brain Res. 565:17-22.