regulation, institutions and … institutions and productivity: new macroeconomic evidence from oecd...
TRANSCRIPT

REGULATION, INSTITUTIONS AND
PRODUCTIVITY:
NEW MACROECONOMIC EVIDENCE
FROM OECD COUNTRIES
Balázs Égert,
OECD, Economics Department
The usual disclaimer applies
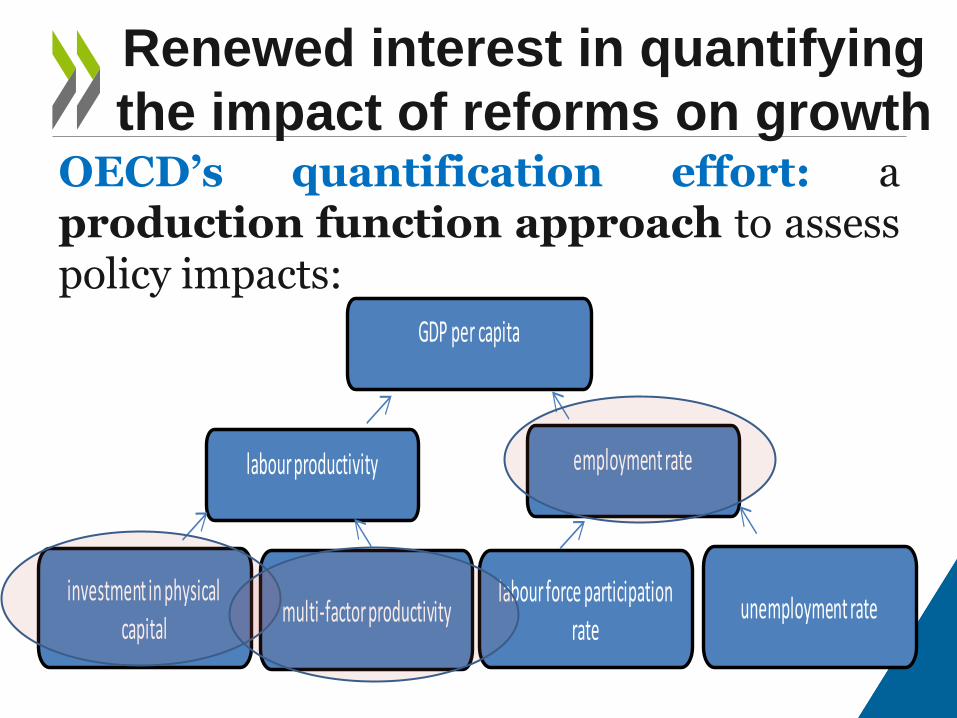
Renewed interest in quantifying
the impact of reforms on growth OECD’s quantification effort: a production function approach to assess policy impacts:
GDP per capita
investment in physical capital
labour productivity employment rate
labour force participation rate
unemployment ratemulti-factor productivity

Regulation and MFP in the literature
–A number of studies using
• Firm-level data
• Sectoral-level data
–Few studies looking at the aggregate level

Micro approaches:
• Better identification of policy effects
• Difficulties in estimating country-level effects – diff-in-diff approach, several assumption are needed eg on
• base effect
• zero policy effect on worst performing firms/sectors
• effect is channel specific
Macro approaches:
• Better at providing macroeconomic effects
• Better at incorporating more policy channels
• Better at covering a larger number of countries
Micro vs. macro estimates

New set of panel estimates

SELECTING MFP DRIVERS AT THE AGGREGATE LEVEL
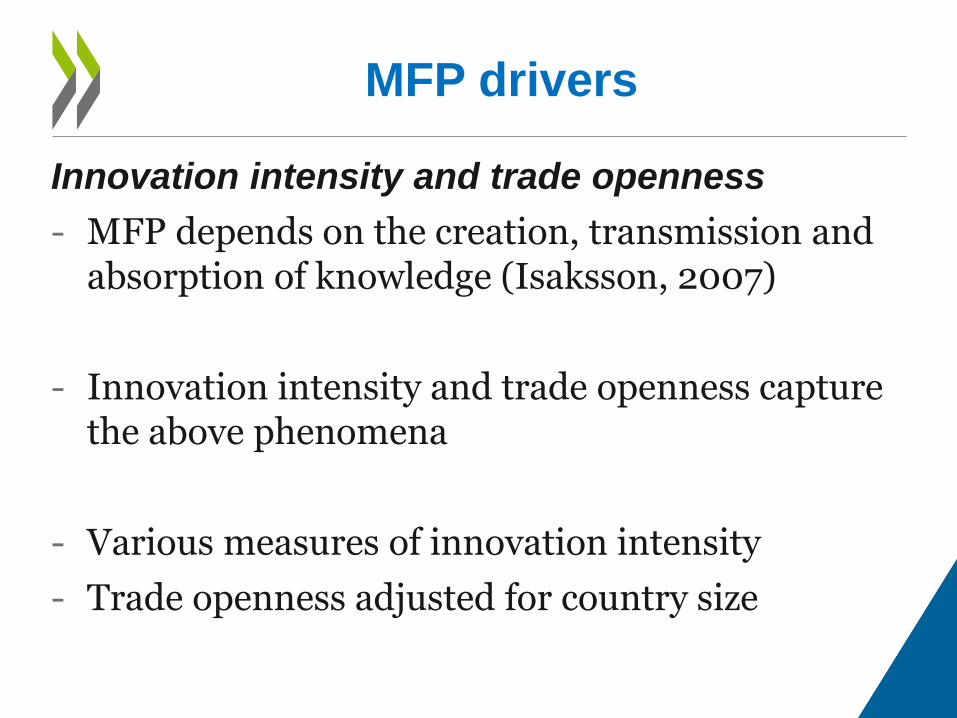
Innovation intensity and trade openness
- MFP depends on the creation, transmission and absorption of knowledge (Isaksson, 2007)
- Innovation intensity and trade openness capture the above phenomena
- Various measures of innovation intensity
- Trade openness adjusted for country size
MFP drivers

Innovation intensity
- Spending on R&D by industry
- Spending on R&D by government
- Spending on basic R&D
- Nobel Prize winners
- Various measures of patens (per capita)
MFP drivers
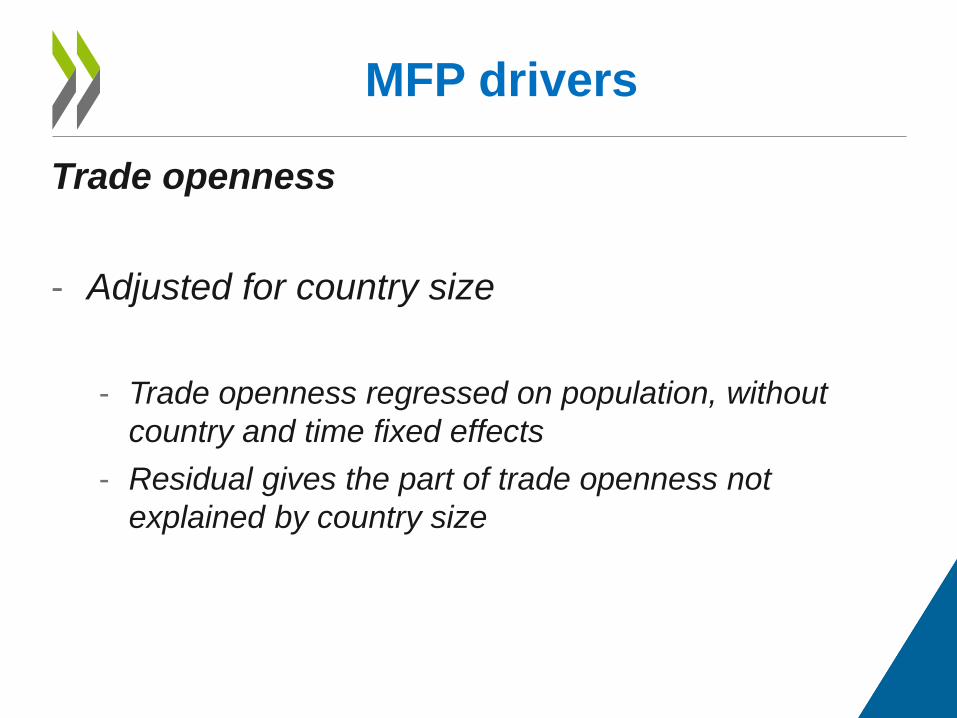
Trade openness
- Adjusted for country size
- Trade openness regressed on population, without
country and time fixed effects
- Residual gives the part of trade openness not
explained by country size
MFP drivers

Product and labour market regulations
- More stringent regulation can impede the efficient allocation of capital and labour within and across firms and industries.
- This can have a negative impact on MFP
Regulations
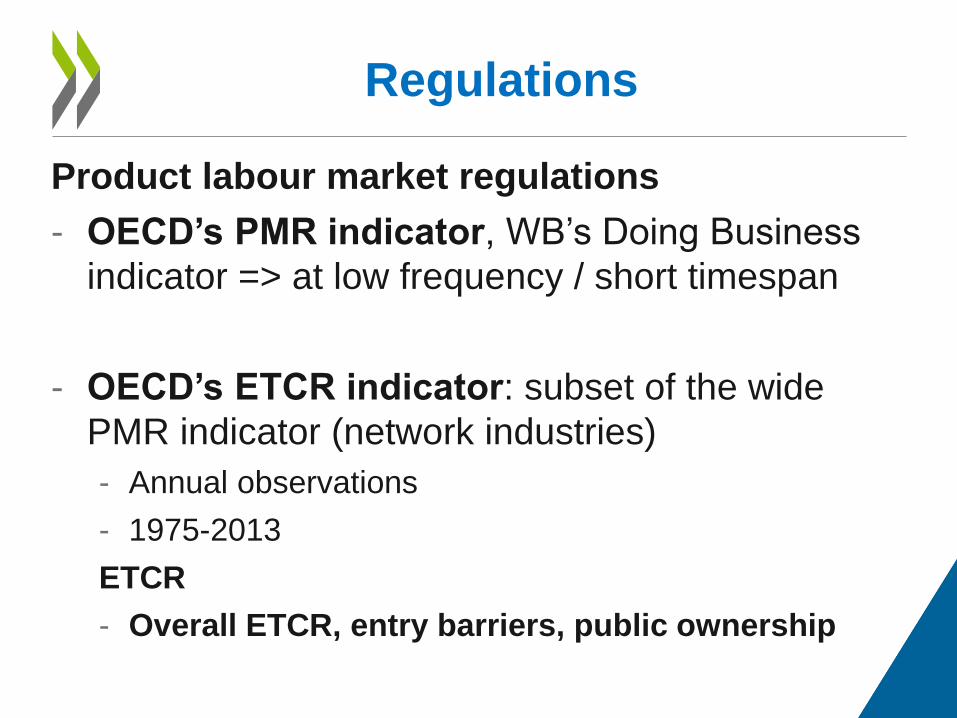
Product labour market regulations
- OECD’s PMR indicator, WB’s Doing Business
indicator => at low frequency / short timespan
- OECD’s ETCR indicator: subset of the wide
PMR indicator (network industries)
- Annual observations
- 1975-2013
ETCR
- Overall ETCR, entry barriers, public ownership
Regulations

Labour labour market regulations
i.) per capita spending on active labour market policies (ALMP),
ii.) the employment protection legislation (EPL) indicator (for permanent contracts),
iii.) the gross unemployment benefit replacement rate (UBRR).
Regulations
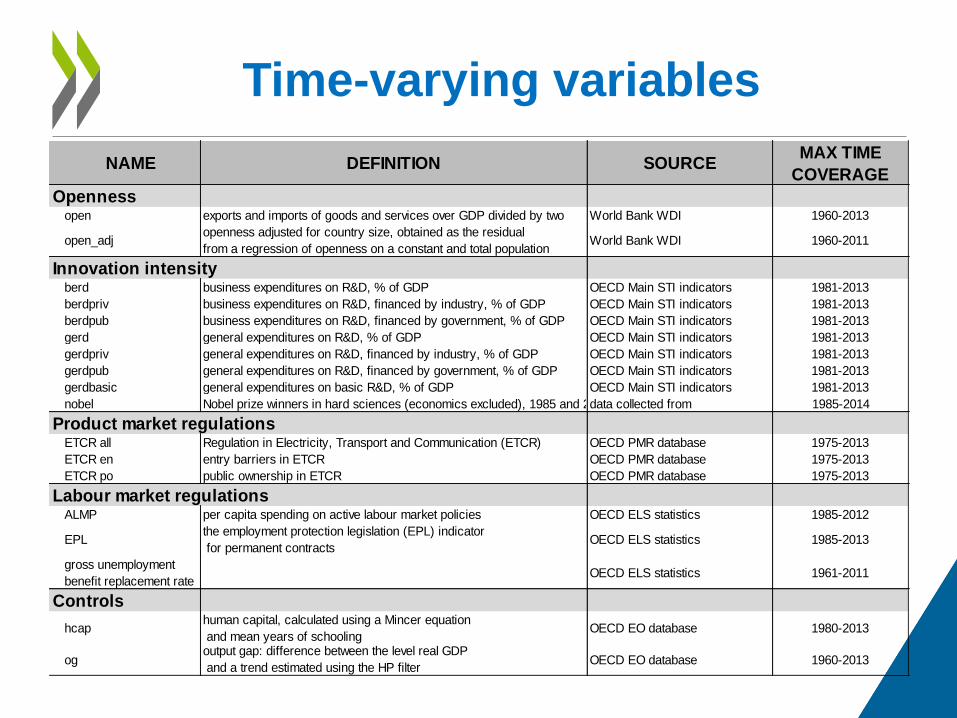
NAME DEFINITION SOURCEMAX TIME
COVERAGE
Opennessopen exports and imports of goods and services over GDP divided by two World Bank WDI 1960-2013
open_adjopenness adjusted for country size, obtained as the residual
from a regression of openness on a constant and total populationWorld Bank WDI 1960-2011
Innovation intensityberd business expenditures on R&D, % of GDP OECD Main STI indicators 1981-2013
berdpriv business expenditures on R&D, financed by industry, % of GDP OECD Main STI indicators 1981-2013
berdpub business expenditures on R&D, financed by government, % of GDP OECD Main STI indicators 1981-2013
gerd general expenditures on R&D, % of GDP OECD Main STI indicators 1981-2013
gerdpriv general expenditures on R&D, financed by industry, % of GDP OECD Main STI indicators 1981-2013
gerdpub general expenditures on R&D, financed by government, % of GDP OECD Main STI indicators 1981-2013
gerdbasic general expenditures on basic R&D, % of GDP OECD Main STI indicators 1981-2013
nobel Nobel prize winners in hard sciences (economics excluded), 1985 and 2014data collected from 1985-2014
Product market regulationsETCR all Regulation in Electricity, Transport and Communication (ETCR) OECD PMR database 1975-2013
ETCR en entry barriers in ETCR OECD PMR database 1975-2013
ETCR po public ownership in ETCR OECD PMR database 1975-2013
Labour market regulationsALMP per capita spending on active labour market policies OECD ELS statistics 1985-2012
EPLthe employment protection legislation (EPL) indicator
for permanent contracts OECD ELS statistics 1985-2013
gross unemployment
benefit replacement rateOECD ELS statistics 1961-2011
Controls
hcaphuman capital, calculated using a Mincer equation
and mean years of schoolingOECD EO database 1980-2013
ogoutput gap: difference between the level real GDP
and a trend estimated using the HP filterOECD EO database 1960-2013
Time-varying variables

Institutions
- rule of law
- quality of legal system
- corruption (three alternative measures)
Regulations / business environment
- PMR and subcomponents
- cost and time of starting a business/insolvency
- as conditioning variables for the time varying variables (threshold regressions or interactions)
- replacing country fixed effects
Time-invariant variables

NAME SOURCEAVERAGED
FOR
Product market regulation (PMR) indicatoroverall PMR indicator
State control
barriers to entrepreneurship
barriers to trade&investment
Business environemnttime of insolvency procedures resolving insolvency, years World Bank WDI 2004-2012
cost of insolvency procedures resolving insolvency, % of estate World Bank WDI 2004-2012
recovery rate - insolvency procedure as cents on the dollar recovered by secured creditors
time of starting a business days World Bank WDI 2004-2012
cost of starting a business % of GNI per capita World Bank WDI 2004-2012
time of contract enforcemet days
cost of contract enforcement % of the claim
Institutionsrule of law World Bank WDI 2004-2012
quality of legal system
corruption: corruption percention index Transparency International 2015
corruption: corruption percention indexWorld Bank World Governance
Indicators1998-2002
corruption: corruption index Dreher et al. (2007) 1991-1997
1998-2013,
5-year intervals
Fraser Institute's Economic 1980-2012
OECD, Product Market
Regulations database
Time-invariant variables
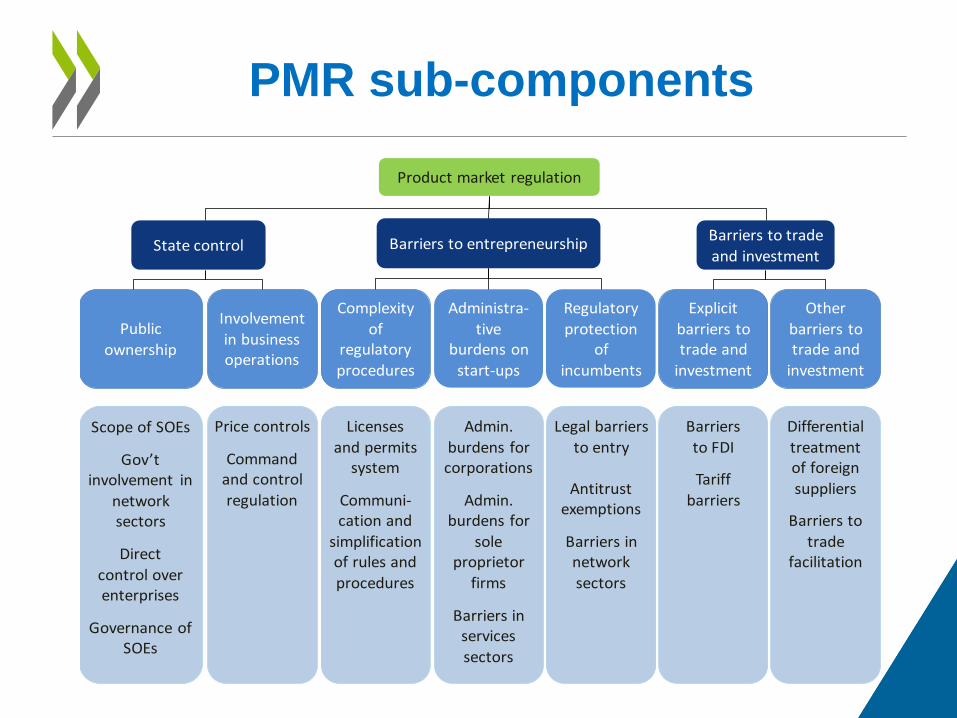
PMR sub-components
Scope of SOEs
Gov’t involvement in
network sectors
Direct
control over enterprises
Governance of SOEs
Licenses
and permitssystem
Communi-cation and
simplification of rules and
procedures
Admin.
burdens forcorporations
Admin.burdens for
sole proprietor
firms
Barriers inservices
sectors
Legal barriers
to entry
Antitrustexemptions
Barriers innetwork
sectors
Barriers
to FDI
Tariff
barriers
Differential
treatmentof foreign
suppliers
Barriers to
trade facilitation
Product market regulation
Price controls
Command and control
regulation
State control
Other
barriers to trade and
investment
Complexity
of regulatory
procedures
Barriers to trade
and investment Barriers to entrepreneurship
Explicit
barriers to trade and
investment
Regulatory
protection of
incumbents
Involvement
in business operations
Public
ownership
Administra-
tiveburdens on
start-ups
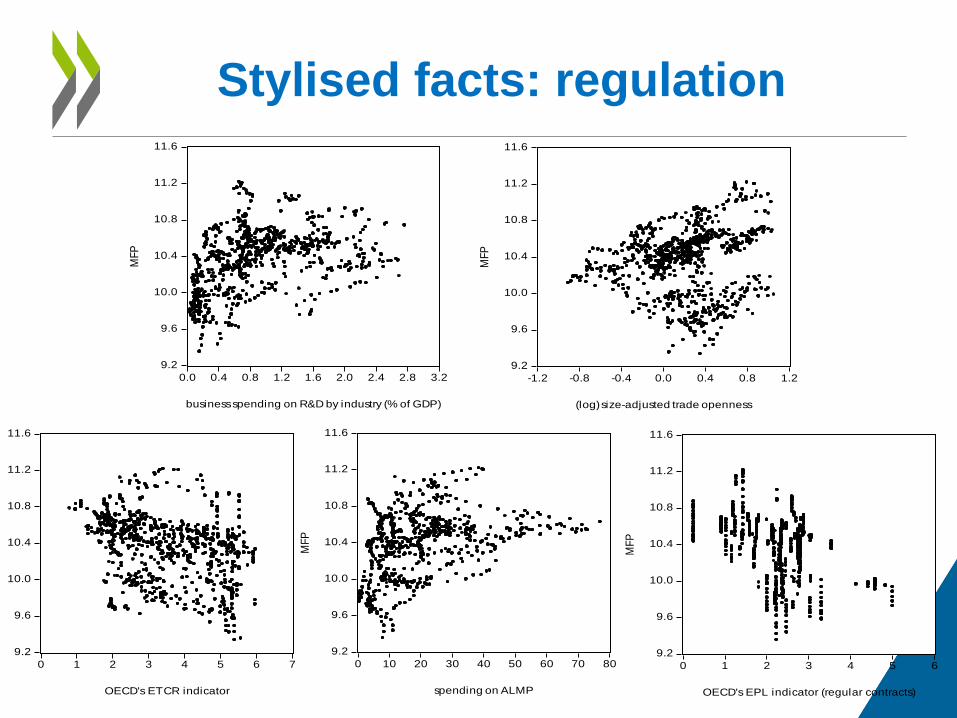
Stylised facts: regulation
9.2
9.6
10.0
10.4
10.8
11.2
11.6
0.0 0.4 0.8 1.2 1.6 2.0 2.4 2.8 3.2
business spending on R&D by industry (% of GDP)
MF
P
9.2
9.6
10.0
10.4
10.8
11.2
11.6
-1.2 -0.8 -0.4 0.0 0.4 0.8 1.2
(log) size-adjusted trade openness
MF
P
9.2
9.6
10.0
10.4
10.8
11.2
11.6
0 1 2 3 4 5 6 7
OECD's ETCR indicator
MF
P
9.2
9.6
10.0
10.4
10.8
11.2
11.6
0 10 20 30 40 50 60 70 80
spending on ALMP
MF
P
9.2
9.6
10.0
10.4
10.8
11.2
11.6
0 1 2 3 4 5 6
OECD's EPL indicator (regular contracts)
MF
P
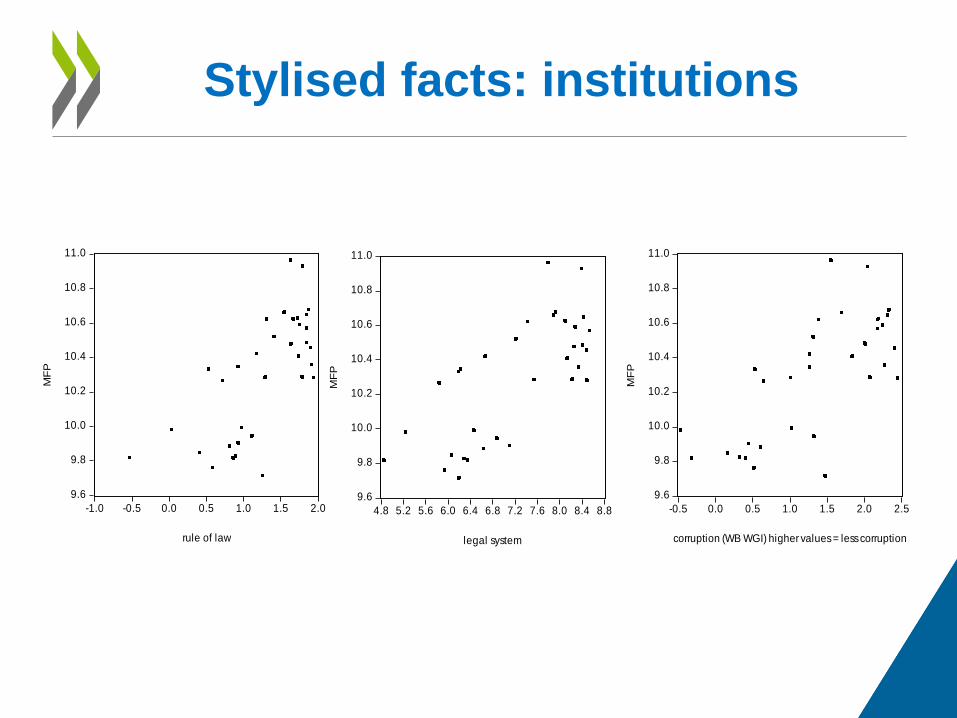
Stylised facts: institutions
9.6
9.8
10.0
10.2
10.4
10.6
10.8
11.0
-1.0 -0.5 0.0 0.5 1.0 1.5 2.0
rule of law
MF
P
9.6
9.8
10.0
10.2
10.4
10.6
10.8
11.0
4.8 5.2 5.6 6.0 6.4 6.8 7.2 7.6 8.0 8.4 8.8
legal system
MF
P
9.6
9.8
10.0
10.2
10.4
10.6
10.8
11.0
-0.5 0.0 0.5 1.0 1.5 2.0 2.5
corruption (WB WGI) higher values = less corruption
MF
P
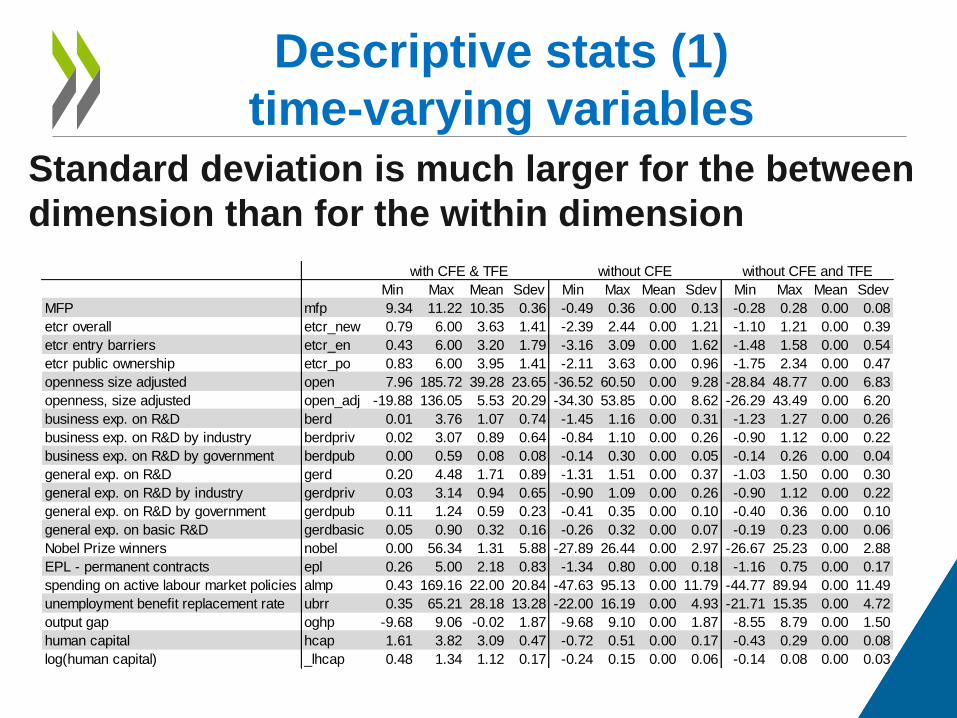
Standard deviation is much larger for the between
dimension than for the within dimension
Descriptive stats (1)
time-varying variables
Min Max Mean Sdev Min Max Mean Sdev Min Max Mean Sdev
MFP mfp 9.34 11.22 10.35 0.36 -0.49 0.36 0.00 0.13 -0.28 0.28 0.00 0.08
etcr overall etcr_new 0.79 6.00 3.63 1.41 -2.39 2.44 0.00 1.21 -1.10 1.21 0.00 0.39
etcr entry barriers etcr_en 0.43 6.00 3.20 1.79 -3.16 3.09 0.00 1.62 -1.48 1.58 0.00 0.54
etcr public ownership etcr_po 0.83 6.00 3.95 1.41 -2.11 3.63 0.00 0.96 -1.75 2.34 0.00 0.47
openness size adjusted open 7.96 185.72 39.28 23.65 -36.52 60.50 0.00 9.28 -28.84 48.77 0.00 6.83
openness, size adjusted open_adj -19.88 136.05 5.53 20.29 -34.30 53.85 0.00 8.62 -26.29 43.49 0.00 6.20
business exp. on R&D berd 0.01 3.76 1.07 0.74 -1.45 1.16 0.00 0.31 -1.23 1.27 0.00 0.26
business exp. on R&D by industry berdpriv 0.02 3.07 0.89 0.64 -0.84 1.10 0.00 0.26 -0.90 1.12 0.00 0.22
business exp. on R&D by government berdpub 0.00 0.59 0.08 0.08 -0.14 0.30 0.00 0.05 -0.14 0.26 0.00 0.04
general exp. on R&D gerd 0.20 4.48 1.71 0.89 -1.31 1.51 0.00 0.37 -1.03 1.50 0.00 0.30
general exp. on R&D by industry gerdpriv 0.03 3.14 0.94 0.65 -0.90 1.09 0.00 0.26 -0.90 1.12 0.00 0.22
general exp. on R&D by government gerdpub 0.11 1.24 0.59 0.23 -0.41 0.35 0.00 0.10 -0.40 0.36 0.00 0.10
general exp. on basic R&D gerdbasic 0.05 0.90 0.32 0.16 -0.26 0.32 0.00 0.07 -0.19 0.23 0.00 0.06
Nobel Prize winners nobel 0.00 56.34 1.31 5.88 -27.89 26.44 0.00 2.97 -26.67 25.23 0.00 2.88
EPL - permanent contracts epl 0.26 5.00 2.18 0.83 -1.34 0.80 0.00 0.18 -1.16 0.75 0.00 0.17
spending on active labour market policies almp 0.43 169.16 22.00 20.84 -47.63 95.13 0.00 11.79 -44.77 89.94 0.00 11.49
unemployment benefit replacement rate ubrr 0.35 65.21 28.18 13.28 -22.00 16.19 0.00 4.93 -21.71 15.35 0.00 4.72
output gap oghp -9.68 9.06 -0.02 1.87 -9.68 9.10 0.00 1.87 -8.55 8.79 0.00 1.50
human capital hcap 1.61 3.82 3.09 0.47 -0.72 0.51 0.00 0.17 -0.43 0.29 0.00 0.08
log(human capital) _lhcap 0.48 1.34 1.12 0.17 -0.24 0.15 0.00 0.06 -0.14 0.08 0.00 0.03
with CFE & TFE without CFE without CFE and TFE

ESTIMATION ISSUES:
FINDING THE RIGHT TOOL

Our main interest: long-run effect
Long-term relationship: Dynamic OLS (DOLS)
corrects for endogeneity and serial correlation
𝑌𝑖,𝑡 = 𝛽𝑖𝑋𝑖,𝑗,𝑡𝑗
+ 𝛿𝑖𝛥𝑋𝑖,𝑗,𝑡+𝑙
1
𝑙= −1𝑗
+ 𝐶𝐹𝐸𝑖 + 휀𝑐,𝑡
Estimation strategy
),,( ,,,, tjtjtjtj PMRINNOVATIONOPENfMFP
),,,( ,,,,, tjtjtjtjtj LMRPMRINNOVATIONOPENfMFP
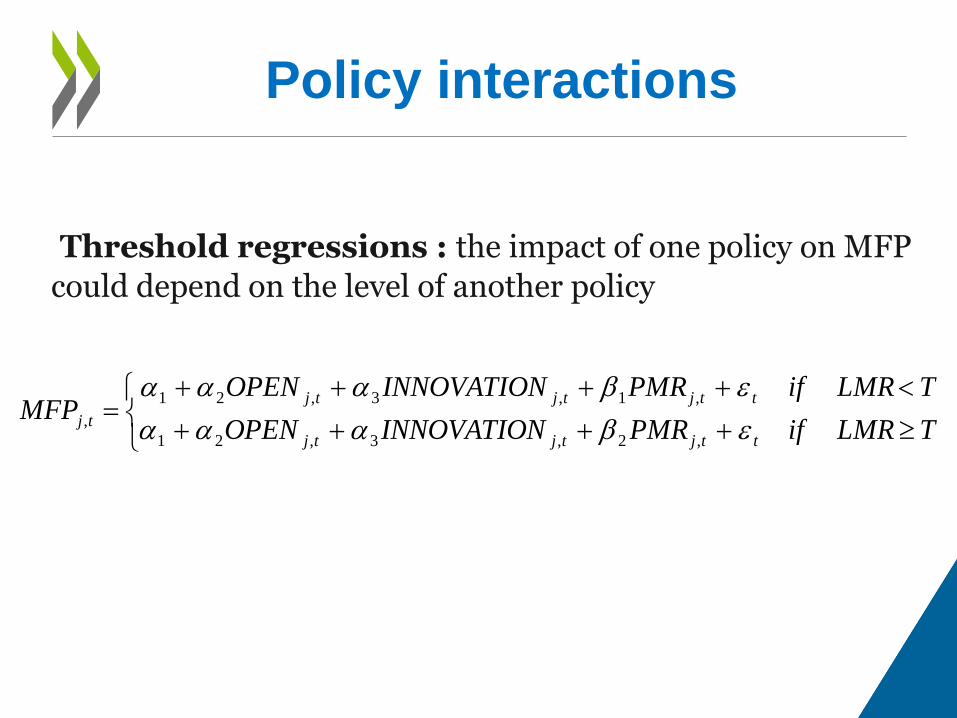
Policy interactions
Threshold regressions : the impact of one policy on MFP
could depend on the level of another policy
TLMRifPMRINNOVATIONOPEN
TLMRifPMRINNOVATIONOPENMFP
ttjtjtj
ttjtjtj
tj
,2,3,21
,1,3,21
,
Annual panel data covering
All (or almost all) 34 OECD countries
Period from 1985 to 2011
(constrained by the MFP measure)
Data

Estimation results
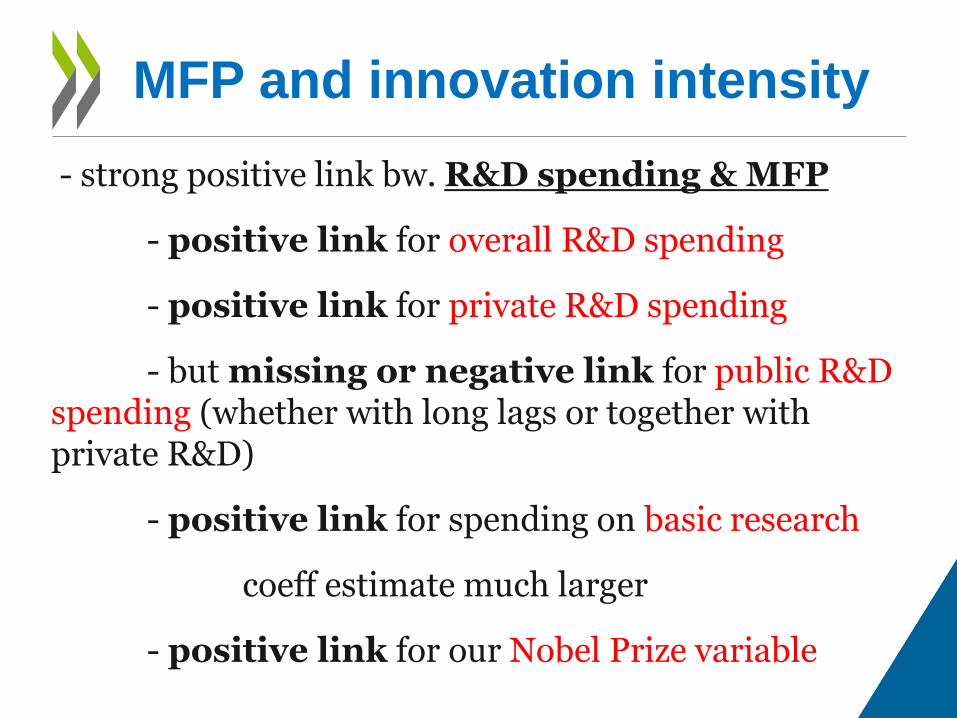
MFP and innovation intensity
- strong positive link bw. R&D spending & MFP
- positive link for overall R&D spending
- positive link for private R&D spending
- but missing or negative link for public R&D spending (whether with long lags or together with private R&D)
- positive link for spending on basic research
coeff estimate much larger
- positive link for our Nobel Prize variable
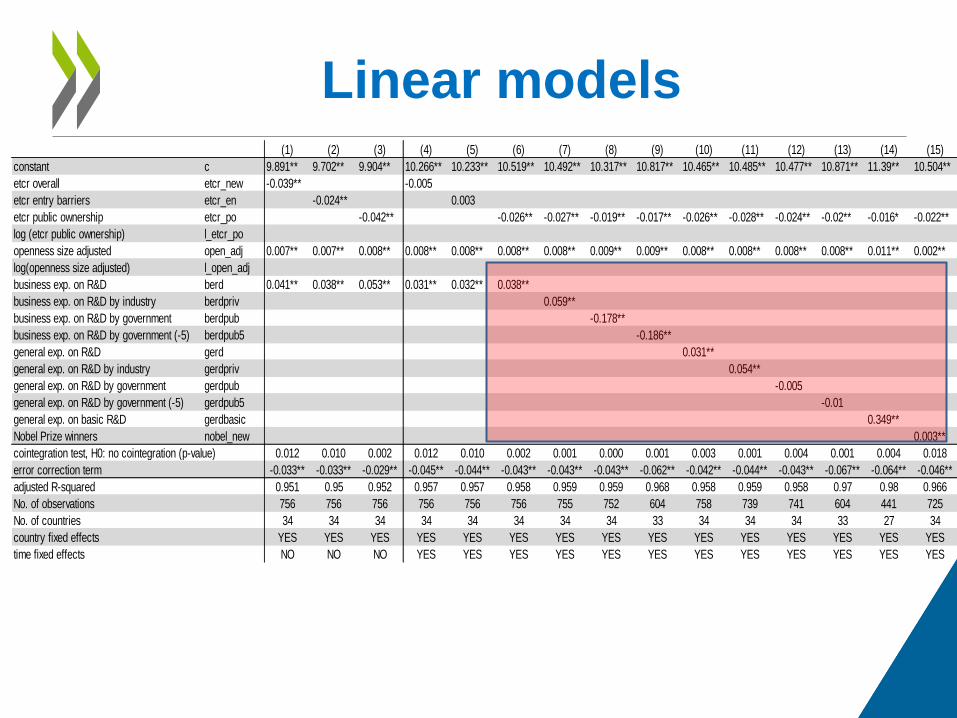
Linear models
(1) (2) (3) (4) (5) (6) (7) (8) (9) (10) (11) (12) (13) (14) (15) (16) (17) (18)
constant c 9.891** 9.702** 9.904** 10.266** 10.233** 10.519** 10.492** 10.317** 10.817** 10.465** 10.485** 10.477** 10.871** 11.39** 10.504** 10.2** 10.377** 10.326**
etcr overall etcr_new -0.039** -0.005
etcr entry barriers etcr_en -0.024** 0.003
etcr public ownership etcr_po -0.042** -0.026** -0.027** -0.019** -0.017** -0.026** -0.028** -0.024** -0.02** -0.016* -0.022** -0.021** -0.025**
log (etcr public ownership) l_etcr_po -0.053**
openness size adjusted open_adj 0.007** 0.007** 0.008** 0.008** 0.008** 0.008** 0.008** 0.009** 0.009** 0.008** 0.008** 0.008** 0.008** 0.011** 0.002** 0.009** 0.008**
log(openness size adjusted) l_open_adj 0.197**
business exp. on R&D berd 0.041** 0.038** 0.053** 0.031** 0.032** 0.038**
business exp. on R&D by industry berdpriv 0.059** 0.072** 0.046**
business exp. on R&D by government berdpub -0.178** -0.275**
business exp. on R&D by government (-5) berdpub5 -0.186**
general exp. on R&D gerd 0.031**
general exp. on R&D by industry gerdpriv 0.054** 0.065**
general exp. on R&D by government gerdpub -0.005 -0.062*
general exp. on R&D by government (-5) gerdpub5 -0.01
general exp. on basic R&D gerdbasic 0.349**
Nobel Prize winners nobel_new 0.003**
0.012 0.010 0.002 0.012 0.010 0.002 0.001 0.000 0.001 0.003 0.001 0.004 0.001 0.004 0.018 0.000 0.000 0.004
-0.033** -0.033** -0.029** -0.045** -0.044** -0.043** -0.043** -0.043** -0.062** -0.042** -0.044** -0.043** -0.067** -0.064** -0.046** -0.045** -0.044** -0.048**
adjusted R-squared 0.951 0.95 0.952 0.957 0.957 0.958 0.959 0.959 0.968 0.958 0.959 0.958 0.97 0.98 0.966 0.961 0.959 0.952
No. of observations 756 756 756 756 756 756 755 752 604 758 739 741 604 441 725 752 739 755
No. of countries 34 34 34 34 34 34 34 34 33 34 34 34 33 27 34 34 34 34
country fixed effects YES YES YES YES YES YES YES YES YES YES YES YES YES YES YES YES YES YES
time fixed effects NO NO NO YES YES YES YES YES YES YES YES YES YES YES YES YES YES YES
cointegration test, H0: no cointegration (p-value)
error correction term
MFP and trade openness
- strong positive link bw. openness & MFP
- very robust position relationship
- only instance when it becomes weaker => for smaller sample
- less developed countries may benefit more from technology diffusion and adoption via trade
Policy interactions
some degree of substitution bw. R&D spending and openness
The positive openness effect is smaller if private R&D spending is high
The positive link bw R&D and MFP becomes small at very high levels of openness
Regulations
Product market regulation:
negative relation bw. ETCR & MFP
- overall ETCR: only if no year fixed effects used
- public ownership part of ETCR if both country and year fixed effects included
Labour market regulations: - Results sensitive to sample size and specification
- If used in logs: ALMP + sign
- If used in logs: EPL + sign => composition effect if tighter EPL destroys low-skill (low-productivity) jobs and leaves high-skill jobs broadly unaffected OR business can compensate through a better organisation of production processes
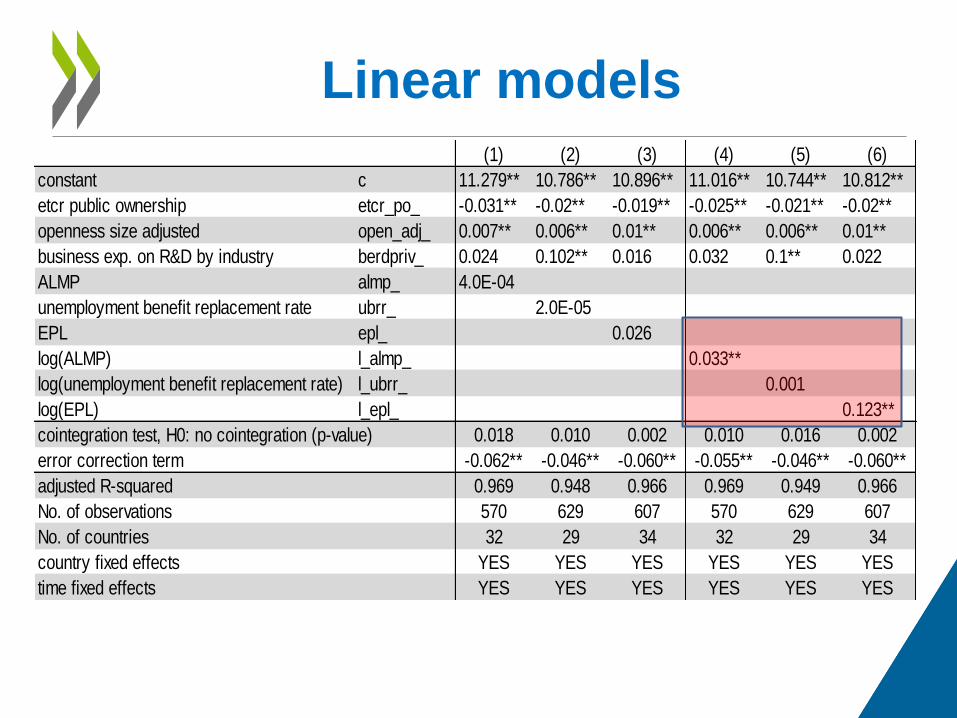
Linear models
(1) (2) (3) (4) (5) (6)
constant c 11.279** 10.786** 10.896** 11.016** 10.744** 10.812**
etcr public ownership etcr_po_ -0.031** -0.02** -0.019** -0.025** -0.021** -0.02**
openness size adjusted open_adj_ 0.007** 0.006** 0.01** 0.006** 0.006** 0.01**
business exp. on R&D by industry berdpriv_ 0.024 0.102** 0.016 0.032 0.1** 0.022
ALMP almp_ 4.0E-04
unemployment benefit replacement rate ubrr_ 2.0E-05
EPL epl_ 0.026
log(ALMP) l_almp_ 0.033**
log(unemployment benefit replacement rate) l_ubrr_ 0.001
log(EPL) l_epl_ 0.123**
0.018 0.010 0.002 0.010 0.016 0.002
-0.062** -0.046** -0.060** -0.055** -0.046** -0.060**
adjusted R-squared 0.969 0.948 0.966 0.969 0.949 0.966
No. of observations 570 629 607 570 629 607
No. of countries 32 29 34 32 29 34
country fixed effects YES YES YES YES YES YES
time fixed effects YES YES YES YES YES YES
cointegration test, H0: no cointegration (p-value)
error correction term
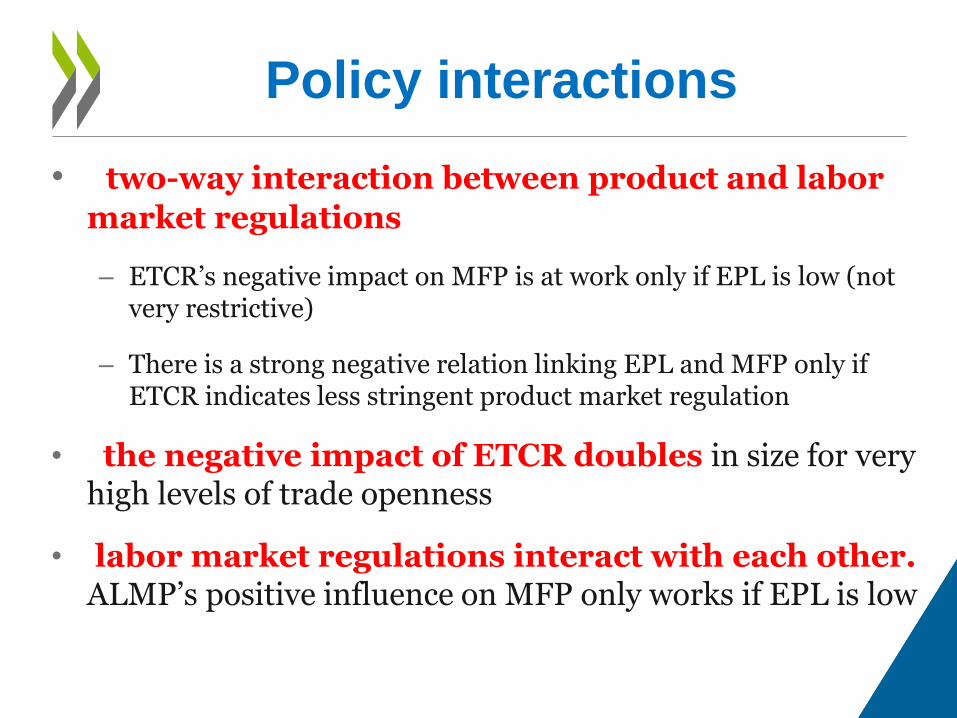
Policy interactions
• two-way interaction between product and labor
market regulations
– ETCR’s negative impact on MFP is at work only if EPL is low (not very restrictive)
– There is a strong negative relation linking EPL and MFP only if ETCR indicates less stringent product market regulation
• the negative impact of ETCR doubles in size for very high levels of trade openness
• labor market regulations interact with each other. ALMP’s positive influence on MFP only works if EPL is low
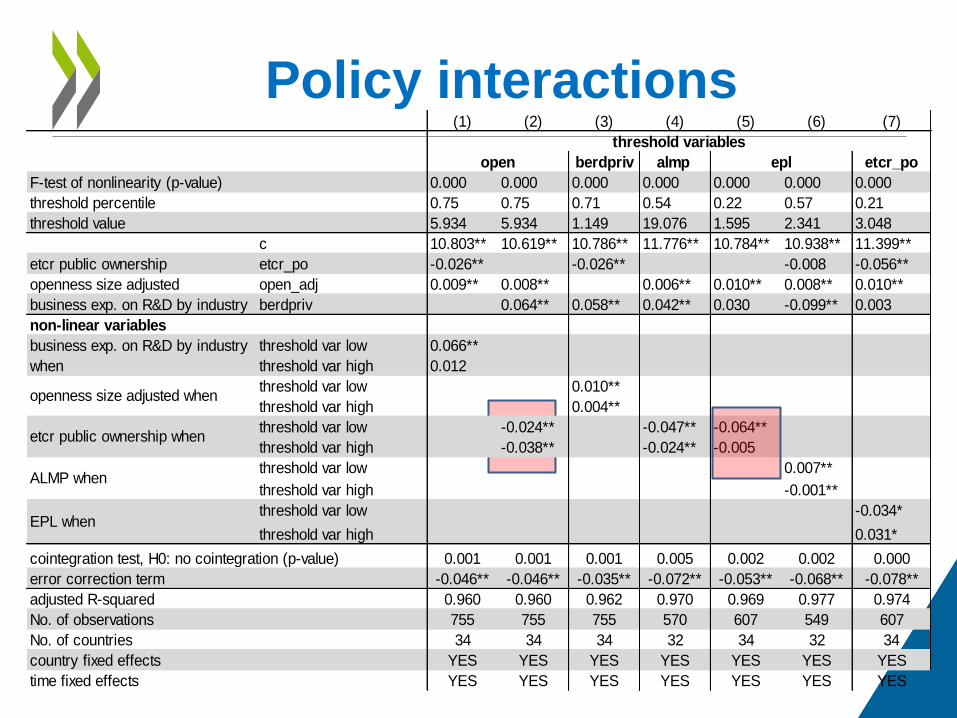
Policy interactions
(1) (2) (3) (4) (5) (6) (7)
berdpriv almp etcr_po
F-test of nonlinearity (p-value) 0.000 0.000 0.000 0.000 0.000 0.000 0.000
threshold percentile 0.75 0.75 0.71 0.54 0.22 0.57 0.21
threshold value 5.934 5.934 1.149 19.076 1.595 2.341 3.048
c 10.803** 10.619** 10.786** 11.776** 10.784** 10.938** 11.399**
etcr public ownership etcr_po -0.026** -0.026** -0.008 -0.056**
openness size adjusted open_adj 0.009** 0.008** 0.006** 0.010** 0.008** 0.010**
business exp. on R&D by industry berdpriv 0.064** 0.058** 0.042** 0.030 -0.099** 0.003
non-linear variables
threshold var low 0.066**
threshold var high 0.012
threshold var low 0.010**
threshold var high 0.004**
threshold var low -0.024** -0.047** -0.064**
threshold var high -0.038** -0.024** -0.005
threshold var low 0.007**
threshold var high -0.001**
threshold var low -0.034*
threshold var high 0.031*
0.001 0.001 0.001 0.005 0.002 0.002 0.000
-0.046** -0.046** -0.035** -0.072** -0.053** -0.068** -0.078**
adjusted R-squared 0.960 0.960 0.962 0.970 0.969 0.977 0.974
No. of observations 755 755 755 570 607 549 607
No. of countries 34 34 34 32 34 32 34
country fixed effects YES YES YES YES YES YES YES
time fixed effects YES YES YES YES YES YES YES
open epl
cointegration test, H0: no cointegration (p-value)
error correction term
threshold variables
business exp. on R&D by industry
when
openness size adjusted when
etcr public ownership when
ALMP when
EPL when
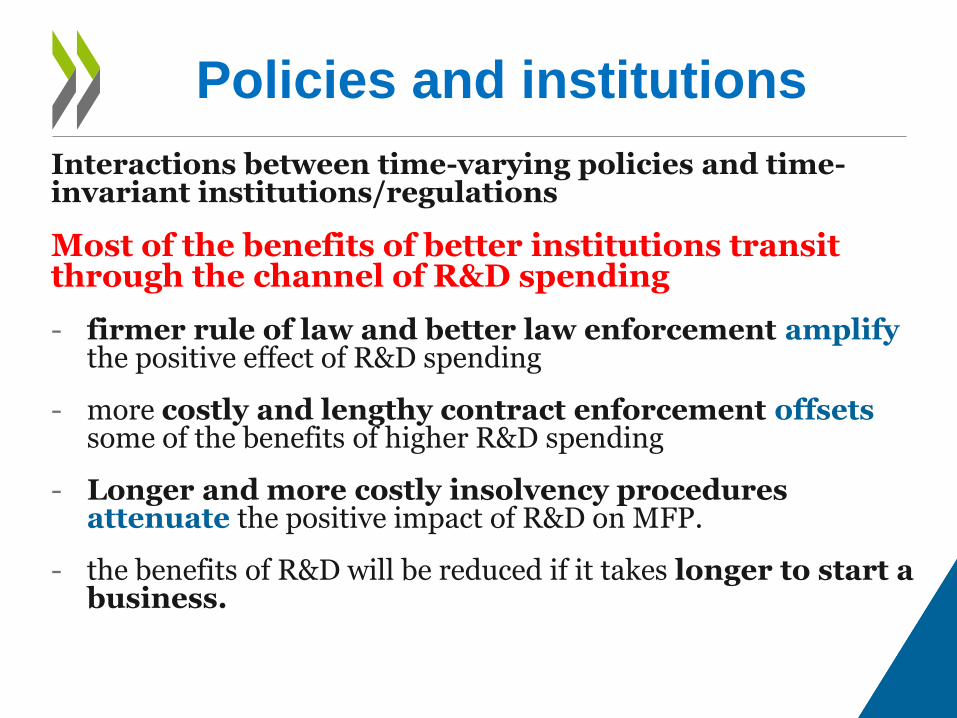
Policies and institutions
Interactions between time-varying policies and time-invariant institutions/regulations
Most of the benefits of better institutions transit through the channel of R&D spending
- firmer rule of law and better law enforcement amplify the positive effect of R&D spending
- more costly and lengthy contract enforcement offsets some of the benefits of higher R&D spending
- Longer and more costly insolvency procedures attenuate the positive impact of R&D on MFP.
- the benefits of R&D will be reduced if it takes longer to start a business.
Level effects of institutions
and regulations
• Previous results include country fixed effects
• How changes in policies are related to average changes over time in MFP
• But they do not tell why MFP levels differ across countries
• Remember, cross-country variation is much larger than within variation
Replacing CFE by time
invariant variables
• four sets of variables with cross-section variation
– the country averages of two labor market indicators (EPL and ALMP)
– barriers to trade and investment
– institutional quality (the rule of law and the time of insolvency procedures – they enter the regressions one by one)
– corruption
Level effects (1)
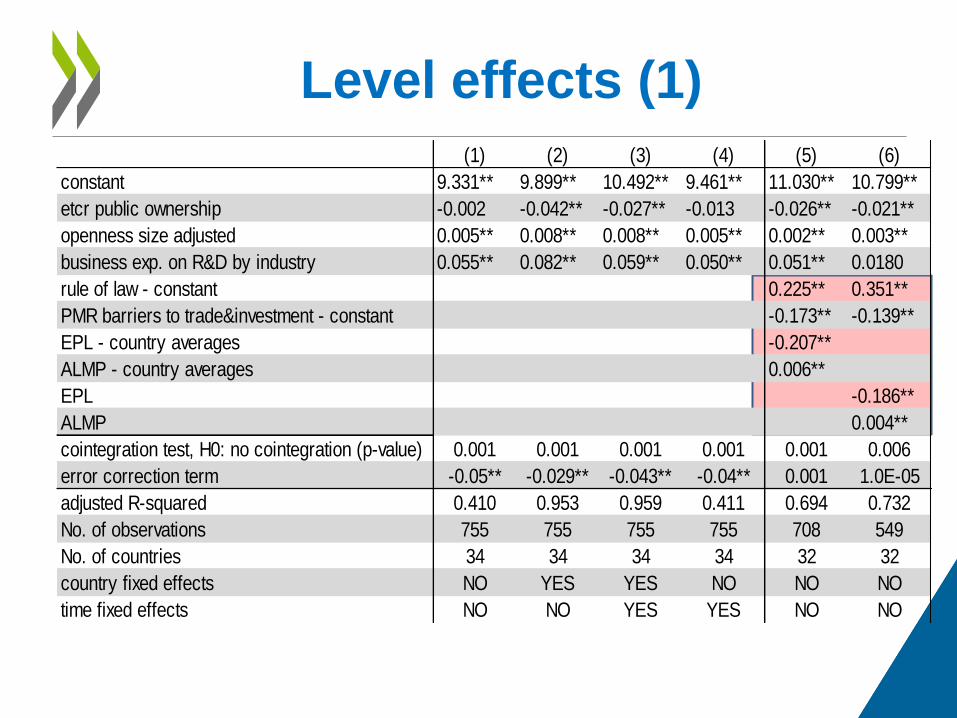
(1) (2) (3) (4) (5) (6)
constant 9.331** 9.899** 10.492** 9.461** 11.030** 10.799**
etcr public ownership -0.002 -0.042** -0.027** -0.013 -0.026** -0.021**
openness size adjusted 0.005** 0.008** 0.008** 0.005** 0.002** 0.003**
business exp. on R&D by industry 0.055** 0.082** 0.059** 0.050** 0.051** 0.0180
rule of law - constant 0.225** 0.351**
PMR barriers to trade&investment - constant -0.173** -0.139**
EPL - country averages -0.207**
ALMP - country averages 0.006**
EPL -0.186**
ALMP 0.004**
0.001 0.001 0.001 0.001 0.001 0.006
-0.05** -0.029** -0.043** -0.04** 0.001 1.0E-05
adjusted R-squared 0.410 0.953 0.959 0.411 0.694 0.732
No. of observations 755 755 755 755 708 549
No. of countries 34 34 34 34 32 32
country fixed effects NO YES YES NO NO NO
time fixed effects NO NO YES YES NO NO
cointegration test, H0: no cointegration (p-value)
error correction term

NEGATIVE sign on EPL
• (consistent with earlier findings, e.g Andrews and Cingano, 2014)
• EPL varies on average much more across countries than over time.
• Over time, composition effects & compensation through a more efficient organisation of the production process
• Across countries, the differences are larger and these large differences may translate into considerably different MFP levels by prohibiting a more efficient allocation of labour (and capital).
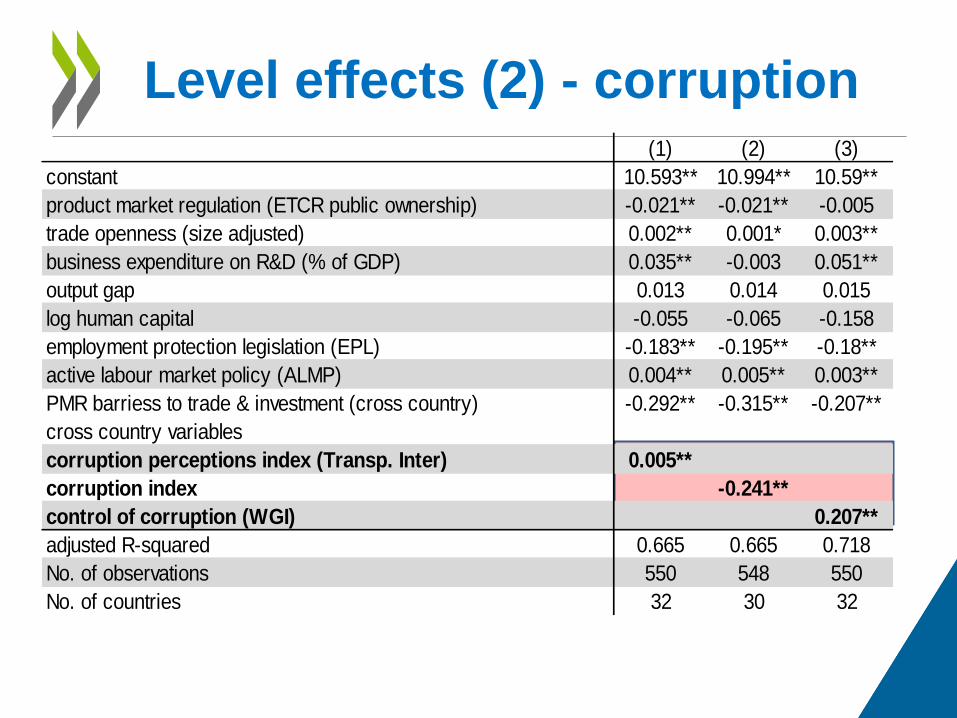
Level effects (2) - corruption (1) (2) (3)
constant 10.593** 10.994** 10.59**
product market regulation (ETCR public ownership) -0.021** -0.021** -0.005
trade openness (size adjusted) 0.002** 0.001* 0.003**
business expenditure on R&D (% of GDP) 0.035** -0.003 0.051**
output gap 0.013 0.014 0.015
log human capital -0.055 -0.065 -0.158
employment protection legislation (EPL) -0.183** -0.195** -0.18**
active labour market policy (ALMP) 0.004** 0.005** 0.003**
PMR barriess to trade & investment (cross country) -0.292** -0.315** -0.207**
cross country variables
corruption perceptions index (Transp. Inter) 0.005**
corruption index -0.241**
control of corruption (WGI) 0.207**
adjusted R-squared 0.665 0.665 0.718
No. of observations 550 548 550
No. of countries 32 30 32
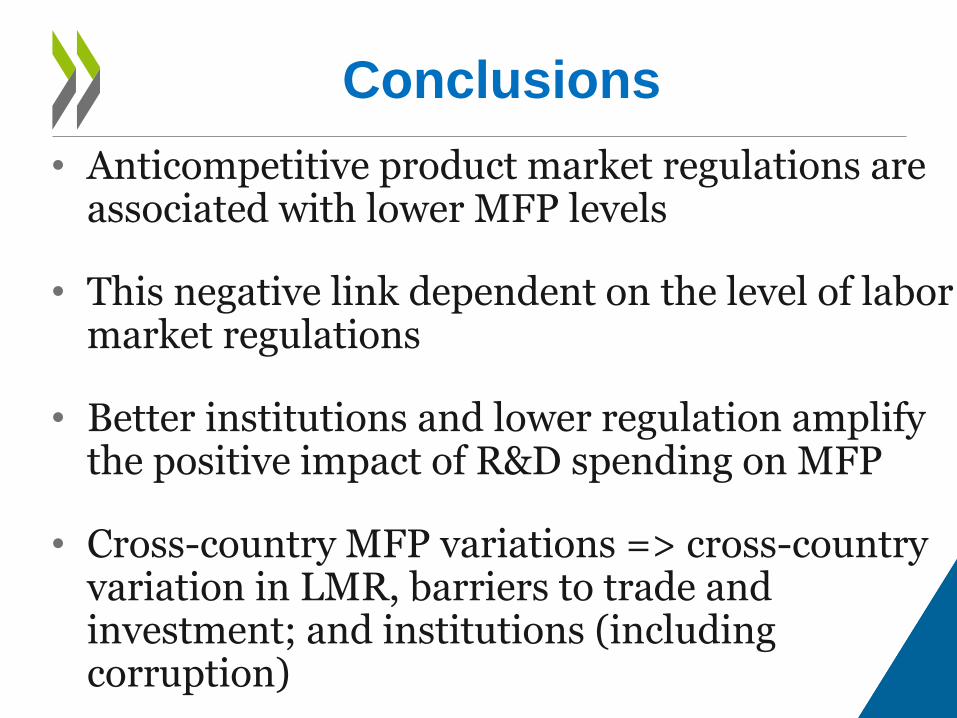
Conclusions
• Anticompetitive product market regulations are associated with lower MFP levels
• This negative link dependent on the level of labor market regulations
• Better institutions and lower regulation amplify the positive impact of R&D spending on MFP
• Cross-country MFP variations => cross-country variation in LMR, barriers to trade and investment; and institutions (including corruption)

Thank you
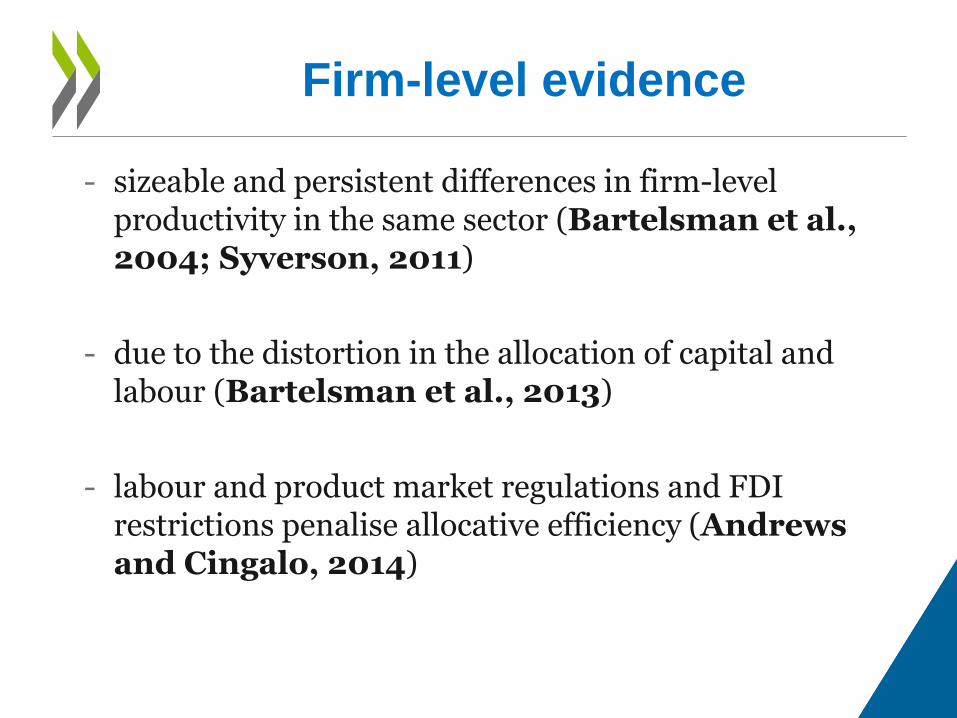
Firm-level evidence
- sizeable and persistent differences in firm-level productivity in the same sector (Bartelsman et al., 2004; Syverson, 2011)
- due to the distortion in the allocation of capital and labour (Bartelsman et al., 2013)
- labour and product market regulations and FDI restrictions penalise allocative efficiency (Andrews and Cingalo, 2014)
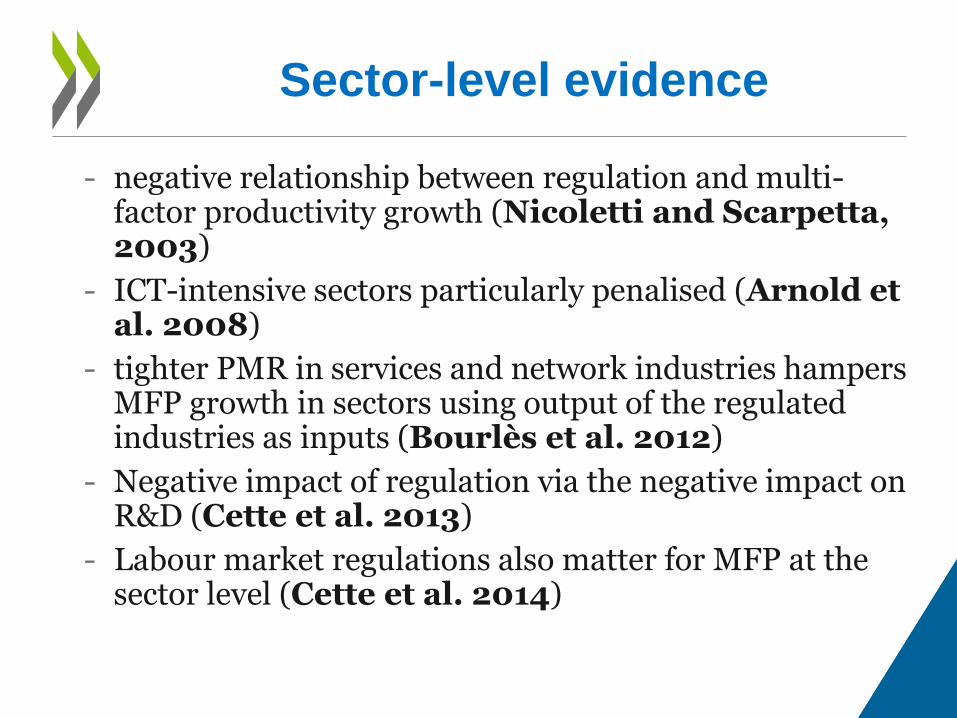
Sector-level evidence
- negative relationship between regulation and multi-factor productivity growth (Nicoletti and Scarpetta, 2003)
- ICT-intensive sectors particularly penalised (Arnold et al. 2008)
- tighter PMR in services and network industries hampers MFP growth in sectors using output of the regulated industries as inputs (Bourlès et al. 2012)
- Negative impact of regulation via the negative impact on R&D (Cette et al. 2013)
- Labour market regulations also matter for MFP at the sector level (Cette et al. 2014)

the MFP frontier:
who is leading the pack

The productivity frontier
- commonly used in firm- and sector-level analysis
- more complicated at the aggregate level
- (sectoral) composition effects at play
- Small countries (LUX, NOR) at the frontier unlikely to force convergence => using MFP level in the USA
- modelling the frontier
- MFP gap (coeff on frontier =1)
- MFP frontier directly, if coeff<1, incomplete convergence
- Year fixed effects => more flexible, capturing common trend in the data
MFP drivers
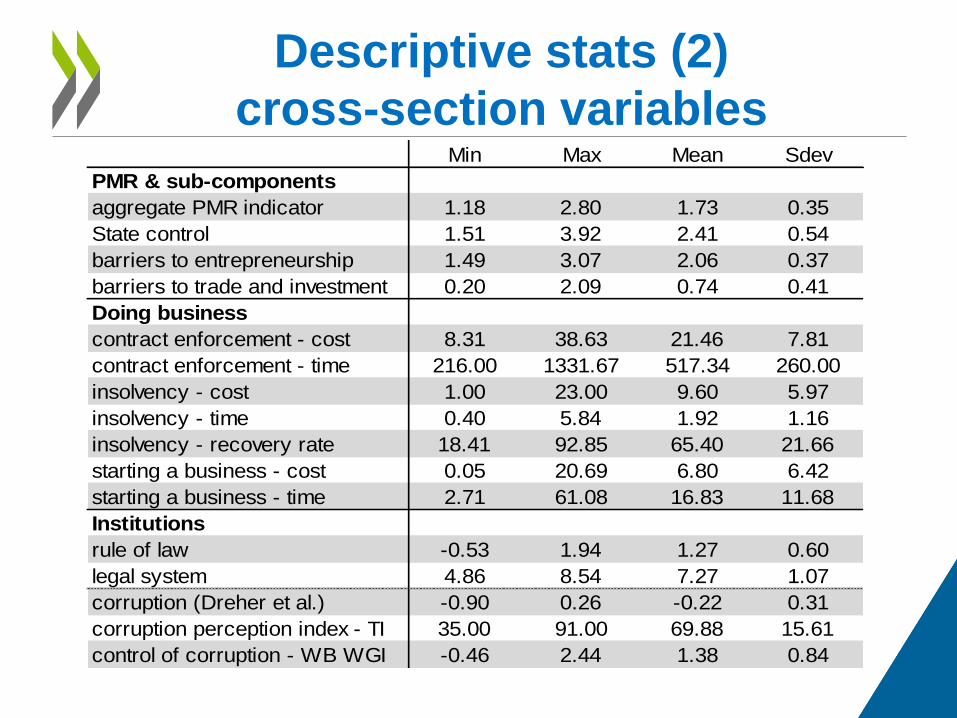
Descriptive stats (2)
cross-section variables Min Max Mean Sdev
PMR & sub-components
aggregate PMR indicator 1.18 2.80 1.73 0.35
State control 1.51 3.92 2.41 0.54
barriers to entrepreneurship 1.49 3.07 2.06 0.37
barriers to trade and investment 0.20 2.09 0.74 0.41
Doing business
contract enforcement - cost 8.31 38.63 21.46 7.81
contract enforcement - time 216.00 1331.67 517.34 260.00
insolvency - cost 1.00 23.00 9.60 5.97
insolvency - time 0.40 5.84 1.92 1.16
insolvency - recovery rate 18.41 92.85 65.40 21.66
starting a business - cost 0.05 20.69 6.80 6.42
starting a business - time 2.71 61.08 16.83 11.68
Institutions
rule of law -0.53 1.94 1.27 0.60
legal system 4.86 8.54 7.27 1.07
corruption (Dreher et al.) -0.90 0.26 -0.22 0.31
corruption perception index - TI 35.00 91.00 69.88 15.61
control of corruption - WB WGI -0.46 2.44 1.38 0.84