regulation, innovation and productivity · asymmetric effect could explain the negative effect of...
TRANSCRIPT

REGULATION, INNOVATION AND PRODUCTIVITY
IE Business School Working Paper DE8-130-I 15/07/2010
Francisco Marcos Juan Santaló Professor of Law, IE Law School Professor of Strategy, IE Business School [email protected] [email protected]
ABSTRACT: This paper estimates the average effect of regulatory intensity and administrative redtape on productivity and innovation. For this purpose we exploit the exogenous variation of the decentralization process that has taken place in Spain during the last three decades. Using objective proxies for legislative and regulatory activity such as the number of pages and number of new norms published in the regional legislative reporters we find a strong negative impact of regulatory intensity on regional innovation and productivity. This negative effect of regional regulation is not only statistically significant but also of large economic importance and can explain the absence of productivity growth of Spain in the last decades. Finally, we provide evidence that regulatory intensity has affected the size distribution of establishment reducing its skewness and therefore affecting asymmetrically more those establishments that are more likely to innovate. KEYWORDS: regulation, regulatory burden, decentralization, self-governing communities, regions, federalism, economic development, innovation, productivity, Spain JEL CODES: D24, H73, H77, K20, 031, 047, 052, R50 ACKNOWLEDGEMENTS: A prior version of this paper, under the title “Decentralization, Regulatory Burden and Economic Development in Spain” was presented at the 24th Annual Conference of the European Association of Law and Economics, celebrated at Copenhagen Business School in September 2007. The criticisms, comments and suggestions by the attendants to those meetings are hereby gratefully acknowledged. The authors are thankful for the financial support of the European Network for Better regulation and Spanish Ministry of Education’s research grant #SEJ2007-67582-C02-01.
Copyright © 2010 by Francisco Marcos professor at IE Law School and Juan Santaló Professor at IE Business School. This working paper is distributed for purposes of comment and discussion only. It may not be reproduced without permission of the copyright holders. Copies of working papers are available from the authors. Printed at IE Business School, Madrid, Spain. Please, do not reproduce or circulate without permission.

IE Business School Working Paper DE8-130-I 15-07-2010
2
1. INTRODUCTION.
There are persistent differences in the rates of growth and economic development among
countries. This difference is noticeable not only between developed and underdeveloped economies but
also within the set of arguably developed countries like those belonging to the OECD. Distinct legal and
regulatory frameworks are the usual suspects to explain this heterogeneity in economic growth since they
are more or less adequate to promote investment, risk-taking and the innovation activities that are directly
linked to the creation of economic value. As a result, a rich empirical literature has investigated the link
between legal and regulatory heterogeneity and economic outcomes. However all this literature faces a
common challenge that is prevalent in any empirical research that relates to the daunting task of properly
telling apart causal links from statistical correlations. Moreover, it suffers from subjectivity biases in the
construction of proxies for regulation and regulatory intensity. In this paper we exploit the quasi-natural
experiment that constitutes the decentralization of the State in Spain, moving from a unified legal and
regulatory framework in the middle of the 1980s to a quasi federal state composed by seventeen distinct
legal regional entities in the beginnings of the 21st century. The Spanish decentralization offers a
exogenous variation in regional legislation both cross section and across time because regional political
empowerment has followed separate time paths that have been driven by both historical reasons and the
distinct political equilibriums that have occurred at the national and regional level during this period. In
that setting we have built an unbiased index of regulatory intensity, which objectively measures variations
in regional adoption of rules and legislation.
Complying with general regulations and administrative redtape is a costly burden that may affect
the competitiveness and overall efficiency of the economy. The main purpose of this paper is to estimate
the effect of these legal compliance costs on economic development, looking at regional variations. As
explained above, Spain provides a suitable scenario to test some of the main implications of the
abovementioned thesis of considering regulation and compliance as costs for businesses. The
decentralization of legislative and regulatory powers from the Central Government to the Self Governing
Communities (Comunidades Autónomas), SGCs, or hereinafter for simplicity referred as regions, –which
began in the early 1980s and has been progressively developed until these days- has generated a
substantial variety of situations that may turn to be useful in empirically evaluating the effect of the
exercise of the legislative and regulatory powers by the regions on their economic development and
business activities. In this paper we focus on estimating the effect of “red tape” on productivity and

IE Business School Working Paper DE8-130-I 15-07-2010
3
innovation of Spanish regions. For this purpose we construct a unique dataset that contains neutral
measures of regulatory intensity at the regional level, such as the number of regional norms and number
of regional pages of regulation in the legislative reporters, and we estimate its effect on regional total
factor productivity and regional innovation. We find that regulatory intensity is associated to lower
productivity and innovation. These effects are not only statistically significant but also of economic
significance. Our estimates show that an increase of 100% in the number of local norms is associated with
a decrease of 79-81% in the number of regional patents and a lower Total Factor Productivity (TFP)
growth rate of around 3.5%. This is a significant decrease since the Spanish TFP growth rate during the
period has in fact a negative growth of -0.15%.
We also explore empirically the existence of two potential links between regulatory intensity and
diminished productivity and innovation. We are unable to find any generic effect of regulatory intensity
on product market competition measured by number of regional business establishments. However we
find a negative association between regulatory intensity and the skewness of the size distribution of
business establishments. More particularly we uncover that regulatory intensity is associated to a lower
proportion of employees working for business establishments with 200 employees or more. This finding
is consistent with a world in which regulatory intensity affects more the largest companies. This
asymmetric effect could explain the negative effect of regulation on productivity and innovation since
Giori et al. (2007) report that around 70% of the innovations in Europe are accounted by companies with
250 employees or more.
Overall, we contribute to the literature that investigates the economic effects of regulation in four
different manners. First, we make use of a quasi experiment provided by the peculiarities of the Spanish
legal framework that allows us to alleviate traditional endogeneity concerns when studying the link
between regulation and economic outcomes. Second we have constructed a novel dataset of regulatory
intensity variables (number of pages of regional legislative reporters and number of regional norms
adopted) and shown its negative effect on productivity and innovation. This opens the door for future
research to use similar regulatory variables in other international contexts. Third, the strong negative
effects of regulatory intensity we report in this paper contribute to the literature that systematically finds a
negative effect of regulatory burden on efficiency and productivity (Hsieh & Klenow 2009; Restuccia &
Rogerson 2008). Finally, we provide evidence that the main channel through which regulation affects

IE Business School Working Paper DE8-130-I 15-07-2010
4
innovation and productivity is not necessarily by impairing product market competition but rather through
its asymmetric negative effect on larger companies.
The rest of the paper is structured as follows. Section 2 describes the existing literature on the
topic of study and related issues. Section 3 sets the analytical framework of why we can expect an impact
of regulation on productivity and innovation; section 4 describes our data and variable construction;
section 5 runs preliminary test to assess the external validity of our proxies of regulatory intensity.
sections 6 and 7 display our main results, while section 8 runs robustness tests. Section 9 explores the
empirical plausibility of two potential causes to explain the link between regulation and productivity:
product market competition and asymmetric distortions in the allocation of resources. Section 10
concludes.
2. RELATED LITERATURE.
There is a rich literature that looks from different perspectives at how diverse institutional features
impact on macroeconomics (Glaeser et al. 2004). Regulation is undoubtedly a key aspect of any
institutional framework, and many works have sought to measure the economic effects of regulation.
Indeed, there is a large body of empirical research studying regulation and its impact on economic growth
and productivity. Several anecdotic references and commentaries have warned about the additional
burden and compliance costs that the increase of rules and regulation introduce to business firms
(Friedman 2004; Gattuso 2004). Lately some of these warnings have been specifically made in the
Spanish context (Rosell 2006; Balmaseda 2004, 2005).
In the U.S. context, Goff (1996) looks at the effects of regulation (based on an Effective
Regulatory Index constructed around quantity of regulation) on measures of economic performance to
find large and strong negative effects of increases of the regulatory measures in GDP and unemployment.
Christainsen & Haveman (1981) report a significant impact of federal regulation in U.S. manufacturing
productivity in the seventies. Similarly, Gray (1987) founds Occupational Safety and Health (OSH) and
environmental protection regulation contributed greatly to the productivity slowdown in the U.S.
manufacturing industry in the seventies. Introducing an environmental regulatory measure that captured
also the extent of regulation enforcement, Gollop & Roberts (1983) estimated a substantial drop in the
productivity of electric power industry after the 1970 amendments to the Clean Air Act. Interestingly,
Dufour et al. (1998) report that while OSH and environmental regulation had a negative impact in TPF of

IE Business School Working Paper DE8-130-I 15-07-2010
5
the Quebec manufacturing sector in the second half of the eighties, mandatory prevention programs and
fines for infractions of OSH rules had a positive impact on TPF growth.
More recently, Dawson (2007) time-series study shows that U.S. federal regulation, measured by
page-count of the Code of Federal Regulation (CFR), have had a strong negative impact (0.24% in the
overall period studied: 1949-1999) on economic performance measured as private business output, hours
of labor services and private capital services; however, his attempt to analyze the impact of individual
subjects of regulation (measured by each of the titles of the CFR) gave disparate results (the regulation in
some areas having a negative impact whilst positive in others). Moreover, Dawson & Seater (2007) find
that U.S. federal regulation has a statistically and economically significant effect on aggregate output and
total factor productivity, however the sign and magnitude of those effects have changed over time,
occasionally regulation has even altered the mix of inputs through which output is produced.
Regulation impact on economic growth and business productivity has also been considered and
compared cross-country, illustrating the negative effects over-regulation may have in growth and
productivity. However, any transnational or comparative analysis of the issue faces problems related to
different institutional frameworks in each country and legal system, which makes the analysis more
difficult, and the comparisons futile (Siems 2005). National idiosyncrasy may make optimal for a country
what it is not so in another one, and so forth. Moreover, countries are different in the economic and social
backgrounds, and this may render numerical comparisons useless (i.e., domestic reality, which is richer
than mere legal rules, explains better the economic success of a country compared with its neighbors).
Notwithstanding these difficulties, there are several studies that have analyzed and compared the
economic impact of regulation cross-country. Indeed, Nicoletti & Scarpetta (2003) show that changes in
product market regulation in 18 OECD countries (measured by 3 qualitative indicators of regulation)
from 1984-1998 affect overall productivity and that product regulation reduces multi-level productivity
growth through the creation of larger barriers to entry. Using a similar dataset (different rough measures
of product regulation for non-manufacturing industries in OECD countries, 1975-1998), Alesina et al.
(2005) find robust evidence that tight regulation of product markets has a large negative effect on
investment (deregulation increasing total investment). In the model constructed by Blanchard & Giavazzi
(2003) product market regulation creates rents and, thus, product market deregulation decreases rents,
increasing competition, lowering prices and lowering unemployment (but raising real wages). Afterwards,

IE Business School Working Paper DE8-130-I 15-07-2010
6
due to the diminution in rents, incentives for workers to appropriate a proportion of these rents are
reduced, facilitating labor market regulation.
On the other hand, based on the World Bank’s dataset on business regulations Djankov, McLiesh
& Ramalho (2006) conclude that countries scoring better on that database have grown faster from 1993 to
2002 (measured by GDP). Using the World Bank’s World Development Index (WDI) of government
effectiveness and regulatory quality variables as a measure of regulation, Jajilian, Kirkpatrick & Parker
(2007) find a large and strong impact on growth. Using the regulation measure of the Fraser Institute’s
Index of Economic Freedom in 123 countries from 1970 to 1999, Gørgens, Paldman & Wurth (2003) find
out that heavily regulated countries grow about 2 or 3% less than liberal ones (no effect is found in
moderate or low regulated countries).
Finally, Loyaza et al. (2004) made an empirical analysis of macroeconomic impact of regulation
based on seventy-six countries in the 1990s. Building an overall regulation index (composed of entry
regulation index, index of labor regulation, index of fiscal burden, index of trade barriers, index of
financial markets regulation, index of contract enforcement and index of bankruptcy regulation) and they
also taking into account institutional country features which may be relevant in looking at the economic
impact of regulation, they conclude that heavier regulatory burden reduces growth (in terms of per capita
GDP) and increases volatility, although the effects are smaller the stronger the quality of the country’s
institutional framework.
Overall, all these studies find a significant and negative effect of regulation on economic growth
and productivity. However, such studies face two major difficulties: The first one consist in the difficulty
in objectively measuring regulation itself. Any work on this area needs to deal first with designing tools
to measure the extent and scope of regulation in the economy. As a result many regulatory indicators
suffer from potential subjectivity bias, as they part from assumptions and valuations with weak
independent grounding that may introduce biases or ideological prejudices as it happens with all the
works above that use ad-hoc index of regulation like the indexes computed by the OCDE or the World
Bank. The second difficulty lies in isolating the effects of legal rules on economic indicators from other
confounding factors. Once a neutral measuring technique has been developed, it is only possible to
estimate whether it has deleterious effect on economic activity as long as the characteristics of a dataset
allows the use of econometric procedures that alleviate the concerns that we are really estimating the
effect of regulation on economic activity, rather than the effect of other confounding factors. For

IE Business School Working Paper DE8-130-I 15-07-2010
7
example, Dawson (2007) and Dawson & Seater (2007) studies suffer this second type of problem. Since
they use time series variation to identify the effect of regulation, it is impossible to discern whether the
estimated negative effects are indeed driven by regulation or by other contemporaneous factor that
occurred at the same period of time.
However, the Spanish context provides an exceptional quasi natural experiment that allows us to
circumvent the two difficulties faced by any study of the impact of regulation on productivity or on any
other economic indicator. The beginning of decentralization in 1978 and its evolution from a unified
regulatory system to a decentralized state in the subsequent times provide a first-rate framework for
developing a numerical comparison of rules adopted and economic performance. Free from the reins of
the Central Government, Spanish regions have adopted different models and options in the exercise of
their powers. The recent history and evolution of the Spanish race towards a decentralized State provides
a unique setting for analyzing regulation and its impact on the economic development of Spanish regions.
The transfer of competencies to regions has given them powers to legislate or regulate many questions
that were formerly governed by the central State. Over the years, Spanish regions have acquired relevance
and powers that were previously non-existent and the rate of empowerment has differed across regions
and across time in a path driven by the Spanish political equilibrium both at the national level and at the
regional level (see Appendix A for data on evolution on powers transferred from the State to the regions).
However their regional regulatory strategies have differed not only in the areas that they have regulated
but also in the intensity with which regions have exercised their powers. We have developed an objective
regional regulatory index that measures across time variations in regulatory intensity per region looking at
the number of pages published in the regional legislative reporter and the number of norms adopted in
each of the 17 Spanish regions, adjusted to the progressive transfer of powers in different areas from State
to the regions (Marcos, Santaló & Sánchez Graells 2010). Indeed, two previous studies have tried to
measure the impact of regional regulation on regional productivity in Spain (Gual et al. 2006; Zárate &
Vallés 2010), but they suffer from some inconsistency in the construction of their regulatory indicators
and, moreover they do not make full use of the exogenous variation provided by the different evolution of
the levels of empowerment of the Spanish region in the process of decentralization of the Spanish state.
In the empirical section below we examine the extent in which regulatory intensity provokes less
productivity and innovation but before we turn to the theoretical reasons why we should expect regulatory
intensity to affect both productivity and innovation.

IE Business School Working Paper DE8-130-I 15-07-2010
8
3. ANALYTICAL FRAMEWORK: THE EFFECT OF REGULATION ON INNOVATION
AND PRODUCTIVITY.
The literature has identified two ways under which regulation can influence innovation strategies
and firm productivity. First, regulation intensity can affect the nature of competition in the market place.
For instance regulation could lift entry barriers (Nicoletti & Scarpetta, 2003) and hence it could affect the
number of competitors in any given industry. Alternatively regulation could simply restrict price
competition (Nicoletti 2001; Nicoletti et al. 2001). Regardless of the particular regulatory driver, these
changes in the competitive environment affect productivity because a strong impact has been found of
market competition on the incentives of firms to invest in innovation activities. Nickell (1996) reports a
positive impact of product market competition and productivity while Aghion et al. (2005) find that the
linkage between competition and innovation follows an inverted U curve relationship. This means that an
enhanced product competition increases firm innovation/productivity when the initial levels of market
competition are low and it decreases innovation investments when the initial levels of competition are
high. Similarly Alesina et al. (2005) model theoretically and show empirical evidence in favor of a strong
negative effect of regulation on investment through its effect on enhanced entry barriers.
An additional channel through which regulation could affect productivity is by distorting the
optimal allocation of resources. Restuccia & Rogerson (2008) show that policies which create
heterogeneity in the prices faced by individual producers can lead to sizeable decreases in output and
measured total factor productivity (TFP) in the range of 30 to 50%. Hsieh & Klenow (2009) use micro
data on manufacturing establishments to quantify the potential extent of misallocation of resources in
China and India compared to the U.S. They calculate that when capital and labor are hypothetically
reallocated to equalize marginal products to the extent observed in the U.S., TFP could increase 30-50%
in China and 40-60% in India.
Additionally, red tape affects the time and resources that the top management team has to employ
dealing with regulatory issues and requirements. Managerial time and resources are limited and the more
time managers devote to adapt or circumvent to regulatory changes the less time they have to improve the
efficiency of their companies (Christainsen & Haveman 1981). We analyze this in a toy model in which
executives have to decide the optimal allocation of their limited time between competing tasks a la Rosen

IE Business School Working Paper DE8-130-I 15-07-2010
9
(1982). Companies have two hierarchical levels in which one manager takes care of n workers in which
the number of workers is endogenously chosen by the manager. Managers have a limited amount of time
available T that they have to spend on two tasks. First, managers supervise the innovation activity of its
employees and by this they increase employees’ productivity. Alternatively managers spend time in
understanding or implementing regulatory changes. We start by assuming that the amount of time that
each top executive commits to address regulatory issues is fixed and equal to . This means that the rest
of time total time T is devoted to help employees improving their efficiency.
As in Rosen (1982) managers differ in their quality levels. Workers also differ in their
productivity. Let q denote the quality of an individual manager and the quality of an individual worker.
Each worker i working for manager q produces output according to the functional form:
(1)
Where ti represents the amount of time that the executive has employed in helping worker i.
Managers can work with many employees at the same time. Note that this will always happen because
there is a decreasing marginal productivity of the time devoted to help a worker to innovate. As in Rosen
(1982) the term in (1) is the analytical representation of the quality of general top-management
decisions. It is independent of i, representing the effects of skills inherent in a command system which
apply equally to all workers controlled by q, captures the indivisibility of management-type decisions
as for example strategic issues and implies a scale economy because it improves productivity of all
workers in the firm, irrespective of their numbers or the time allocated to them. Total firm output will be
the sum of the individual output of all workers: ∑ .The unit of skill of workers is paid a
compensation of w.
With these assumptions the problem of the manager is to choose 1 . . that maximizes:
∑ (2)
Subject to ∑
This problem is identical to the model in Rosen (1982) with slight different notation and with the
only exception of the extra time that manager have to devote to deal with regulatory problems . We
refer to Rosen (1982) for further details about the solution and further implications of this model. For our
illustrative purposes is enough to point out that total production of a firm run by a manager of quality q is:
(3)
IE Business School Working Paper DE8-130-I 15-07-2010
10
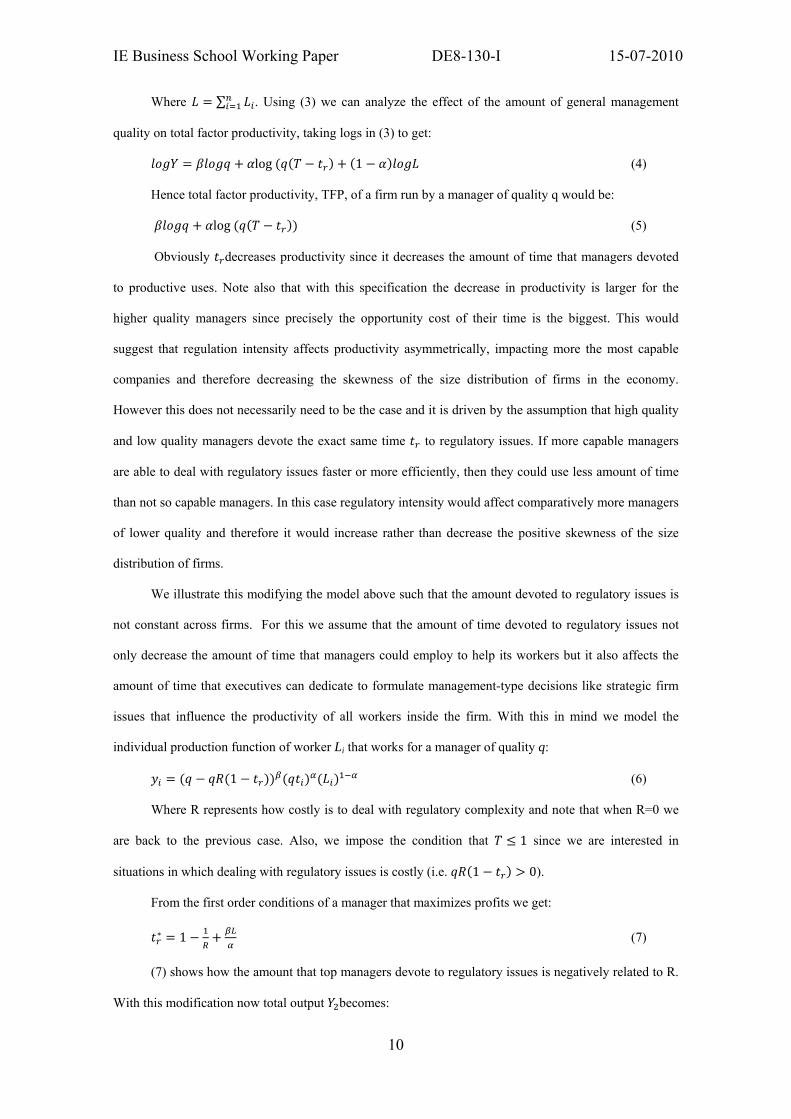
Where ∑ . Using (3) we can analyze the effect of the amount of general management
quality on total factor productivity, taking logs in (3) to get:
log 1 (4)
Hence total factor productivity, TFP, of a firm run by a manager of quality q would be:
log (5)
Obviously decreases productivity since it decreases the amount of time that managers devoted
to productive uses. Note also that with this specification the decrease in productivity is larger for the
higher quality managers since precisely the opportunity cost of their time is the biggest. This would
suggest that regulation intensity affects productivity asymmetrically, impacting more the most capable
companies and therefore decreasing the skewness of the size distribution of firms in the economy.
However this does not necessarily need to be the case and it is driven by the assumption that high quality
and low quality managers devote the exact same time to regulatory issues. If more capable managers
are able to deal with regulatory issues faster or more efficiently, then they could use less amount of time
than not so capable managers. In this case regulatory intensity would affect comparatively more managers
of lower quality and therefore it would increase rather than decrease the positive skewness of the size
distribution of firms.
We illustrate this modifying the model above such that the amount devoted to regulatory issues is
not constant across firms. For this we assume that the amount of time devoted to regulatory issues not
only decrease the amount of time that managers could employ to help its workers but it also affects the
amount of time that executives can dedicate to formulate management-type decisions like strategic firm
issues that influence the productivity of all workers inside the firm. With this in mind we model the
individual production function of worker Li that works for a manager of quality q:
1 (6)
Where R represents how costly is to deal with regulatory complexity and note that when R=0 we
are back to the previous case. Also, we impose the condition that 1 since we are interested in
situations in which dealing with regulatory issues is costly (i.e. 1 0).
From the first order conditions of a manager that maximizes profits we get:
1 (7)
(7) shows how the amount that top managers devote to regulatory issues is negatively related to R.
With this modification now total output becomes:

IE Business School Working Paper DE8-130-I 15-07-2010
11
/ (8)
From (8) we can compute the new total factor productivity:
βlog αlog (9)
Note that since T<1, then (7) implies that / 1 and therefore if is close to then TFP2 is
lower than TFP. More interestingly note that the term αlog still indicates that more capable
firms productivity are potentially more affected in their productivity by the regulatory burden. However
the term βlog / shows how this can be compensated by the fact that managers of higher q (and
hence higher L) can also deal more efficiently with regulatory procedures and therefore enjoy higher
productivity than less capable managers. The net effect is indeterminate and depends on the parameters of
the model although in both cases productivity is decreased when managers are forced to give up valuable
time in dealing with rules and regulatory procedures. In the empirical part of the paper we report evidence
that supports that regulatory intensity affects proportionally more the largest (more productive)
companies.
4. DATA AND VARIABLE CONSTRUCTION.
In this section we describe the dependent variables for TFP and innovation of the Spanish regions
and the independent variable for regulation intensity variations among them. We also report the control
variables that will be used in the regressions.
4.1. Dependent Variables (I). TFP growth rate.
We measure regional productivity of the Spanish regions by computing the growth of the total
factor productivity (TFP) as described originally by Solow (1957) and further refined by Jorgenson &
Griliches (1967). This is a standard construct for productivity and it is profusely used in academia as well
as in more policy oriented documents (for a review see Oliner, Sichel & Stiroh 2007). Recent
development and growth accounting studies have established that total factor productivity is an important
source of cross-country differences in income per capita levels and growth rates (Hall & Jones 1999).
Intuitively, the TFP growth rate gauges the growth of output that cannot be explained by variations in the
use if inputs and we hypothesize that this growth rate will be affected by regulation intensity as explained
in the analytical framework. In general, improvements in TFP reflect contributions to output as a result of

IE Business School Working Paper DE8-130-I 15-07-2010
12
the more efficient use of resources or the adoption of new production technologies. More formally TFP
growth rate of one region at year t is derived as:
∆
1∆ ∆
(10)
Where y represents total output, L and K are Labor and Capital inputs respectively and
represents average share of capital. Since in discrete time the share of capital varies across time we take
/2.
From official government statistics elaborated by the Instituto Nacional Estadística (INE), we get
the time series of regional GDP as proxy for regional output. We download from INE the series of
regional GDP at constant prices for the period 1988-2007. The INE reports the regional GDP from 1980
to 1995 with 1986 prices while regional GDP from 1996 to 2007 are reported with 1995 prices. We begin
by normalizing the whole series to 1986 prices using the corresponding GDP deflator and then we
compute the GDP growth rate at constant prices for each year. The average regional growth rate for the
whole period is 2.8% with a standard deviation of 2%. The maximum growth rate during the period was
obtained by La Rioja with a 15% growth rate in 1990. The lowest growth rate was achieved by Castilla
La Mancha in 1993 with a negative rate of 4.5%.
Also from the same official source, INE, we obtain information of total number of people
employed by region. The last year covered in the employment series is 2004. We use this series to
compute the growth in Labor input in (1). We compile regional changes in capital stock using regional
historical series elaborated by the research department of one of Spain’s largest private banks (Banco
BilbaoVizcaya)1 . This same series is used by most researchers that have computed the evolution of TFP
growth rates across Spain’s regions (Leonida & Montolio 2004; Maudos et al. 2000; Prior Jiménez 1990)
This series of capital stock is available from 1964 until 2004. Finally, we compute regional as the
fraction of total regional wage compensation over total regional GDP (both at constant market prices).
The source of the variables is also the INE: With this information we are able to compute TFP growth rate
for all seventeen regions for the period 1980 to 2004.
Note that in this growth accounting exercise we are incurring in two relevant biases due to the
limitations of our data. First, we would like to have constructed TFP using total number of hours worked
1 This information can be freely downloaded at www.fbbva.es.

IE Business School Working Paper DE8-130-I 15-07-2010
13
as proxy of L rather than total number of people employed. However, this information at the regional
level does not exist for the long time interval that we need for our regressions. It could well be the case
that the number of people employed increases across time but the number of hours worked per employee
decreases. If so, we would be downwardly biasing our estimates of regional TFP. Second, given to lack of
regional data, we are unable to adjust by changes in the quality of inputs. This can be important since
Jorgenson & Griliches (1967) show that a substantial fraction of the TFP can be explained by unmeasured
improvements in both capital and labor inputs. Hence, as a result of this second limitation, we could be
finding regional TFP estimators that are biased upwards. However, our purpose is not the appraise the
“true” and accurate regional TFP growth rates but rather we want to assess whether TFP is affected by
regional regulation. If so, these two biases may be ignored as long as their magnitude is not correlated
with our proxies of regulatory intensity. A priori we do not see why changes in either the quality of inputs
or in the number of hours worked by employee should be correlated with our regulatory intensity indexes
and this is why we think that our results are not affected by measurement error in TFP growth rates. Yet
in our empirical analysis below we try to address this potential problem using a instrumental variable that
should not be correlated with neither of these measurement errors.
Table 1 displays our estimates of the average growth rates in this period for each region (SGC).
The average regional GDP growth rate is around 3% with the lowest average GDP growth rate
corresponding to Asturias with only 1.92% while the maximum is obtained by La Rioja with 3.72%.
However, Table 1 suggests that most of this growth has been achieved without any increase in efficiency
in the Spanish regions. The average TFP growth rate is quite close to zero in most of them and
significantly negative in both the Balearic and Canary Islands, with a negative rate of around 1.4% and
1.18% respectively. Even with the limitations of our estimation of regional TFP that we have explained
above, the finding of zero and even a negative trend of regional TFP that we find is consistent with the
those by Prados de la Escosura & Roses (2008) that for the period 1987-2000 and for the whole of the
Spanish Economy report an average annual increase of TFP between negative 0.3% and positive 0.2%.
------Insert Table 1 around here------
4.2. Dependent Variables (II) Regional Innovation:

IE Business School Working Paper DE8-130-I 15-07-2010
14
We obtain information on applications filed in the Spanish Patent and Trademark Office (Oficina
Española de Patentes y Marcas) for Intellectual property rights (IPRs) that protect innovative activity.
Registration is required to acquire a valid and legal IPR that can be exploited by business firms. This
source provides annual information from 1990 to 2006 on four distinct measures of firm innovation
activity at the regional level according to the address of the applicant. Despite well known discussion
regarding the limitations of patent and IPRs counts as indicators of innovation and technological
improvements, there is some general consensus on the relevance and value as a proxy for innovation and
technological change (Griliches 1990).
Number of patents includes all applications for patents filed a given year from firms in a given
region. A patent is a legal title recognizing the exclusive right during 20 years to make use of an
invention, preventing others from manufacturing, selling or using it without the patent holder's consent.
Utility models includes all applications for “petty patents” or “innovation patents”, presented by
firms in each region to protect inventions of less inventive nature than those protected by patents, they
require fewer conditions to be awarded than standard patents, they are cheaper to obtain, and when
awarded they provide a shorter protection term (10 years).
Industrial designs includes all applications of legal protection for creative designs by firms
addressed in one region, which gives their holder the exclusive right to use the appearance of the whole or
a part of a product resulting from the features of, in particular, the lines, contours, colors, shape, texture
and/or materials of the product itself and/or its ornamentation. Designs could be two-dimensional or
three-dimensional. The protection conferred by industrial designs has a duration of 5 years from the filing
date and can be renewed for one or more consecutive 5 years periods to a maximum of 25 years.
Trademarks measures all requests of legal title over brands filed by firms from each region,
trademarks give the holder exclusive rights on a name or a sign for identifying a product, a service or a
firm in the market. Although sometimes their layout may involve some creativity, we are aware that
trademarks are used for identifying firms, products and business. However, they are a sensible indicator
of the strength and dynamism of firm’s economic activity and even productivity, constituting a good a
proxy of new products, services or firms being launched in each region.
4.3. Independent Variables.

IE Business School Working Paper DE8-130-I 15-07-2010
15
The goal of this paper is to estimate the impact of regulatory intensity on different innovation
indicators. We proxy regulatory intensity both with the number of regional norms and the total number of
pages occupied by the legislative and regulatory acts of general scope the regional governments have
published in the exercise of their assumed powers. This is a raw measure of quantity of legislation that
has the advantage that is totally objective and the disadvantage that totally disregards any attempt to
measure the quality of the norms. Doubtless, the quality of the regulation has an effect on the impact of
regulatory burden on any economic indicator and, therefore, our analysis below has two key identifying
assumptions: a) For a given quality of the legislation, the lengthier the norm, the larger are the costs of
compliance for economic agents and b) The quality of the regulation is negatively associated or not
associated at all with the length of the regulation (i.e., in general terms, larger rules tend to have lower
quality). If these assumptions do not hold, for example, because better regulations are longer, then our
proxy based on the total number of pages would not be a good measure of regulatory burden and,
therefore, we should expect to find no effect or positive effect on the economic indicators.
We measure the impact of regulatory activity of business with the number of pages and norms
published by the Aranzadi Reporter of regional legislation and regulation for years 1988 to 2006. We use
this ‘rough’ measure of regulatory activity because we consider that any attempt to elaborate a pure
quantitative measure of regulation affecting economic activity can be criticized as imprecise or vague. It
may suffer from roughness as any measure that goes without introducing any kind of valuation of content
and effects of rules on business and economic activity, but it has the advantage of being completely
unbiased.
Some attempts to construct indexes of regulatory burden are known. But they somehow betray the
neutrality and objectiveness of quantitative measures, because they necessarily add some sort of
judgment. For example, as mentioned before in the literature review, the OECD elaborates a Product
Market Regulation Index, examining regulatory options and activity in different dimensions concerning
product’s markets in order to evaluate to what degree they inhibit or promote competition2. Our use of
simple and objective measures of legislative production purports to preempt any criticism regarding the
2 See Conway et al. (2005) stressing the “objective character” of the PMR index. It may be true that PMR indicators
are designed and elaborated with a more objective methodology than other indexes, but nevertheless there is a “grain”
of subjectivity in the evaluations that lead to their calculation (for example, why does it use the criteria it uses and no
others?, how does it calculate the weight it gives to each of them?).

IE Business School Working Paper DE8-130-I 15-07-2010
16
subjectivity and bias that can be made of any content measure of regulation, and for that purpose it uses
crude and pure quantitative measures. The main two indicators used will be the number of pages of the
Aranzadi legislative collection published in each region and the number of different norms legislated by
the regional parliaments and governments. We take the 18 years comprised in the period 1988-2005. The
starting year is 1988 since this is the first year in which the Aranzadi legislative dataset provides
information on all the regional norms in the same font and page format. In this framework we use four
distinct proxies of regulatory intensity:
Number of pages at time t measures the accumulated number of pages at time t that the regions
have written when exercising the powers under their jurisdiction. It is important to stress that the dataset
provides this information in the exact same text, font and page format for all regions. As a result,
differences in the number of pages are purely driven by differences in the length and number of norms.
There are significant regional differences in the number of pages of legislation/regulation. In 2005 the
region with the maximum number of “regulatory pages” issued was Catalonia with a total of around thirty
thousand pages while Cantabria had only around nine thousand pages with the rest of regions located in
the middle of these two extreme cases.
Number of Norms at time t represents the accumulated number of norms legislated by the regions
up to time t. Naturally the larger the number of norms approved, the higher the regulatory intensity. In the
data we can observe huge regional dispersion in the number of norms adopted by region. For instance,
while in 2005 Catalonia had already elaborated almost twelve thousand new regional norms, Cantabria, in
the same year, had only developed around three thousand and four hundred new norms.
As explained above, the Spanish regions are not homogenous in terms of the powers they can
exercise. This is true currently more than twenty-five years after the creation of the decentralized state,
but this heterogeneity was much more pronounced in the earlier years of the creation of the decentralized
State in which different regional paths to decentralization coexisted. Since we intend to use in our
empirical analysis below time series data, we need to account by this different degree of regional
empowerment because regions with more powers may naturally have more and/or lengthier norms,
without this necessarily having any causal effect on regulatory intensity because the central state rules
that the new regional regulation would be substituting is smaller. For this reason, we normalized number
of accumulated pages by the total number of accumulated powers of the individual regions at any given
year in our sample. This normalization has still the problem that not all powers assumed by the regions

IE Business School Working Paper DE8-130-I 15-07-2010
17
empower them in the same manner (i.e., it is different to assume and exercise powers on fisheries or
agriculture than to do so on education or transportation), yet we see no reason why this may
systematically bias our results.
Average number of pages per legal power at time t is computed as the accumulated number of
pages elaborated by a region at time t divided by the number of legal powers under its jurisdiction at time
t.
Average Number of Norms is computed as the total number of norms at time t divided by the
number of legal powers under the jurisdiction of the region.
4.4. Controls
Population.
In our analysis below we control by regional population levels, as more populated regions may
display different legislative and economic trends. We have downloaded population data from the INE
webpage. The INE webpage provides three different series of population. From 1986 to 1995 it provides a
measure of regional population based on the number of inhabitants that were administratively registered
in that region. From 1996 on the INE provides a measure of population based on the number of people
that actually live in the region. We merge both series to build a unique population time series from 1986
to 2005. This means that the definition of population changes approximately in the middle period of our
sample. As before, we do not believe this may cause any bias in the estimation of the effect of regulatory
burden since we include year dummies in our regressions. Besides we are not interested in the estimation
of the coefficient of the population variable and therefore the change of definition does not seem to be
problematic. Finally, the INE does not provide population figures for the year 1997 and for this year we
have used the population figures corresponding to the year 1996.
Regional Gross Domestic Product (GDP).
Standard neoclassical models (Barro & Sala-i-Martin 2002) predict convergence in income per
capita across regions. This convergence may imply that regions with larger GDP levels exhibit lower
rates of productivity growth. If regions with larger economic size are characterized by a more intense
regulatory activity then we could obtained a spurious negative association between productivity and

IE Business School Working Paper DE8-130-I 15-07-2010
18
regulatory activity if we do not control by regional GDP levels. The source of this control variable is
explained above when we detail the sources for computing TFP growth rate.
Regional Public Expenditure.
We want to differentiate the effect of regulatory intensity from crowding out effects on private
economic activity due to excessive public expenditure. With this in mind, we control in all our
regressions by the annual level of public expenditure in constant prices incurred by regional authorities.
The data we use in the analysis has been compiled by Spanish Ministry of Treasury (Ministerio de
Hacienda)3. In non-reported results we have repeated all our analysis controlling by the number of
regional government employees and by the fraction of regional public expenditure over total regional
GDP. The results we obtain with these other controls are the same as the ones we display below.
Regional and year dummies.
Since the different regions vary in the sector distribution of economic activity, culture and
language, the importance of other economic and civil institutions, the age distribution among the
population and many other unobserved characteristics, we include in all our specifications regional
dummies to account for all these regional differences. Finally, all our specifications include year dummies
to take into account general national trends. Note that as a consequence of including year dummies all our
results below can be interpreted as measuring the effect of local regulation on regional deviations from
the national average.
Table 2 shows the descriptive statistics of all the variables described above as well as those that we
will use later on in our empirical analysis.
---Insert Table 2 around here---
5. DETERMINANTS OF OUR REGULATORY INTENSITY PROXIES.
Since we have quite raw proxies of the intensity of regional regulation, we start by assessing
informally whether the number of pages and the number of norms are correlated with different constructs
that are likely associated to the existence of regulatory intensity and with the intervention of the public
sector in the economy. With this purpose in mind, we first analyze whether both the number of pages and
3 The information on regional public expenditure can be freely downloaded at http://www.estadief.meh.es.

IE Business School Working Paper DE8-130-I 15-07-2010
19
the number of regulatory norms correlate with other measures of public activity like the number of
regional public employees and the amount of regional public expenditure. Intuitively, regions that stand
out for their levels public expenditure and for their number of employees are likely to be those whose
length and quantity of regulation is also larger. Table 3.a. and Table 3.b. displays the results of eight
regressions in which the dependent variable is each one of our four measures of regulatory intensity and
the dependent variables are (including regional and time dummies) the number of public employees, the
percentage of public employees in the total population, the percentage of regional public expenditure over
total GDP and the absolute levels of public expenditure. As additional controls we also include local
population and total GDP levels. The coefficients displayed in Tables 3.a and 3.b show how both the
number of pages and the number of norm of SGCs are strongly positively associated to all four measures
of public activity (public employees, fraction of public employees of regional population, total public
expenditure and fraction of public expenditure over regional GDP).
------Insert Table 3.a and Table 3.b around here------
Next, we check whether the number of pages and number of norms are associated to other more
precise regulatory indexes. For this, we make use of a regional anti-competitiveness regulatory index
constructed by the Spanish Competition authority (Tribunal de Defensa de la Competencia 2003). This
index measures the obstacles to effective competition in retail trade and distribution arising from
regulatory interventions by regional governments at that time. It identifies up to seven legal barriers to
retail distribution: 1) The definition of the large retail establishment is based on its location; 2) There are
multiple and arbitrary criteria to determine whether an establishment is large; 3) An establishment is
considered large if more than 25 percent of its ownership belongs to a large firm; 4) There is a
discriminatory treatment for discount retail establishments; 5) There are limits on the establishment of
small retailers and transfer of their ownership; 6) Regional governments require a financial viability plan
for commercial establishments to be authorized; and 7) There are outright bans on large retail
establishments. The index added one point for each one of these legal barriers that were present in a given
region. Although the maximum theoretical value of this anticompetitive regulatory index was seven
points, the Spain Competition authority reported that the maximum value obtained was just four
(corresponding to Catalonia, Baleares, País Vasco and Navarra and therefore being these four regions the
ones with most obstacles to effective competition in retailing). On the contrary, Castilla La Mancha, with

IE Business School Working Paper DE8-130-I 15-07-2010
20
an index value of zero, is identified as the region with the lowest number of legal barriers to retail
distribution.
------Insert Table 4 around here------
Table 4 displays the correlation coefficient of the anti-competitiveness regulatory index with our
four proxies of regulatory intensity. In all four cases the correlation coefficient is positive and we can see
that the correlation is statistically significant. We interpret Table 4 as evidence that those regions that
through regulation have erected more legal barriers to competition in trade retailing are also those regions
that have enacted a larger number of norms and had published a larger number of total “regulatory” pages
(using different regulation indicators from the ones employed here, a similar result is found by
Hoffmaister 2010 and De los Llanos Matea & Mora-Sanguinetti 2009). Informally, this confirms the
validity of our measures as proxies of regulatory intensity.
Once we have documented the positive cross section correlation between our proxies of regulatory
intensity and the anticompetitive index in the retailing sector, we study the effect of our regulatory
proxies on the evolution of the number of large retail establishments as well as in the total area devoted to
large retailing outlets. We obtain information of both variables from a nonprofit foundation set up by La
Caixa, one of Spain’s largest saving institutions. This institution compiles information on large
commercial outlets and their corresponding surface from 1996 until 2006. Because the legal definition of
large commercial outlet varies in each region (according to several criteria, related to the commercial
area), La Caixa follows the definition of the Spanish Association of commercial malls which does not
require a minimum area for sales (it is defined as the “combination of independent commercial
establishments, planned and developed by one or more entities, with the criterion of unity, whose size,
business mix, common services and complementary activities are related to their environment, and that
has an image permanently and management unit”).
Since we have shown above that our proxies of regulatory intensity are strongly positively
correlated to the number of legal barriers to competition in retailing, we are expecting to find a negative
relation between length (and number) of regional norms and the total amount (and area) of large
commercial outlets.
------Insert Table 5.a and Table 5.b. around here-----
Tables 5.a. (Table 5.b.) display the coefficients of four regressions in which the dependent
variable is the number (and area) of large commercial outlets and the dependent variable is each one of

IE Business School Working Paper DE8-130-I 15-07-2010
21
our measures of regulatory intensity. Tables 5.a and 5.b show how all four measures of regulatory
intensity are negatively associated to both number and total are of commercial outlets. All eight
coefficients are statistically significant from zero. Note also that the magnitude of the effect is quite
relevant. For example, in Table 5.a. the estimated coefficient of the variable Number of Norms implies
that an increase of 100 percent in the number of local norms is associated to a decrease of 244 percent in
the number of large commercial outlets. Similarly, according to Table 5.b an increase of 100% in the
number of norms translates in a reduction of 205% in the total area devoted to large commercial outlets.
Similar striking numbers can be inferred from the rest of coefficients in Tables 5.a and 5.b. Overall, we
interpret both tables as strong evidence that both the number and length of norms is associated with
diminishing presence of large commercial outlets and hence with lower competition at the retailing sector.
6. REGULATION AND INNOVATION.
Once we have established the validity of our proxies for regulatory intensity, in this section we
perform an analysis concerning the association between regulation intensity and other variables that
according to standard arguments are likely connected to the evolution of business innovation.
---Insert Tables 6.a, 6.b, 6.c, 6.d and 6.e around here---
Tables 6.a to 6.e show the results of 20 regressions in which the dependent variables are each one
of our five measures of firm innovation and the independent variables are our four different measures of
regulatory intensity plus controls. Note that all 20 coefficients show a negative relation between the
measures of industrial innovation and the regulatory intensity, 16 out of 20 coefficients are statistically
different than zero. Moreover, both the variables that measure the number of norms and number of norms
per legal power over which regional governments have jurisdiction, all of them without exception, are
statistically significant. The economic magnitudes are substantial. The coefficients associated to the
number of norms suggest that an increase of 100% in the number of regional norms is associated to a
decrease in the trademark applications of 61 to 63%, 101 to 103% of utility models applications, 79 to
81% of patent applications, 111 to 122% of trade names applications and 62 to 113% of industrial designs
applications. Overall we interpret Tables 6.a. to 6.e. as strong evidence that regulatory intensity is
associated to a substantial diminishing in business innovation activities (R&D).

IE Business School Working Paper DE8-130-I 15-07-2010
22
7. REGULATION AND PRODUCTIVITY GROWTH.
We start this section by exploring the evolution of regional total factor productivity growth rate in
1980-2004.
Graph 1 shows how evolution has differed in two groups of regions. The first/second group
includes all regions with the largest/lowest increase in the number of pages of legislation normalized by
the respective powers assumed by each region.
-------Insert Graph 1 over here--------
Although the TFP growth rate shows a tremendous variation over the years, we can observe that
there is not a tendency to have positive growth for none of the groups and this is consistent with the
averages displayed in Table 1 that showed that productivity did not grow in Spain during the period we
study. However in graph 1 we can see that those regions with the lowest increase in regulation in 1988-
2003 seem to have slightly better TFP growth rates during that period. On the contrary, those regions with
the largest increase in regulation in 1988-2003 seem to perform slightly better in the period immediately
before: 1980-1986. Table 7 reaffirms this graphical intuition by showing the average annual growth rate
for those regions with the largest/lowest increase in regulation in both subperiods. Those regions that
have regulated the most in 1988-2003 underperform lowest performing regions in the period of study
while they outperformed them in the previous eight years.
------ Insert Table 7 around here---
Better evolution of productivity in regions with the lowest increase in regulation displayed in
Table 7 could be driven by a variety of reasons like differences in the economic development, industry
composition, or demographics that could be associated at the same time with the intensity of regulation
and the evolution of productivity. We rule out the alternative explanations by estimating a fully fledged
econometric specification. Note that given that we have only information on the stock of capital per
region until the year 2004, our analysis comprises now the period 1988 to 2004.
------ Insert Table 8 around here---
Table 8 displays the results of four regressions in which the dependent variable is TFP growth rate
over our four measures of regulatory intensity. Consistent with the preliminary findings that we have just
reported, the number of norms is negatively associated to TFP growth rates and the two corresponding
coefficients are statistically different than zero. Their magnitude implies that doubling the number of
norms would be associated to a decrease in the TFP growth rate of around 3.5%. Given that the average

IE Business School Working Paper DE8-130-I 15-07-2010
23
TFP growth rate during the period is -0.15% this estimates show that productivity slowdown in the
Spanish Economy during the period could have been avoided by lowering legislative and regulatory
activity of regional parliaments and governments. The results of Table 8 show also a negative sign of the
number of pages of regulation on TFP, but only marginally significant, that suggests that the number of
norms rather than the pure length of the norms encumber regional TFP.
8. ROBUSTNESS TESTS.
As it occurs always with any empirical work, the correlations identified in Tables 6 and 8 need to
be interpreted with caution since they could be driven by some misspecifications of the empirical model
unrelated to any causal effect and in particular by the endogenous nature of our regulatory intensity
variables. For that reason, we perform some robustness test to better assess the nature of the linkage
between regulatory intensity, innovation and TFP. First we show the robustness of our results to the use
of lagged independent variables, second we exploit the characteristics of the Spanish decentralization
process to perform an instrumental variable analysis that check whether our result are driven by the
endogeneity of local regulation.
We start by ruling out that the quantity of regulation can be negatively correlated to innovation or
TFP due to standard omitted variable bias. For example, it could be the case that regulation quantity
increases the last year of activity of regional parliaments just before regional elections. At the same time,
local economic agents could postpone investment or important economic decisions until knowing the
color of the winner party. Similarly, it could be the case that when economic indicators deteriorate, local
politicians felt the impulse to change and increase the levels of regulation. If so, the negative correlations
reported in Tables 6 and 8 might be driven by either this “election year” effect or the “crisis reaction”
effect and therefore unrelated to any cause-effect relation between regulation and both innovation and
productivity. We rule out that the reported negative correlations are driven by any unobserved
contemporaneous effect by replication our main regressions lagging one year our proxies of regulatory
intensity.
------ Insert Table 9 around here------

IE Business School Working Paper DE8-130-I 15-07-2010
24
Table 9 replicates our previous results but studying the effect of regulatory intensity at time t-1 on
TFP, retail competition, patent and trademarks applications at time t4 . The coefficients on Table 9 show
that our results do not change when using lagged regulatory intensity variables indicating that the
negative effect of regulation is not driven by omitting variable bias due to unobserved contemporaneous
effects like the “election year” effect or the “crisis reaction” effect.
Another possibility could be that regional governments do not only react to poor economic
conditions but also they intervene when they properly forecast that productivity is going to experience a
slowdown. If so, local governments would increase their regulatory activity to diminish the negative
effects of the predicted slowdown. This phenomenon is an alternative interpretation of the results
displayed in Table 8 that have nothing to do with a negative effect of regulation on productivity. For
ruling out this alternative explanation, we need an instrumental variable that is related to regional
regulatory intensity and at the same time totally unrelated to productivity shocks or other variations in
economic conditions. Fortunately, the continuous and progressive process of decentralization in Spain
provides an excellent instrument that satisfies both conditions. As briefly explained above, the allocation
and transfer of powers to regional authorities have been happening gradually in the last thirty years
depending on both the political situation of the governing political parties both in the Spanish Central
State and in each the regions and, in particular, the necessity of the ruling party at central state level of
political alliances for getting support by the regional parties that have representation in the national
parliament. Moreover the decentralization process has been conditioned by internal political struggles of
the national party in power as well as by internal political struggles at the regional level. This has resulted
in a decentralization process that exhibits a remarkable degree of variation across time and across the
different regions (see López Laborda & Vallés Giménez 2006 attempt to model the forces explaining
different regulatory strategies by Spanish regions). Annex A displays the detailed time evolution of the
transfer of powers by region. Roughly speaking we can identify two main periods of regional
empowerment: 1982-1985 that coincides with the period in which most regional governments were being
created and the mid 1990s in which there was a new wave of state decentralization. Also, note that almost
every single year new powers are assigned to regions in an heterogeneous manner producing distinct
4 In Table 9 we do not include the results of industrial designs, industrial utilities and industrial names for
expositional purposes. The results with these three variables and with lagged regulatory intensity are qualitatively the
same as the results we have shown in Tables 6.a. to 6.e.

IE Business School Working Paper DE8-130-I 15-07-2010
25
paths of decentralization and hence of exogenous regional variations that we exploit in our empirical
analysis.
Naturally, the degree of decentralization is positively related to the amount of regional regulation
and, given its political nature, is unrelated to the economic conditions or predicted productivity. This
makes the degree of political power allocated at each point in time to each individual regional
government a magnificent instrument to check that our results are not driven by the endogeneity of the
regulatory activity.
With this purpose we instrument our regulatory variables with the number of powerss that they
have a given year t. More formally we implement the following two stage instrumental variable
estimations: In the first stage we estimate a lineal regression of the form
(11)
Where Regional Intensity could be either the number or length of local norms, local power is the
number of distinct issues in which region i is allowed to regulated and X are other controls (Regional and
Year dummies, GDP, Population and Regional Public Expenditure). As a second step, we estimate.
(12)
Where
is the estimated value of the first step, this is:
(13)
Where and are estimators of found running ordinary least squares regressions in
the first stage. Naturally the second stage adjusts the standard errors to take into account that Regulatory
Intensity is now an estimated variable. Finally, note that we cannot use this instrumental variable
approach to our measures of regulatory intensity that adjust by the number of powers assumed by each
region since mechanically these averages depend negatively on the number of powers. The results of this
two-stage-least-square estimation process are displayed in Table 10.
------ Insert Table 10 around here------
Table 10 shows how the Instrumental Variable estimation provides evidence that an exogenous
increase in the number of regional regulation is associated to lower TFP growth rates. If we compare the
results in table 10 with those displayed in Table 8 we find that accounting for the endogeneity of the
regulatory process provides even stronger estimate of the effect of regulatory intensity on TFP growth
rate. The fact that the negative effects displayed in the IV estimators in Table 10 are even stronger than

IE Business School Working Paper DE8-130-I 15-07-2010
26
the OLS estimates of Table 8 suggest that, without correction, endogeneity is downwardly biasing the
assessment of the negative effect of regulatory intensity on productivity. This could happen if –as
suggested in Table 8- regions with higher productivity are those that decide to regulate more intensively.
The IV estimations suggest that doubling the number of local norms translates in a decrease of
TFP growth rate of around 5.5%5. More significantly, now the coefficient on the number of pages of
regulation is statistically significant and its magnitude also suggests that an increase of 100% in the
number of pages is associated likewise to a decrease of around 5.5% in the regional TFP growth rate.
9. LINK BETWEEN PRODUCTIVITY-INNOVATION AND REGULATION.
In the previous sections we have documented a strong negative relation between regulation
intensity and regional productivity and innovation. In this section we explore potential explanations for
this negative association. Section 3 explained two main causal mechanisms to explain the association
between regulation and productivity: regulatory distortions in product market competition and generic
distortions in the optimal allocation of resources. In this section we explore both; first we investigate the
effect of regulatory intensity on the number of business establishments to observe whether regulation has
raised barriers to entry and consequently reduced product competition in the marketplace. Second, we
analyze the existence of regulation-driven changes in the regional size distribution of business
establishments. These changes in the size distribution would be consistent with regulatory intensity
affecting asymmetrically firms depending on its size.
For this purpose we compile information from the INE about the number of business
establishments in all industrial sectors per region. The INE freely offers a dataset called DIRCE
(Directorio Central de Empresas) with information on the number of business establishments per region
of 289 distinct industrial sectors. This information can be downloaded from the INE webpage.
Unfortunately this data is accessible only since 1999 and, therefore, we cannot replicate the same time
period as in our main analysis that starts in 1988. On the contrary, we are able to expand the analysis a
couple of additional years after 2004 and hence the time period of this additional test runs from 1999 to
2006. We run a fully fledged econometric specification quite similar to the one displayed above. This is,
5 =0.08*log(2)

IE Business School Working Paper WP10-04 15-07-2010
27
we run regressions in which the dependent variable is the natural log of the number of establishments, the
independent variables are our proxies of regulatory intensity and we control by 289 industry dummies, 17
regional dummies, six year dummies and regional GDP, population and public sector expenditure. The
results are displayed on Table 11.
------ Insert Table 11 around here---
In Table 11 we can see that all four variables of regulatory intensity have a negative sign but they
are not statistically different than zero under standard significance tests. From these results we cannot
conclude that regulatory intensity generically increases barriers to entry and hence restricts competition,
although this can certainly happen with some regulation in particular industries as we have shown in
Table 5.a with the number of large commercial outlets. Therefore, we conclude that we do not find
evidence supporting that the decrease in innovation and productivity levels is driven by decreased
competition caused by higher barriers to entry.
Next, we study whether regulation has affected the allocation of resources within the industry.
According to the arguments developed supra in the description of our analytical framework (section 3),
this could imply that regulation systematically affect in greater extent the more productive companies and
hence this could imply that resources are being transferred from the less productive to the more
productive units of production. If so, this should have an effect on the size distribution of establishments
as discussed in analytical section. We explore this potential effect of regional regulation on the size
distribution of companies using again information from DIRCE. DIRCE not only reports annual number
of business establishments per industry, region and year but also differentiates within these categories the
number of business establishments according to the number of employees they have. More particularly,
this dataset categorizes the number of business establishments per industry, region and year in 9
categories. These categories are displayed in Table 12.
------ Insert Table 12 around here---
Unfortunately DIRCE does not report the extent of sales or employees controlled by each business
establishment such that we could value the size distribution of establishments at the regional level that we
would need for our purposes. However, for this purpose we cross the information contained in the DIRCE
dataset with another dataset available, the so-called the Encuesta Industrial de Empresas (freely available
from the INE). This dataset reports number of people occupied per region-year in 12 industries. These 12

IE Business School Working Paper DE8-130-I 15-07-2010
28
sectors have an automatic equivalence with two digit CNAE industries and, therefore, for these 12 sectors
we can cross them with the DIRCE dataset without error. The only major drawback is that these 12
sectors are exclusively industrial sectors and, therefore, we are abstracting out from any distortionary
effect that regulatory intensity may have on services or agriculture. Moreover since the Encuesta
Industrial de Empresas reports total number of occupied people and not the total number of employees we
multiply the total number of occupied people in any given region-industry-year by the percentage of
occupied that are employees per region-year in the industrial sector. This percentage is extracted from the
dataset Contabilidad Regional (CRE, freely available also from the INE).
We compute the size distribution of establishments by assuming that the average establishment in
each bracket of working force has a number of employees equal to the lower bound of the bracket except
for the establishments within the bracket of 500 employees or more. For instance we assume that the
average establishment with 5 to 9 employees has 5 workers on its payroll. For those establishments with
500 employees or more we found the average number of workers such that the total number of employees
equals the total number of employees in the industry-region-year. The resulting average number of
employee per type of establishments is reported in the second column of Table 12. Note that the average
number of workers of those establishments with more than 500 employees is 2857.
We have also tried considering different average employees per establishment (other than the
lower bound) such that the middle point in the bracket (7 employees in our previous example) and the
upper bound of the bracket (9 employees in our previous example) but with this procedure we were
finding a significant number of industries-region-year in which total number of employees was superior
to the total number of people occupied and, since this would contradict reality, this is why we finally
chose the lower bound of the bracket. This solution certainly has some drawbacks since we are assuming
that the all establishments in the same bracket have the same number of employees. However we do not
believe this constitutes an important problem for our purposes because we are not interested in the
distribution per se but rather in how it is affected by changes in regulatory intensity. Thus, we do not see
any reasons why that would be correlated with this type of measurement error.
Graph 2 explores how the percentage of employees working for the largest establishments in the
DIRCE dataset has changed in 1999-2006 according to how much regional regulatory intensity increased
in the same period. Graph 2 shows how, apparently, those regions with the largest jump in the number of

IE Business School Working Paper DE8-130-I 15-07-2010
29
new norms are those in which there has been a largest decrease (or a lowest increase) in the percentage of
activity of the largest business establishments.
-------------Insert Graph 2 around here--------
Next we explore whether this alleged negative correlation holds in fully fledged econometric
models. For this goal we run panel data regressions for the period 1999-2006 with 1766 industry-region-
year observations in which the dependent variable is the percentage of employees working for the largest
establishments and the dependent variables are our proxies of regulatory intensities introducing control
variables for regional GDP, regional population, regional public expenditure, regional dummies, year
dummies and industry dummies. The results are displayed in Table 13.
------ Insert Table 13 around here---

IE Business School Working Paper DE8-130-I 15-07-2010
30
The estimates displayed in Table 13 show how the intuition we could extract from Graph 2 is
confirmed once we control by a myriad of factors. Both the number of regional norms and the number of
regional pages of regulation is associated negatively with the percentage of employees working for
establishments with at least 500 employees. Similarly, regulatory intensity is negative associated to the
proportion of employees working for establishments with 250 employees or more although in this latter
case this relation is only marginally significant for the number of norms.
The negative association between regulation intensity and the percentage of activity controlled by
large firms displayed in Table 13 and Graph 2 should have a negative effect on the skewness of the
regional size distribution of firms. Following Rossi-Hansberg & Wright (2007), we estimate how the
local size distribution of companies varies with regulation intensity. Following their methodology we first
compute a new variable Pikj that represents the proportion of establishments that in region i, industry k
have employment larger than nj. Note that given the limitations of DIRCE dataset we have only 9 possible
values for nj. Graph 3.a and Gpah 3.b represents how this probability distribution has varied in 1999-
2006 in those regions with the largest and lowest increase in regulatory intensity.
-------------Insert Graph 3a and 3b around here--------
Although in both groups we can see that the Pj of the largest type of establishments has decreased6,
it is clear comparing both graphs that the drop is largest for those regions with the largest increase in
regulatory intensity. This is consistent with the previous findings that regulation intensity has affected
relatively more the largest establishments. Once more we explore whether this intuitive finding holds in
detailed econometric specifications and following the methodology proposed by Rossi-Hansberg &
Wright (2007) we run the following regression:
log log (14)
Where, as before, represents probability in industry j in region i of having a business
establishment with more than nij employees; and aij and bij are industry-regional parameters. If regulatory
6 Note that since our largest size bin is those establishments with 500 employees or more the corresponding pj of
these establishments is 0 and therefore they are not graphed in Graphs 3a or 3b.

IE Business School Working Paper DE8-130-I 15-07-2010
31
intensity affects negatively the skewness of the size distribution we should expect that is negative.
Table 14 displays the estimates of for the two cross sections corresponding to the year 1999 and 2006
and also for the pooling regression of the eight years in the interval. In all specification estimates are
negative and significant confirming the finding of Table 14 that regulation intensity affects relatively
more the largest business establishments. Given that Giuri et al. (2007) shows how innovation is
concentrated in those companies with at least 250 employees these last results suggest that the drop in
innovation and productivity associated to larger levels of regulatory intensity can be explained by an
asymmetric effect of regulation that affects precisely the most innovative companies.
------ Insert Table 14 around here---
10. CONCLUSIONS.
In this paper we show how the process of decentralization in Spain has resulted in a wide
dispersion of the quantity of regulation in the different regions (Self Governing Communities). We make
use of this cross- sectional variation to estimate the effect of distinct paths of regulatory intensity on
regional productivity and innovation. We find that the total number of “regulatory pages” published and
the total number of norms each region has adopted has an important negative effect. Our estimates show
that an increase of 100% in the number of norms is associated with a decrease of 79-81% in the number
of regional patent applications and a lower TFP growth rate of around 3.5%. Given that the average TFP
growth rate during the period is -0.15% this estimates show that productivity slowdown in the Spanish
economy during the period could have been avoided if regional governments would had undertaken a
much lower regulatory activity. We do not find evidence supporting that this decrease in productivity is
caused by lower product market competition at the regional level. However we find some indication that
regulatory intensity affects firms asymmetrically and therefore distorts the optimal allocation of
resources. More regulation intensity affects negatively the proportion of resources controlled by business
establishments with 200 employees or more and this extra burden precisely to the more innovative
companies may explain the negative linkage between regulation and productivity.

IE Business School Working Paper DE8-130-I 15-07-2010
32
REFERENCES
Aghion, Philippe; Nick Bloom; Richard Blundell; Rachel Griffith & Peter Howitt (2005): «Competition and Innovation: An Inverted-U Relationship», The Quarterly Journal of Economics, 120(2): 701-728.
Alesina, Alberto; Silvia Ardagna; Giuseppe Nicoletti & Fabio Schiantarelli (2005): «Regulation and Investment», Journal of the European Economic Association, 3(4): 791-825.
Blanchard, Olivier & Francesco Giavazzi (2003): «Macroeconomic Effects of Regulation and Deregulation In Goods and Labor Markets», The Quarterly Journal of Economics, 118(3): 879-907.
Balmaseda Del Campo, Manuel (2004): «Instituciones, regulación y productividad», in Europa-Estados Unidos: flexibilidad, crecimiento y bienestar. Libro Marrón 2004, Círculo de Empresarios, Madrid, 27-44.
Balmaseda Del Campo, Manuel & Angel Melguizo Esteso (2006): «Mejor regulación, ni más ni menos», in Marco Regulatorio y Unidad de Mercado. Libro Marrón 2006, Círculo de Empresarios, Madrid, 15-35.
Barro, Robert J. & Xavier Sala-i-Martín (2002): Economic Growth, 2nd ed., The MIT Press, Cambridge (Mass.).
Christiansen, Gregory B. & Robert H. Haveman (1981): «Public regulations and the slowdown productivity growth», American Economic Review Papers & Proceedings, 71 (2): 320-325.
Conway, Paul; Véronique Janod & Giuseppe Nicoletti (2005): «Product Market Regulation in OECD Countries: 1998 to 2003», OECD Economic Department Working Papers nº 419, available at http://www.olis.oecd.org, visited 15.07.10)
Dawson, John. W. (2007): «Regulation and the Macroeconomy», Kyklos, 60(1): 15–36. Dawson, John W. & John J. Seater (2007): «The Macroeconomic Effects of Federal Regulation»,
Working Paper, Appalachian University, May (available at http://econ.appstate.edu/RePEc/pdf/wp0516.pdf, visited 15.07.10).
De los Llanos Matea, María & Juan S. Mora-Sanguinetti (2009): «Developments in Retail Trade Regulation in Spain and their Macroeconomic Implications», Banco de España, Documento de Trabajo nº 0908 (available at http://www.bde.es/informes/be/docs/dt0908e.pdf, visited 15.07.10).
Djankov, Simeon; Caralee McLiesh & Rita Mª Ramalho (2006): «Regulation and growth», Economics Letters, 92(3): 395-401.
Dufour, Charles; Paul Lanoie & Michael Patry (1998): «Regulation and productivity», Journal of Productivity Analysis, 9: 233-247.
Giori, Paula; Myriam Mariani; Stefano Brusoni; Gustavo Crespi; Dominique Francoz, Alfonso Gambardella; Walter Garcia-Fontes; Aldo Geunac, Raul Gonzales; Dietmar Harhoff; Karin Hois; Christian Le Bas; Alessandra Luzzi; Laura Magazzini; Lionel Nesta; Önder Nomaler; Neus Palomeras; Pari Patel; Marzia Romanelli; Bart Verspagen (2007): «Inventors and invention processes in Europe: Results from the PatVal-EU survey», Research Policy, 36 (8): 1105-1106.
Glaeser, Edward L.; Rafael La Porta; Florencio López-de-Silanes & Andrei Schleifer (2004): «Do Institutions Cause Growth? », Journal of Economic Growth, 9(3): 271-303.
Gollop, Frank M. & Mark J. Roberts (1983): «Environmental Regulations and Productivity Growth: The Case of Fossil-Fueled Electric Power Generation», Journal of Political Economy, 91/4: 654-674.
Gray, Wayne B. (1987): «The Cost of Regulation: OSHA, EPA and the Productivity Slowdown», American Economic Review, 77/6: 998-1006.
Gørgens, Tue; Martin Paldam & Alan Wurth (2003): «How does public regulation affect growth? », University of Aarhus Department of Economics Working Papers, nº 2003-14 (available at ftp://ftp.econ.au.dk/afn/wp/03/wp03_14.pdf, visited 15.05.10).
Griliches, Zvi (1990): «Patent statistics as economic indicators: a survey», Journal of Economic Literature, 28: 1661–1707.
Gual, Jordi; Sandra Jódar Rosell & Àlex Ruiz Posino (2006) «El problema de la productividad en España: ¿Cuál es el papel de la regulación?», Documentos de Economía “La Caixa” nº 1, june (available at http://www.pdf.lacaixa.comunicacions.com/de/esp/de01_esp.pdf, visited 15.07.10).
Hall, Robert D. & Charles I. Jones (1999): «Why Do Some Countries Produce so Much More Output per Worker Than Others?», The Quarterly Journal of Economics, 114(1): 83-116.
Hsieh, Chang-Tai & Peter J. Klenow (2009): «Misallocation and Manufacturing TFP in China and India», The Quarterly Journal of Economics, 124(4):1406-1448.
Hoffmaister, Alexander W. (2010): «Barriers to Retail Competition and Prices: Evidence from Spain», Oxford Economic Papers, 62(2): 395-416.

IE Business School Working Paper DE8-130-I 15-07-2010
33
Jalilian, Hossein; Colin Kirkpatrick & David Parker (2007): «The Impact of Regulation on Economic Growth in Developing Countries: A Cross-Country Analysis», World Development, 35(1): 87-103.
Jorgenson, Dale W. & Zvi Griliches (1967): «The explanation of Productivity Change», Review of Economic Studies, 34: 249-280.
Lele, Priya P. & Mathias M. Siems (2007): «Shareholder protection: A Leximetric Approach», The Journal of Corporate Law Studies, 7(1): 17-50.
Leonida, Leone & Daniel Montolio (2004): «On the determinants of convergence and divergence processes in Spain», Investigaciones Económicas, 28(1):89-121 (available at ftp://ftp.funep.es/InvEcon/paperArchive/Ene2004/v28i1a4.pdf, visited on 15.07.10).
López Laborda, Julio & Jaime Vallés Giménez (2006): «Factores Explicativos de la actividad reguladora de las Comunidades Autónomas (1989-2001)», IEF, Papeles de Trabajo 9/06 (available at www.ief.es/Publicaciones/PapelesDeTrabajo/pt2006_09.pdf, visited 15.07.10).
Loyaza, Norman V.; Ana Mª Oviedo & Luis Servén (2004): «Regulation and Macroeconomic Performance», World Bank WPS 3469, Sept. (available at http://ssrn.com/abstract=643682, visited 15.07.10).
Marcos, Francisco; Juan Santaló & Albert Sánchez Graells (2010): «Measuring Regulatory Intensity by the Spanish Regions (1978-2008)», WP-IE Business School.
Maudos, Joaquín; José. Manuel Pastor & Lorenzo Serrano (2000): «Crecimiento de la productividad y su descomposición en progreso técnico y cambio de eficiencia: una aplicación sectorial y regional de España (1964-1993)”, Investigaciones Económicas 24/1, 177-205 (available at ftp://ftp.funep.es/InvEcon/paperArchive/Ene2000/v24i1a6.pdf, visited 15.07.10).
Nickell, Stephen J. (1996) «Competition and Corporate Performance», Journal of Political Economy, 104(4): 724-746.
Nicoletti, Giuseppe (2001) «Regulation in Services: OECD Patterns and Economic Implications», OECD Economics Department Working Papers 287 (available at http://www.oecd-ilibrary.org/oecd/content/workingpaper/223766183220, visited 15.07.10).
Nicoletti, Giuseppe; Andrea Bassanini; Ekkehard Ernst; Sébastien Jean; Paulo Santiago & Paul Swaim (2001): «Product and Labour Markets Interactions in OECD Countries», OECD Economics Department Working Papers 312 (available at http://www.oecd-ilibrary.org/oecd/content/workingpaper/814240442882, visited 15.07.10).
Nicoletti, Giuseppe & Scarpetta, Stefano (2003): «Regulation, productivity and growth: OECD evidence», Economic Policy, 18(36): 9-72.
Prados de la Escosura, Leandro & Joan R. Rosés (2008): «Proximate causes of economic growth in Spain, 1850-2000», Working Papers in Economic History, 08-12, U. Carlos III, Departamento de Historia Económica e Institucione (available at http://e-archivo.uc3m.es/bitstream/10016/2735/5/wp-08-12.pdf, visited 15.07.10).
Oliner, Stephen D.; Daniel E. Sicher & Kevin J. Stiroh (2007): «Explaining a Productive Decade», Brooking Papers on Economic Activity, 38: 81-152.
Prior Jiménez, Diego (1990): «La productividad industrial de las Comunidades Autónomas», Investigaciones Económicas, 14/2: 257-267 (available at ftp://ftp.funep.es/InvEcon/paperArchive/ May1990/v14i2a5.pdf, visited 15.07.10).
Restuccia, Diego & Richard Rogerson (2008): «Policy Distortions and Aggregate Productivity with Heterogeneous Plants», Review of Economic Dynamics, 11 (4): 707-720.
Rosell Lastortras, Juan (2006): «La regulación: su cuantía y su coste», Actualidad Jurídica Uría Menéndez, 14: 7-12 (available at http://www.uria.com/esp/actualidad_juridica /n14/tribuna.pdf, visited 15.07.10).
Rosen, Sherwin (1982): «Authority, Control, and the Distribution of Earnings», Bell Journal of Economics, 13: 311-327,
Rossi-Hansberg, Esteban & Mark L. J. Wright. (2007): «Establishment Size Dynamics in the Aggregate Economy», American Economic Review, 97 (5): 1639-1666.
Siems, Mathias M. (2005): «Numerical Comparative Law: Do we need Statistical Evidence in Law in order to reduce complexity?», Cardozo Journal of International & Comparative Law, 13: 521-540.
Solow, Robert (1957): «Technical Change and the Aggregate Production Function», The Review of Economics and Statistics, 39:312-320.
Tribunal de Defensa de la Competencia (2003): Informe sobre las Condiciones de Competencia en el Sector de la Distribución Comercial (Report on the Competition conditions in the retrail trade sector) (available at http://www.cncompetencia.es, visited 15.07.10).

IE Business School Working Paper DE8-130-I 15-07-2010
34
Vallés Jiménez, Jaime (2005): « La reforma de la regulación en el contexto autonómico», Instituto de Estudios Fiscales-Papeles de Trabajo, 5/05 (available at ¡Error! Referencia de hipervínculo no válida., visited 15.07.10).
Vallés Jiménez, Jaime & Anabel Zárate Marco (2006): «Reflexiones en torno al debate del impacto económico de la regulación y los procesos institucionales para su reforma», Tribuna de Economía ICE, 829: 205-233 (available at http://www.revistasice.com/Estudios /Docu men/ice/829/ICE8290203.PDF, visited 15.07.10).
Zárate Marco, Anabel & Jaime Vallés Jiménez (2010): «The cost of regulation in a decentralized context: the case of the Spanish regions», European Journal of Law and Economics, forthcoming (available at http://springerlink.com/content/001t410807v240u2 /fulltext.pdf, visited 15.07.10).

IE Business School Working Paper DE8-130-I 15-07-2010
35
APPENDIX A
SUMMARY OF THE TRANSFER OF POWERS BETWEEN THE CENTRAL GOVERNMENT AND THE SELF-GOVERNING COMMUNITIES
Initial allocation
by Statute7 1978 1979 1980 1981 1982 1983 1984 1985 1986 1987 1988 1989 1990 1991 1992 1993 1994 1995
Andalucía 89 2 8 10 28 22 10 5 2 7 4 10Aragón 63 3 4 9 14 16 5 2 1 3 4 7 14P. Asturias 44 1 3 12 17 12 8 2 1 3 5 15Baleares 77 2 1 3 9 14 13 6 3 1 1 7 19Canarias 36 1 3 4 21 15 17 5 1 1 7 2 5 12Cantabria 43 16 19 9 6 3 Castilla-La Mancha 48 1 3 11 20 11 8 2 3 2 14Castilla & León 43 6 10 14 14 9 1 4 3 3 7 9Catalonia 89 5 2 13 21 12 11 7 8 3 5 6 1 5 4 6 10Extremadura 43 1 3 10 17 13 5 1 4 1 6 16Galicia 75 2 1 1 20 18 17 13 3 4 2 8 1 2 7 9La Rioja 32 15 9 8 1 2 2 8 3C. Madrid 35 4 19 13 3 6 1 6 12Murcia 42 1 2 11 18 13 7 2 2 2 1 2 7 19Navarra 90 16 16 1 3 4 País Vasco 89 2 1 15 19 6 2 21 7 9 C. Valenciana 81 3 1 3 14 21 14 19 4 5 6 2 7Total 1060 7 19 32 79 154 253 204 179 54 38 6 43 20 6 16 22 73 169
Source: Spanish Ministry of Regional Policyand own elaboration.
7 Not necessarily at the same time, or in the same year, but when the Self-governing Statute was approved.

IE Business School Working Paper DE8-130-I 15-07-2010
36
1996 1997 1998 1999 2000 2001 2002 2003 2004 2005 2006 2007 2008 2009 2010
Andalucía 1 3 3 1 11 8 3 5 8 1
Aragón 1 2 6 3 1 1 1 3 2 1 5
P. Asturias 11 4 1 6 1 2
Baleares 5 3 2 7 5 3 2 3 1
Canarias 8 7 2 2 2 3 1
Cantabria 25 6 3 2 9 2 3
Castilla-La Mancha 5 2 3 2 2 2
Castilla & León 7 4 5 3 2 2 3 1 3
Catalonia 2 8 8 4 4 6 2 1 8 1 6 6 5 3 2
Extremadura 3 5 4 2 2
Galicia 11 6 5 8 1 3 2 3 7
La Rioja 8 2 5 6 2 1 2
C. Madrid 6 2 3 6 1 1 6 3 1 Murcia 2 2 5 5 2 1 6
Navarra 10 7 2 1 País Vasco 6 2 1 2
C. Valenciana 7 3 4 6 5 1 1 2 1 1
Total 92 44 56 79 25 34 18 11 26 21 37 21 33 6 11 Source: Spanish Ministry of Regional Policy and own elaboration.

IE Business School Working Paper DE8-130-I 15-07-2010
37
TABLES Table 1: Average Growth accounting decomposition of Spanish regions (SGC), period 1988-2004. SGC TFP Growth rate GDP Growth Rate
(constant prices) Employment growth rate
Stock of Capital growth rate (constant prices)
Andalucía -0.58% 3.23% 2.92% 4.49% Aragón 0.14% 2.78% 1.55% 3.65% P. Asturias 0.36% 1.92% 0.25% 2.70% Baleares -1.40% 3.08% 3.17% 5.34% Canarias -1.18% 3.27% 4.00% 4.56% Cantabria 0.37% 3.06% 1.67% 3.66% Castilla & León 0.07% 2.22% 0.88% 3.16% Castilla-La-Mancha -0.05% 2.89% 1.84% 4.49% Catalonia 0.30% 3.11% 2.55% 3.19% Extremadura 0.61% 3.10% 1.52% 3.03% Galicia 0.43% 2.48% 0.29% 3.59% Madrid -0.27% 3.10% 3.19% 3.91% Murcia -0.69% 3.24% 2.93% 4.75% Navarra -0.73% 2.78% 2.19% 4.94% País Vasco -0.01% 2.57% 2.06% 3.22% Rioja 0.66% 3.72% 1.44% 4.27% Valencia -0.25% 3.03% 2.64% 3.74% Averagei -0.15% 2.92% 2.06% 3.92% This is the un-weighted average across all 17 SGC averages Table 2: Descriptive statistics. Mean Std Observations Number of pages (stock) 5,736 4,997 272 Number of pages per power (stock) 37.35 27.48 272 Number of Norms (stock) 2499 1952 272 Number of Norms per power (stock) 16.55 10.72 272 Number of powers (stock) 141.23 38.86 272 Regional GDPi 2583984 2366836 272 Regional expenditureii 27,500 30,334 272 Population 2,355,055 2,034,009 272 TFP growth rate (%) -0.15 2.16 272 Number of Large Commercial Outlets 25.16 26.69 189iii
Area of Large Commercial Outletsiv 437022 494774 189iii
Industrial designs 123.02 164.29 323 Patents 140.34 184.30 323 Trademarks 3533.62 4744.85 323 Industrial utilities 184.58 251.80 323 Trade names 274.74 313.86 323 iMillions of euros at constant prices of year 2000 iiThousands of euros at constant prices of year 1986 iiiThese observations correspond to the period 1996-2006 IV Square meters

IE Business School Working Paper DE8-130-I 15-07-2010
38
Table 3.a. : Number of pages of regulation as a function of number of public employees and public expenditure: 1990-2006.
All variables are in logs. All regressions include SGR and year dummies. Standard errors are reported among parenthesis. (***) represent significance levels of 0.01, (**) represents significance level of 0.05 while (*) represents significance levels of 0.10.
Number of pages of regulation (stock)
Number of pages over number of powers (stock)
Number of pages of regulation (stock)
Number of pages over number of powers (stock)
Constant 5.58***
(1.76) 1.75 (1.60)
2.79(1.91)
-0.34 (1.74)
Public employees 0.09***
(0.02) 0.10***
(0.01) ___ ___
%Public employees in population
___ ___ 3.12***
(1.01) 3.69***
(0.93)
Regional public expenditure
0.15***
(0.03) 0.04 (0.03)
___
% Regional public expenditure
___ ___ 1.86***
(0.22) 0.91***
(0.20)
Population 0.10 (0.11)
0.08 (0.10)
0.17(0.13)
0.18
(0.12) GDP -0.00
(0.01) -0.01 (0.01)
1.85***
(0.22) 0.90***
(0.20) R2 0.99 0.99 0.99 0.99 Observations 289 289 289 289

IE Business School Working Paper DE8-130-I 15-07-2010
39
Table 3.b: Number of norms of as a function of number of public employees and public expenditure: 1990-2006.
All regressions include SGC and year dummies. All variables are in logs. Standard errors are reported among parenthesis. (***) represent significance levels of 0.01, (**) represents significance level of 0.05 while (*) represents significance levels of 0.10 Table 4: Correlation coefficient of regulatory variables in 2003 with the index of restrictions in retail trade elaborated by the Spanish Competition authority in 2003. Number of pages
(stock) Number of pages by number of powers (stock)
Number of norms (stock)
Number of norms by number of powers (stock)
Number of Legal Barriers to Retail Distribution identified by Spain competition authorities
0.55** 0.53** 0.52** 0.42*
(***) represent significance levels of 0.01, (**) represents significance level of 0.05 while (*) represents significance levels of 0.10.
Number of norms (stock)
Number of norms (stock)
Number of norms over number of powers (stock)
Number of norms over number of powers (stock)
Constant 8.31***
(1.52) 6.57***
(1.62) 3.43***
(1.50) 4.48***
(1.41) Public employees 0.06***
(0.01) ___
___ 0.07***
(0.01) %Public employees in population
___ 1.28(0.86)
1.84**
(0.80) ___
Regional public expenditure
0.13***
(0.02) ___ ___ 0.01
(0.02)
% Regional public over GDP
___ 1.52***
(0.19) 0.57***
(0.17) ___
Population -0.08 (0.10)
-0.07(0.11)
-0.06(0.10)
-0.10
(0.09) GDP -0.01
(0.01) 1.50***
(0.19) 0.55***
(0.18) -0.02***
(0.00) R2 0.99 0.56 0.99 0.99 Observations 289 289 289 289

IE Business School Working Paper DE8-130-I 15-07-2010
40
Table 5.a. Number of large commercial outlets as a function of regulatory intensity: 1996-2006. All regressions include SGC and year dummies. All variables are in logs. Standard errors are reported among parenthesis. Standard errors are adjusted by heteroskedasticy and autocorrelation for all.
Observations belonging to the same SGC (***) represent significance levels of 0.01, (**) represents significance level of 0.05 while (*) represents significance levels of 0.10.
NUMBER OF HYPERMARKETS
Constant
28.96*
(15.62) 15.58(14.64)
14.07(16.28)
-1.22
(15.27) Number of pages of regulation (stock)
-1.74***
(0.60) ___ ___ ___
Average number of pages per power (stock)
___ -1.51**
(0.59) ___ ___
Number of Norms (stock)
___ ___ -2.44***
(0.80) ___
Number of Norms per power (stock)
___ ___ ___ -1.98***
(0.75)
Regional Public Expenditure
0.31
(0.27) 0.20(0.25)
0.32(0.25)
0.17
(0.23)
Population -0.94**
(0.44) -0.98**
(0.43) -0.97**
(0.48) -1.02**
(0.48) GDP 0.20
(0.98) 0.52(1.01)
1.48(1.01)
1.66*
(1.01) R2 0.98 0.98 0.98 0.98 Observations 187 187 187 187

IE Business School Working Paper DE8-130-I 15-07-2010
41
Table 5.b. Area of large commercial outlets as a function of regulatory intensity: 1996-2006.
Area is in square meters. All regressions include SGC and year dummies. All variables are in logs. Standard errors are reported among parenthesis. Standard errors are adjusted by heteroskedasticy and autocorrelation for al observations belonging to the same SGG (***) represent significance levels of 0.01, (**) represents significance level of 0.05 while (*) represents significance levels of 0.10.
AREA OF LARGE OUTLETS
Constant 62.64***
(19.33) 49.14***
(16.27) 44.55*
(23.62) 31.78**
(21.20) Number of pages of regulation (stock)
-1.78***
(0.62) ___ ___ ___
Average number of pages per power (stock)
___ -1.57**
(0.62) ___ ___
Number of Norms (stock)
___ ___ -2.05*
(1.17) ___
Number of Norms per power (stock)
___ ___ ___ -1.66*
(1.04)
Regional Public expenditure
0.39
(0.31) 0.28(0.29)
0.31(0.36)
0.19
(0.31)
Population -0.05 (0.61)
-0.10 (0.59)
0.00(0.90)
-0.04
(0.87) GDP -2.21
(1.26) -1.88*
(1.19) -1.01(1.71)
-0.85
(1.60) R2 0.97 0.97 0.97 0.97 Observations 187 187 187 187

IE Business School Working Paper DE8-130-I 15-07-2010
42
Table 6.a. Number of yearly patent applications as a function of regulatory intensity: 1990-2006
Dependent variable is number of patents solicited. Standard errors are among parenthesis. Standard errors are adjusted by heteroskedasticy and autocorrelation for al observations belonging to the same SGC. All variables are in logs. All regressions include SGC dummies and year dummies. (***) represent significance levels of 0.01, (**) represents significance level of 0.05 while (*) represents significance levels of 0.10.
NUMBER OF PATENT APPLICATIONS
Constant
0.95
(16.38) 0.37 (16.34)
3.59(15.76)
2.94
(15.35) Number of pages of regulation (stock)
-0.57***
(0.16) ___ ___ ___
Average number of pages per power (stock)
___ -0.55***
(0.23) ___ ___
Number of Norms (stock)
___ ___ -0.79***
(0.25) ___
Number of Norms per power (stock)
___ ___ ___ -0.81**
(0.38)
Regional Public Expenditure
0.25***
(0.10) 0.19***
(0.10) 0.25***
(0.09) 0.17*
(0.09)
Population 0.03 (0.75)
0.04 (0.74)
-0.33(0.70)
-0.32 (0.64)
GDP 0.48 (0.76)
0.35 (0.74)
0.75 (0.64)
0.58 (0.66)
R2 0.96 0.96 0.96 0.96 Observations 323 323 323 323

IE Business School Working Paper DE8-130-I 15-07-2010
43
Table 6.b. Number of yearly utility model applications (“petty patents”) as a function of the amount of regulation: 1990-2006.
Dependent variable is number of utilities solicited. Standard errors are among parenthesis. Standard errors are adjusted by heteroskedasticy and autocorrelation for al observations belonging to the same SGC. All variables are in logs. All regressions include SGC dummies and year dummies. (***) represent significance levels of 0.01, (**) represents significance level of 0.05 while (*) represents significance levels of 0.10.
NUMBER OF UTILITY MODEL APPLICATIONS
Constant -0.91
(17.32) -0.97(16.41)
3.44(14.31)
4.02
(12.46) Number of pages of regulation (stock)
-0.42*
(0.25) ___ ___ ___
Average number of pages per power (stock)
___ -0.57**
(0.28) ___ ___
Number of Norms (stock)
___ ___ -1.01***
(0.24) ___
Number of Norms per power (stock)
___ ___ ___ -1.33***
(0.32)
Regional Public Expenditure
0.40**
(0.16) 0.38***
(0.16) 0.48***
(0.16) 0.40***
(0.14)
Population -1.51
(1.09) -1.46(1.10)
-1.92**
(0.94) -1.99**
(0.86) GDP 1.90***
(1.18) 1.78***
(1.26) 2.28**
(1.00) 2.11**
(1.02) R2 0.96 0.96 0.96 0.97 Observations 323 323 323 323

IE Business School Working Paper DE8-130-I 15-07-2010
44
Table 6.c.: Number of yearly trademark applications as a function of the amount of regulation: 1990-2006.
Dependent variable is number of brands solicited. Standard errors are among parenthesis. Standard errors are adjusted by heteroskedasticy and autocorrelation for al observations belonging to the same SGC. All variables are in logs. All regressions include SGC dummies and year dummies. (***) represent significance levels of 0.01, (**) represents significance level of 0.05 while (*) represents significance levels of 0.10.
NUMBER OF TRADEMARK APPLICATIONS
Constant -7.41
(13.62) -7.65(13.61)
-4.56(11.41)
-5.02
(11.42) Number of pages of regulation (stock)
-0.18
(0.23) ___ ___ ___
Average number of pages per power (stock)
___ -0.16(0.26)
___ ___
Number of Norms (stock)
___ ___ -0.61***
(0.21) ___
Number of Norms per power (stock)
___ ___ ___ -0.63***
(0.27)
Regional Public Expenditure
0.20*
(0.10) 0.17*
(0.10) 0.26**
(0.10) 0.20**
(0.09)
Population -0.18 (0.74)
-0.17 (0.74)
-0.41(0.67)
-0.40
(0.67) GDP 1.18
(0.83) 1.14(0.86)
1.41**
(0.71) 1.28*
(0.73) R2 0.98 0.98 0.98 0.98 Observations 323 323 323 323

IE Business School Working Paper DE8-130-I 15-07-2010
45
Table 6.d. Yearly Trade names applications as a function of the amount of regulation: 1990-2006.
Dependent variable is number of industrial names solicited. Standard errors are among parenthesis. Standard errors are adjusted by heteroskedasticy and autocorrelation for al observations belonging to the same SGC. All variables are in logs. All regressions include SGC dummies and year dummies. (***) represent significance levels of 0.01, (**) represents significance level of 0.05 while (*) represents significance levels of 0.10
NUMBER OF TRADE NAME APPLICATIONS
Constant -1.49
(10.69) -2.32(11.68)
3.69(5.96)
2.03
(7.33) Number of pages of regulation (stock)
-0.53
(0.35) ___ ___ ___
Average number of pages per power (stock)
___ -0.38(0.37)
___ ___
Number of Norms (stock)
___ ___ -1.22***
(0.33) ___
Number of Norms per power (stock)
___ ___ ___ -1.11***
(0.40)
Regional Public Expenditure
0.29***
(0.09) 0.21**
(0.10) 0.38***
(0.09) 0.24**
(0.10)
Population -0.25 (1.01)
-0.27 (1.00)
-0.75(0.74)
-0.69*
(0.76) GDP 0.88
(1.13) 0.79 (1.16)
1.34(0.87)
1.04*
(0.90) R2 0.96 0.96 0.96 0.96 Observations 323 323 323 323

IE Business School Working Paper DE8-130-I 15-07-2010
46
Table 6.e. Yearly industrial design applications as a function of the amount of regulation: 1990-2006.
Dependent variable is number of industrial designs solicited. Standard errors are among parenthesis. Standard errors are adjusted by heteroskedasticy and autocorrelation for al observations belonging to the same SGC. All variables are in logs. All regressions include SGC dummies and year dummies. (***) represent significance levels of 0.01, (**) represents significance level of 0.05 while (*) represents significance levels of 0.10. Table 7: Average increase in annual Total Factor Productivity before the period under study (1980-1987) and during the period of study (1988-2004). Average annual increase in Total Factor Productivity Regions with high increase in
regulation in 1988-2004 Regions with low increase in regulation in 1988-2004
1980-1987 0.13% -0.19% 1988-2003 -0.03% 0.03% SGC with high/low increase in regulation are those with an increase in the number of pages per power assumed in the period 1988-2003 higher/lower than the median.
NUMBER OF INDUSTRIAL DESIGN APPLICATIONS
Constant -16.67
(32.86) -15.97(31.51)
-12.84(30.01)
-11.07
(27.55) Number of pages of regulation (stock)
0.11
(0.57) ___ ___ ___
Average number of pages per power (stock)
___ -0.17(0.53)
___ ___
Number of Norms (stock)
___ ___ -0.62(0.57)
___
Number of Norms per power (stock)
___ ___ ___ -1.13***
(0.69)
Regional Public Expenditure
0.25
(0.21) 0.31(0.20)
0.39**
(0.20) 0.37
(0.19)
Population -0.43 (1.34)
-0.37 (1.30)
-0.61(1.27)
-0.75
(1.18) GDP 1.61*
(1.37) 1.59(1.40)
1.86*
(1.10) 1.81*
(1.00) R2 0.92 0.92 0.92 0.92 Observations 323 323 323 323

IE Business School Working Paper DE8-130-I 15-07-2010
47
Table 8: Total Factor Productivity growth rate as a function of regulatory intensity: 1988-2004.
Dependent variable is TFP growth rate. Robust Standard errors are among parenthesis. All variables are in logs. All regressions include SGC dummies and year dummies. (***) represent significance levels of 0.01, (**) represents significance level of 0.05 while (*) represents significance levels of 0.10
TFP growth rate Constant -2.31***
(0.53) -2.34***
(0.55) -1.98***
(0.51) -2.08***
(0.46) Number of pages of regulation (stock)
-0.02*
(0.01) ___ ___ ___
Average number of pages per power (stock)
___ -0.01(0.01)
___ ___
Number of Norms (stock)
___ ___ -0.05**
(0.02) ___
Number of Norms per power (stock)
___ ___ ___ -0.04***
(0.02)
Regional Public Expenditure
0.01
(0.01) 0.00 (0.01)
0.01*
(0.01) 0.00 (0.01)
Population -0.06**
(0.04) -0.06**
(0.03) -0.09***
(0.03) -0.08***
(0.02) GDP 0.22***
(0.04) 0.21***
(0.04) 0.24***
(0.03) 0.22***
(0.03) R2 0.41 0.40 0.43 0.42 Observations 272 272 272 272

IE Business School Working Paper DE8-130-I 15-07-2010
48
Table 9. Different measures of productivity, innovation and competition as a function of lagged variables of regulatory intensity. TFP
regression Number of hypermarkets regression
Square meter of hypermarkets
Number of Brands
Number of patents
Lagged number of pages (stock)
-0.01 (0.01)
-1.73***
(0.27) -1.74***
(0.38) -0.13 (0.11)
-0.42**
(0.16)
Lagged number of pages per power (stock)
-0.00 (0.01)
-1.36***
(0.24) -1.51***
(0.33) -0.10 (0.11)
-0.40**
(0.17)
Lagged Number of Norms (stock)
-0.05***
(0.01) -2.28***
(0.28) -1.81***
(0.43) -0.64***
(0.12) -0.75***
(0.19)
Lagged Number of Norms per power (stock)
-0.05***
(0.01) -1.83***
(0.26) -1.65***
(0.38) -0.66***
(0.13) -0.78***
(0.20)
Standard errors are among parenthesis. All variables are in logs. All regressions include SGC dummies, year dummies and controls of GDP, Population and Local Public Expenditure. (***) represent significance levels of 0.01, (**) represents significance level of 0.05 while (*) represents significance levels of 0.10.

IE Business School Working Paper DE8-130-I 15-07-2010
49
Table 10: Total Factor Productivity growth rate as a function of regulatory intensity: 1988-2004. Instrumental Variable estimation.
Dependent variable is TFP growth rate. The Table shows the result of the second stage of a 2SIV estimation in which the instrument we use in the first stage is the number of powers assigned to a given SGC at a given point in time. All variables are in logs. Standard errors are among parenthesis. All regressions include SGC dummies and year dummies. (***) represent significance levels of 0.01, (**) represents significance level of 0.05 while (*) represents significance levels of 0.10. Table 11: Number of business establishments as a function of regulatory intensity. OLS Number of pages (logs) -0.1476
(0.0927) Average number of pages per power (logs)
-0.1936 (0.1225)
Number of Norms (logs) -0.1287 (0.1683)
Average Number of Norms per power (logs)
-0.1603 (0.1761)
Coefficients on the distinct measures of regulatory intensity in four distinct regression with 29,240 observations in which the dependent variable is log of the number of business establishments and the controls are 289 industry dummies, 17 regional dummies, six year dummies (the regression includes values from 1999 to 2006) and log of population, log of GDP and log of public expenditure. Standard errors are clustered by region.
TFP growth rate Constant -2.47***
(0.77) -1.97***
(0.73) Number of pages of regulation (stock)
-0.08**
(0.04) ___
Average number of pages per power (stock)
___ ___
Number of Norms (stock)
___ -0.08***
(0.03)
Number of Norms per power (stock)
___ ___
Regional Public Expenditure
0.02*
(0.01) 0.01(0.01)
Population -0.03
(0.05) -0.10**
(0.04) GDP 0.21***
(0.05) 0.25***
(0.05) R2 0.38 0.43 Observations 272 272

IE Business School Working Paper DE8-130-I 15-07-2010
50
Table 12: Size bins reported in dataset DIRCE.
Size bin of establishments reported by the DIRCE
Assumed average employee per establishment
No employees 0 1 or 2 employees 1 3 to 5 employees 3 6 to 9 employees 6 10 to 19 employees 10 20 to 49 employees 20 50 to 99 employees 50 100 to 199 employees 100 200 to 499 employees 200 500 or more employees 2857 Table 13: Percentage of activity accounted by large companies as a function of regulation intensity. Proportion of
employment accounted by companies with 500 or more employees
Proportion of employment accounted by companies with 200 or more employees
Number of pages -0.10**
(0.04) -0.08**
(0.04) Average Number of pages
-0.10**
(0.06) -0.10**
(0.04) Number of Norms -0.13**
(0.05) -0.06(0.04)
Average Number of Norms
-0.11**
(0.06) -0.08*
(0.05) Observations 1766 1766 All regressions include regional dummies, industry dummies and year dummies. Standard errors are clustered by regions. It includes regional observations of 12 industries from 1999 to 2006. Table 14: Estimation of Rossi-Hansberg-Wright (2007) regressions. Estimation of Pooling regression 1999-
2006 with year dummies Cross section regression year 1999
Cross section regression year 2006
Number of pages -0.0106***
(0.0031) -0.0490***
(0.0101) -0.0372**
(0.0144) Average Number of pages
-0.0087***
(0.0030) -0.0821***
(0.0129) -0.0470**
(0.0189) Number of Norms -0.0124***
(0.004) -0.0584***
(0.0106) -0.0405***
(0.0146) Average Number of Norms
-0.0096**
(0.0042) -0.0834***
(0.0129) -0.0480 (0.0184)
Number of observations 12502 1550 1576 Estimation of in the equation
log log Where represents probability in industry j in region i of having an establishment with more than nij
employees; and aij and bij are industry-regional parameter using a weighted least squares regression in which the weights are the inverse of the number of establishments in each region-industry for the last two columns. For the first column we use clustered standard errors by region.

IE Business School Working Paper DE8-130-I 15-07-2010
51
GRAPHS Graph 1: 1980-2003 evolution of TFP growth rate in Spanish SGC according to the increase in regulatory intensity in 1988-2003.
‐0,05
‐0,04
‐0,03
‐0,02
‐0,01
0
0,01
0,02
0,03
1981 1983 1985 1987 1989 1991 1993 1995 1997 1999 2001 2003
Highest regulation regions
Lowest regulation regions

IE Business School Working Paper DE8-130-I 15-07-2010
52
Graph 2: Increase in percentage of employees working for business establishments with 200 or more employees as a function of the % increase in the number of regional (SGC) norms (1999-2006).
ANDALUCIA
ARAGON
ASTURIASBALEARES
CANARIAS
CANTABRIA
CASTILLA &LEON
CASTILLA LA MANCHA
CATALONIA
EXTREMADURA
GALICIA
MADRID
MURCIA
NAVARRA
PAIS VASCO
RIOJA
VALENCIA
‐0,06
‐0,04
‐0,02
0
0,02
0,04
0,06
0,4 0,45 0,5 0,55 0,6 0,65 0,7 0,75 0,8 0,85
Chan
ge in
% of employees working for business estab
lishmens with 200 or more
employees
Increase in the Number of regional norms 1999‐2006

IE Business School Working Paper DE8-130-I 15-07-2010
53
Graph 3.a. Changes in the business establishment-size distribution in SGCs with the largest increase in the number of norms in 1999-2006.
‐6
‐5
‐4
‐3
‐2
‐1
0
0 1 2 3 4 5 6
log(Prob(Employm
ent>x))
Employment log scale
Size distribution 1999
Size Distribution 2006

IE Business School Working Paper DE8-130-I 15-07-2010
54
Graph 3.b. Changes in the business establishment-size distribution in SGCs with the lowest increase in the number of norms in 1999-2006.
‐7
‐6
‐5
‐4
‐3
‐2
‐1
0
0 1 2 3 4 5 6
Log (Prob(Employm
ent>x)
Employment log scale
Distribution 1999
Distribution 2006