regulation: from theory to practice - turin school of...
TRANSCRIPT

Regulation: from Theory to Practice
Carlo Cambini
Politecnico di Torino,
Florence School of Regulation, EUI
IEFE – Bocconi University, MIlan

References
Books
✜ “Regulatory Reform”, Armstrong, Cowan and Vickers, Mit Press,
1994.
✜ “A Theory of Incentives in Regulation and Procurement”, Laffont
J.J. and Tirole J., MIT Press, 1993.
✜ “Economics of Regulation and Antitrust”, Viscusi, Vernon and
Harrington, MIT Press, 2000.
Surveys:
✜ Armstrong, M. and D. Sappington (2006), “Regulation, Competition
and Liberalization”, Journal of Economic Literature, XLIV, 325-366.
✜ Guthrie, G. (2006), “Regulating Infrastructure: The Impact on Risk
and Investment”, Journal of Economic Literature, 44(4), 925-972.

Why regulate?
✤ Kinds of market failures:
✤ Market power (leading to inefficiently high prices):
✜ Economies of scale and scope
✜ Anticompetitive behaviour
✜ Network externalities
✜ Government limits to competition (e.g. patents)
✤ Externalities (leading to inappropriate prices)
✤ Information problems (maybe leading to market
breakdown): quality
✤ Typically, no need for intervention in competitive markets!!

Some aims of the Government
✤ Economic efficiency :
✜ “price equals marginal cost”
✜ take account of externalities
✜ Assure entry of most efficient firms (“productive efficiency”)
✜ “dynamic efficiency”
✤ Re-distributional concerns
✜ between consumers and shareholders
✜ between poor and rich consumers
✤ Usually, trade off between efficient purposes!!
✤ Get re-elected
✤ Do what lobby groups pay them to do (regulatory capture)

Rate of return regulation
✤ The method consists in define a limit level to the rate of
retun on investments.
✤ Using accounting terms, the rate of return is given by the
fraction between net profits and investment level (i.e. the
stock of capital, net of depreciation)
✤ In a monoproduct setting, R is total reveneus, k is capital
factor, l is the labour factor, and r and w the unit cost of
input factors, we have:
k
wlRROR

Rate of return regulation
✤ Empirically, the regulator sets the Total Revenues of the
firm (TR) as:
TR = * k + VC
✤ Where VC = variable costs
✤ Then, indicating with Q the total quantities of the
goods/services (minutes, kWh …)
P = TR / Q
✤ Hearing process: when the ex post rate of return is higher
than , regulator reduces prices; if it is lower than ,
regulator increases prices.

Rate of return regulation
✤ Pros of ROR: ✜ Financial integrity of regulated firm is always guaranteed;
✜ Monitoring of profits
✜ No incentive to reduce service quality
✤ Cons of ROR: ✜ No incentive to reduce costs (no productive efficiency)
cost plus mechanism
✜ Incentive to overinvest (inefficiently) if > r (Averch – Johnson effect)
✜ Risk of accounting manipulation
✜ Information demanded method and so high administrative costs

Incentive Regulation
✤“Incentive regulation” refers to alternative regulations
which aim at providing incentives for efficiency
✤Examples of incentive regulation:
✜Banded rate of return regulation
✜Earnings sharing
✜Revenue sharing
✜Price freezes
✜Rate case moratoriums
✜Price caps

Earnings Sharing Regulation
✤Similar to banded rate of return, but allows but explicit sharing
of realized earnings between the regulated firm and
consumers
✤ For instance,
✜ the target rate of return is 12 percent
✜ the firm can keep all earnings between 10 and 14 percent
✜ 50% of earnings between 14 and 16 percent
✜ 0% of earnings in excess of 16 percent
✤Employed for intrastate telecommunications in California and
New Jersey in the 1990s
✤ In particular as a component of initial price cap plans

Revenue Sharing Regulation
✤Requires the regulated firm to share its revenues
with consumers over a pre-defined threshold
✤Implemented for telecoms in Oregon in the US
between 1992 and 1996.
✤More recently, implemented in many Electric
regulators in Europe

Price cap regulation
✤ Regulator defines, for a certain period of time, a limit to the
growth of price(s) of a (single or a weight average) set of
goods or services:
Pt = (1 + RPIt - X) Pt-1
✤ RPIt = retail price index
✤ X = (estimated) growth in productivity reduction that
regulator wants to pass to consumers

Price Cap regulation
✤ The regulator should define the X factor and, in a
multiproduct setting how to evaluate the average level
of price (i.e. the weight to apply to every services).
✤ Given the general rule, the regulated firm is free to set
single prices with respect only to the imposed contraint
on their average level
✤ In addition, regulator sets the time period in which the
constraint is valid (regulatory lag). In Italy it lasts
(almost) three years.

Setting the Initial Prices
✤ If the price ceilings are set too high, too little of the surplus is
transferred to the consumers
✤ If they are set too low, the regulated firm might not break even
✜Might entail difficulties to attract capital
✜ Deterioration of quality of service, etc.
✤ Look at the past!
✤ If strong uncertainties…
✜ Safe level = (inefficiently) high level
✤Method to set initial prices important for future services that
might enter the basket

Setting the X Factor ✤Same problem than for initial prices: ✜ If X set too low: too much profit for the regulated firm
✜ If set too high: risk of financial distress
✤General principle ✜ In a competitive economy, firms pass on to customers the
cost increases (due to higher input prices), but also the cost decreases (due to increases in productivity)
✜ Therefore, the prices rise at a rate equal to the to the difference between the rate at which input prices rise and the rate at which productivity increases
✜ If in the regulated industry, same input price growth than elsewhere in the economy, and same productivity growth, then X=0.

Setting the X Factor: In Practice
✤Using historic growth rates to predict future growth rates
✜ Adjustment might need to be made if in the past low
incentives for cost reduction (e.g., due to ROR regulation)
✜ etc.
✤ In some countries, the data might not be available
✜ Using historical changes in the prices of regulated services
✜ Benchmarking with other countries
✤Whatever the method, the regulator may also base the X on
projections of future revenues and costs (in a manner similar
to ROR regulation)

Trends in Incentive Regulation in US Telecoms Year ROR
regulation
Rate case
mor.
Earnings
shrg.
PC regulation Other
1985 50 0 0 0 0
1986 45 5 0 0 0
1987 36 10 3 0 1
1988 35 10 4 0 1
1989 29 10 8 0 3
1990 23 9 14 1 3
1991 19 8 19 1 3
1992 18 6 20 3 3
1993 17 5 22 3 3
1994 20 2 19 6 3
1995 18 3 17 9 3
1996 14 4 5 24 3
1997 12 4 4 28 2
1998 13 3 2 30 2
1999 11 1 1 36 2
2000 7 1 1 40 2
Source: Sappington (2002).

Advantages of Price Cap
✤Incentives for cost-minimization
✜ Link between prices and costs severed
✤No input bias (A-J effect)
✜No connection between profit and rate base
✤Smaller administrative costs
✤However,
✜ In practice, cost and profit monitoring during reviews =>
some of the distortions associated to ROR regulation can
appear

Potential Drawbacks ✤ Prices may diverge significantly from realized costs
✜ May reduce allocative efficiency and welfare
✜ Problem more pronounced when
• There is considerable variation in possible costs
• Regulator values consumer surplus sufficiently more than profit
• Positive production levels are always desirable ✜ ROR regulation can outperform price cap when these three effects
prevail
✤ Risk shifts to the regulated firm => higher cost of capital
✤ Strong incentives to reduce costs… can imply strong incentives to reduce quality
✜ Reducing repair and customer assistance, etc.
✜ Postponing innovations in quality
✜ => service quality regulation

Potential Drawbacks
✤Price flexibility to the firm
✜ It can undo some cross-subsidies that the regulator wanted
to set. For instance, choose not to serve high-cost or low
willingness to pay consumers
✜ Incentives for predatory pricing may persist if both
competitive and regulated services are subject to the same
price cap
✤ The regulator is not obliged rates of return, and hence has
greater discretion; increases risk of capture
✤ Implementation can be complex
✜ Uncertainties about cost variations

Rate-of-Return versus Price-Caps
Rate of Return Price Cap
Prevent exercice of market
power
Yes Yes
Productive efficiency No Yes
Allocative efficiency No Yes
Dynamic efficiency No Yes
Ensures high quality of
service
Yes No

Empirical evidence on Price Caps
✤ Mathios and Rogers (1989) examined AT&T’s long-distance
prices and found that most prices were significantly lower in states
that allowed pricing flexibility than in states that used rate-of-
return regulation. They used a simple dummy variable technique
to capture PCR, and of course this evidence does not prove that
PCR caused prices to be lower.
✤ Alexander et al. (1996) examine the evidence on the cost of
capital for regulated industries and find that, as expected, firms
facing incentive regulation have higher systematic risk than firms
subject to rate-of-return regulation.
✤ Resende (2000) applies a combination of data envelopment
analysis (DEA) and econometric techniques to US local telephony
and finds that incentive regulation (including PC) is associated
with greater productive efficiency than rate-of-return regulation.

Price Cap regulation
✤ Empirical evidence on PC (Sappington, 2003)
using data from US Telecommunications Industry:
✜ Incentive to renew some type of equipments (digital
commutator, digital transmission) but not to increase
aggregate investment
✜ Incentive to increase total factor productivity
✜ Decrease in retail prices … but not consistently
✜ Increase in net profits … even if no clear evidence for
reductions in operative costs
✜ No clear incentive to reduce services’ quality

Incentive regulation in Energy Sectors
✤ Incentive regulation increases productivity and service quality in UK electric regional distribution (Jamasb and Pollitt 2007; Domah and Pollit, 2004; Newbery and Pollit, 1998)
✤ Quality impact is ambiguous: Not negative impact of incentive regulation in quality provision in Norway (Growitsch et al. 2010); negative effect of IR on quality in the US (Ter Martirosyan and Kwoka, 2010) without MQS.
✤ Incentive regulation increases labour productivity in electric distribution in developing countries (Pollit, 2004; Rudnik and Zolezzi, 2001)
✤ Incentive regulation increases firms’ investments, but only in cost-reducing activities (Cambini and Rondi, 2010).
✤ Surveys on IR in Energy: Joskow 2008, Vogelsang 2006

Yardstick Competition (Shleifer, 1985 BJEcon)
✤ Presence of multiple local monopolies.
✤ Intuition: using information of other to regulate a firm
✤ Also known as benchmarking (parametric and non
parametric methods)
✤ Critics: a) different firms and heterogeneity; b) potential
collusion among regulated firms; c) not credible treat from
regulator
ij
jii cn
cp1
1

Regulation and investment
✤ The literature suggests that regulatory policies affect utilities’ investment decisions differently, depending on which type of investment – in cost reducing or infrastructure - the firm undertakes (Armstrong and Sappington, 2006).
✤ In contrast, if firm’s allowed revenues do not depend on realized cost savings (like in a price- or revenue- cap mechanism), the incentive to invest in cost reducing activities is predicted to be more pronounced (Cabral and Riordan, 1989)
✤ A complicating factor, however, is that incentives work differently for infrastructure and for cost reducing investment.
✜ Rate of return regulation is thought to provide strong incentives for developing new infrastructure since the rate of return on the asset base is guaranteed and the risk faced by the firm considerably reduced.
✜ Price cap mechanism may weaken the incentive to invest in infrastructure, especially when the regulatory lags are shorter than the life of the assets, due to regulatory opportunism (Guthrie, 2006)

An Application
Interplay between regulation and innovation in the
Electricity Industry

New Incentives Scheme for Innovation &
Investment ✤ The rapid change in generation capacity towards a massive adoption of
renewable resources, together with the launch of technological
innovation in the electricity distribution networks – smart grid projects –
has prompted a lively debate in Europe on how incentive regulation in
electricity distribution should evolve.
✤ Price caps focused almost exclusively on the use of inputs – operational
and capital expenditures.
✤ Need of incentives that focus on outputs measures of companies’
performance – measures of network reliability, environmental impact,
customer satisfaction, ability to meet social obligations, etc..
New Incentives Scheme for Innovation &
Investment
✤ The best-known example in this regard is the new regulatory
scheme recently adopted by Ofgem, the Revenue, Innovation,
Incentives and Output (RIIO) model (Ofgem, 2010).
✤ The Italian Regulatory Authority is also planning to address
the challenge of delivering smarter networks by means of
regulating output measures of technological innovation and
other regulatory agencies, for instance the Australian energy
regulator, are taking similar decisions as well (AEEG, 2011a;
ACCC/AER, 2012).

Grid Evolution
29
Problems created by RES
• Forecast of energy produced because strongly affected by the wheater;
• Dispersed generation;
• Bi-directionality of the grid;
• Traditional energy generators produce at fixed power and cannot be stopped.
• “Sunny Summer Sundays” when the curtailment risk is higher.

Regulatory Frameworks in Europe
30

Smart Grid Projects (2012)
31
• R&D projects;
• Demonstration projects;
• Deployment projects.
80% of the projects have received some
form of public funding:
• Regulatory funding;
• European funding;
• National funding.
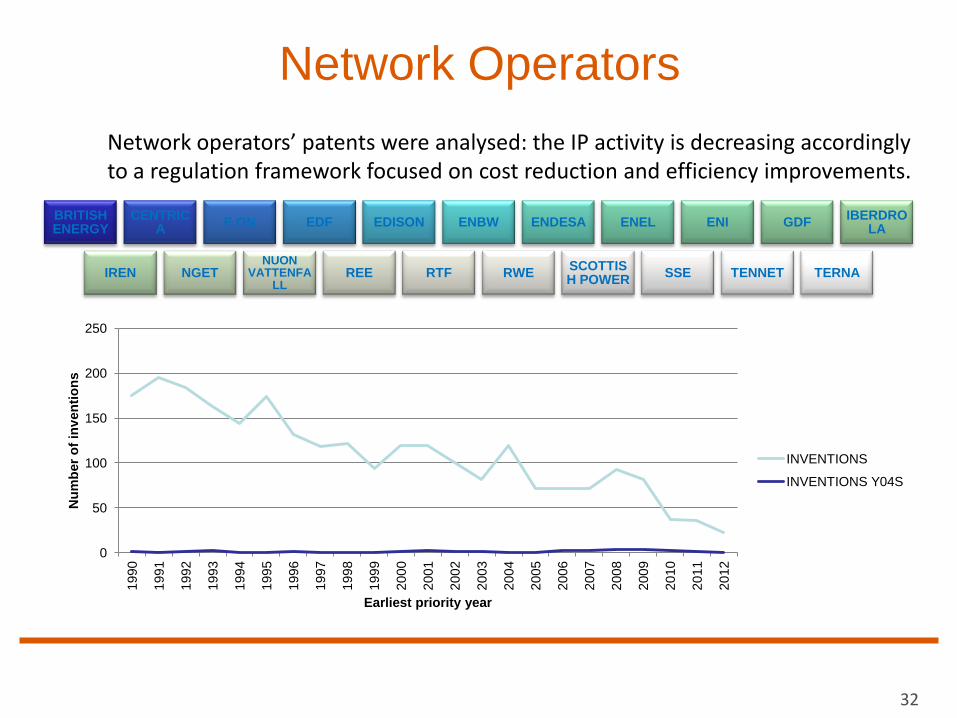
Network Operators
Network operators’ patents were analysed: the IP activity is decreasing accordingly to a regulation framework focused on cost reduction and efficiency improvements.
32
BRITISH ENERGY
CENTRICA
E.ON EDF EDISON ENBW ENDESA ENEL ENI GDF IBERDRO
LA
IREN NGET NUON
VATTENFALL
REE RTF RWE SCOTTISH POWER
SSE TENNET TERNA
0
50
100
150
200
250
1990
1991
1992
1993
1994
1995
1996
1997
1998
1999
2000
2001
2002
2003
2004
2005
2006
2007
2008
2009
2010
2011
2012
Nu
mb
er
of
inv
en
tio
ns
Earliest priority year
INVENTIONS
INVENTIONS Y04S

Market Players
33
% APPLICATION ABB
SCHNEIDER
SIEMENS
ITRON
TOSHIBA
LG
PANASONIC
MITSUBISHI
HITACHI
EATON
TOYOTA
IBM
HONDA
ELSTER
SILVER SPRING
SCHWEITZER
BOSCH
KEPCO
EDF
POS. Patents % Cumul%
1 ABB 513 7,4% 7,4%
2 SCHNEIDER 491 7,1% 14,5%
3 SIEMENS 295 4,3% 18,8%
4 ITRON 173 2,5% 21,3%
5 TOSHIBA 159 2,3% 23,6%
6 LG 156 2,3% 25,9%
7 PANASONIC 149 2,2% 28,0%
8 MITSUBISHI 131 1,9% 29,9%
9 HITACHI 128 1,9% 31,8%
10 EATON 96 1,4% 33,2%
11 TOYOTA 84 1,2% 34,4%
12 IBM 75 1,1% 35,5%
13 HONDA 64 0,9% 36,4%
14 ELSTER 48 0,7% 37,1%
15 SILVER SPRING 45 0,7% 37,7%
16 SCHWEITZER 35 0,5% 38,3%
17 BOSCH 32 0,5% 38,7%
18 KEPCO 32 0,5% 39,2%
19 EDF 30 0,4% 39,6%
20 ACCENTURE 27 0,4% 40,0%
21 ENEL 17 0,2% 40,2%
22 SONY 16 0,2% 40,5%
23 PEUGEOT 14 0,2% 40,7%
24 SAMSUNG 13 0,2% 40,9%
25 MOTOROLA 8 0,1% 41,0%
26 GE 6 0,1% 41,1%
27 BOSCH & SIEMENS 3 0,0% 41,1%
28 GOOGLE 3 0,0% 41,2%
OTHERS 58,8% 100,0%
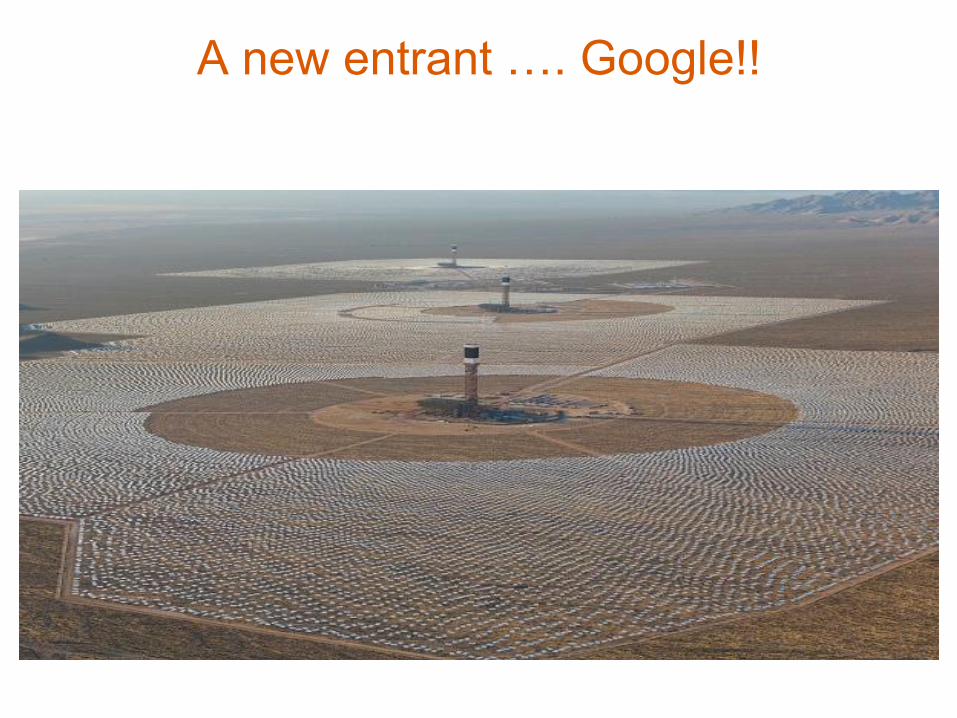
A new entrant …. Google!!
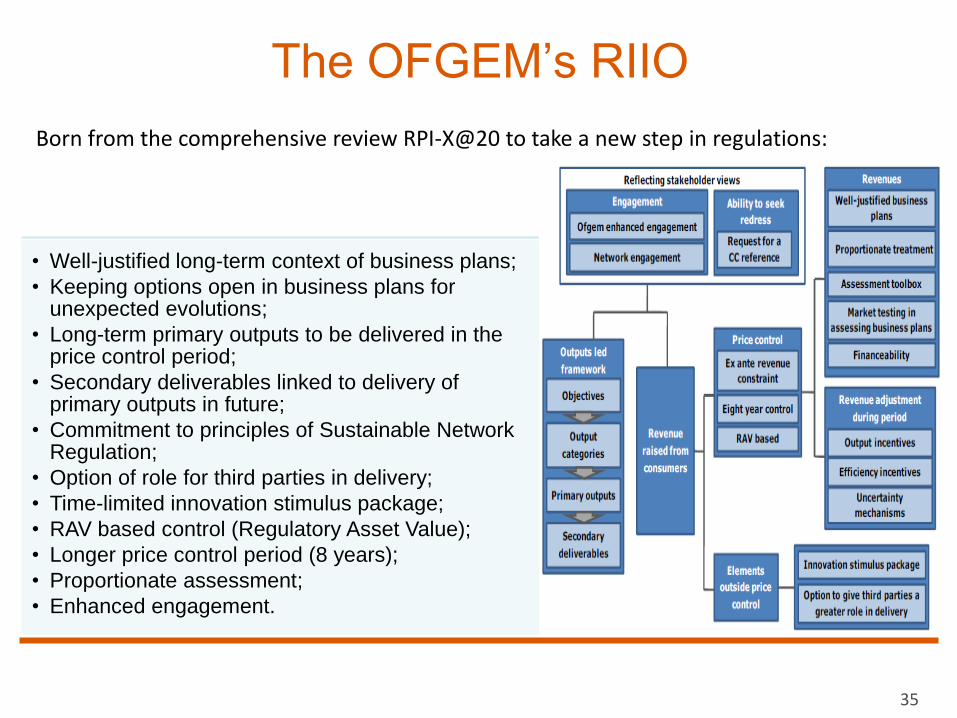
• Well-justified long-term context of business plans;
• Keeping options open in business plans for unexpected evolutions;
• Long-term primary outputs to be delivered in the price control period;
• Secondary deliverables linked to delivery of primary outputs in future;
• Commitment to principles of Sustainable Network Regulation;
• Option of role for third parties in delivery;
• Time-limited innovation stimulus package;
• RAV based control (Regulatory Asset Value);
• Longer price control period (8 years);
• Proportionate assessment;
• Enhanced engagement.
The OFGEM’s RIIO
35
Born from the comprehensive review RPI-X@20 to take a new step in regulations:
An application of Quality Regulation:
the Electricity in Italy
✤ In 2009 Italy had 135 Distribution Network Operators (DNO)
✤Total energy delivered was almost 280 TWh
✤Enel Distribuzione was responsible for 86.2% of distributed energy
✜A2A Reti Elettriche (4.1%), ACEA Distribuzione (3.6%); other DNO
less than 1% of distributed energy
✤Enel is present in all regions of Italy and it is organized in 115 Zones
(11 Territorial Units and 4 macro Areas)
✤DNOs are regulated by the Italian Regulatory Authority for Electricity
and Gas (Autorità per l’energia elettrica e il gas – AEEG)
36

✤Electricity distribution tariff is unique across Italy
✤It is composed of several building blocks:
✜Hybrid incentive mechanism: price cap on opex + WACC on
capex
✜ input-based elements (+2% WACC for 8-12 years)
• Innovation (also smart grid demostration projects)
✜output-based quality-specific incentives
• SAIDI (since 2000) and SAIFI+MAIFI (since 2008)
✤Now in the fourth tariff period (2012-15)
37

Aims of Quality Regulation
✜Italian regulator is keen on considering a more unified approach to tariff schemes, based to a greater extent on output regulation
• [AEEG Consultation Document n. 34/11; Benedettini et al., 2011; Lo Schiavo et al., 2013]
✜Recent regulatory schemes (f.i., Ofgem RIIO model) include additional output measures that focus on sustainability and innovation
• [Baucknecht, 2011; Muller, 2011; Meeus et al., 2011]
38

The mechanism
✤Reward and penalty scheme for quality, introduced in 2000
✤Average duration of interruptions per consumer – SAIDI - for long (longer than 3 minutes), unplanned interruptions (net of exclusions for Force Majeure)
✤SAIDI is measured separately in more than 300 territorial districts (homogeneous population density)
✤Yearly values of Q are calculated, ex post, on the basis of companies’ performances
✤SAIFI and MAIFI indicators regulated from in 2008
39
pt pt 1 (1 RPI X Q)

The regulatory framework
✤Distribution tariff is adjusted yearly on the basis of quality
performance ✜ Tariff increases when rewards earned by all districts in the country are greater than total penalties paid
and vice versa
✤Target-SAIDI ✜ Convergence in performance of all districts with equal population density to the same quality level (the
national standard) in the medium term (12 years)
✜ National standard defined for 3 levels of density: better continuity is expected in more densely populated
areas
40
t 0 1 2 3 4 … … … 12
Qt [SAIDI]
National
standardk
Penalties and rewards WTP of residential and non-
residential customers
Rewards (and penalties) are
larger for districts that are
more distant from the
national standards

Dataset
✤Dataset built the support of AEEG (dedicated data collection)
✤Comprehensive and balanced panel for 115 Zones of Enel
Distribuzione, tracked from 2004 to 2009
✤For each Zone and year: technical and accounting data, quality-related
data, including rewards and penalties
✤Technical data
✜Number of LV consumers
✜Energy consumption for LV residential load, LV non-residential load and MV load (in MWh)
✜Area served (in km2)
✜Transformer capacities of primary and secondary substations (in MVA)
✜Network length for LV and MV feeders (in km)
41

Dataset
✤Accounting data (in €) ✜ Revenues from tariffs and new connections
✜ Gross asset value and depreciation for primary and secondary substations, MV and LV feeders and points of connections
✜ Operating costs for labor, services, materials and other costs
✤Quality data (per district) ✜ Number of long and short interruptions (cause and origin)
✜ Duration of long interruption (cause and origin)
✜ Rewards and penalties (RP)
42

The mechanism
43
AVERAGE EXTRA-PRICE FOR CUSTOMERS
3 €/CUSTOMER/YEAR (2000-2003)
4 €/CUSTOMER/YEAR (2004-2007)

The regulatory setting 44
Regulated SAIDI
Number of districts per region
that have already reached long
term objectives

The effect of incentive mechanism
45

Policy options for quality
✤Rewards preferentially assigned to better performers in 2004
✤Rewards preferentially assigned to Cost-efficient Zones
✤Regulatory incentives for quality were never meant as a compensation
for quality-related expenditures
✤Policy option (1)
✜Support quality improvements (where difficult to achieve) rather than
reward good performance
✜AEEG Regulatory Order n. ARG/elt 198/11: since January 2012
rewards to high performing districts have been significantly reduced,
while those to underperforming ones can increase if significant
improvements in SAIDI are achieved
46

Policy options for quality
✤Policy option (2) ✜Current national standards account for network density, but they
disregard the composition of the load
✜Redefined in terms of costs of ENS, convergence might not require
the same level of expenditures, by reducing the need to spend in
areas where the composition of the load does not justify the
expenses
47

Financial issues in Regulation
✤ Financial issues in Price Cap regulation:
✤ It is true that in price cap regulation Regulator
does not directly set a return on investment
…. But it has to do that almost indirectly in
order to correctly take into account the cost of
capital when evaluating a policy intervention.

Financial issue in Price Cap regulation
Setting a price cap (X) in a monopolistic market:
Financial issues in Price Cap regulation
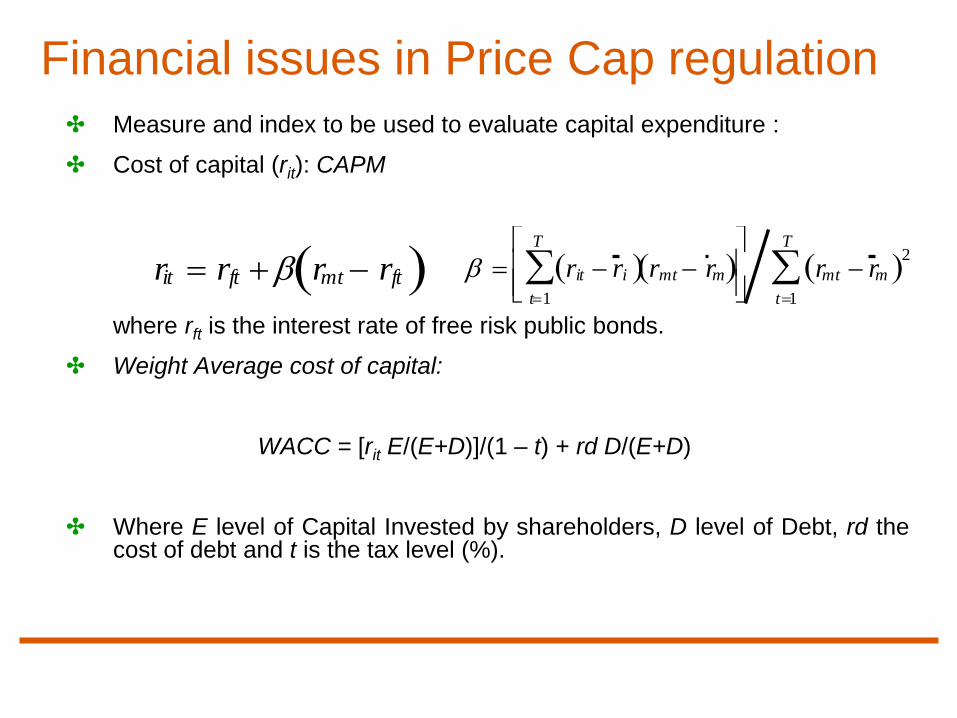
✤ Measure and index to be used to evaluate capital expenditure :
✤ Cost of capital (rit): CAPM
where rft is the interest rate of free risk public bonds.
✤ Weight Average cost of capital:
WACC = [rit E/(E+D)]/(1 – t) + rd D/(E+D)
✤ Where E level of Capital Invested by shareholders, D level of Debt, rd the cost of debt and t is the tax level (%).
rit rft rmt rft
rit r i rmt r m t1
T
rmt r m 2
t1
T

Example: the WACC in italian telecoms
✤ Free interest rate, rf = 5% equal to average rate of BTP (public
bonds from 10 to 30 years);
✤ Market premium equal to 4%
✤ Risk coefficient = 1,05.
✤ Thus, rt = rf + (rm – rf) = 9,2%.
✤ Cost of Debt, rd = 5,35%, tax level t = 41%, E = 80%, D = 20%:
✤ WACC = [rit E/(E+D)]/(1 – t) + rd D/(E+D) = 13,5
fm rr
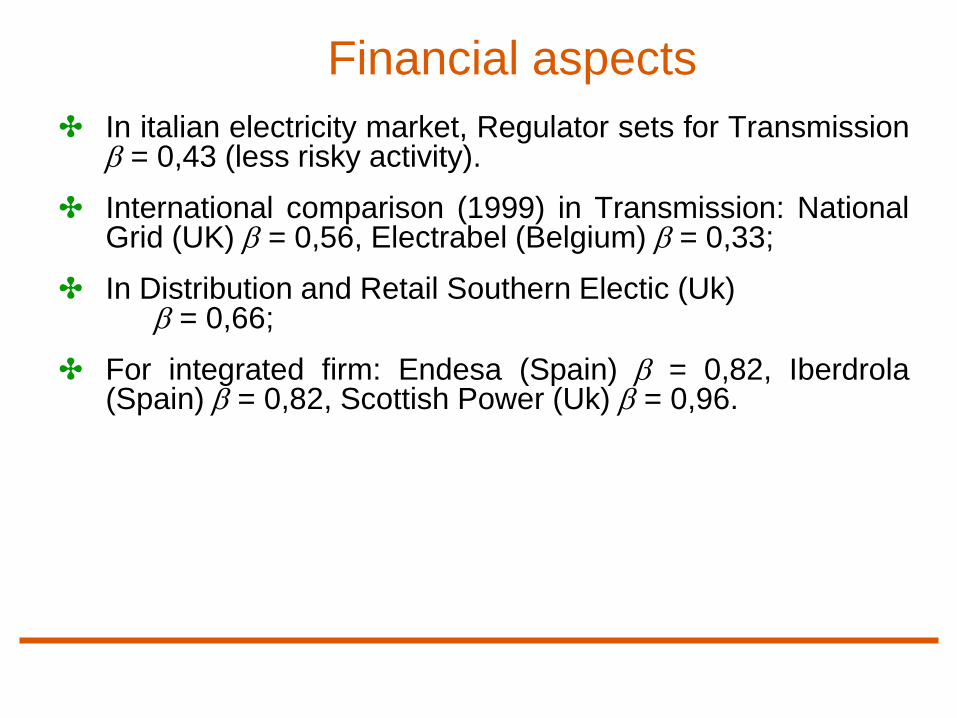
Financial aspects
✤ In italian electricity market, Regulator sets for Transmission = 0,43 (less risky activity).
✤ International comparison (1999) in Transmission: National Grid (UK) = 0,56, Electrabel (Belgium) = 0,33;
✤ In Distribution and Retail Southern Electic (Uk) = 0,66;
✤ For integrated firm: Endesa (Spain) = 0,82, Iberdrola (Spain) = 0,82, Scottish Power (Uk) = 0,96.

53
The “Dash for Debt”
✤ Ten years after the beginning of privatization and liberalization in network industries in Europe, regulated utilities have substantially increased their financial leverage
✤ In the U.K., DTI and HM Treasury (2004) have expressed a concern about the “dash for debt” “flight of equity” within the U.K. utilities sector from the mid-late 1990’s
✤ They argue that high leverage “could imply greater risks of financial distress, transferring risk to consumers and taxpayers and threatening the future financeability of investment requirements”

54
The “Dash for debt”
Leverage in selected EU Utilities
0.00
0.05
0.10
0.15
0.20
0.25
0.30
0.35
0.40
0.45
0.50
0.55
0.60
0.65
0.70
0.75
0.80
19
94
19
95
19
96
19
97
19
98
19
99
20
00
20
01
20
02
20
03
20
04
20
05
De
bt r
atio
EU average Telefonica de Espana National Grid Group PLC EDF

55
The relevance of capital structure for regulated
firms
✤ In the U.S., regulated rates are set so as to ensure the firm a “fair” rate of return on its capital
✤ In Europe, regulators often use RPI-X regulation, that ensure that the firm will earn a return on its capital which will induce it to enhance and maintain its network
The determination of regulated rates depends to a large extent on the firm’s capital structure
By properly choosing its capital structure, a regulated firm can affect its rates and hence its profitability

56
Europe and the U.S.
✤ It is well-documented that U.S. regulated utilities (which were always private and subject to rate regulation by state and by federal commissions since the 1910’s) are highly leveraged (Bowen, Daly and Huber (FM, 1982), Bradley, Jarrell, and Kim (JF, 1984) and Barclay, Marx, and Smith (JCF, 2003))
✤ The European situation is different because: ✜ Private ownership and control of utilities is still the exception rather than the rule
(Bortolotti and Faccio, 2008 RFE)
✜ The degree of liberalization varies considerably across countries, and is still
incomplete in most sectors
✜ Not all European utilities are regulated by an independent regulatory agency
(IRA): in some sectors regulation is performed directly by ministries, governmental committees, or local governments

57
A Strategic Explanation of Leverage 1/2
✤ In Public Utilities, regulatory choices (and political stance) change over time
✤ Typical problems are regulators’ lack of committment leading to firms’ underinvestment (Armstrong and Sappington, 2006 JEL; Guthrie, 2006 JEL)
✤ To provide investment incentives, regulators choose the “fair” rate of return
✤ But firms fear that the regulator will reduce the price after the investment is sunk

58
A Strategic Explanation of Leverage 2/2
✤ May firms “use” capital structure to influence the regulators’ decisions? … and may regulators “use” capital structure to tie their own hands and discipline their own opportunism?
✤ A welfare maximizing regulator has the incentive to set a high regulated price so as to reduce the probability that the firm will become financially distressed (Spiegel and Spulber, 1994 RAND)
✤ The firm’s leverage mitigates regulatory opportunism
✤ The regulator allows the firm to choose its leverage in order to commit not to engage in opportunistic behaviour

59
Bortolotti, Cambini, Rondi and Spiegel
(2011, JEMS)
✤ Unbalanced panel of virtually all 92 publicly traded utilities and transportation infrastructure operators during 1994-2005 (927 firm-year observations) in 14 EU member states: ✜ 44 firms in electricity and gas distribution
✜ 13 water supply companies
✜ 15 telecoms (mainly vertically integrated operators)
✜ 8 freight roads concessionaires
✜ 12 transportation infrastructure operators
✤ We excluded airlines, oil and refinery companies, wireless telecoms, and electricity generators because typically their prices are not regulated
✤ 67 firms in our sample have been privatized by 2005. Of these firms 24 have been privatized during 1994-2005 period. 25 firms in our sample are still state-controlled in 2005.
✤ Privatization is still incomplete: the state’s UCR in the firms in our sample are 37% on av.
60
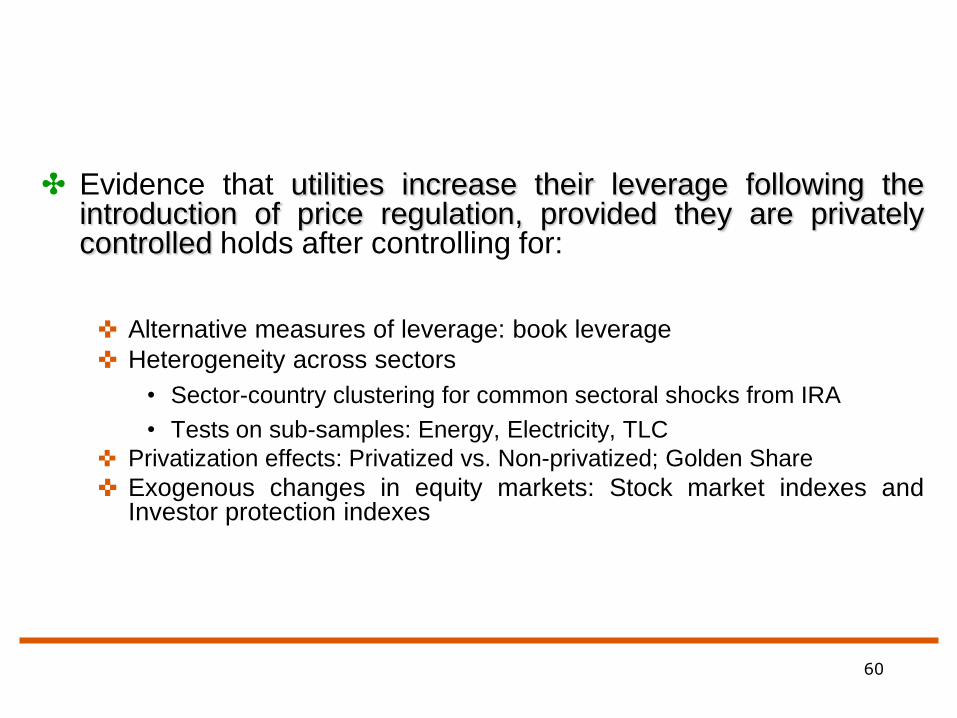
✤ Evidence that utilities increase their leverage following the introduction of price regulation, provided they are privately controlled holds after controlling for:
✜ Alternative measures of leverage: book leverage
✜ Heterogeneity across sectors
• Sector-country clustering for common sectoral shocks from IRA
• Tests on sub-samples: Energy, Electricity, TLC
✜ Privatization effects: Privatized vs. Non-privatized; Golden Share
✜ Exogenous changes in equity markets: Stock market indexes and Investor protection indexes

61
Leverage and prices
✤ Leverage Granger-causes Regulated Prices
✜ The full sample
✜ When the IRA is in place
✜ Firms in industries regulated by an IRA
✜ Privately-controlled firms (under 50% and restricted def.)
✜ Firms that were and remained private (never privatized)
✤ Regulated Prices do not Granger-cause Leverage in all above cases
✜ Leverage does not Granger-cause regulated prices for the sub-sample of
State-controlled firms

62
A Study for the
Italian Energy Authority

63
63
• Average Gearing (D/E) increase by 36 percentage points in 7 years: from 76% to 112%
• Huge difference for firms under incentive regulation wrt firms under RoR
Leverage of EU5 Energy utilities (1/2)
0,4
0,6
0,8
1
1,2
1,4
1,6
1,8
2
2000 2001 2002 2003 2004 2005 2006 2007
Total Incentive mechanism RoR

64
64
• Private firms are more leveraged than (fully or partially) state controlled companies
Leverage of EU5 Energy utilities (2/2)
0,4
0,9
1,4
1,9
2,4
2,9
2000 2001 2002 2003 2004 2005 2006 2007
Total Private contol State-control

65
Leverage and regulation
Average Gearing (2000-2007)
Total observations
N = 189
Incentive
Regulation
N = 144
RoR
N = 45
Regulation
difference
p-value
Total observations 1.353
(0.129)
0.945
(0.125)
0.408*
p = 0.092
Privately-controlled 1.758 (0.214)
N = 81
1.981 (0.244)
N = 68
0.591 (0.157)
N = 13
1.390**
p = 0.016
State-controlled 0.880 (0.062)
N = 108
0.792 (0.057)
N = 76
1.089 (0.158)
N = 32
- 0.297**
p = 0.030
Ownership
difference
p-value
0.878***
p = 0.000
1.189***
p = 0.000
- 0.498*
p = 0.070
Gearing is Net Financial Position divided by the value of equity.The p-values are based on two-sided test of the Null
hypothesis that the difference in the average leverage between two different groups is equal to 0. (Standard errors are in
parenthesis).

66
66
Leverage and regulation
• Not so easy to reconstruct the way in which EU regulators define
the WACC and the leverage:
Spain: “mark-up” over the standard WACC for new investments
UK: leverage (D/(D+E)) is set equal to 0.60, versus the real leverage of
0.75 of National Grid. According to Ofgem: “the gearing assumption
should not be interpretated as an endorsement of any particular
structure. Companies are best placed to decide on the most appropriate
capital structure”
France: leverage equal to 50%, close to the real EDF capital structure in
2005

67
Leverage of Italian Energy utilities
0
0,4
0,8
1,2
1,6
2
2000 2001 2002 2003 2004 2005 2006 2007
Total Incentive mechanism Italia
• Lower level but steadily increase over time from 2000 to 2007 (from 53% to 110% of equity)

68
68
Gearing for TSO ?
• Leverage increases also for TSO: it is more than double from 2000 onwards
• It reaches 350% and then decreases to 200% in 2007
Gearing (PFN) e Debito LT dei 5 TSO
0.00
0.50
1.00
1.50
2.00
2.50
3.00
3.50
4.00
2000 2001 2002 2003 2004 2005 2006 2007
Gearing (D/E) LT Debt / Equity
Nota: I dati si riferiscono a Terna, Snam Rete Gas, Red Electrica Espana, Enagas, RTE. Mancano i dati per le imprese tedesche,
verticalmente integrate, e per l’attività di trasporto di GDf

69
“ Arrangements for responding in the event that a
network company experiences deteriorating
financial health “
Ofgem, 2008, n. 158, Position Paper
70
The Ofgem Proposal (1/3) ✤ The legislative and regulatory framework in place for Britain’s energy networks is
designed to reduce the risk of financial distress affecting network operators and to ensure that an acceptable level of service continues to be provided to consumers should financial distress occur.
✤ There are a number of potential causes of financial distress. In some cases financial distress may reflect the actions or strategies of the affected company, such as the failure of management to control expenditure or excessive gearing, where a company relies heavily on debt to finance its activities. It can also result from the actions of another party, such as the default or insolvency of a major trading partner. Finally, financial distress may result from the impact of exogenous factors that impose additional costs on a company or make it less attractive to investment. Financial distress may result from a combination of these or other factors.

71
The Ofgem Proposal (2/3)
✤ Regulatory remedy: financial ring-fence
✤ “Financial ring fence‟ is the requirement for the companies to provide a statement signed by a director of the licensee and accompanied by a supporting statement from its auditors setting out that the company has adequate resources to properly and efficiently carry out its functions over the next financial year.
✤ Another provision of the „financial ring fence‟ provides for a cash lock-up in certain
circumstances between the licensee and its affiliates. This prohibits a parent
company from taking money out of a network company and thus out of the
regulated GB networks in order to address financial concerns at a Group level.
✤ Collectively, the ring-fence conditions aim to protect the financial health of network
companies, and enable us to monitor financial health and take action where
necessary (including enforcement action) to seek to prevent a material
deterioration in the financial health of a network company.

72
✤ Other arrangements: ✜ Information on detailed cost and revenue reporting arrangements in
place for the network companies
✜ Control over Investment and its relation with service supply
✜ Other financial informations (shares, credit ratings …..)
✤ However, OFGEM states that, even though not desiderable, it might also consider to re-open the negotiation process on price mechanism (re-opening price control)!!!!
The Ofgem Proposal (3/3)

73
Re-opening price control (1/2)
✜ “[…] the cause of financial distress is largely due to factors beyond the
company‟s control. These might include:
(i) instances where additional workload has arisen from new legislation
that was not anticipated at the time of the last review, or unanticipated
consumer demand; or
(ii) a material change in financial market conditions relative to those
prevailing at the time a price control was set such that that an efficient
company with an investment grade credit rating would no longer be
able to finance its activities.”
✜ “Re-opening the settlement could reasonably be expected to relieve the
financial distress in a timely manner.

74
✤ More generally, according to Ofgem (2008):
✤ But these criteria are difficult to assess ….
Re-opening price control (2/2)
“In no sense should the reopener process be
viewed as a mechanism to bail out an
inefficient, poorly managed network company
or a network company that has excessive
gearing”.