regulation by shaming: deterrence e ects of publicizing...
TRANSCRIPT
Regulation by Shaming: Deterrence Effects of Publicizing
Violations of Workplace Safety and Health Laws ∗
Matthew S. JohnsonDuke University
Sanford School of Public Policy
September 29, 2016
Abstract
Ratings, scores and other forms of information provision are increasingly usedas a tool to incentivize firms to improve their quality or performance, but lessis understood about policies which exclusively publicize firms discovered to beperforming particularly poorly–i.e. “shaming.” Shaming may affect the decisionsof publicized firms, and more broadly it may have a deterrence effect on not-yetpublicized firms. After a 2009 policy change, the Occupational Safety and HealthAdministration (OSHA) began issuing press releases about workplaces found tobe in violation of safety and health regulations if the penalties levied for thoseviolations exceeded a cutoff. Using quasi-random variation induced by this cutoff,and the specific ways these press releases were distributed to the media, I estimatethe effect of publicizing violations by one workplace on its own subsequent com-pliance with OSHA regulations, and also the spillover effect on the compliance of“peer” workplaces most likely exposed to the publicity. Workplaces with a peerwhose violations were publicized significantly improve compliance with safety andhealth regulations. These spillover effects decrease with geographic and industry“distance” to the publicized workplace, and the response appears to be driven byemployers acting to avoid their own future publicity, rather than by updating be-liefs over the probability of future regulatory enforcement. On the other hand,there is no evidence of improved compliance among publicized employers, thoughthese results are imprecise.JEL: J28, J81, L51
∗Email [email protected] I wish to thank Kevin Lang, David I. Levine, and JohannesSchmieder for invaluable guidance, as well as Kavan Kucko, Michael Lipsitz, John Mendeloff, AlisonMorantz, Benjamin Ogden, Claudia Olivetti, Mike Toffel, David Weil, Russell Weinstein, for helpfuldiscussion, and seminar participants at Boston University, the 2014 Alliance for Research on Corpo-rate Sustainability (ARCS) Annual Meeting, and the 2016 Strategy and Business Environment (SBE)conference for helpful comments. I would also like to thank the staff at OSHA’s headquarters andeach of OSHA’s regional Office of Public Affairs for providing me with details on OSHA’s press releasepolicies and patiently answering my unending questions. Keith Ma provided invaluable guidance withgeocoding in ArcGIS. Jing Li provided excellent research assistance. All errors are mine and minealone.
1 Introduction
Ratings, scores and other means of informing a firm’s stakeholders about its quality
or performance have proliferated in recent years (Dranove and Jin 2010; Delmas et al
2010). These policies are guided by the basic economic insight that, when quality is
imperfectly observable, providing information mitigates a moral hazard problem that
distorts firms’ investments to invest in quality. Indeed, a growing academic literature
has generally found information provision policies lead publicized, rated, or otherwise
revealed firms to improve the quality of the attributes under scrutiny.1
However, many regimes seek only to provide information about those that whose
quality or performance is particularly low: i.e. “shaming.” For example, some regions
force companies caught polluting local waterways to issue apologies in the newspaper, 2
media outlets often compile lists with names like “Least Green Companies in America,”3 and “social media shaming” is a rapidly growing phenomenon where individuals take
to social media to put pressure on companies for actions ranging from animal cruelty
to high medical drug prices. 4 While one intent of such tactics is punitive – to punish
the entity perceived as wrongdoing– a broader and perhaps more important intent is
deterrence – to encourage improvements in quality, not just at shamed entities but
also other entities who wish to avoid being the target of their own future negative
publicity. Despite their growing prevalence, little is known about the effectiveness of
such “shaming” policies. One reason is likely due to substantial empirical challenges
in estimating their effects, due both to the purposely nonrandom selection of entities
that are publicized, and also the difficulty in measuring deterrence more broadly.
This paper overcomes these challenges to estimate the deterrence effects of publiciz-
ing poor performance in a setting that provides quasi-random variation in firms which
did or did not have their (poor) performance publicly revealed, and a natural way to
define firms which were and were not aware of this publicity. In 2009, the Occupational
Safety and Health Administration (OSHA)–the regulatory agency charged with setting
and enforcing workplace safety and health regulations in the U.S.– began issuing press
releases about employers found to be violating safety and health regulations, a policy
dubbed “regulation by shaming” by the Assistant Secretary of Labor.5 The policy
1Some examples are restaurant hygiene (Jin and Leslie 2003), to drinking water quality (Bennearand Olmstead 2008), to environmental ratings (Chatterji and Toffel 2010).
2Tovia Smith, “Companies ‘Named and Shamed’ for Bad Behavior,” NPR, March 7, 2010.http://www.npr.org/templates/story/story.php?storyId=124357844
3Newsweek, “Least Green Companies in America: Photos,” October 16, 2011.http://www.newsweek.com/least-green-companies-america-photos-68107
4”Social Media Shaming: Can Outrage Be Effective?” Knowledge@Wharton, November 20, 2015,accessed September 15, 2016. http://knowledge.wharton.upenn.edu/article/social-media-shaming-can-outrage-be-effective/
5Michaels, David. OSHA at Forty: New Challenges and New Directions. July 19, 2010. Available
1
was intended to expose egregious violators to the broader public, and also to publicize
OSHA’s enforcement actions. These press releases described the violations found in a
recent inspection of an employer, the financial penalties levied, and often suggested the
employer was not committed to protecting its workers from safety and health hazards.
The initiation of this policy provides an ideal setting to estimate the scale, scope
and persistence with which publicizing poor performance affects the behavior of firms.
First, OSHA used a cutoff rule whereby it issued a press release about an employer if
the financial penalties it levied at a recent inspection were above a threshold, providing
quasi-random variation in publicity among otherwise similar employers. Second, local
newspapers and trade publications of the publicized employer often reprinted these
press releases, so that other employers in close geographic proximity and in the same
industry were mostly likely to be exposed to publicity of a press release. Finally, the
policy was only announced internally within OSHA, and not made known to the general
public. As a result, this policy led to a sharp and unexpected overall increase in media
coverage of OSHA violations, and also meant a well-defined set of employers were
likely exposed to coverage of a particular press release – providing natural boundaries
of potential deterrence effects.
Guided both by the cutoff rule OSHA used to issue press releases, and the local
and industry-specific media pickup of these press releases, this paper uses a Regression
Discontinuity (RD) design to estimate how media coverage of employers caught violat-
ing safety and health regulations affects future compliance. It analyzes the effect on
those which are the source of publicity, by comparing the future behavior of employers
receiving penalties just and just below the threshold, and the effect on those exposed
to publicity about a “peer,” comparing those whose peer received a penalty just above
and just below the threshold.
The analysis finds that press release revealing OSHA non-compliance have substan-
tial deterrence effects. In the baseline specification, an inspection with penalties just
over the press release cutoff leads to 25% fewer violations among employers within a
5 kilometer radius and in the same sector. This result is highly robust to a broad
set of specifications and placebo checks. Furthermore, this spillover effect decreases in
magnitude approximately linearly with geographic distance, but remains statistically
significant for employers in a radius of up to 50 kilometers, highlighting the role of
proximity in facilitating spillover effects of media coverage.
One potential concern with this analysis is compliance with OSHA regulations is
only observed conditional on an inspection being opened, and some inspections are trig-
gered be events such as a serious accident or worker complaints about safety hazards.
here: https://www.osha.gov/as/opa/Michaels vision.html
2
If being exposed to a press release affects the probability such events occur, the esti-
mated effects on compliance could be biased. Explicit tests on the effect of exposure to
press releases on the number of inspections that occur, and restricting the compliance
regressions to inspections whose occurrence are exogenous to events at the workplace,
show the results are unaffected by this concern in practice.
In contrast, there is no evidence that press releases lead to improvements in com-
pliance at the publicized employer. While small sample size leads these results to be
imprecise, there is no visual or statistical evidence that employers with a penalty above
the press release cutoff have significantly different compliance in later inspections than
those with a penalty below the cutoff.
The paper then considers mechanisms that could be driving the deterrence effects of
press releases. One potential mechanism is that publicity about violations of safety and
health regulations damages an employer’s reputation with workers, customers or other
stakeholders, and employers improve their compliance following a press release about
a peer as a preemptive investment to avoid their own negative publicity (“reputational
deterrence”). An alternative mechanism is that press releases about OSHA inspections
with large penalties may change employers’ beliefs about the probability and severity of
OSHA enforcement (“enforcement deterrence”); because OSHA only inspects a small
subset of workplaces every year, many employers may be unaware of OSHA’s inspection
and enforcement activities, and a press release may provide additional information.
Several pieces of evidence suggest that “reputational deterrence” is driving the
results. First, the spillover effects of press releases are not moderated by employers’
experience with OSHA enforcement prior to 2009; if some employers update their beliefs
about OSHA enforcement upon reading a press release, updating should be strongest
for those which have been subject to low rates of enforcement in the past. Second,
several years after the press release policy has been in place, there is a leftward shift in
the distribution of OSHA penalties just around the press release cutoff. At the same
time, there appears to be very little, if any, change in compliance at the left or right
tails of the distribution. This behavior suggests, in the long run, employers a) infer a
noisy signal of the press release cutoff, and b) try to improve compliance just enough
to surely avoid a press release. This result suggests a potentially limited long-term
benefits from a shaming policy based on a cutoff rule.
This paper’s findings provide a novel contribution to a literature on the disciplinary
effects of information provision. While a growing body of work (such as those papers
cited in Footnote 1) has investigated the extent to, and conditions under, which pro-
viding or disclosing information about quality leads firms to improve their quality, this
paper is one of the first to identify how providing information about some firms can
have broader-reaching effects on the behavior of other firms. A separate literature has
3

explored the effect of “shaming” in other domains, such as public release of criminal
records (Lee (2013 , and tax delinquency (Perez-Truglia and Troaino 2016), and in the
realm of politics, media coverage has been shown to affect politicians’ incentives to
engage in malfeasant behavior (Snyder and Stromberg (2010, Larreguy, Marshall and
Snyder (2014)). This paper builds on these literatures by exploring how shaming can
be used in a regulatory environment to affect firm behavior.
This paper also contributes to the literature on the deterrence effects of regulatory
enforcement. A large literature has investigated the effects of inspections and monitor-
ing on the future compliance of inspected (“focal”) facilities,6 and a smaller literature
has sought to estimate the spillover effects of enforcement on other (non-focal) facil-
ities.7 At least in the environmental domain, the consensus in this literature seems
to be that “rigorous monitoring and enforcement remains the number one motivator
for many facilities’ environmental compliance decisions” (Gray and Shimshack 2011).
The findings of this paper suggest the media and “shaming” have been overlooked
as powerful forces governing employers’ compliance decisions, at least for safety and
health.
The remainder of this paper is organized as follows. Section 2 provides a brief con-
ceptual framework of why media coverage about safety may affect compliance and other
investments in safety. Section 3 provides institutional background of OSHA’s press re-
lease policy and describes the data, and Section 4 develops the empirical methodology.
Section 5 provides the results of the empirical analysis, and Section 6 explores mecha-
nisms underlying the results. Finally, Section 7 concludes.
2 Conceptual Framework
This section briefly discusses why a policy publicizing employers caught violating work-
place safety and health regulations would affect incentives to comply and make other
investments in safety and health.
First, such publicity could change the market’s beliefs (i.e. an employer’s reputa-
tion) about an employer’s commitment to providing a safe and healthy workplace, or
to regulatory performance more broadly. When consumers and other stakeholders can-
6As just two examples in a very large literature, see Weil (1996) for OSHA inspections and Hannaand Oliva (2010) for EPA inspections.
7 Shimshack and Ward (2005) find that EPA inspections resulting in a fine result in a substantialreduction in the statewide violation rate, whereas inspections with no fine have no detectable effect,which the authors interpret as evidence that general deterrence operates through regulator reputation.Thornton et al (2005) conducted a survey among 233 manufacturing firms and found that the number ofexamples of enforcement actions at other firms that respondents could recall was significantly and pos-itively associated with whether the respondent reported having taken action to improve environmentalperformance, though they (rightly) caution the causality could run in the opposite direction.
4
not observe these commitments directly, publicity that reveals an employer is violating
OSHA regulations provides a signal these commitments are low (i.e. it is uncommit-
ted to workplace safety and/or regulatory performance). If such publicity damages
an employer’s reputation, then not-yet publicized employers (whose reputation will be
high, on average) invest to increase their compliance to preserve their reputation and
avoid being the object of future reputation-damaaging news (Board and Meyer-ter-
Vehn (2013)). On the other hand, the compliance incentives for already-publicized
employers (whose reputation has been damaged) are less clear: if being publicized
damages an employer’s reputation enough, publicized employers’ best response may
actually be to (weakly) decrease their investments in compliance; in the absence of
a mechanism for stakeholders to learn about improvements in quality, an employer’s
reputation may never be able to recover after bad publicity about safety violations,
in which case incentives to invest in quality improvements are low. In other words,
“shaming” leads to a clear general deterrence effect, but its specific deterrence effect
on employers that are shamed is less clear.
In theory, the market’s belief over an employer’s commitments to safety and regu-
latory performance only affect the employer’s behavior to the extent that consumers or
other stakeholders actually care about these commitments, which they very likely do.
For example, consumers or downstream trading partners may infer that non-compliance
with OSHA standards is indicative of labor unrest, which has been shown to lead to
lower product quality (Mas 2008). Potential new workers may view non-compliance
as a signal of poor workplace safety culture with higher risk of injury, and as a result
demand higher wages (Rosen 1986). Consumers might respond as well: in the weeks
following the widely publicized 2010 BP oil spill, which led to the death of 11 workers
and the release of millions of gallons of oil into marine waters, BP margins and volumes
declined significantly (Barrage, Hastings and Chyn 2014 ). Publicity about violating
safety standards thus imposes an additional cost on noncompliance, above and beyond
enforcement penalties, insurance premiums, and other existing costs on noncompliance.8
A second reason publicity detailing violations found at a recent OSHA inspection
could affect compliance is by changing employers’ beliefs about the probability of future
OSHA enforcement (i.e. affecting the regulator’s reputation). While neoclassical mod-
els of compliance view agents as choosing compliance based on all present and future
expected benefits and costs, in reality these decisions may be made in the presence
of imperfect information. There are hundreds of safety and health regulatory stan-
8Of course, in practice the extent to which stakeholders and consumers care about an employer’scommitment to workplace safety and regulatory performance will vary widely across different industries,regions, and employers.
5

dards in the U.S., and given this regulatory complexity even the most well-intentioned
firm may not be perfectly compliant (Malloy 2003). A press release could affect em-
ployers’ beliefs about the probability of enforcement: because OSHA only inspects a
small subset of operating workplaces every year, many employers may be unaware of
OSHA’s inspection and enforcement activities. Media coverage detailing violations at
a recent inspection of one employer could lead other employers to update their beliefs
over the expected costs of noncompliance imposed by regulatory enforcement, either
through beliefs about the probability of inspection or the expected fine conditional on
inspection (Becker (1958)). More generally, press releases could have a behavioral effect
simply by making safety standards more salient to managers, or by reminding them
that “OSHA is out there.” Reminders which make the cost of an agent’s actions more
salient have been shown to affect behavior in energy use (Gilbert and Zivin 2014) and
individual saving (Karlan et al 2010). Notably, under this story, press releases should
have no effect on compliance decisions of the publicized employer, as it learns no new
information from the information in media coverage about itself.
An additional way a press release could change employers’ beliefs about OSHA en-
forcement is by beliefs over the priorities of enforcement: because press releases provide
detailed descriptions of the specific violations found in an inspection, and the penalty
associated with each violation, a press release could signal that OSHA is cracking down
on a particular set of standards.
3 Institutional Background and Data
3.1 OSHA’s Press Release Policy
OSHA’s primary tool to monitor and enforce compliance with its health and safety
standards is inspections of workplaces. During these inspections OSHA inspectors
survey a workplace’s operations and assess its compliance with standards. Inspections
can be triggered by an event specific to the workplace, such as a complaint (by an
employee or member of the public) alleging safety and health hazards at a worksite,
a “referral’ (an allegation of hazards made by an inspector, government agency or
media), or a serious accident (worker fatality or hospitalization of three or more workers,
or a “catastrophe”). Other inspections are pre-planned, or “programmed” in OSHA
parlance. Programmed inspections are often part of a broader agenda to focus on
worksites in a particular industry or at risk of a particular safety hazard, and they
aretypically unrelated to events at the worksite itself. If, during the inspection, the
inspector finds the workplace out of compliance with any standards, she issues citations
for each violation she observes. The inspector then calculates the appropriate financial
6

penalty for each violation, which is a function of the size of the employer, number of
employees exposed to the hazard, and the likelihood the violation would lead to a severe
accident. Penalties are typically issued a few weeks after an inspection takes place.
For at least the past decade, OSHA’s ten regional offices around the country would
issue a press release detailing the violations found and penalties issued at an inspection
if the regional office deemed one appropriate. The regional office would then send the
press release to local media and industry trade press. Figure 1 gives an example of
such news coverage: an inspection of a poultry processing plant in Gainesville, GA.
was begun in January 2009, and the inspector issued $73,275 in penalties on April 16,
2009. OSHA immediately issued a press release about the inspection, which begins by
suggesting the plant was not committed to protecting its workers and had not made
safety part of its culture. The article then proceeds to describe the specific violations
found during the inspection in detail, citing the plant’s lack of “standard guardrails”
and “using flexible cords instead of fixed wiring,” among others. The same day that
OSHA issued its press release, the story appeared in the plant’s local newspaper, the
Gainesville Times.
Before 2009, the criteria used to determine whether to issue a press release was
largely left to OSHA’s ten regional offices. These criteria varied substantially across
regions. Some regions used a cutoff rule; Regions 1 and 4 (covering New England and
the Southeast, respectively) issued press releases for inspections resulting in penalties of
at least $40,000, and Region 5 (in the Midwest) used $100,000. Some regions effectively
issued no press releases at all.
However, in May 2009 OSHA’s national headquarters in Washington D.C. decided
to standardize these criteria across regions. As a result, a common cutoff of $40,000 was
instituted for Regions 1-4, 6, 9, and 10, and a cutoff of $45,000 for Regions 5, 7 and 8.9.
These cutoffs were not announced publicly, and were only communicated internally, an
important detail to support the validity of the empirical design that follows. Statements
by OSHA officials reveal the policy was intended both to reveal exceptionally high
violators to the general public, and also to provide publicity about OSHA’s enforcement
activity. Dr. David Michaels, the Assistant Secretary of Labor and Director of OSHA,
has called press releases “regulation by shaming,” suggesting the intent that press
releases impose a cost on publicized employers and add a disincentive to violate OSHA
regulations.10 Additionally, press releases are meant to serve “educational and deterrent
purposes for other companies in the same industry and geographic area.” 11
9OSHA officials were unsure of the reasons behind the difference in this cutoff across regions.10Michaels, David. OSHA at Forty: New Challenges and New Directions. July 19, 2010. Available
here: https://www.osha.gov/as/opa/Michaels vision.html11Comments from Patrick Kapust, deputy director of OSHA Directorate of Enforcement Programs,
in December 1, 2012 interview: http://www.safetyandhealthmagazine.com/articles/examining-the-top-
7

Figure 2 illustrates the effect of the 2009 policy change on the number of press
releases issued by OSHA, and media coverage of OSHA violations, each year 2002-
2011. For media coverage, I use the number of articles found on newslibrary.com that
contain “OSHA” in the title, and “violations” anywhere in the text. Panel (a) plots
these series for Regions 1 and 4, which were using the $40,000 cutoff rule at least
as early as 2002, and panel (b) plots for the other later-adopting regions. Prior to
2009, there are consistently very few press releases issued outside of Regions 1 and
4. Starting in 2009, there is a muted increase in the number of releases in Regions
1 and 4, and a drastic increase everywhere else. The almost one-to-one relationship
between number of press releases and newspaper articles shows the 2009 policy change
significantly changed the frequency of media coverage about OSHA violations, albeit
to a greater degree in some parts of the country than others.
While this policy change made the probability of a press release a discontinuous
function of penalties, in practice the cutoff rule was not a sharp one. Some inspections
with penalties below the cutoff resulted in a press release anyway if, for example,
novel violations were found that pose a new and little-publicized kind of hazard. Some
inspections above the cutoff would not get press releases if the inspector does not send
the necessary information to the regional office in time to be relevant. Furthermore,
OSHA’s 10 regions varied in their adherence to the policy. The fuzziness of this design
is incorporated into the empirical analysis.
3.2 Data
The primary data source used in the analysis is OSHA’s Integrated Management Infor-
mation System (IMIS), which contains detailed information on each of OSHA’s inspec-
tions started between January 2001 and September 2013. 12 Key variables included are
the date the inspection is opened, the reason the inspection was initiated (complaint,
referral, accident, programmed, other), workplace characteristics (name, address, in-
dustry, number of employees present, whether the employees are represented by a union,
etc). I geocoded all addresses in the database using ArcGIS to get the latitude and
longitude of each inspection. As for compliance measures, a detailed report of each
violation found (if any) is included, with the OSHA standard that was violated, its
corresponding financial penalty, and the date the violations were issued. I collapse the
data to the establishment-inspection level by summing each type of violation and all
10-2?page=212 The data were downloaded from OSHA’s website in February 2014. While the IMIS
database is updated weekly and included some inspections through January 2014, it wasclear the data were incomplete after September 2013. IMIS can be downloaded here:http://ogesdw.dol.gov/views/data summary.php
8
penalties levied at each inspection. Since worksites are inspected at varying frequency–
which some inspected multiple times, others inspected only once–the data constitute
an unbalanced panel.13
For most of the analysis, I restrict attention to inspections with penalties issued
May 2009 and after, since this is when OSHA made its press release policy relatively
uniform, and with penalties issued before December 2012, to provide sufficient post-
inspection data through September 2013 (when the dataset ends). The press release
policy does not cover the 21 states with state-run OSHA offices, so inspections in these
states are excluded, except for a placebo check on the main results. I also exclude
Regions 2 and 3 (covering primarily New York and New Jersey), as the data suggest
these regions did not adhere to the cutoff rule. Finally, I exclude inspections in the
mining industry (< 1% of total inspections), as this industry is under the jurisdiction
of the Mine Safety and Health Administration, rather than OSHA’s.
Summary statistics are provided in Table 1 separately for the entire sample of
inspections initiated between January 2009 and December 2012, and for the subset of
inspections with penalties within $10,000 of the press release cutoff for its corresponding
region (within $30,000 and $50,000 for Regions 1, 4, 6, 9, and 10, and within $35,000 and
$55,000 for Regions 5, 7 and 8). Most inspections result in relatively small penalties:
out of the nearly 93,000 inspections during this period, the average inspection results
in just under $4,500 in penalties (but is highly skewed) and just 1 percent result in
penalties above the corresponding press release cutoff. That the press release cutoff
is at the 99th percentile of the penalty distribution supports the idea the policy was
intended to expose the highest violators. The average inspection finds 2.6 violation,
while the average inspection in the subset around the press release cutoff finds nearly
11 violations.
Roughly 60 percent of inspections in the whole sample are programmed (i.e. planned
ahead of time) and 34% are triggered by a complaint, referral or “catastrophe,” with the
remaining 6.3% classified otherwise.14 However, the share of complaint or catastrophe
inspections rises to 51% in the sample near the cutoff.15 The average workplace in
the subsample with penalties near the cutoff is roughly twice as large (in terms of
employment) and 50 percent more likely to be unionized than the average workplace
in the whole sample.
13IMIS does not keep a unique establishment identifier to track the same establishment over time.Thus, various “fuzzy matching” techniques were used to link records of the same establishment overtime. I thanks Melissa Ouellet for help with this endeavor.
14The categories in “other” include monitoring, variance, and follow-up inspections.15In the IMIS database, the average penalty issued from complaint or catastrophe inspection during
this period was $4690, whereas the average for all other inspections was $2,300.
9
The final panel of Table 1 shows the distribution of inspections across sectors. 16
OSHA inspections are concentrated largely among construction and manufacturing
workplaces, both in the whole sample as well as the subsample around the press release
cutoff.
Because many of these variables are so skewed to the right, I topcode count variables
at their respective 99th percentiles, and I take logs of continuous variables (penalties,
# employees), to ensure the analysis is not vulnerable to outliers.17
To determine the extent to which the cutoff rule for issuing press releases was
followed in practice, I hand linked the IMIS data to the set of archived press releases
on OSHA’s website to create an indicator for each inspection in IMIS equal to 1 if
the inspection resulted in a press release.18 Figure 3 uses the results of this linking
to illustrate the discontinuity in the probability a press release is issued at the cutoff.
The Figure makes clear the probability an inspection results in a press release jumps
significantly at the cutoff by 25-30 percentage points, highlighting the presence of the
discontinuity but also the imperfect adherence to the policy by OSHA.
4 Empirical Strategy
4.0.1 Estimating General Deterrence Effects of Publicizing Employers Caught
Violating OSHA Regulations
Estimating how a policy that publicizes the results of inspections of the worst violators
of OSHA regulations affects employers’ compliance decisions is fraught with empirical
challenges. One such challenge is identifying a set of “treated” employers that become
aware of the policy that non-compliers will be publicized (but are not necessarily the
subject of publicity themselves), and a set of “control” employers that remain unaware
of the policy and its ensuring risk of publicity.
Fortunately, the introduction of OSHA’s press release policy offers a unique setting
to overcome this challenge. Because OSHA’s policy change to begin publicizing egre-
gious violators was not made known to the general public, the only way for employers
to become aware of this new policy was to observe a press release directly. The media
outlets through which OSHA distributed its press releases provides a natural classifi-
cations of the types of employers likely exposed to a particular press release. Firstly,
16Sectors are roughly 2-digit NAICS codes, except codes 31-33 are pooled for Manufacturing, 44 and45 are pooled for Retail Trade, 48 and 49 are pooled for Transportation and Warehousing, and 1-digit5-9 are pooled for Services
17For logged variables, I add the first non-zero percentile of each variable before taking the log toaccount for zeroes.
18The archive of OSHA’s press releases since 2001 is available here:https://www.osha.gov/newsrelease.html
10
OSHA typically sent its press releases to local (and not national) media outlets, mean-
ing that employers located nearby the publicized employers would be more likely to be
exposed to ensuing media coverage. Secondly, press releases were also typically sent
to (and covered by) industry trade publications. As a result, a press release would be
most likely seen by geographically proximate employers in the same industry as the
publicized employer.
Other details reinforce the idea that employers sharing the same region and industry
would view publicity about one another’s OSHA compliance. Corporate networks have
a significant geographic component (Davis and Gray 1997), and spillovers from patents
(Jaffe, Trajtenberg and Henderson 1993) and adoption of new technology are very
localized, all of which suggests employers located near each other are in greater contact
than with those further away. Furthermore, the set of standards OSHA checks for in
an inspection, as well as the likelihood a particular employer will be inspected at all,
varies widely by industry (Weil 1996), and as a result the description of the inspection
results in a press release are likely to be more relevant to other employers in the same
industry.
While the media distribution of OSHA’s press releases provides a natural way to
characterize employers most likely to become aware of the resulting new threat of
publicity, an additional empirical challenge arises in measuring employers’ compliance
with OSHA regulations, which is address in the next section.
4.1 Estimating the Effects of Press Releases on Compliance When
Inspections are Endogenous
Estimating the deterrence effects of publicizing violators of OSHA regulations requires
a measure of employers’ compliance with these regulations. However, an employer’s
compliance is only observed conditional on being inspected, based on the assessment of
the inspector. Comparing compliance at future inspections of employers that are or are
not exposed to a press release could be biased if exposure to a press release changes the
types of employers that get inspected. Because many OSHA inspections are triggered
by an event at the worksite (accident, complaint, etc), in general the occurrence of an
inspection itself is endogenous. If press releases affect the probability that such events
occur, then the underlying types of workplaces who get inspected after observing a
press release may be different than the types inspected without having observed a
press release. If present, such an effect can bias an estimate of the effect of press
releases on compliance. This issue is described more formally in Appendix B.19
However, this concern can be addressed in several ways. First, we can directly
19This effect is similar to the Conditional-on-Positive bias discussed in Angrist and Pischke (2009).
11

estimate if exposure to a press release affects the likelihood of being inspected. If we find
no effect, it suggests a comparison of compliance conditional on inspection will not be
biased.20 Second, when measuring compliance conditional on inspection, we can restrict
attention to the subset of OSHA inspections not triggered by an accident, complaint,
or other event at the worksite, such as programmed inspections that pre-plannned by
OSHA and typically part of a broader industry- or region-wide focus. Because such
inspections are initiated for reasons exogenous to events at the worksite, there is no
reason to suspect any bias from comparing compliance conditional on inspection.
4.2 Regression Discontinuity (RD) Method
A final empirical challenge to estimating the deterrence effects of publicizing OSHA
violations is that press releases are not randomly assigned. By construction, press
releases are only written about the most egregious violators, and as a result employers
subjected to a press release are likely systematically different than those that are not.
Such differences may bias not only estimates of the specific deterrence effects of press
releases on outcomes of publicized employers, but also the general deterrence effect on
other employers exposed to the publicity, for example if there is spatial correlation in
rates of OSHA non-compliance.
Fortunately, OSHA’S procedures to issue press releases provide a set of inspected
employers that did and did not become the subject of a press release, but were otherwise
very similar. Specifically, because OSHA issued a press release about the violations
found in an inspection only if the penalties were above a cutoff c, one can estimate
the effects of these press releases on later outcomes using regression discontinuity (RD)
design–provided certain identification assumptions are met.
Suppose we are interested in the effect of a press release on some outcome for a
workplace that is publicized in a press release. Whether the workplace is the subject
of a press release is a function of the penalty issued at an OSHA inspection–or the
“running” variable in RD jargon. Because penalties may also have their own direct
effect on later outcomes, such as later OSHA compliance, it is important to control
flexibly for the running variable to isolate the effects of the press release.
Suppose workplace i has an inspection with penalties levied at date t amounting to
Penit, and we are interested in an outcome for workplace i observed at a date τ . It is
most natural to re-orient a workplace’s inspection history around the “focal” inspection
at date t the following way:
20This is not a perfect test, as exposure to a press release could change the composition of whichemployers get inspected, even if the level is unchanged.
12
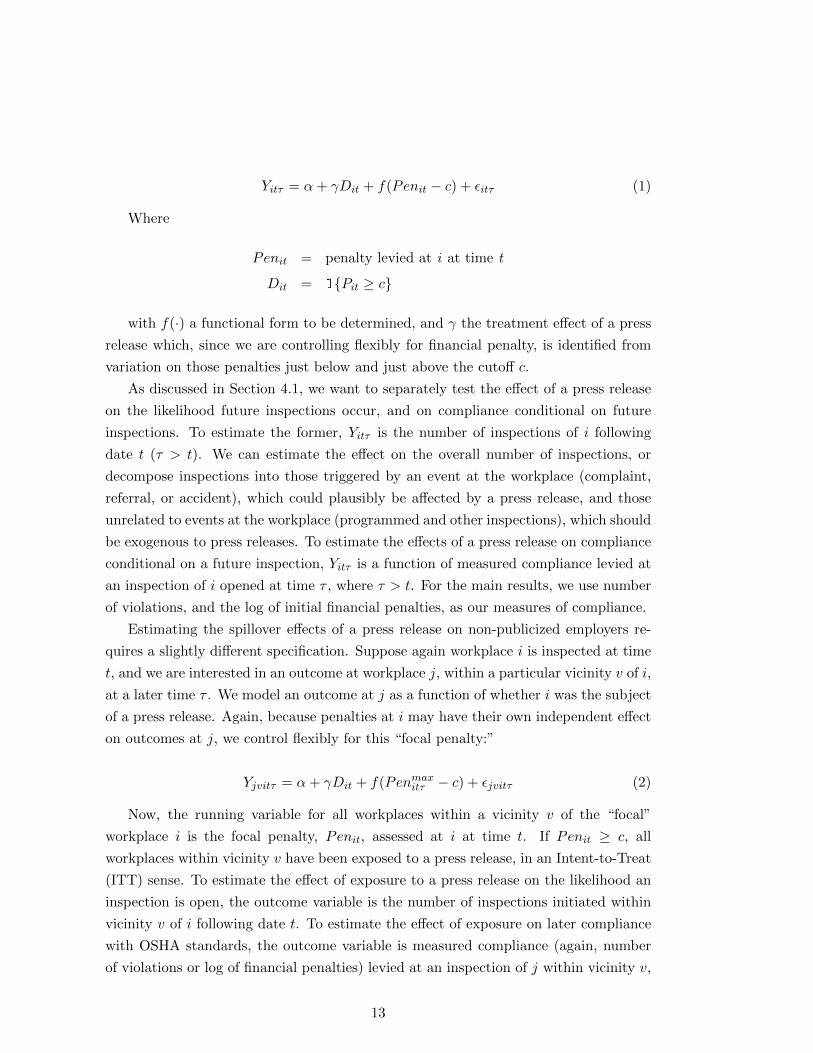
Yitτ = α+ γDit + f(Penit − c) + εitτ (1)
Where
Penit = penalty levied at i at time t
Dit = 1{Pit ≥ c}
with f(·) a functional form to be determined, and γ the treatment effect of a press
release which, since we are controlling flexibly for financial penalty, is identified from
variation on those penalties just below and just above the cutoff c.
As discussed in Section 4.1, we want to separately test the effect of a press release
on the likelihood future inspections occur, and on compliance conditional on future
inspections. To estimate the former, Yitτ is the number of inspections of i following
date t (τ > t). We can estimate the effect on the overall number of inspections, or
decompose inspections into those triggered by an event at the workplace (complaint,
referral, or accident), which could plausibly be affected by a press release, and those
unrelated to events at the workplace (programmed and other inspections), which should
be exogenous to press releases. To estimate the effects of a press release on compliance
conditional on a future inspection, Yitτ is a function of measured compliance levied at
an inspection of i opened at time τ , where τ > t. For the main results, we use number
of violations, and the log of initial financial penalties, as our measures of compliance.
Estimating the spillover effects of a press release on non-publicized employers re-
quires a slightly different specification. Suppose again workplace i is inspected at time
t, and we are interested in an outcome at workplace j, within a particular vicinity v of i,
at a later time τ . We model an outcome at j as a function of whether i was the subject
of a press release. Again, because penalties at i may have their own independent effect
on outcomes at j, we control flexibly for this “focal penalty:”
Yjvitτ = α+ γDit + f(Penmaxitτ − c) + εjvitτ (2)
Now, the running variable for all workplaces within a vicinity v of the “focal”
workplace i is the focal penalty, Penit, assessed at i at time t. If Penit ≥ c, all
workplaces within vicinity v have been exposed to a press release, in an Intent-to-Treat
(ITT) sense. To estimate the effect of exposure to a press release on the likelihood an
inspection is open, the outcome variable is the number of inspections initiated within
vicinity v of i following date t. To estimate the effect of exposure on later compliance
with OSHA standards, the outcome variable is measured compliance (again, number
of violations or log of financial penalties) levied at an inspection of j within vicinity v,
13
opened at time τ , where τ > t.
Because press releases were publicized in local newspapers and industry publica-
tions, the “vicinity” v has both a geographic and industry component. As our main
specification, we define a workplace j to be in the vicinity of i if it is within a particular
geographic radius of i (such as within a radius of 5 kilometers), and in the same sector
(where sector is defined as in Table 1). Because there may be correlation in OSHA
compliance among workplaces in close proximity to each other, the regressions cluster
standard errors to allow arbitrary correlation in ε among all workplace in vicinity v of
a particular focal inspection.
For simplicity, baseline specifications use a uniform kernel around the forcing vari-
able (i.e. observations just at the cutoff and observations further away from the cutoff
get equal weight), though robustness checks consider alternatives. Finally, because
OSHA regions varied in their adherence to the press release cutoff rule, and because
the construction industry has its own set of OSHA standards not applicable to other
industries, we include a dummy variable for each OSHA region and a dummy variable
for construction in all regressions.
Various strategies exist to approximate functional form of f(·). However, Hahn et al
(2001) show that local linear regression—that is, estimating a standard linear regression
restricted to a narrow bandwidth around the cutoff point c—is a non-parametric way
to obtain an unbiased estimate of the treatment effect τ . To implement the local linear
regression, we will estimate Equation 1 locally around the cutoff c specifying f(·) as a
linear function but allowing for different slopes on each side of the penalty cutoff c.
4.3 Checking the Validity of RD Design
The RD design rests on the assumption that whether the running variable (here, OSHA
financial penalties) end up just above or just below the relevant cutoff for press releases
is random. This assumption is valid if those involved have imperfect control over the
exact penalty amount issued, and it can be jeopardized if there is room for manip-
ulation. For example, if there are reputational costs to publicity about poor safety,
the disutility from penalties is discontinuous at the cutoff c, and if managers know the
value of c they may prefer to bunch just below it.
However, it is ex ante unlikely that managers have the potential to manipulate
whether they are just above or just below the cutoff. First, the cutoff rule was not
announced publicly, so managers were likely unaware of the cutoff to begin with. Fur-
thermore, much evidence suggests penalties levied by an OSHA inspector are a stochas-
tic function of true noncompliance. For example, different OSHA inspectors may have
varying degrees of “toughness,” and not every OSHA standard is checked at every in-
14
spection, and standards have been refined or eliminated over time (Weil 1996). The
stochastic element of the penalty function introduces an element of randomness from
the workplace’s perspective, which would limit its ability to control the exact penalty
given a level of true noncompliance.
On the other hand, in theory there is room for manipulation by the OSHA inspec-
tors, since they issue violations and associated penalties themselves. For example, an
inspector could tip the employer over the penalty cutoff if she thinks it deserves bad
publicity, or in theory she could accept a bribe to leave penalties just below. OSHA
officials have confirmed that the method inspectors use to determine penalties is me-
chanical and by the books, and that any notion of whether the employer is above
or below the press release cutoff never enters into the equation. However, it is still
necessary to determine whether this lack of manipulation appears true quantitatively.
One test of the validity is whether the density of penalties associated with inspec-
tions is smooth around the cutoff c. If there is a discontinuity in the aggregate density
at the cutoff, then one may suspect either workplaces or inspectors are manipulating
penalty amounts to be on one side or the other. Figure 4 examines the density around
the cutoff visually. Penalty amounts are normalized by the corresponding regional cut-
off c and are placed in equally sized bins of $2500 (with care to ensure all bins are on
only one side of each cutoff), and frequencies are calculated for each bin. The sample
is restricted to inspections during May 2009-Dec 2011. The density appears overall
quite smooth, and implementing the test proposed by McCrary (2008) confirms no
statistically significant change in the density at the cutoff.
A second test of the validity of the “imprecise control” assumption is whether
relevant baseline characteristics are smooth around the cutoff. Table 2 shows the results
of local linear regressions, estimating Equation 1, with τ = 0 and Yitτ equal to one of
various baseline covariates measured at the time of the focal inspection, using a window
of $10,000 around the cutoff c. The results show no evidence of a discontinuity in any
covariates, providing further support that the assumptions needed for identification
using the RD design are met. 21
21An alternative way to check for smoothness in baseline covariates is to run a regression with Dit asthe dependent variable, and include each baseline covariate as a righthand side variable, and conductan F-test that coefficients on all baseline covariates are equal to zero. The results of this specification,not shown in the paper, yield an F-stat of 0.23 and p-value of 0.97, further evidence that baselinecovariates show no discotninuties around the cutoff.
15

5 The Effects of Publicizing Violations on Future Com-
pliance
5.1 Spillover Effects on Other Employers
We first investigate the effect of a press release about one employer on the compliance of
other employers likely exposed to it. For every “focal inspection” with penalties issued
between June 2009 and September 2012, we set out to test whether the occurrence of
later inspections, and compliance conditional on later inspections, is different among
employers in the vicinity of a focal inspection with penalties just above the press release
cutoff, relative to those in the vicinity of a focal inspection with penalties just below
the cutoff. In our baseline model, we define “vicinity” as other employers in the same
sector and within a 5 km radius of the focal inspection.
Figure A.1 graphically tests whether employers exposed to a press release have
different rates of subsequent OSHA inspections. Here, the unit of analysis is the focal
inspection: each focal inspection is placed into a bin, based on its focal penalty Penit,
Each dot is an average of the dependent variable for each bin. In panel (a), the
dependent variable is the number of inspections triggered by a complaint, referral or
accident (those endogenous to events at the workplace) in the vicinity over the 36
months following the date of the focal inspection. In panel (b), the dependent variable
is the number of programmed or “other” inspections (less likely to be endogenous to
events at the workplace). Each graph, while a bit noisy, shows no sign of a discontinuity
in the number of later inspections in the vicinity of focal penalties just over the cutoff.
Figure 5 graphically tests whether employers exposed to a press release have differ-
ent levels of compliance with OSHA standards conditional on being inspected. Here,
the unit of analysis is an employer in the vicinity of a focal inspection, and the running
variable is the focal penalty. Each is placed into a bin based on its focal penalty. In
panels (a) and (b), the dependent variables are number of violations and log of financial
penalties, respectively. In panels (c) and (d), the dependent variables are the same, but
the sample is restricted to programmed inspections. Each of the four graphs depicts a
clear downward shift in non-compliance among employers whose focal penalty is just
to the right of the cutoff c, suggesting employers exposed to a press release improve
their compliance with OSHA regulations.
Intent-to-treat (ITT) regression results for these effects are shown in Table 3 using a
bandwidth of $10,000 around the cutoff and controlling linearly for the running variable.
Columns (1)-(3) show that employers in the vicinity of a focal penalty just above the
press release cutoff are not inspected at a significantly different rate than those with a
16
focal penalty just below the cutoff.22 The point estimate in Column (2) suggests those
with a focal penalty over the cutoff may have fewer complaint, referral or accident
inspections, but the coefficient is not statistically significant. While the imprecision of
the estimates means large effects cannot be ruled out, the combination of the graphical
results and lack of statistical significance suggests selection bias in the estimates of the
effect conditional on future inspection is not a first order concern.
Columns (4)-(5) of Table 3 show the baseline regression results for compliance
conditional on inspection. Inspections of employers in the vicinity of a focal penalty
above the press release cutoff have 25% fewer violations (-0.56/2.21=-.25, p− value <.01) and 31 percent lower financial penalties (exp(-0.37)-1).
Columns (6) and (7) explore temporal effects of press releases, estimating the effects
on compliance change over time. 23 Effects show up immediately and are sustained
through three years after the date of the focal inspection.
Figure 6 explores how the spillover effects change with how “vicinity” to the focal
employer is defined In blue are the point estimates and 95 percent confidence intervals
with “vicinity” still requiring shared sector, for radii around the focal employer of 2
km, 5 km, 10 km, 25 km, and 50 km. The point estimate decreases almost linearly
with distance, but remains statistically significant for all but the 50 mile radius. The
red dots show point estimates when all employers in a particular radii are considered
in the vicinity, not just those in the same sector.
5.2 Checks on Validity of Results
5.2.1 Robustness checks
Next, we do several tests to ensure the validity of the baseline results. First, we conduct
a series of test to ensure our results are robust to alternative specifications and are not
driven by some other latent characteristic that changes for penalties just above the
press release cutoff. We also conduct placebo checks using cutoffs other than the true
press release cutoff, and using the true press release cutoff but in years prior to when
the press release policy was put in place, to validate the causal interpretation of the
baseline results.
Table 4 conducts robustness checks on the baseline specification on the effect of
exposure to a press release on number of violations. Column (1) reproduces the baseline
22To improve precision, the regressions in Columns (1)-(3) control for the number of inspections in afocal worksite’s county-industry between 2005 and 2008. The reported coefficient remains statisticallyinsignificant, but with a larger standard error, if this control is omitted.
23These regressions utilize a a variant of Equation 2 of the form Yjitτ =(∑
k αk + γk ∗Dit ∗ αk)
+f(Penit − c) + εjitτ , k = {τ − t ∈ {0− 6}, τ − t ∈ {7− 12}, τ − t ∈ {13− 24}, τ − t ∈ {25− 36}}months.
17
result. While the first three columns of Table 3 showed no evidence that exposure to a
press release significantly affects the likelihood an inspection is initiated, we may still
be worried there is some difference in the composition of the types of employers being
inspected. Column 2 of Table 4 restricts the sample to programmed inspections, those
which by definition are exogenous to events at the workplace. The point estimate is
essentially identical to the baseline result.
Column (3) includes a few potentially relevant baseline controls, which RD assump-
tions require to be uncorrelated with treatment, but whose inclusion may improve ef-
ficiency. The assumption appears to be met, as the point estimate reduces by a very
small magnitude, and the standard error also shrinks by a small amount.
One potential concern with the baseline specification is that one employer may
fall in the radius of multiple “focal” inspections (for example, lying in a geographic
boundary of multiple employers with penalties near the press release cutoff). As a
result, we could be treating an employer as “treated” and “not treated” at the same
time. To test how this possibility confounds the baseline results, columns (4) restricts
to observations in which an employer’s focal penalty Pit is its maximum focal penalty
over the sample period, and column (5) restricts to observations in which the focal
penalty is its earliest focal penalty (above $25,000) over the sample period. In both
cases, the coefficients are slightly larger than that from the baseline specification, which
would be expected if the use of repeated observations in the baseline specification mutes
the effect of “treatment.”
Column (6) defines employers in the “vicinity” of a focal inspection as those in the
same sector and zip code, rather than a geographic radius. The sample size shrinks
substantially, but the coefficient remains highly significant and is slightly larger than
the baseline result.
Next, to ensure the results are not sensitive to baseline specification choice, includ-
ing window around the cutoff c and linear polynomial in the running variable Pjt. I
implement the procedure outlined in Calonico, Cattaneo, and Titiunik (2014) to op-
timally select the bandwidth, polynomial order, and confidence intervals for robust
inference in an RD design, using the rdrobust Stata package made available by the
authors. Results are shown in Table A.1. Based on the procedure in Calonico, Catta-
neo, and Titiunik (2014), a bandwidth of $11,603 is chosen around the cutoff c when
the dependent variable is Violation Count, and $12,686 when the dependent variable
is log(penalties), both of which are very close to the bandwidth of $10,000 used in the
baseline results, and a triangular kernel around c is used, which gives more weight to
observations closer to c, instead of a uniform kernel. The magnitudes of the treated
coefficient decrease slightly in magnitude compared to baseline but remain highly sig-
nificant.
18

5.2.2 Placebo Checks
We run two placebo tests to validate the causal interpretation of the above results.
First, we re-run the regressions corresponding to Equation 2 but replacing the true
cutoff c with a series of placebo meaningless cutoffs. If we found a significant coefficient
using any of these meaningless cutoffs, we would worry the above significant estimates
are spurious. The results are shown in Table 5. Using all cutoffs other than the true
press release cutoff, the estimated coefficient is tiny and statistically indistinguishable
from zero.
Second, we run a placebo test to ensure the results are not driven by some other
factor that “switches on” at penalty amounts exceeding $40,000 or $45,000. Recall that
Regions 1 and 4 had adopted the $40,000 cutoff several years before 2009, but all other
regions had been using either a significantly higher cutoff or none at all. If we run the
regression corresponding to Equation 2 but oriented around inspections with penalties
levied before May 2009, we should expect a significant coefficient on Dit for Regions 1
and 4, but zero for all others.
Table 6 tests these predictions. Panel (a) estimates the first-stage effect of having
a penalty just over the cutoff on the likelihood a press release is issued. The sample
is restricted to inspections with penalties issued between 2002 and 2006. Column (1)
shows that in Regions 1 and 4, the coefficient is 0.21 (p − value < .01), similar to
the whole sample after the 2009 policy change, and )Columns (2) shows the first stage
effect is essentially zero in other regions. Panel (b) estimates the spillover effects of a
focal penalty exceeding the press release cutoff on the compliance of other employers in
the vicinity. The coefficient for Regions 1 and 4 is -0.38, which is slightly smaller than
the overall sample after 2009 but highly statistically significant. Assuringly, Columns
(2) shows the coefficient is essentially zero and nowhere near statistically significant in
other regions.
5.3 Direct Effect on Publicized Employers
The above results provide evidence that, when OSHA began publicizing employers
caught violating OSHA standards, other employers most likely exposed to the public-
ity substantially improved their compliance. A separate question is how such publicity
affected the subsequent compliance of the publicized employer. Indeed, as described
in Section 2 the specific and general deterrence effects of “shaming” may not behave
the same way. For one, if publicized employers suffer a loss to their reputation, and
subsequently have few opportunities to signal improvements in their compliance to
stakeholders to improve their reputation, they may face weak incentives to improve
compliance (Board and Meyer-ter-Vehn 2013). Additionally, incentives aside, inspec-
19
tions have been shown to have a substantial specific deterrence effects (Gray and Jones
1991, Ko, Mendeloff and Gray 2010), and there may be less scope for additional deter-
rence effects from the publicity.
Empirically estimating the specific deterrence effect of publicity on publicized em-
ployers is complicated by the fact that, in construction, the concept of a “workplace” is
ill-defined. If OSHA issues penalties to a construction contractor at one work site, the
next time OSHA inspects that contractor may be at a completely different worksite,
making it both conceptually and practically challenging to create a workplace identifier
for inspections in this industry. The task is more straightforward for non-construction:
for example, a manufacturing plant stays in one place, and neatly fits the concept of
an “establishment” and is relatively easy to track across repeat inspections. Thus, for
this analysis, we define a “worksite” as inspections sharing the same sector and an
identical latitude and longitude. Furthermore, to increase the sample size as much as
possible, we combine focal penalties issued between August 2009 and September 2012
(the baseline sample) with focal penalties in Regions 1 and 4 issued between 2002 and
2006.
As before, we first evaluate the effect of press releases on the probability of future
inspection and then turn to their effect on compliance conditional on future inspec-
tion. Figure A.2 graphically tests the effect of a press release on the number of later
inspections of the worksite: it again places worksites into bins based on the penalty in
the focal inspection, and each dot is the average number of later inspections for each
bin. Panel (a) plots number of later complaint, referral or accident inspections, and
panel (b) plots number of programmed or follow-up inspections (less endogeneous to
conditions at the workplace). While both plots are noisy, neither shows any sign of any
difference in rates of future other inspections.
Figure A.3 graphically tests the effects of a press release on compliance observed at
later inspections. Because the concern that press releases would affect the likelihood of
endogeneous inspections is arguably more salient in this case, these results restrict to
compliance conditional on later non-complaint, -referral or -accident inspections. The
plots are noisy but show no sign of a discontinuous jump in either later violations or
log penalties at the cutoff.
Columns (1)-(3) of Table 8 display corresponding regression results. These regres-
sions estimate Equation 1 with Yit equal to the number of inspections at i following
its inspection with penalties levied at time t over the next 36 months. All regressions
are Intent to Treat (ITT) analysis, in which we compare outcomes of those above and
below the press release cutoff, irrespective of whether a press release is actually issued.
Columns (4)-(5) display the results for compliance conditional on future inspection. In
all cases, the point estimates are quite noisy and are drawn from quite a small sample,
20

and thus we can unfortunately draw little inference from the point estimates.
6 Deterrence Effects: Reputation or Salience?
This section considers mechanisms that could be driving the observed deterrence effects
of press releases on employers’ compliance with OSHA standards.
As described in Section 2, publicity of an employer caught violating safety regula-
tions may damage its reputation with workers, customers, up/down stream firms, or
other stakeholderes. As a result, employers may improve their compliance following
a press release about a peer as a preemptive investment to avoid their own negative
publicity. In other words, publicity imposes an additional cost to OSHA violations,
above and beyond financial penalties levied by OSHA. In this case, press releases in-
centivize employers to improve compliance for the sole purpose of avoiding their own
press release in the future. As a result, issuing press releases about violations should
only affect compliance decisions when expected penalties lie in a neighborhood around
the press release cutoff, and should have no effect on compliance at the tails of the
penalty distribution. This argument is fleshed out below.
Consider an employer who learns OSHA has begun publicizing employers found with
many violations and cited with large penalties. The employer does not know the exact
value of the cutoff rule used by OSHA for issuing press releases, but can infer a rough
sense of it with each additional press release it observes. Further, it knows its financial
penalties if inspected are a stochastic function of its true state of non-compliance. If
the employer’s compliance is such that its expected penalties are sufficiently below the
cutoff, the chance of receiving penalties resulting in a press release are low.Thus, the
marginal benefit of improving its compliance is very small, as it relates to a decrease
in the probability of bad publicity. If improving compliance is costly, we would not
expect this employer to change its state of compliance.
Consider another employer at the other tail of the distribution egregiously out of
compliance with expected penalties well above the cutoff, which would face penalties
in expectation far higher than the (perceived) press release cutoff if inspected, and
thus expects to be publicized with near certainty. Such an employer would have to
dramatically improve compliance to even moderately reduce the chance of having its
violations publicized, and if the cost of remediating violations is costly, we would also
not expect this employer to change its state of compliance.
Finally, consider an employer whose expected penalty in a neighborhood around
the (perceived) press release cutoff. For such an employer, small improvements in
compliance can have large benefits in expectation by discontinuously decreasing the
expected chance of a press release. As a result, we would expect such an employer
21

to actively avoid receiving penalties in a neighborhood around the cutoff and improve
compliance enough so that its expected penalty is sufficiently to the left of the press
release cutoff. Note we would not expect this employer to necessarily improve to perfect
compliance, but rather just enough to avoid the chance of a press release. Of course,
if employers knew the precise value of the press release cutoff (and the cutoff was a
sharp one), and employers could perfectly control the penalties they would receive in
an inspection, we would expect employers to bunch just to the left of the cutoff, but
reasons already discussed in Section 4 suggest this situation is very unlikely.
Thus, the “reputation deterrence” story yields a clear empirical prediction: over
time, as employers have opportounties to view more press releases (and thus infer a
signal of the cutoff rule), we should see little to no improvements in compliance in the
tails of the distribution of OSHA penalties, but we should see a leftward shift in mass
from a neighborhood around the press release cutoff. Figure 7 tests this prediction.
It plots the distribution of penalties for all inspections opened in 2008 in states under
federal OSHA jurisdiction, separately for Regions 1 and 4 (which had been using a
$40,000 cutoff to issue press releases since at least 2000) and Regions 5,6,7 and 8,
which did not begin using a $40,000 (or $45,000) cutoff until 2009, using a kernel density
estimation. The top panel of the figure plots the part of the distribution with penalties
between $0 and $10,000, encompassing the left tail of the distribution nowhere near
the $40,000 cutoff being used in Regions 1 and 4 during this period, and the bottom
panel plots the part of the distribution between $20,000 and $100,000, encompassing
the area surrounding the $40,000 cutoff and the right tail (the mass beyond $100,000 is
minuscule and thus omitted). At the left end of the distribution, there is no evidence
that employers in Regions 1 and 4 improved their compliance relative to those in other
regions. On the other hand, the right panel depicts a clear leftward shift in the mass
away from the area just surrounding the cutoff, while showing no change in the right
tail. In other words, these results support the predictions that, over time, a) employers
obtained a noisy signal of the press release cutoff, and b) improved compliance, but
only in a local neighborhood around the cutoff.
While the changes in the distribution of penalties supports the “reputation deter-
rence” story, it does not rule out alternative mechanisms. The primary alternative
mechanism that could explain the spillover effects, described in Section 2, is reading
a press release about an inspection of one’s peer could change other employers’ beliefs
about the probability of OSHA enforcement (“enforcement deterrence) in two ways.
One way is updating beliefs about the probability of enforcement, either through the
probability of inspection or the expected fine conditional on inspection. If press re-
leases were informing employers OSHA was active in their region and sector, then we
would expect a larger effect in areas with low OSHA activity in the years prior to the
22
introduction of the press release policy.
A second way a press release could change employers’ beliefs about OSHA enforce-
ment is by beliefs over the priorities of enforcement: because press releases provide
detailed descriptions of the specific violations found in an inspection, and the penalty
associated with each violation, a press release could signal that OSHA is “cracking”
down on a particular set of regulations. Under this story, we would expect peers of a
publicized employer to improve compliance with the regulations violated by the publi-
cized employer, relative to other OSHA regulations.
These predictions of the “enforcement deterrence story are tested in Table 7. The
first four columns investigate how the spillover effects of press releases differ by base-
line OSHA enforcement. For each focal inspection, I calculate the number of OSHA
inspections occurring between 2005 and 2008 in its sector and county, and I divide this
number by the county’s working age population from the 2000 Census to get a rough
measure of inspections per worker. I also calculate the 75th percentile of penalties
conditional on inspections between 2005 and 2008 in its sector and county. For each
measure, I split the sample into “high baseline enforcement and “low baseline enforce-
ment” peer groups based on whether a focal inspection lies above or below the median.
The estimated spillover effect of a press release on compliance is essentially identical
for “low” and “high” enforcement groups, defined in terms of inspection per worker,
and when defined in terms of the penalty percentile, the effect is substantially larger
for the high baseline enforcement group, which is the opposite from what would be ex-
pected if spillover effects were operating through updating beliefs about the probability
of enforcement.
Columns 5-6 investigate whether the spillover effects are driven by updating beliefs
over the priorities of OSHA enforcement. For each focal inspection, I identify the set
of OSHA regulations violated, and I calculate the number of “focal” and “non-focal”
violations for each subsequent inspection in the vicinity. If anything, there is a larger
drop in non-focal violations, providing no evidence that spillover effects operate through
updating beliefs about the priorities of enforcement.
Overall, these results suggest the observed responsiveness of compliance to press
releases is due to employers acting to preserve harm to their reputation, rather than
updating their beliefs regarding OSHA enforcement.
7 Conclusion
While a growing literature has found evidence that providing information about firms’
quality leads to quality improvements, less is understood about the deterrence effects
of information provision on non-publicized firms. This paper provided robust, quasi-
23
experimental evidence that publicizing employers which violate safety and health reg-
ulations leads to significantly higher compliance with those regulations among other
employers most likely exposed to the publicity. Furthermore, the evidence overwhelm-
ingly suggests the observed responses are due to employers making defensive invest-
ments to avoid their own publicity, rather than using the information to update their
beliefs about the probability and severity of regulatory enforcement. On the other
hand, the paper did not find that “shaming” led publicized employers to improve their
compliance: while these results may suggest that shaming has asymmetric direct and
deterrence effects, the imprecision of the estimated direct effects due to the small sam-
ple size makes it difficult to credibly interpret the direct effects. This imprecision is
one of the limitations of the paper, and is an important direction for future research.
24

References
[1] Agha, L. and Molitor, D., 2015. The Local Influence of Pioneer Investigators onTechnology Adoption: Evidence from New Cancer Drugs (No. w20878). NationalBureau of Economic Research.
[2] Angrist, Joshua D. and Jorn-Steffen Pischke. 2009. Mostly Harmless Econometrics.Princeton University Press.
[3] Barrage, L., Chyn, E. and Hastings, J., 2016. Advertising as Insurance or Commit-ment? Evidence from the BP Oil Spill manuscript.
[4] Becker, Gary. 1968. Crime and Punishment: An Economic Analysis. Journal ofPolitical Economy 76: 169-217.
[5] Bennear, Lori S., and Sheila M. Olmstead. 2008. The impacts of the right to know:Information disclosure and the violation of drinking water standards. Journal ofEnvironmental Economics and Management 56, no. 2: 117-130.
[6] Board, Simon and Moritz Meyer-ter-Vehn. 2013. Reputation for Quality. Econo-metrica, Vol. 81, No. 6 (November): 2381-2462
[7] Calonico, Sebastian, Matias D. Cattaneo, Roco Titiunik. 2014. Robust Nonpara-metric Confidence Intervals for Regression-Discontinuity Designs, Econometrica82(6): 22952326, November.
[8] Chatterji, A. K., Toffel, M. W. (2010). How firms respond to being rated. StrategicManagement Journal, 31(9), 917-945.
[9] Davis, G.F. and Greve, H.R., 1997. Corporate elite networks and governancechanges in the 1980s. American journal of sociology, 103(1), pp.1-37.
[10] Delmas, Magali, Maria J. Montes-Sancho, Jay P. Shimshack. 2010. MandatoryInformation Disclosure in the Electricity Industry. Economic Inquiry 48(2) (April2010): 483-498.
[11] Dranove, D. and Jin, G.Z., 2010. Quality disclosure and certification: Theory andpractice. Journal of Economic Literature, 48(4), pp.935-963.
[12] Gilbert, Ben, and Joshua Graff Zivin. Dynamic salience with intermittent billing:Evidence from smart electricity meters. Journal of Economic Behavior and Orga-nization (2014).
[13] Gray, W.B. and Jones, C.A., 1991. Longitudinal patterns of compliance with oc-cupational safety and health administration health and safety regulations in themanufacturing sector. Journal of Human Resources, pp.623-653.
[14] Gray, Wayne B. and Jay P. Shimshack. 2011. The Effectivenss of EnvironmentalMonitoring and Enforcement: A Review of the Empirical Evidience. Review ofEnvironmental Economics and Policy, volume 5, issue 1, winter 2011, pp. 324.
25
[15] Hahn, Jinyong, Petra Todd and Wilbert Van der Klaaw. 2001. Identification andEstimation of Treatment Effects with a Regression-Discontinuity Design, Econo-metrica, January, 69 (1), 201209.
[16] Hanna RN, Oliva P. 2010. The impact of inspections on plant-level air emissions.The B.E. Journal of Economic Analysis & Policy 10(1) (Contributions), Article 19.
[17] Jaffe, A. B., Trajtenberg, M., and Henderson, R. 1993. Geographic Localizationof Knowledge Spillovers as Evidenced by Patent Citations. The Quarterly Journalof Economics, 108(3), 577-598.
[18] Jin, Ginger Zhe and Philip Leslie. 2003. The Effect of Information On ProductQuality: Evidence from Restaurant Hygiene Cards. The Quarterly Journal of Eco-nomics, May 2003, 118(2), 409-51.
[19] Karlan, Dean, Margaret McConnell, Sendhil Mullainathan, and Jonathan Zinman.Getting to the top of mind: How reminders increase saving. No. w16205. NationalBureau of Economic Research, 2010.
[20] Ko, K., Mendeloff, J. and Gray, W., 2010. The role of inspection sequence incompliance with the US Occupational Safety and Health Administration’s (OSHA)standards: Interpretations and implications. Regulation & Governance, 4(1), pp.48-70.
[21] Larreguy, Horacio, John Marshall and James M. Snyder Jr. 2014. Revealingmalfeasance: How local media facilitates electoral sanctioning of Mayors in Mexico.NBER Working Paper 20697
[22] Lee, David, and Thomas Lemieux. 2010. Regression Discontinuity Designs in Eco-nomics. Journal of Economic Literature 48(2), June. 281-355.
[23] Malloy, Timothy. 2003. Regulation, Compliance and the Firm. Temple Law Review83: 349-95.
[24] Mas, Alexandre. 2008. Labour Unrest and the Quality of Production: Evidencefrom the Construction Resale Market. Review of Economic Studies 75, 229-258.
[25] McCrary, Justin. 2008. Manipulation of the Running Variable in the RegressionDiscontinuity Design: A Density Test. Journal of Econometrics, Volume 142 , Issue2, February.
[26] Occupational Safety and Health Administration, 2009. OSHA’s Field OperationManual (FOM). Directive Number CPL 02-00-148
[27] Perez-Truglia, Ricardo and Ugo Troiano. 2016. Shaming Tax Delinquents: Theoryand Evidence from a Field Experiment in the United States. NBER working paper.
[28] Ramanarayanan, Subramaniam and Jason Snyder. 2014. Information Disclosureand Firm Performance: Evidence from the Dialysis Industry. Working paper.
26

[29] Rosen, Sherwin. 1986. The Theory of Equalizing Differences. Handbook of LaborEconomics, Volume 1.
[30] Shimshack, J., and M. B. Ward. 2005. Regulator reputation, enforcement, andenvironmental compliance. Journal of Environmental Economics and Management50: 51940.
[31] Snyder, James and Stromberg, David. 2010. Press Coverage and Political Account-ability. Journal of Political Economy. 118(2).
[32] Thornton, D., N. Gunningham, and R. Kagan. 2005. General deterrence and cor-porate environmental behavior. Law and Policy 27: 26288.
[33] Vickers, I., James, P., Smallbone, D., and Baldock, R. 2005. Understanding smallfirm responses to regulation: the case of workplace health and safety. Policy Studies,26(2), 149-169.
[34] Weil, D. 1996. If OSHA Is So Bad, Why Is Compliance So Good? RAND Journalof Economics, Vol. 27, No. 3 (Autumn), pp. 61840.
[35] Weil, D. 2001. Assessing OSHA performance: New evidence from the constructionindustry Journal of Policy Analysis and Management. Vol. 20, Iss. 4.
27
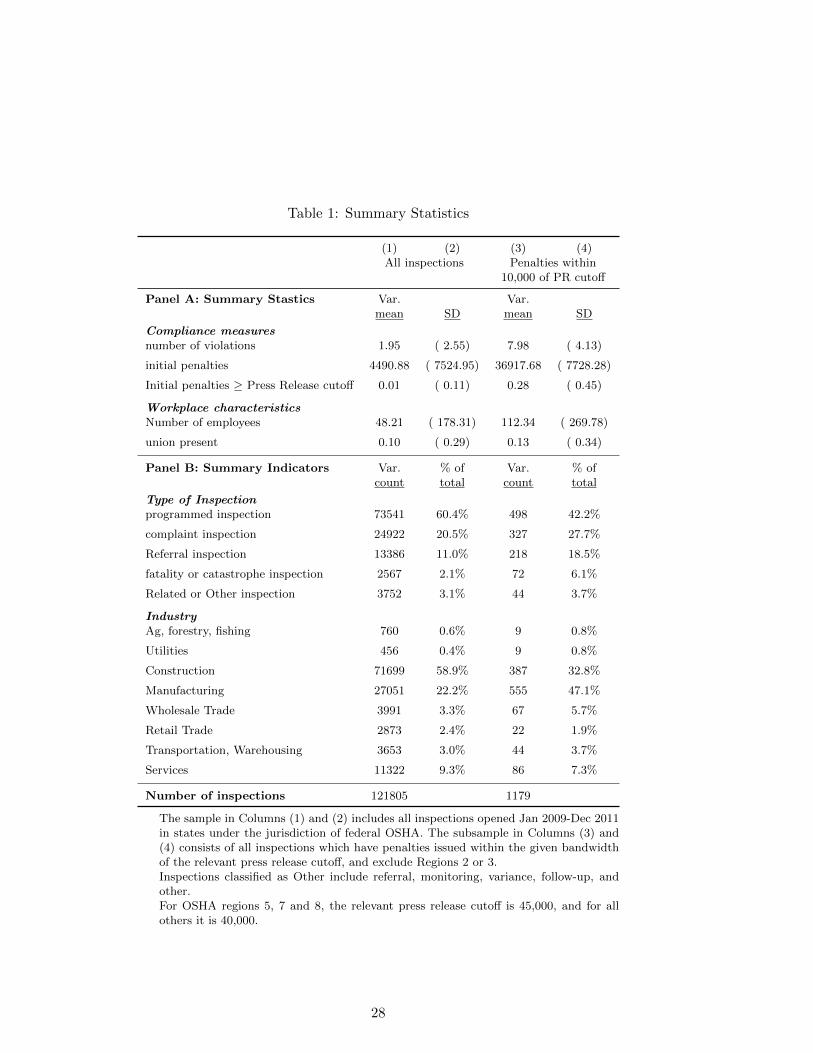
Table 1: Summary Statistics
(1) (2) (3) (4)All inspections Penalties within
10,000 of PR cutoff
Panel A: Summary Stastics Var. Var.mean SD mean SD
Compliance measuresnumber of violations 1.95 ( 2.55) 7.98 ( 4.13)
initial penalties 4490.88 ( 7524.95) 36917.68 ( 7728.28)
Initial penalties ≥ Press Release cutoff 0.01 ( 0.11) 0.28 ( 0.45)
Workplace characteristicsNumber of employees 48.21 ( 178.31) 112.34 ( 269.78)
union present 0.10 ( 0.29) 0.13 ( 0.34)
Panel B: Summary Indicators Var. % of Var. % ofcount total count total
Type of Inspectionprogrammed inspection 73541 60.4% 498 42.2%
complaint inspection 24922 20.5% 327 27.7%
Referral inspection 13386 11.0% 218 18.5%
fatality or catastrophe inspection 2567 2.1% 72 6.1%
Related or Other inspection 3752 3.1% 44 3.7%
IndustryAg, forestry, fishing 760 0.6% 9 0.8%
Utilities 456 0.4% 9 0.8%
Construction 71699 58.9% 387 32.8%
Manufacturing 27051 22.2% 555 47.1%
Wholesale Trade 3991 3.3% 67 5.7%
Retail Trade 2873 2.4% 22 1.9%
Transportation, Warehousing 3653 3.0% 44 3.7%
Services 11322 9.3% 86 7.3%
Number of inspections 121805 1179
The sample in Columns (1) and (2) includes all inspections opened Jan 2009-Dec 2011in states under the jurisdiction of federal OSHA. The subsample in Columns (3) and(4) consists of all inspections which have penalties issued within the given bandwidthof the relevant press release cutoff, and exclude Regions 2 or 3.Inspections classified as Other include referral, monitoring, variance, follow-up, andother.For OSHA regions 5, 7 and 8, the relevant press release cutoff is 45,000, and for allothers it is 40,000.
28

Table 2: Smoothness of covariates around press release cutoff
(1) (2) (3) (4) (5) (6) (7)Press Comp- Fat- ln union # prior # prior
Release laint Cat (emp) present inspec- viol-(First Insp Insp tions ationsstage)
Penalty≥ c 0.21 0.041 -0.0015 0.30 0.0029 0.24 0.68(0.050)** (0.055) (0.033) (0.20) (0.039) (0.19) (1.23)
Obs 1122 1122 1122 1122 1122 1122 1122Obs Pen≥ c 349 349 349 349 349 349 349Obs Pen< c 773 773 773 773 773 773 773Control Mean 0.066 0.29 0.067 3.10 0.12 0.61 4.05
The sample is restricted to inspections with penalties issued between May 2009-Dec2011. All specifications use a window around the PR cutoff of 10,000.The coefficients estimate the magnitude of the change in the dependent variablefor inspections with penalties issued at the press release cutoff. Each coefficient isestimated in a separate regression which controls linearly for penalty with differentslopes on each side of the cutoff. Robust standard errors, in parentehses, clusteredat initial penalty. +P<.1, *P<.05, **P<.01.For OSHA regions 5, 7 and 8, the relevant cutoff is 45,000, and for all others it is40,000.Count variables topcoded at 99th percentiles.
29

Table 3: The General Deterrence Effect of a press release on compliance of all other employers within a 5 kilometer radius and inthe same sector (peers)
(1) (2) (3) (4) (5) (6) (7)Number of later inspections in vicinity Compliance conditional on later inspection
(unit of analysis (unit of analysis = inspection of=focal inspection) =employer in vicinity
# # complaint, # # ln(pen- # ln(pen-inspect- referral, other viols alties) viols alties)
ions accident inspsinsps
Post inspection of peer with Pen≥ c -1.16 -1.90 0.74 -0.56 -0.37(2.89) (1.61) (1.88) (0.19)** (0.15)*
0-6 months post pen≥ c -0.50 -0.35(0.18)** (0.15)*
6-12 months post pen≥ c -0.69 -0.38(0.19)** (0.15)*
12-24 months post pen≥ c -0.45 -0.34(0.20)* (0.15)*
24-36 months post pen≥ c -0.73 -0.55(0.19)** (0.16)**
Obs 1064 1064 1064 19214 19214 19214 19214obs Pen≥ c 331 331 331 5002 5002 5002 5002obs Pen< c 733 733 733 14212 14212 14212 14212Control Mean 19.3 7.12 12.2 2.21 7.40 2.21 7.40
All regressions use a bandwidth around the press release cutoff of 10,000 and include a construction dummy and focal yearand region fixed effects. The running variable is the penalty issued at the focal inspection. All regressions exclude theemployer responsible for the focal penalty. The sample period is restricted to August 2009-September 2013, to inspectionsfollowing the date the focal penalty was issued, and to focal penalties issued between August 2009 and September 2012.Regions 2 and 3 not included.Each coefficient is estimated in a separate regression which controls linearly for the focal penalty with different slopes oneach side of the cutoff. Robust standard errors clustered by peer group +P<.1, *P<.05, **P<.01.For OSHA regions 5, 7 and 8, the relevant cutoff is 45,000, and for all others it is 40,000. Count variables topcoded at 99thpercentiles, logged variables add the first non-zero percentile to accommodate zeroes.
30
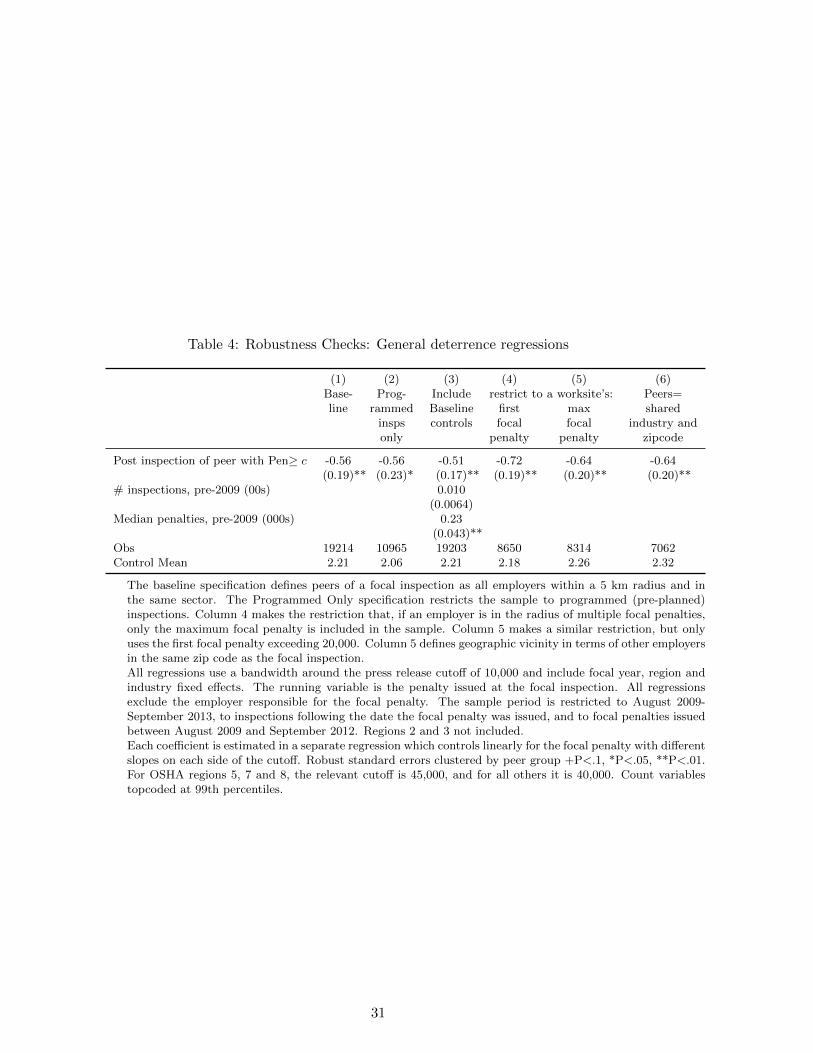
Table 4: Robustness Checks: General deterrence regressions
(1) (2) (3) (4) (5) (6)Base- Prog- Include restrict to a worksite’s: Peers=line rammed Baseline first max shared
insps controls focal focal industry andonly penalty penalty zipcode
Post inspection of peer with Pen≥ c -0.56 -0.56 -0.51 -0.72 -0.64 -0.64(0.19)** (0.23)* (0.17)** (0.19)** (0.20)** (0.20)**
# inspections, pre-2009 (00s) 0.010(0.0064)
Median penalties, pre-2009 (000s) 0.23(0.043)**
Obs 19214 10965 19203 8650 8314 7062Control Mean 2.21 2.06 2.21 2.18 2.26 2.32
The baseline specification defines peers of a focal inspection as all employers within a 5 km radius and inthe same sector. The Programmed Only specification restricts the sample to programmed (pre-planned)inspections. Column 4 makes the restriction that, if an employer is in the radius of multiple focal penalties,only the maximum focal penalty is included in the sample. Column 5 makes a similar restriction, but onlyuses the first focal penalty exceeding 20,000. Column 5 defines geographic vicinity in terms of other employersin the same zip code as the focal inspection.All regressions use a bandwidth around the press release cutoff of 10,000 and include focal year, region andindustry fixed effects. The running variable is the penalty issued at the focal inspection. All regressionsexclude the employer responsible for the focal penalty. The sample period is restricted to August 2009-September 2013, to inspections following the date the focal penalty was issued, and to focal penalties issuedbetween August 2009 and September 2012. Regions 2 and 3 not included.Each coefficient is estimated in a separate regression which controls linearly for the focal penalty with differentslopes on each side of the cutoff. Robust standard errors clustered by peer group +P<.1, *P<.05, **P<.01.For OSHA regions 5, 7 and 8, the relevant cutoff is 45,000, and for all others it is 40,000. Count variablestopcoded at 99th percentiles.
31
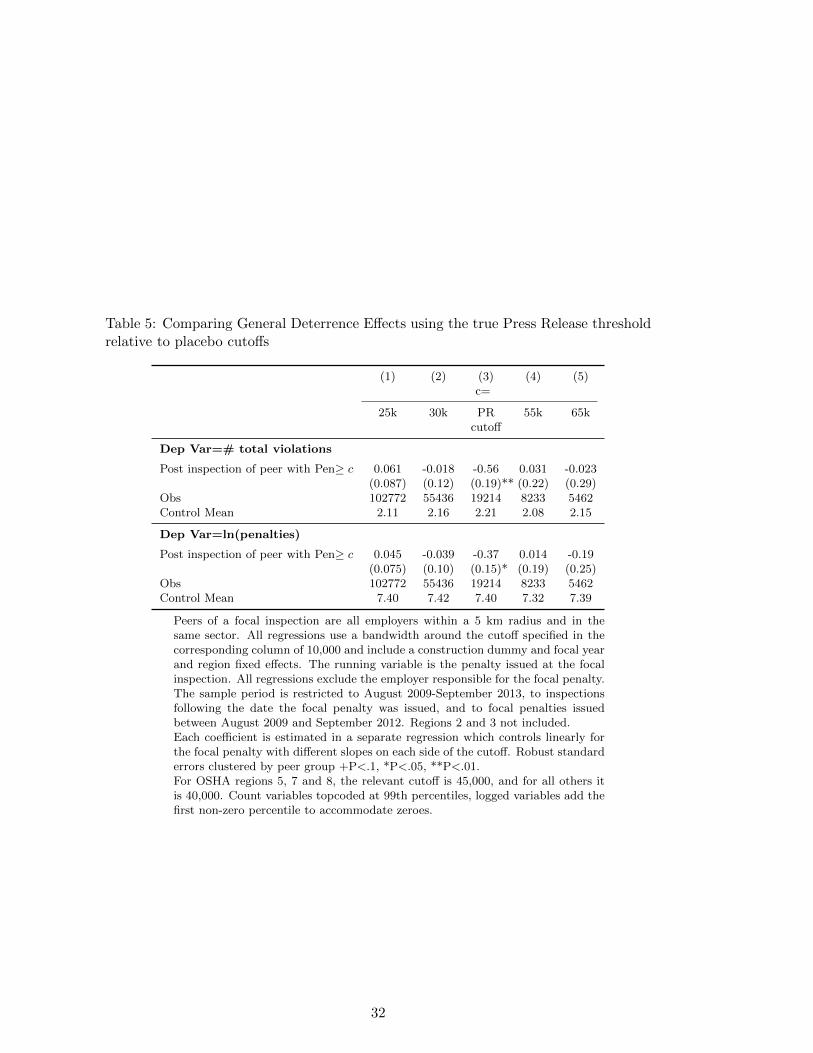
Table 5: Comparing General Deterrence Effects using the true Press Release thresholdrelative to placebo cutoffs
(1) (2) (3) (4) (5)c=
25k 30k PR 55k 65kcutoff
Dep Var=# total violations
Post inspection of peer with Pen≥ c 0.061 -0.018 -0.56 0.031 -0.023(0.087) (0.12) (0.19)** (0.22) (0.29)
Obs 102772 55436 19214 8233 5462Control Mean 2.11 2.16 2.21 2.08 2.15
Dep Var=ln(penalties)
Post inspection of peer with Pen≥ c 0.045 -0.039 -0.37 0.014 -0.19(0.075) (0.10) (0.15)* (0.19) (0.25)
Obs 102772 55436 19214 8233 5462Control Mean 7.40 7.42 7.40 7.32 7.39
Peers of a focal inspection are all employers within a 5 km radius and in thesame sector. All regressions use a bandwidth around the cutoff specified in thecorresponding column of 10,000 and include a construction dummy and focal yearand region fixed effects. The running variable is the penalty issued at the focalinspection. All regressions exclude the employer responsible for the focal penalty.The sample period is restricted to August 2009-September 2013, to inspectionsfollowing the date the focal penalty was issued, and to focal penalties issuedbetween August 2009 and September 2012. Regions 2 and 3 not included.Each coefficient is estimated in a separate regression which controls linearly forthe focal penalty with different slopes on each side of the cutoff. Robust standarderrors clustered by peer group +P<.1, *P<.05, **P<.01.For OSHA regions 5, 7 and 8, the relevant cutoff is 45,000, and for all others itis 40,000. Count variables topcoded at 99th percentiles, logged variables add thefirst non-zero percentile to accommodate zeroes.
32
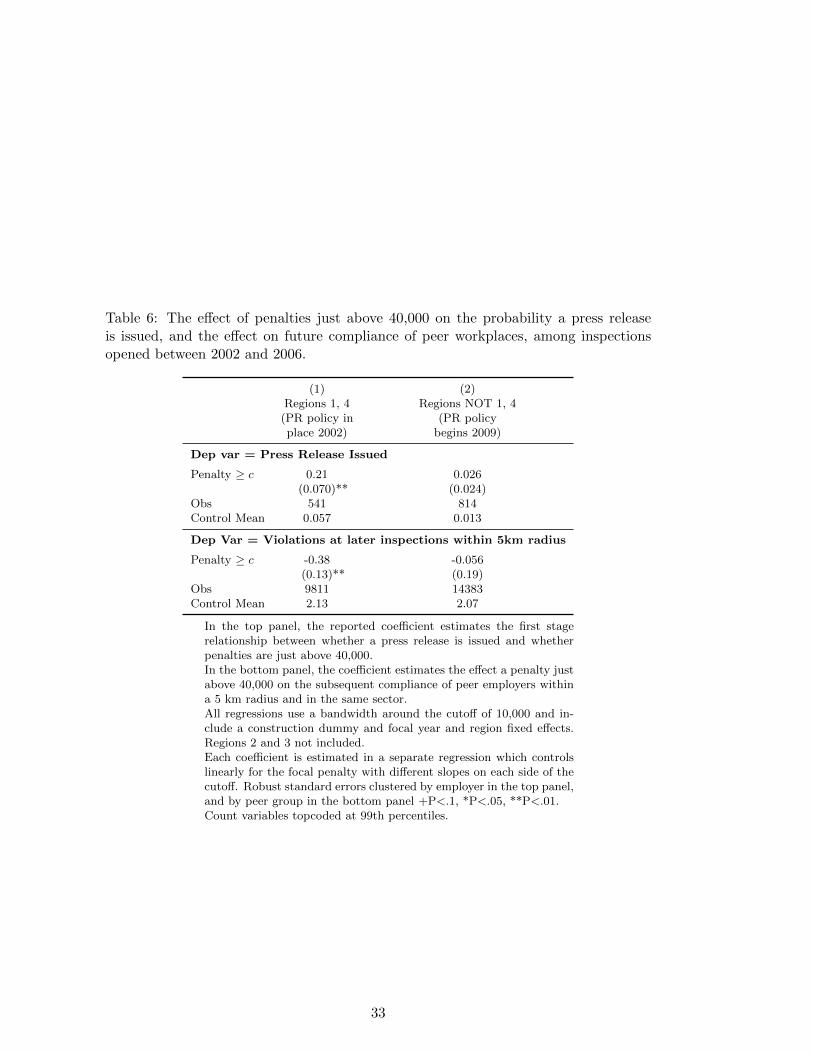
Table 6: The effect of penalties just above 40,000 on the probability a press releaseis issued, and the effect on future compliance of peer workplaces, among inspectionsopened between 2002 and 2006.
(1) (2)Regions 1, 4 Regions NOT 1, 4
(PR policy in (PR policyplace 2002) begins 2009)
Dep var = Press Release Issued
Penalty ≥ c 0.21 0.026(0.070)** (0.024)
Obs 541 814Control Mean 0.057 0.013
Dep Var = Violations at later inspections within 5km radius
Penalty ≥ c -0.38 -0.056(0.13)** (0.19)
Obs 9811 14383Control Mean 2.13 2.07
In the top panel, the reported coefficient estimates the first stagerelationship between whether a press release is issued and whetherpenalties are just above 40,000.In the bottom panel, the coefficient estimates the effect a penalty justabove 40,000 on the subsequent compliance of peer employers withina 5 km radius and in the same sector.All regressions use a bandwidth around the cutoff of 10,000 and in-clude a construction dummy and focal year and region fixed effects.Regions 2 and 3 not included.Each coefficient is estimated in a separate regression which controlslinearly for the focal penalty with different slopes on each side of thecutoff. Robust standard errors clustered by employer in the top panel,and by peer group in the bottom panel +P<.1, *P<.05, **P<.01.Count variables topcoded at 99th percentiles.
33
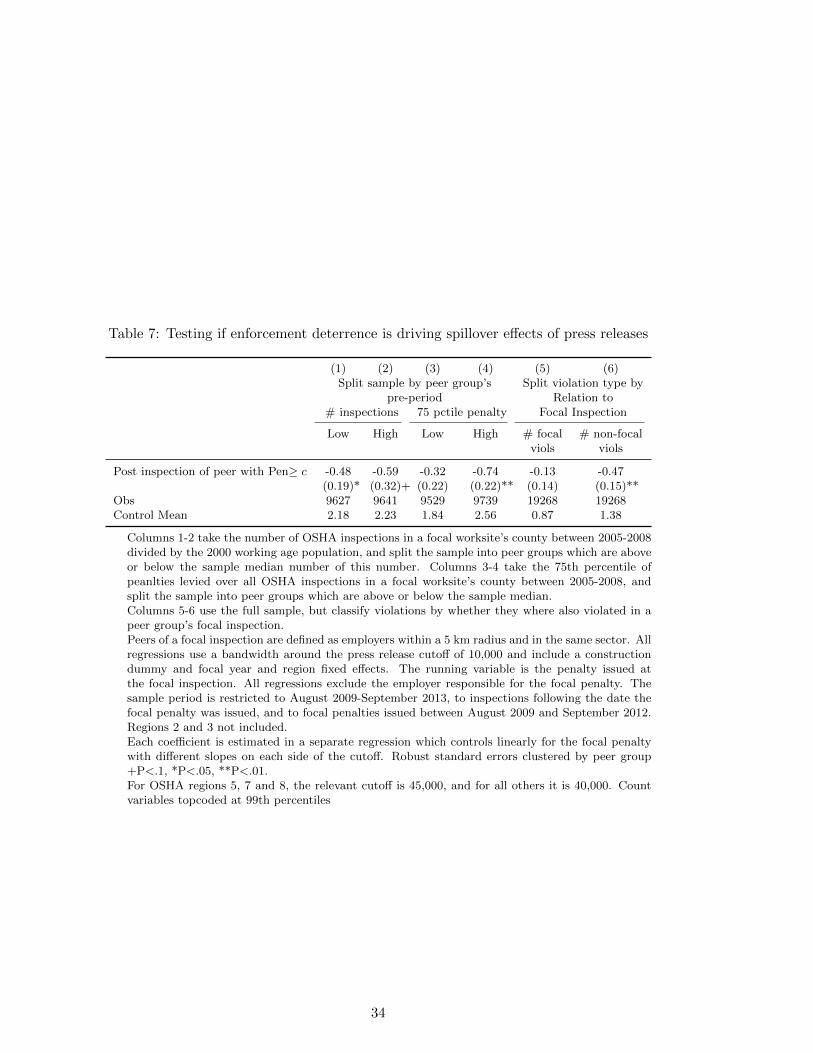
Table 7: Testing if enforcement deterrence is driving spillover effects of press releases
(1) (2) (3) (4) (5) (6)Split sample by peer group’s Split violation type by
pre-period Relation to# inspections 75 pctile penalty Focal Inspection
Low High Low High # focal # non-focalviols viols
Post inspection of peer with Pen≥ c -0.48 -0.59 -0.32 -0.74 -0.13 -0.47(0.19)* (0.32)+ (0.22) (0.22)** (0.14) (0.15)**
Obs 9627 9641 9529 9739 19268 19268Control Mean 2.18 2.23 1.84 2.56 0.87 1.38
Columns 1-2 take the number of OSHA inspections in a focal worksite’s county between 2005-2008divided by the 2000 working age population, and split the sample into peer groups which are aboveor below the sample median number of this number. Columns 3-4 take the 75th percentile ofpeanlties levied over all OSHA inspections in a focal worksite’s county between 2005-2008, andsplit the sample into peer groups which are above or below the sample median.Columns 5-6 use the full sample, but classify violations by whether they where also violated in apeer group’s focal inspection.Peers of a focal inspection are defined as employers within a 5 km radius and in the same sector. Allregressions use a bandwidth around the press release cutoff of 10,000 and include a constructiondummy and focal year and region fixed effects. The running variable is the penalty issued atthe focal inspection. All regressions exclude the employer responsible for the focal penalty. Thesample period is restricted to August 2009-September 2013, to inspections following the date thefocal penalty was issued, and to focal penalties issued between August 2009 and September 2012.Regions 2 and 3 not included.Each coefficient is estimated in a separate regression which controls linearly for the focal penaltywith different slopes on each side of the cutoff. Robust standard errors clustered by peer group+P<.1, *P<.05, **P<.01.For OSHA regions 5, 7 and 8, the relevant cutoff is 45,000, and for all others it is 40,000. Countvariables topcoded at 99th percentiles
34
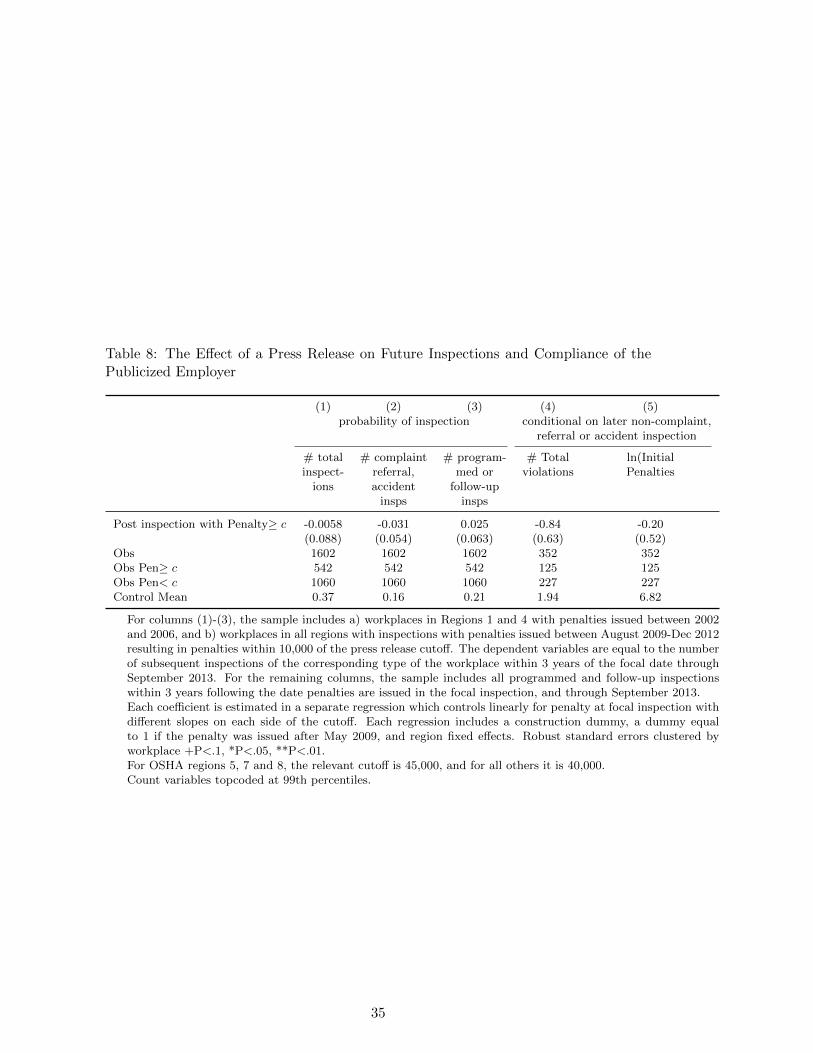
Table 8: The Effect of a Press Release on Future Inspections and Compliance of thePublicized Employer
(1) (2) (3) (4) (5)probability of inspection conditional on later non-complaint,
referral or accident inspection
# total # complaint # program- # Total ln(Initialinspect- referral, med or violations Penalties
ions accident follow-upinsps insps
Post inspection with Penalty≥ c -0.0058 -0.031 0.025 -0.84 -0.20(0.088) (0.054) (0.063) (0.63) (0.52)
Obs 1602 1602 1602 352 352Obs Pen≥ c 542 542 542 125 125Obs Pen< c 1060 1060 1060 227 227Control Mean 0.37 0.16 0.21 1.94 6.82
For columns (1)-(3), the sample includes a) workplaces in Regions 1 and 4 with penalties issued between 2002and 2006, and b) workplaces in all regions with inspections with penalties issued between August 2009-Dec 2012resulting in penalties within 10,000 of the press release cutoff. The dependent variables are equal to the numberof subsequent inspections of the corresponding type of the workplace within 3 years of the focal date throughSeptember 2013. For the remaining columns, the sample includes all programmed and follow-up inspectionswithin 3 years following the date penalties are issued in the focal inspection, and through September 2013.Each coefficient is estimated in a separate regression which controls linearly for penalty at focal inspection withdifferent slopes on each side of the cutoff. Each regression includes a construction dummy, a dummy equalto 1 if the penalty was issued after May 2009, and region fixed effects. Robust standard errors clustered byworkplace +P<.1, *P<.05, **P<.01.For OSHA regions 5, 7 and 8, the relevant cutoff is 45,000, and for all others it is 40,000.Count variables topcoded at 99th percentiles.
35
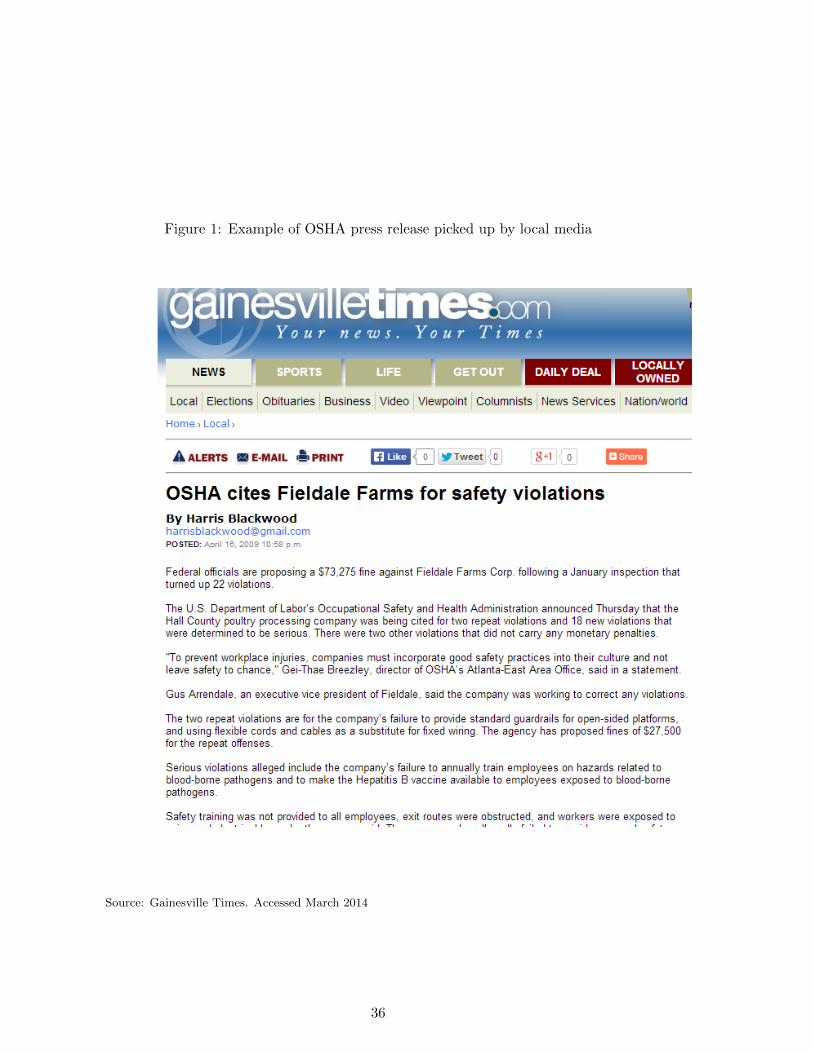
Figure 1: Example of OSHA press release picked up by local media
Source: Gainesville Times. Accessed March 2014
36
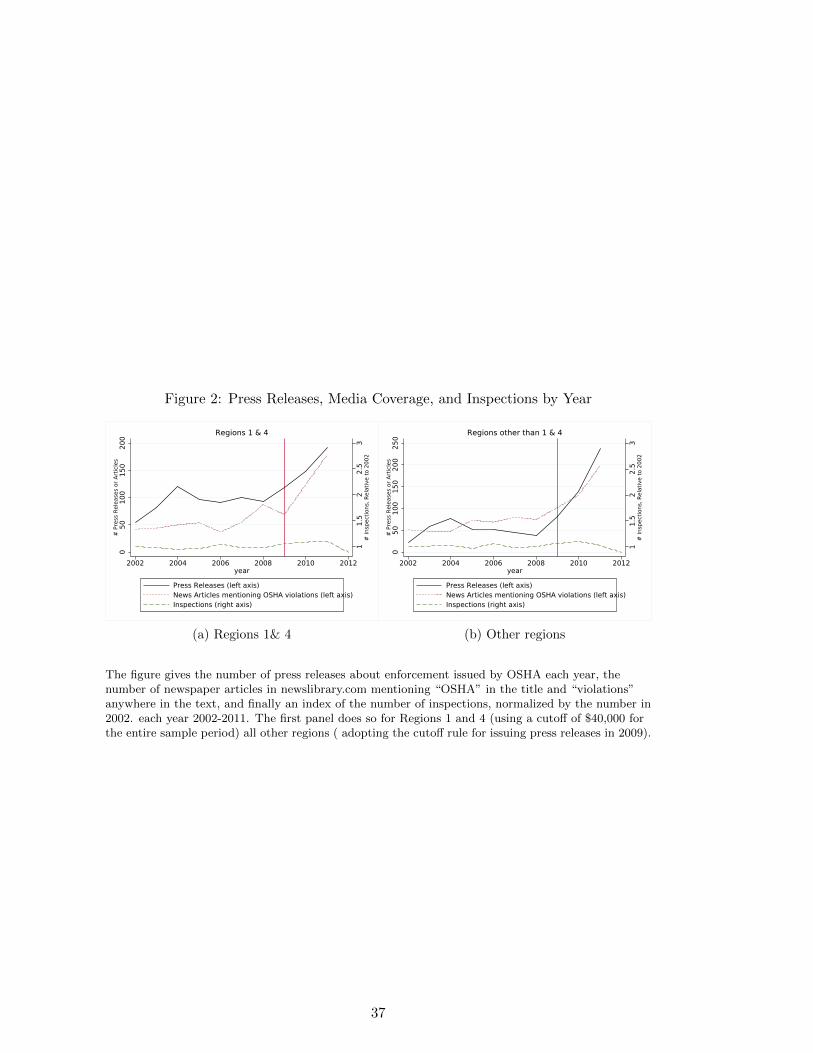
Figure 2: Press Releases, Media Coverage, and Inspections by Year
11.
52
2.5
3#
Insp
ectio
ns, R
elat
ive
to 2
002
050
100
150
200
# P
ress
Rel
ease
s or
Art
icle
s
2002 2004 2006 2008 2010 2012year
Press Releases (left axis)News Articles mentioning OSHA violations (left axis)Inspections (right axis)
Regions 1 & 4
(a) Regions 1& 41
1.5
22.
53
# In
spec
tions
, Rel
ativ
e to
200
2
050
100
150
200
250
# P
ress
Rel
ease
s or
Art
icle
s
2002 2004 2006 2008 2010 2012year
Press Releases (left axis)News Articles mentioning OSHA violations (left axis)Inspections (right axis)
Regions other than 1 & 4
(b) Other regions
The figure gives the number of press releases about enforcement issued by OSHA each year, thenumber of newspaper articles in newslibrary.com mentioning “OSHA” in the title and “violations”anywhere in the text, and finally an index of the number of inspections, normalized by the number in2002. each year 2002-2011. The first panel does so for Regions 1 and 4 (using a cutoff of $40,000 forthe entire sample period) all other regions ( adopting the cutoff rule for issuing press releases in 2009).
37
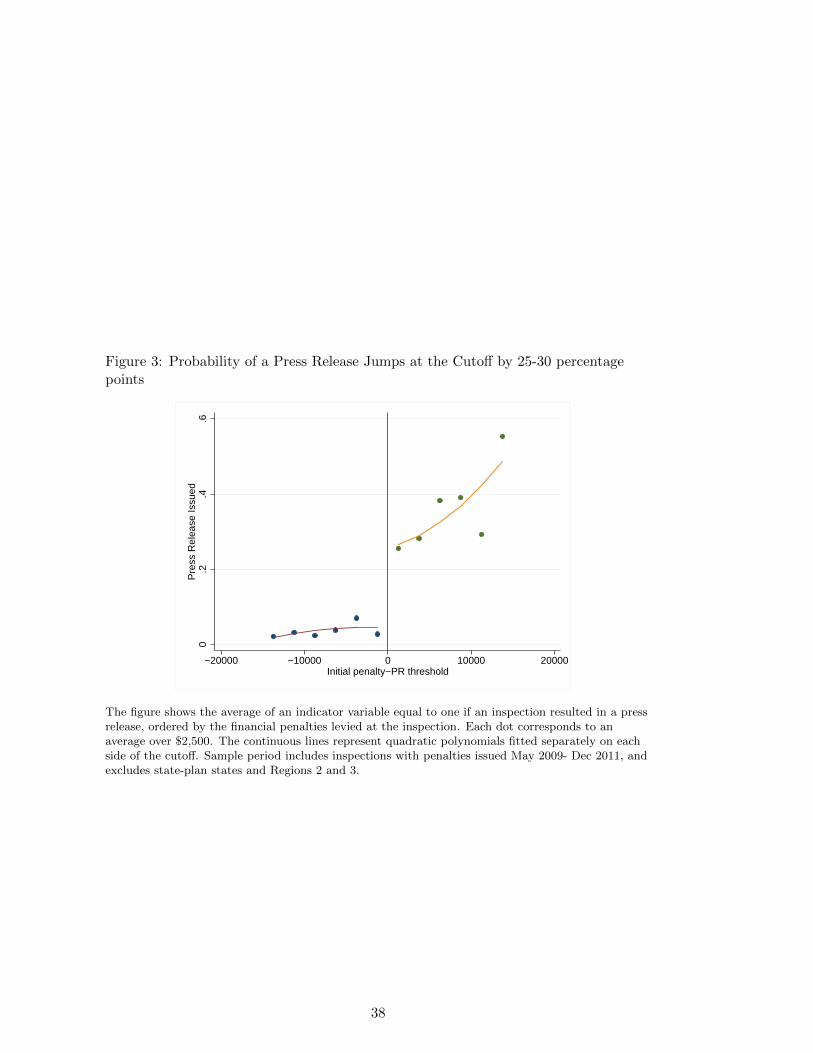
Figure 3: Probability of a Press Release Jumps at the Cutoff by 25-30 percentagepoints
0.2
.4.6
Pre
ss R
elea
se Is
sued
−20000 −10000 0 10000 20000Initial penalty−PR threshold
The figure shows the average of an indicator variable equal to one if an inspection resulted in a pressrelease, ordered by the financial penalties levied at the inspection. Each dot corresponds to anaverage over $2,500. The continuous lines represent quadratic polynomials fitted separately on eachside of the cutoff. Sample period includes inspections with penalties issued May 2009- Dec 2011, andexcludes state-plan states and Regions 2 and 3.
38
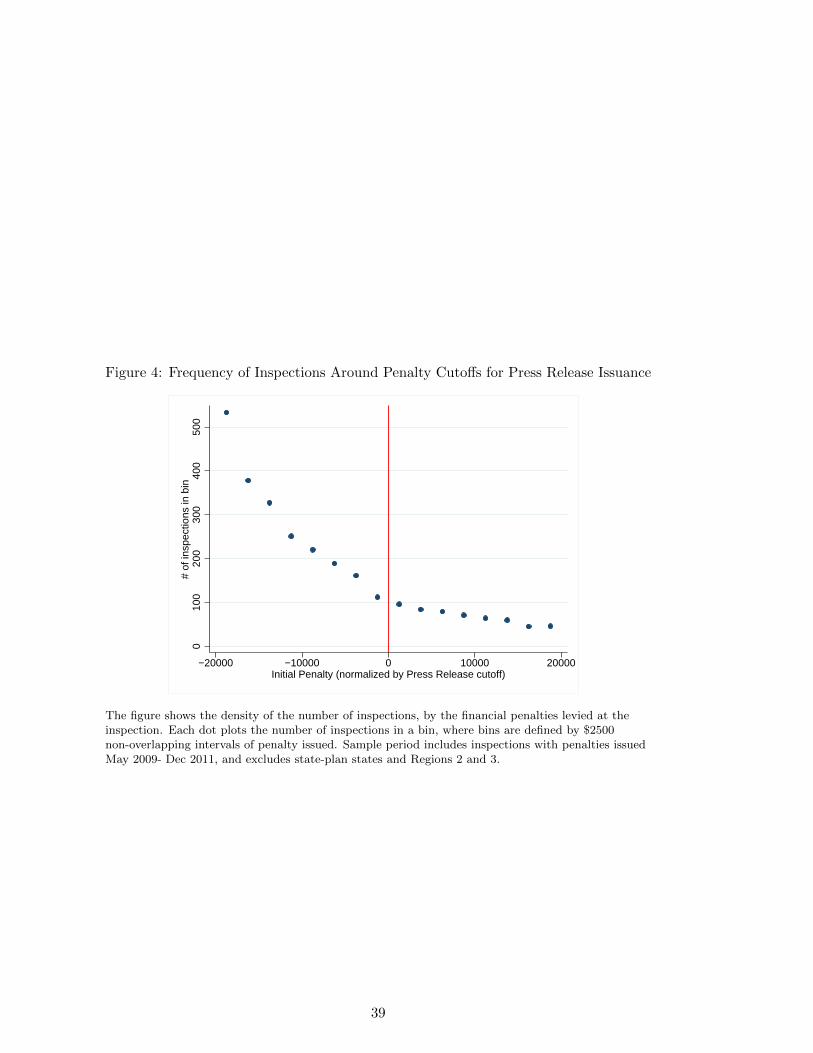
Figure 4: Frequency of Inspections Around Penalty Cutoffs for Press Release Issuance
010
020
030
040
050
0#
of in
spec
tions
in b
in
−20000 −10000 0 10000 20000Initial Penalty (normalized by Press Release cutoff)
The figure shows the density of the number of inspections, by the financial penalties levied at theinspection. Each dot plots the number of inspections in a bin, where bins are defined by $2500non-overlapping intervals of penalty issued. Sample period includes inspections with penalties issuedMay 2009- Dec 2011, and excludes state-plan states and Regions 2 and 3.
39
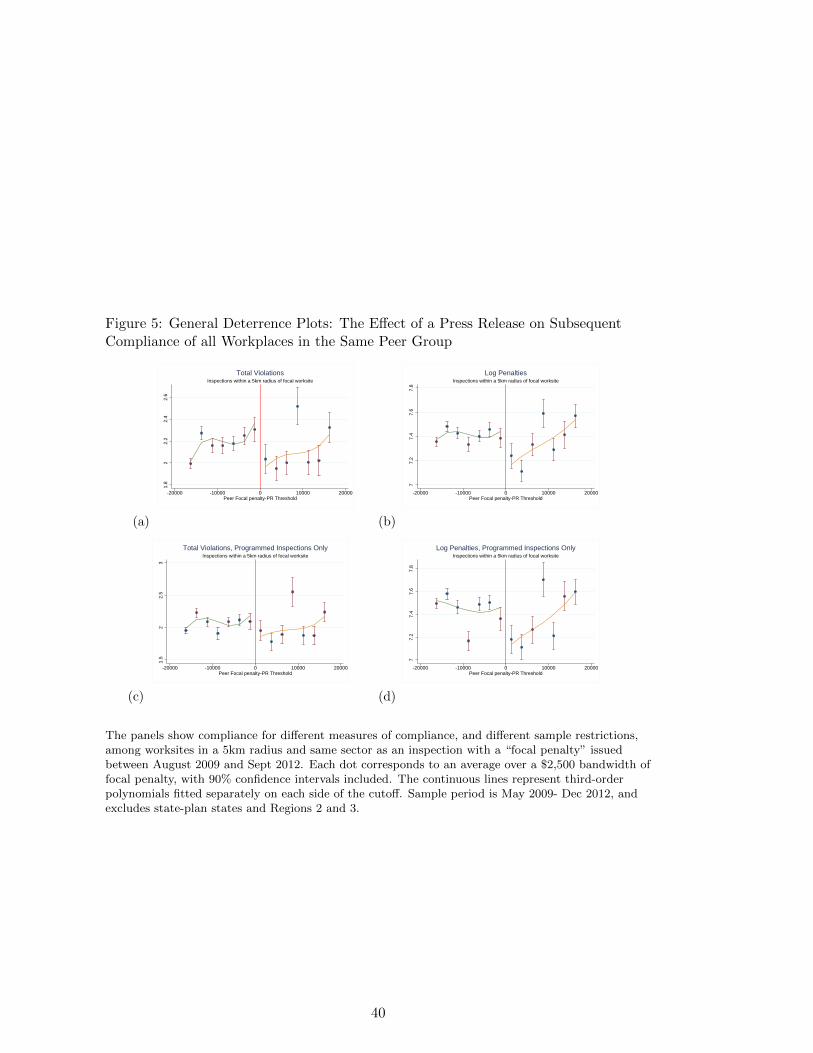
Figure 5: General Deterrence Plots: The Effect of a Press Release on SubsequentCompliance of all Workplaces in the Same Peer Group
1.8
22.
22.
42.
6
-20000 -10000 0 10000 20000Peer Focal penalty-PR Threshold
Inspections within a 5km radius of focal worksite
Total Violations
(a)
77.
27.
47.
67.
8
-20000 -10000 0 10000 20000Peer Focal penalty-PR Threshold
Inspections within a 5km radius of focal worksite
Log Penalties
(b)
1.5
22.
53
-20000 -10000 0 10000 20000Peer Focal penalty-PR Threshold
Inspections within a 5km radius of focal worksite
Total Violations, Programmed Inspections Only
(c)
77.
27.
47.
67.
8
-20000 -10000 0 10000 20000Peer Focal penalty-PR Threshold
Inspections within a 5km radius of focal worksite
Log Penalties, Programmed Inspections Only
(d)
The panels show compliance for different measures of compliance, and different sample restrictions,among worksites in a 5km radius and same sector as an inspection with a “focal penalty” issuedbetween August 2009 and Sept 2012. Each dot corresponds to an average over a $2,500 bandwidth offocal penalty, with 90% confidence intervals included. The continuous lines represent third-orderpolynomials fitted separately on each side of the cutoff. Sample period is May 2009- Dec 2012, andexcludes state-plan states and Regions 2 and 3.
40
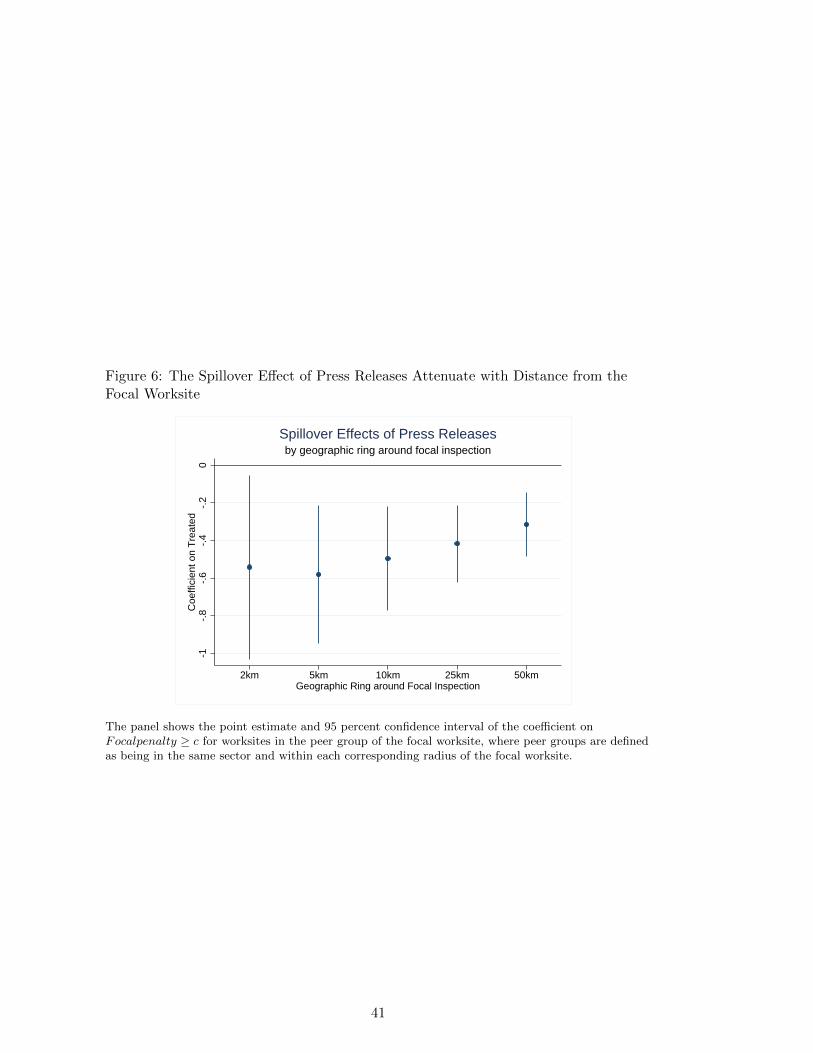
Figure 6: The Spillover Effect of Press Releases Attenuate with Distance from theFocal Worksite
-1-.
8-.
6-.
4-.
20
Coe
ffici
ent o
n T
reat
ed
2km 5km 10km 25km 50kmGeographic Ring around Focal Inspection
by geographic ring around focal inspectionSpillover Effects of Press Releases
The panel shows the point estimate and 95 percent confidence interval of the coefficient onFocalpenalty ≥ c for worksites in the peer group of the focal worksite, where peer groups are definedas being in the same sector and within each corresponding radius of the focal worksite.
41
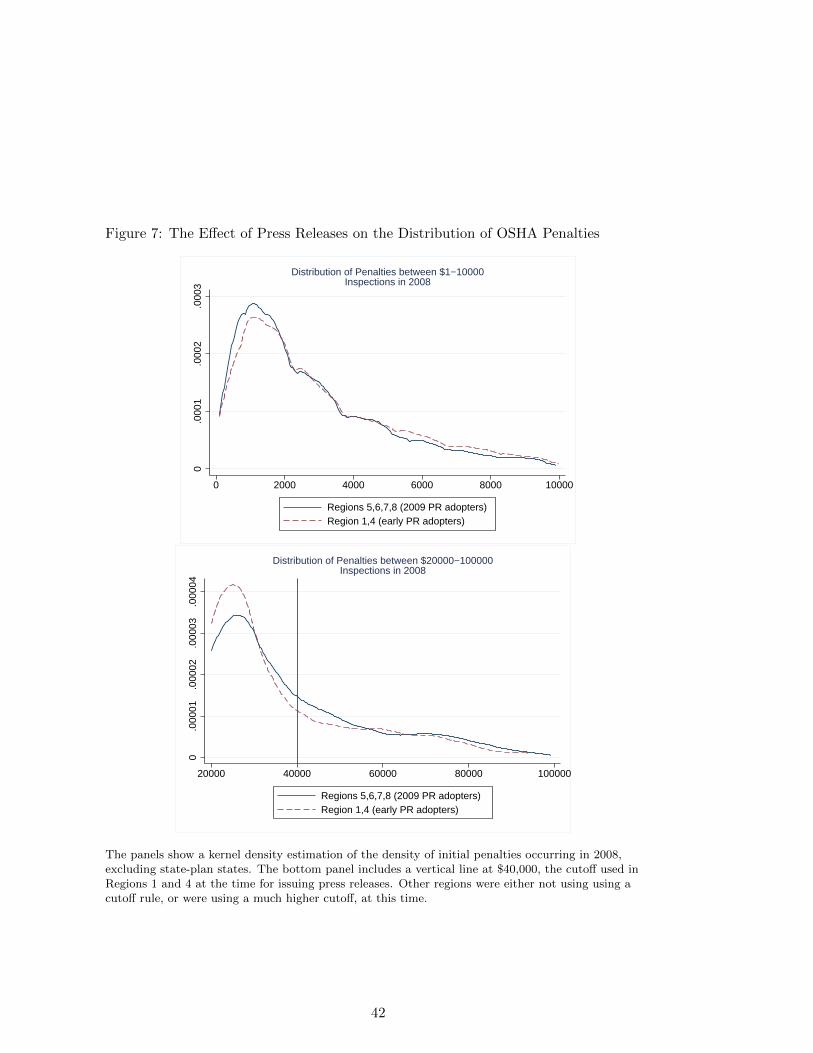
Figure 7: The Effect of Press Releases on the Distribution of OSHA Penalties
0.0
001
.000
2.0
003
0 2000 4000 6000 8000 10000
Regions 5,6,7,8 (2009 PR adopters)Region 1,4 (early PR adopters)
Distribution of Penalties between $1−10000Inspections in 2008
0.0
0001
.000
02.0
0003
.000
04
20000 40000 60000 80000 100000
Regions 5,6,7,8 (2009 PR adopters)Region 1,4 (early PR adopters)
Distribution of Penalties between $20000−100000Inspections in 2008
The panels show a kernel density estimation of the density of initial penalties occurring in 2008,excluding state-plan states. The bottom panel includes a vertical line at $40,000, the cutoff used inRegions 1 and 4 at the time for issuing press releases. Other regions were either not using using acutoff rule, or were using a much higher cutoff, at this time.
42

A Appendix Tables and Figures
Table A.1: Results using rdrobust package
(1) (2)VARIABLES Viols Penalties
RD Estimate -0.424 -0.260
Observations 14196 17347Robust 95% CI [-.69 ; -.13] [-.47 ; -.07]Kernel Type Triangular TriangularRobust Std. Error 0.144 0.102Robust p-value 0.00432 0.00871Order Loc. Poly. (p) 1 1BW Loc. Poly. (h) 7277 9059
Standard errors in parentheses
43
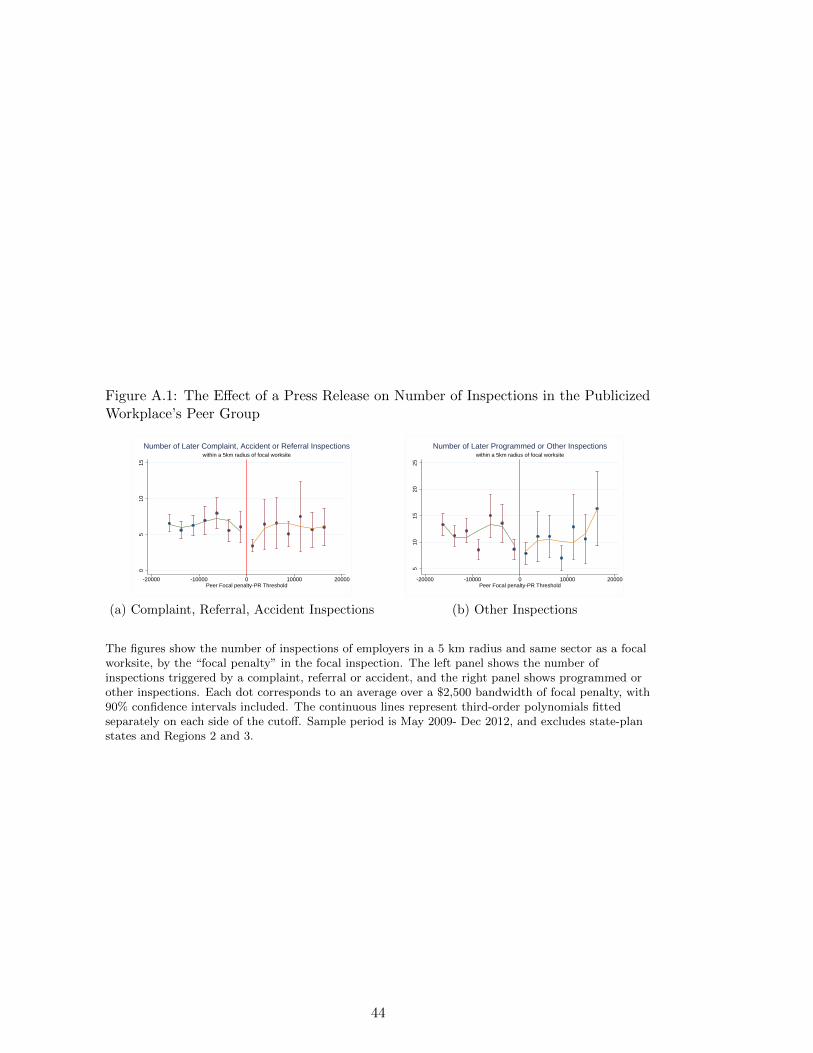
Figure A.1: The Effect of a Press Release on Number of Inspections in the PublicizedWorkplace’s Peer Group
05
1015
-20000 -10000 0 10000 20000Peer Focal penalty-PR Threshold
within a 5km radius of focal worksite
Number of Later Complaint, Accident or Referral Inspections
(a) Complaint, Referral, Accident Inspections
510
1520
25
-20000 -10000 0 10000 20000Peer Focal penalty-PR Threshold
within a 5km radius of focal worksite
Number of Later Programmed or Other Inspections
(b) Other Inspections
The figures show the number of inspections of employers in a 5 km radius and same sector as a focalworksite, by the “focal penalty” in the focal inspection. The left panel shows the number ofinspections triggered by a complaint, referral or accident, and the right panel shows programmed orother inspections. Each dot corresponds to an average over a $2,500 bandwidth of focal penalty, with90% confidence intervals included. The continuous lines represent third-order polynomials fittedseparately on each side of the cutoff. Sample period is May 2009- Dec 2012, and excludes state-planstates and Regions 2 and 3.
44

Figure A.2: The Effect of a Press Release on Later Inspections of the PublicizedWorkplace
0.5
-20000 -10000 0 10000 20000Peer Focal penalty-PR Threshold
at Focal worksite
Number of Later Complaint, Accident or Referral Inspections
(a) Complaint, Referral, Accident Inspections
0.2
.4.6
-20000 -10000 0 10000 20000Peer Focal penalty-PR Threshold
at Focal worksite
Number of Later Programmed or Other Inspections
(b) Other Inspections
The figures show the number of later inspections of a worksite, by the “focal penalty” in the focalinspection. The left panel shows the number of inspections triggered by a complaint, referral oraccident, and the right panel shows programmed or other inspections. Each dot corresponds to anaverage over a $2,500 bandwidth of focal penalty, with 90% confidence intervals included. Thecontinuous lines represent third-order polynomials fitted separately on each side of the cutoff. Sampleperiod is May 2009- Dec 2012, and excludes state-plan states and Regions 2 and 3.
45
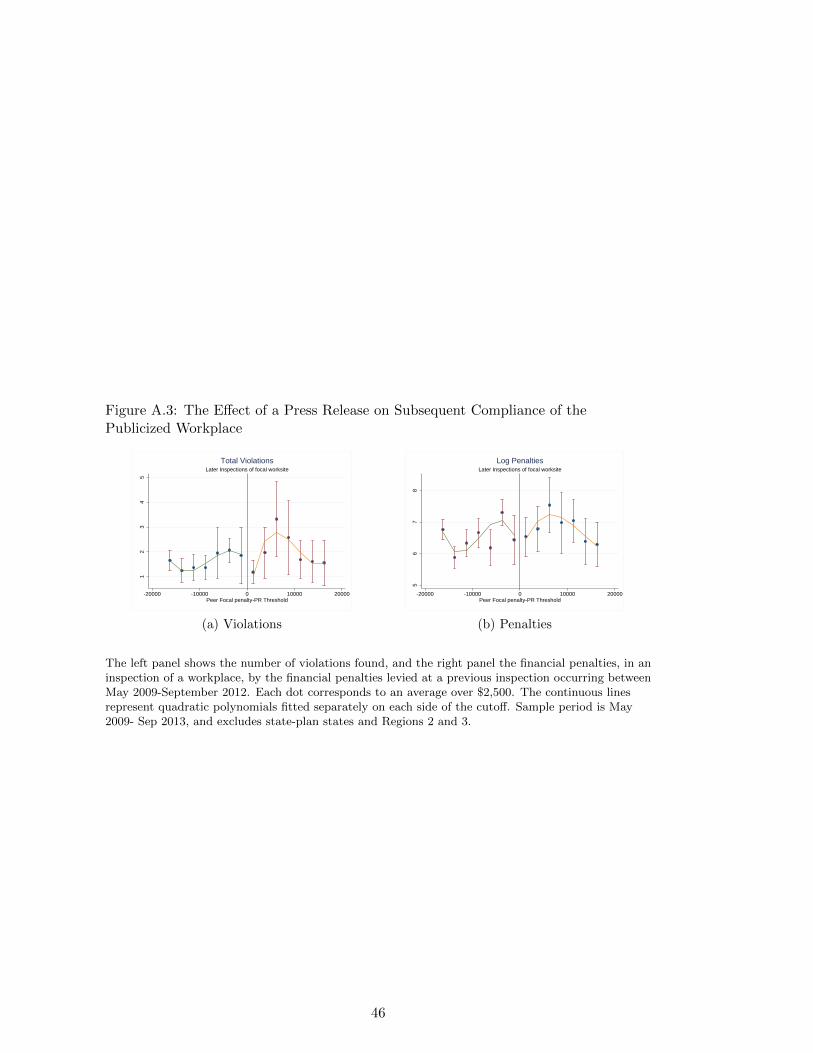
Figure A.3: The Effect of a Press Release on Subsequent Compliance of thePublicized Workplace
12
34
5
-20000 -10000 0 10000 20000Peer Focal penalty-PR Threshold
Later Inspections of focal worksite
Total Violations
(a) Violations
56
78
-20000 -10000 0 10000 20000Peer Focal penalty-PR Threshold
Later Inspections of focal worksite
Log Penalties
(b) Penalties
The left panel shows the number of violations found, and the right panel the financial penalties, in aninspection of a workplace, by the financial penalties levied at a previous inspection occurring betweenMay 2009-September 2012. Each dot corresponds to an average over $2,500. The continuous linesrepresent quadratic polynomials fitted separately on each side of the cutoff. Sample period is May2009- Sep 2013, and excludes state-plan states and Regions 2 and 3.
46
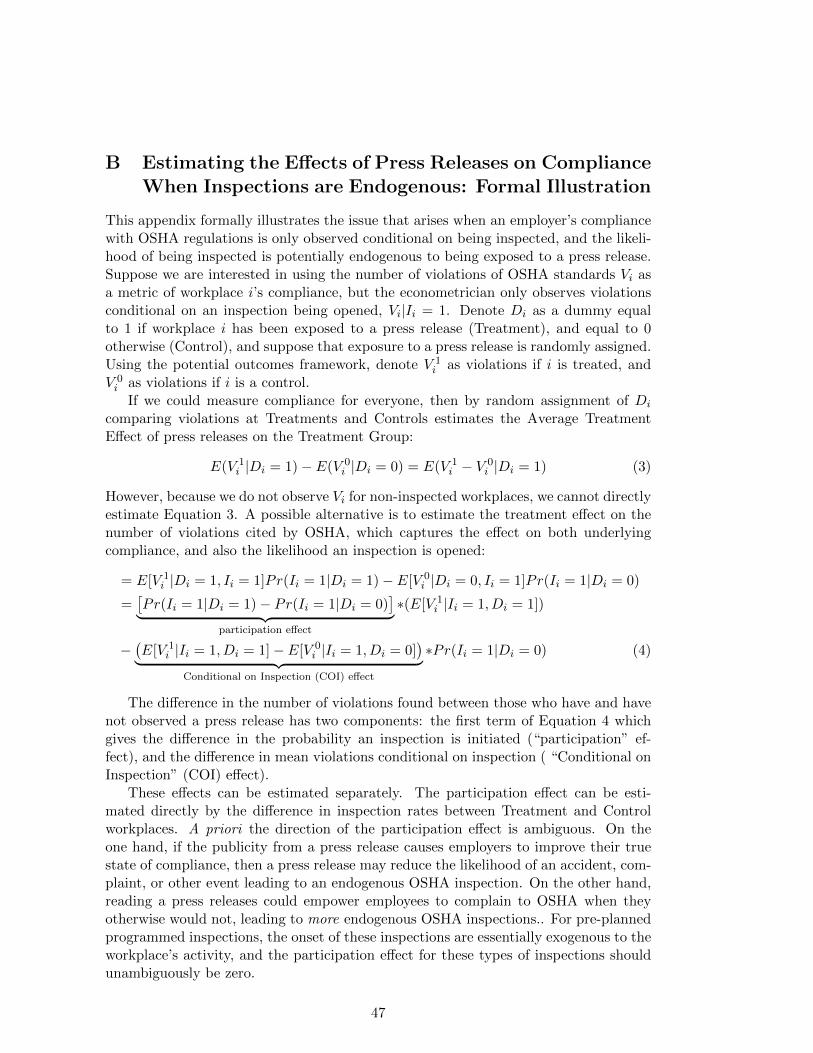
B Estimating the Effects of Press Releases on ComplianceWhen Inspections are Endogenous: Formal Illustration
This appendix formally illustrates the issue that arises when an employer’s compliancewith OSHA regulations is only observed conditional on being inspected, and the likeli-hood of being inspected is potentially endogenous to being exposed to a press release.Suppose we are interested in using the number of violations of OSHA standards Vi asa metric of workplace i’s compliance, but the econometrician only observes violationsconditional on an inspection being opened, Vi|Ii = 1. Denote Di as a dummy equalto 1 if workplace i has been exposed to a press release (Treatment), and equal to 0otherwise (Control), and suppose that exposure to a press release is randomly assigned.Using the potential outcomes framework, denote V 1
i as violations if i is treated, andV 0i as violations if i is a control.
If we could measure compliance for everyone, then by random assignment of Di
comparing violations at Treatments and Controls estimates the Average TreatmentEffect of press releases on the Treatment Group:
E(V 1i |Di = 1)− E(V 0
i |Di = 0) = E(V 1i − V 0
i |Di = 1) (3)
However, because we do not observe Vi for non-inspected workplaces, we cannot directlyestimate Equation 3. A possible alternative is to estimate the treatment effect on thenumber of violations cited by OSHA, which captures the effect on both underlyingcompliance, and also the likelihood an inspection is opened:
= E[V 1i |Di = 1, Ii = 1]Pr(Ii = 1|Di = 1)− E[V 0
i |Di = 0, Ii = 1]Pr(Ii = 1|Di = 0)
=[Pr(Ii = 1|Di = 1)− Pr(Ii = 1|Di = 0)
]︸ ︷︷ ︸participation effect
∗(E[V 1i |Ii = 1, Di = 1])
−(E[V 1
i |Ii = 1, Di = 1]− E[V 0i |Ii = 1, Di = 0]
)︸ ︷︷ ︸Conditional on Inspection (COI) effect
∗Pr(Ii = 1|Di = 0) (4)
The difference in the number of violations found between those who have and havenot observed a press release has two components: the first term of Equation 4 whichgives the difference in the probability an inspection is initiated (“participation” ef-fect), and the difference in mean violations conditional on inspection ( “Conditional onInspection” (COI) effect).
These effects can be estimated separately. The participation effect can be esti-mated directly by the difference in inspection rates between Treatment and Controlworkplaces. A priori the direction of the participation effect is ambiguous. On theone hand, if the publicity from a press release causes employers to improve their truestate of compliance, then a press release may reduce the likelihood of an accident, com-plaint, or other event leading to an endogenous OSHA inspection. On the other hand,reading a press releases could empower employees to complain to OSHA when theyotherwise would not, leading to more endogenous OSHA inspections.. For pre-plannedprogrammed inspections, the onset of these inspections are essentially exogenous to theworkplace’s activity, and the participation effect for these types of inspections shouldunambiguously be zero.
47
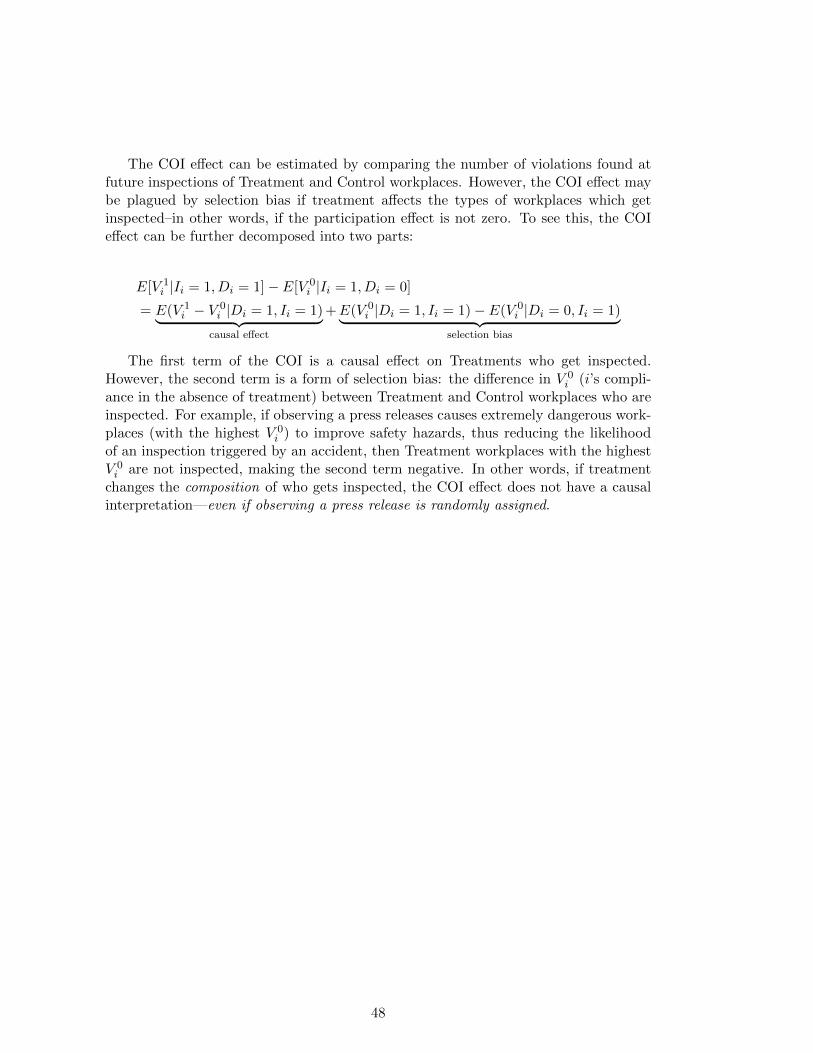
The COI effect can be estimated by comparing the number of violations found atfuture inspections of Treatment and Control workplaces. However, the COI effect maybe plagued by selection bias if treatment affects the types of workplaces which getinspected–in other words, if the participation effect is not zero. To see this, the COIeffect can be further decomposed into two parts:
E[V 1i |Ii = 1, Di = 1]− E[V 0
i |Ii = 1, Di = 0]
= E(V 1i − V 0
i |Di = 1, Ii = 1)︸ ︷︷ ︸causal effect
+E(V 0i |Di = 1, Ii = 1)− E(V 0
i |Di = 0, Ii = 1)︸ ︷︷ ︸selection bias
The first term of the COI is a causal effect on Treatments who get inspected.However, the second term is a form of selection bias: the difference in V 0
i (i’s compli-ance in the absence of treatment) between Treatment and Control workplaces who areinspected. For example, if observing a press releases causes extremely dangerous work-places (with the highest V 0
i ) to improve safety hazards, thus reducing the likelihoodof an inspection triggered by an accident, then Treatment workplaces with the highestV 0i are not inspected, making the second term negative. In other words, if treatment
changes the composition of who gets inspected, the COI effect does not have a causalinterpretation—even if observing a press release is randomly assigned.
48