regulated water and sewerage services · web viewduring the 201213 review of water and sewerage...
TRANSCRIPT

Issues paperTariff Review 2016
Regulated Water and Sewerage Services
Report 7 of 2015, November 2015

The Independent Competition and Regulatory Commission is a Territory Authority established under the Independent Competition and Regulatory Commission
Act 1997 (the ICRC Act). The Commission is constituted under the ICRC Act by one or more standing commissioners and any associated commissioners
appointed for particular purposes. Commissioners are statutory appointments and the current Commissioners are Senior Commissioner Malcolm Gray and
Commissioner Mike Buckley. We, the Commissioners who constitute the Commission, take direct responsibility for delivery of the outcomes of the
Commission.
We have responsibilities for a broad range of regulatory and utility administrative matters. We have responsibility under the ICRC Act for regulating and advising government about pricing and other matters for monopoly, near-monopoly and ministerially declared regulated industries, and providing advice on competitive
neutrality complaints and government-regulated activities. We also have responsibility for arbitrating infrastructure access disputes under the ICRC Act.
In discharging our objectives and functions, we provide independent, robust analysis and advice.
Our objectives are set out in section 7 of the ICRC Act and section 3 of the Utilities Act 2000.
Correspondence or other inquiries may be directed to the Commission at the following addresses:
Independent Competition and Regulatory CommissionPO Box 161
Civic Square ACT 2608
Level 8221 London CircuitCanberra ACT 2601
We may be contacted at the above addresses, by telephone on (02) 6205 0799, or by fax on (02) 6207 5887. Our website is at www.icrc.act.gov.au and our email
address is [email protected].
Issues paperTariff Review 2016 i

ForewordDuring the 201213 review of water and sewerage services, it became apparent that there was a desire in at least some segments of the community for a review of the structure of the tariff separate from community concern about the level of prices for these services. Although the Commission determined that changing the tariff structure was not urgent, we acknowledged the community desire for a review by committing to undertake such a review during the forthcoming, that is now current, regulatory period.
This issues paper commences the promised process of review by outlining some of the principal issues that might be examined and inviting community participation in the review.
Reviewing tariff structures can involve excursions into some fairly obscure topics. To assist public understanding of the issues and to facilitate community involvement in their debate, we are planning a series of technical papers to be released during the first half of the review period. These will cover such issues as the elasticity of demand for water and marginal cost pricing.
In order to maximise community involvement we are allowing a lengthy period for the receipt of submissions to be taken account of in our draft report, extending from now until 1 July 2016. During this period the three planned technical papers will be released, starting with the one on price elasticity in February 2016. Given the breadth of the issues involved in the review, we anticipate that it may be easier for interested parties to make a number of submissions, perhaps one in response to the issues paper and others in response to the technical papers as they are published, rather than waiting and making one omnibus submission. One of the purposes of the extended submission period is to accommodate such a sequence of submissions and we encourage interested parties to make as many submissions as they find necessary to present their views to the Commission.
In this issues paper we have tried to provide a framework for organising and presenting the diverse range of issues relevant to a review of tariff structure. You should, however, regard this as facilitative rather than constraining. If you feel that our approach has led us to miss something important, please let us know.
I commend this issues paper to you and look forward to hearing your views on the structure of tariffs for water and sewerage services in the ACT.
Malcolm Gray
Senior Commissioner
23 November 2015
Issues paperTariff Review 2016 i

How to make a submissionThis issues paper provides an opportunity for stakeholders to inform the development of the draft report. It will also ensure that relevant information and views are made public and brought to the Commission’s attention.
Submissions may be mailed to the Commission at:
Independent Competition and Regulatory CommissionPO Box 161Civic Square ACT 2608
Alternatively, submissions may be emailed to the Commission at [email protected]. The Commission encourages stakeholders to make submissions in either Microsoft Word format or PDF (OCR readable text format – that is, they should be direct conversions from the word-processing program, rather than scanned copies in which the text cannot be searched).
For submissions received from individuals, all personal details (for example, home and email addresses, and telephone and fax numbers) will be removed for privacy reasons before the submissions are published on the website.
The Commission is guided by and believes strongly in the principles of openness, transparency, consistency and accountability. Public consultation is a crucial element of the Commission’s processes. The Commission’s preference is that all submissions it receives be treated as public and be published on the Commission’s website unless the author of the submission indicates clearly that all or part of the submission is confidential and not to be made available publicly. Where confidential material is claimed, the Commission prefers that this be under a separate cover and clearly marked ‘In Confidence’. The Commission will assess the author’s claim and discuss appropriate steps to ensure that confidential material is protected while maintaining the principles of openness, transparency, consistency and accountability.
We may be contacted at the above addresses, by telephone on (02) 6205 0799 or by fax on (02) 6207 5887. The Commission’s website is at www.icrc.act.gov.au.
The closing time for submissions on the issues paper and subsequent technical papers is 5 pm on Friday, 1 July 2016.
ii Issues paperTariff Review 2016

Tariff review at a glance: Click and go
Issues paperTariff Review 2016 i
Chapter 3: Economic
regulation objective and pricing principles
Economic efficiency cost-reflective price signals to encourage efficient use of scarce resources
Chapter 2: Context for the review
What is the ACT water security situation?
Context is important as it sets the scene for the review. It also informs the numerous matters that will be analysed and discussed during the review process.
This chapter presents the proposed economic regulation objective and pricing principles that the Commission will to use as a framework to assess the current and alternative tariff structures. The objective and principles are important as they will influence the Commission’s decision on the preferred tariff structure at the conclusion of the review.
Chapter 1: Introduction
How are tariffs different from prices?
This chapter introduces the Commission’s review of Icon Water’s water and sewerage services tariffs.
What will the review cover?
Key review papers and timelines
Where are we in the regulatory cycle?
Legislation that guides the Commission
Relevant ACT Government and national policies
Recent pricing reviews and reports
Financial viability setting prices to recover Icon Water’s efficient costs
Community impacts avoiding price shocks
Why are we doing a review?
What happens after the review?
Overarching objective maximising social welfare

ii Issues paperTariff Review 2016
Chapter 4: Water pricing
Icon Water’s current water pricing arrangements
Water pricing in other jurisdictions
This chapter presents current water pricing arrangements in the ACT and other jurisdictions. It also explores a number of theoretical and practical issues that have important implications for the choice of water tariff design.
The ACT water market
Marginal cost pricing in a monopoly situation
Using price to manage water demand
Daily pricing
More than one water tariff option
Different prices for residential and business customers
Developer charges for new developments
Chapter 5: Sewerage services pricing
Icon Water’s current sewerage services pricing arrangements
Sewerage services pricing in other jurisdictions
This chapter presents current sewerage services pricing arrangements in the ACT and other jurisdictions. It also explores a number of theoretical and practical issues that will impact on the choice of sewerage services tariff design.
Volumetric pricing for sewerage services
Business customer charging arrangements
Trade waste pricing

ContentsForeword i
How to make a submission ii
Tariff review at a glance: Click and go i
1 Introduction 11.1 How are tariffs different to prices? 11.2 Why is the Commission conducting a tariff review? 21.3 Purpose of the issues paper 41.4 Scope of the review 51.5 Review timeline and consultation approach 61.6 What happens after the review? 71.7 Structure of the issues paper 8
2 Context for the review 92.1 Why is context important? 92.2 Regulatory context 92.3 Legislative context 122.4 Government policy context 132.5 Recent pricing reviews and reports 242.6 Water supply and demand context 30
3 Proposed economic regulation objective and pricing principles 353.1 Introduction 353.2 Proposed economic regulation objective 363.3 Proposed pricing principles 383.4 Conclusion 45
4 Water pricing 474.1 Introduction 474.2 Arrangements in the ACT 474.3 Arrangements in other jurisdictions 494.4 The market for water in the ACT 514.5 Theoretical and practical issues 54
5 Sewerage services pricing 775.1 Introduction 77
Issues paperTariff Review 2016 iii

5.2 Arrangements in the ACT 775.3 Arrangements in other jurisdictions 785.4 Theoretical and practical issues 80
6 Next steps 856.1 Consultation – key questions 856.2 Timeline 86
Appendix 1 Determining prices 87
Abbreviations and acronyms 89
References 91
iv Issues paperTariff Review 2016

List of tables
Table 1.1 Indicative timeline for the tariff review 6
Table 2.1 Essential Services Commission 2013 water review – tariff assessment principles 29
Table 4.1 Icon Water’s water tariffs, 1998–99 to 2015–16 ($, current prices) 48
Table 4.2 Water tariffs in various jurisdictions, 2015–16 50
Table 5.1 Icon Water sewerage services tariffs, 1998–99 to 2015–16 ($, current prices) 77
Table 5.2 Sewerage services tariffs in various jurisdictions, 2015–16 78
Table 6.1 Indicative timeline for the review 86
Issues paperTariff Review 2016 v

List of figures
Figure 1.1 Tariff versus prices 1
Figure 1.2 Tariff review – possible outcomes 7
Figure 2.1 ACT billed water sales, actual and forecast, 1999–2000 to 2017–18 11
Figure 2.2 ACT net watercourse take, 1989–90 to 2013–14 20
Figure 2.3 ACT and Queanbeyan per capita water consumption, 1998–99 to 2014–15 31
Figure 2.4 Observed tier 1 water sales proportion, 2008–09 to 2013–14 32
Figure 4.1 ACT water and sewerage network 52
Figure 4.2 The socially optimal competitive equilibrium 56
Figure 4.3 Deadweight welfare loss under monopoly 57
Figure 4.4 Icon Water tier 1 proportion of total water sales, 200809 to 201314 66
Figure 4.5 Monthly Icon Water dam releases 68
vi Issues paperTariff Review 2016

List of boxes
Box 1.1 Clause 11 substitute price direction extract 3
Box 1.2 Clause 10 substitute price direction extract 4
Box 2.1 ACT water strategy Outcome 2 14
Box 2.2 ACT water strategy water efficiency targets 15
Box 2.3 ACT water strategy sub-actions 15
Box 2.4 Secondary water initiative examples 18
Box 2.5 National Water Initiative best practice pricing outcomes 21
Box 2.6 National Water Initiative best practice pricing actions 22
Box 2.7 National Water Initiative urban water price-setting principles 23
Box 2.8 IPART’s principles for price structure for metropolitan water utilities 28
Box 2.9 Electricity Distribution Network Pricing Arrangements Rule 2014 summary 30
Box 3.1 National Electricity Objective 36
Box 3.2 Commission’s proposed economic regulation objective and pricing principles 46
Box 4.1 ACT water abstraction charge 70
Box 5.1 City West Water sewage volume calculation 80
Issues paperTariff Review 2016 vii

1 Introduction
1.1 How are tariffs different to prices?
A price (or charge) is the monetary value of a good or service that a business levies on its customers for the provision of a good or service. Prices are often expressed per unit, such as x dollars per litre or y dollars per kilogram. Alternatively, a price can be expressed as fixed amount for a particular service, such as z dollars for a year’s worth of sewerage services.
In contrast, a tariff is a collection of individual prices. The tariff schedule for any particular tariff describes:
the structure and level of the individual prices or charges; and
any customer pricing differentiation, such as different prices that may apply to residential and non-residential customers.
The bill the consumer has to pay is determined by multiplication and addition – the number and types of products selected multiplied by their respective price (see Figure 1.1).
Figure 1.1 Tariff versus prices
Customer bill
Annual supply charge
Volumetric price per unit
Tariff
Number of units
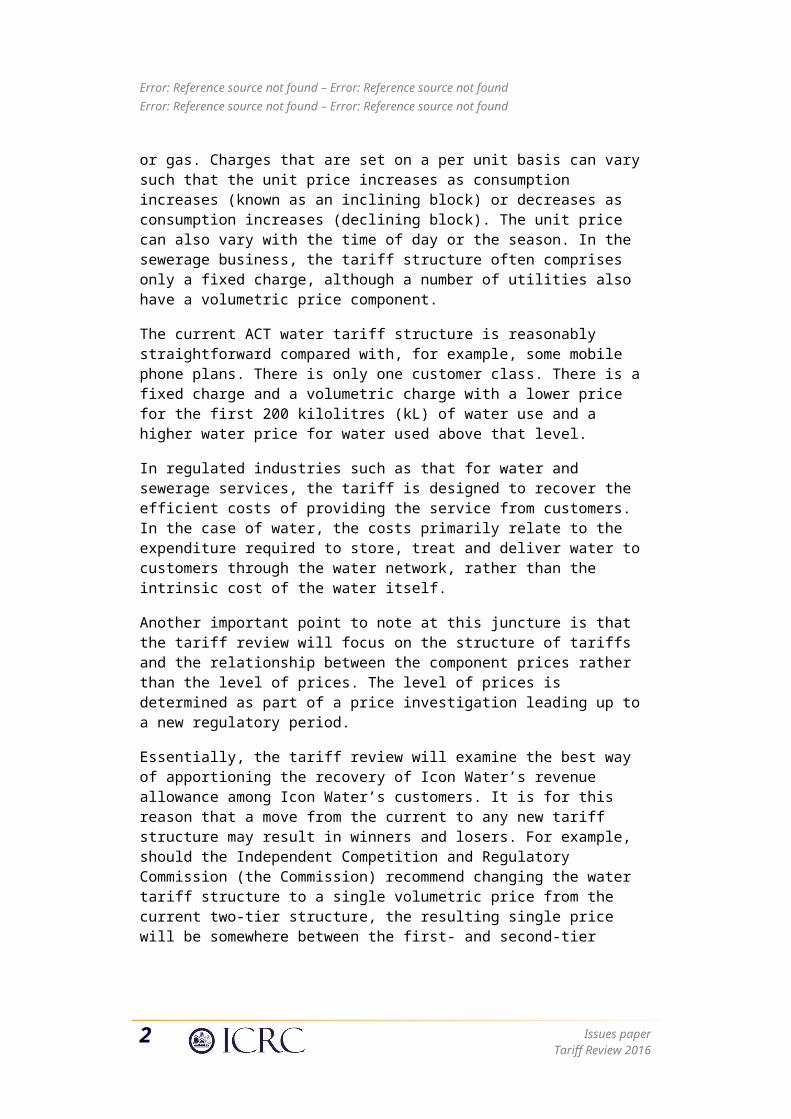
In the water and energy industries, a tariff generally comprises a fixed annual charge and a separate volumetric price for usage of the commodity, be it water, electricity or gas. Charges that are set on a per unit basis can vary such that the unit price increases as consumption increases (known as an inclining block) or decreases as consumption increases (declining block). The unit price can also vary with the time of day or the season. In the sewerage business, the tariff structure often comprises only a fixed charge, although a number of utilities also have a volumetric price component.
The current ACT water tariff structure is reasonably straightforward compared with, for example, some mobile phone plans. There is only one customer class. There is a
Issues paperTariff Review 2016 1

Error: Reference source not found – Error: Reference source not foundError: Reference source not found – Error: Reference source not found
fixed charge and a volumetric charge with a lower price for the first 200 kilolitres (kL) of water use and a higher water price for water used above that level.
In regulated industries such as that for water and sewerage services, the tariff is designed to recover the efficient costs of providing the service from customers. In the case of water, the costs primarily relate to the expenditure required to store, treat and deliver water to customers through the water network, rather than the intrinsic cost of the water itself.
Another important point to note at this juncture is that the tariff review will focus on the structure of tariffs and the relationship between the component prices rather than the level of prices. The level of prices is determined as part of a price investigation leading up to a new regulatory period.
Essentially, the tariff review will examine the best way of apportioning the recovery of Icon Water’s revenue allowance among Icon Water’s customers. It is for this reason that a move from the current to any new tariff structure may result in winners and losers. For example, should the Independent Competition and Regulatory Commission (the Commission) recommend changing the water tariff structure to a single volumetric price from the current two-tier structure, the resulting single price will be somewhere between the first- and second-tier price. Such a change is likely to benefit the large-volume water user while low-volume customers may pay more.1
1.2 Why is the Commission conducting a tariff review?
The current structure of Icon Water’s water and sewerage services tariffs has served the ACT community well over the last 15 or so years. Nonetheless, in recent years a number of questions have been raised about whether improvements could be made to the way tariffs are structured. In the 2013 price investigation process, the Commission received a number of submissions from stakeholders in this regard. For example, Dr Terry Dwyer suggested that volumetric prices should be based on short-run marginal cost and fixed costs recovered through land rates.2
The primary purpose of the review, therefore, is to determine whether the current water and sewerage services tariff structure will continue to deliver the best outcome for the ACT community, or whether changes are required.
In its 2013 determination, the Commission chose to maintain the existing tariff structures for water and sewerage services for the regulatory period commencing 1 July 2013 (the current regulatory period).3 Notwithstanding this decision, the Commission stated that it recognised the value in further reviewing alternative price
1 These equity matters are discussed in more detail in Chapter 3 and will be considered at length in the draft report by modelling the impact of any proposed changes on customer bills.2 ICRC, 2013c: 13–14.3 ICRC, 2013a: 165.
2 Issues paperTariff Review 2016
structures and price-setting arrangements over the course of the current regulatory period.
This view was reflected as a future reset principle in the Price Direction: Regulated Water and Sewerage Services – 1 July 2013 to 30 June 2019 (the price direction)4 (see extract in Box 1.1). Clause 11(b) of the Substituted Price Direction: Regulated Water and Sewerage Services – 1 July 2013 to 30 June 2018 (the substitute price direction) maintained this reset principle requiring the Commission to undertake a review of Icon Water’s water and sewerage services tariff structures (the tariff review) during the current regulatory period.5
Box 1.1 Clause 11 substitute price direction extract
11 Future reset principles
Pursuant to section 20B of the Act, the future reset principles are as follows:
(b) During the regulatory period, the Commission must conduct a review of the tariff structures for the regulated water and sewerage services of Icon Water. At the conclusion of the review, the Commission must set out in a report its decision on whether amendments should be made to the tariff structures in place. The Commission may recommend that amendments either be made during the regulatory period set out in clause 2 or be considered as part of the investigation for the next regulatory period beginning 1 July 2018. The Commission may also recommend that no changes be made to the tariff structure in place. As part of the review, the Commission must call for submissions from interested parties and post its final report and decision on the Commission’s website.
Source: Industry Panel (2015b).
As far as process is concerned, the substitute price direction requires the Commission to set out its conclusions in a final report which is to be posted on the Commission’s website. The Commission is also required to call for submissions from interested parties as part of the review.
Should, at the conclusion of the tariff review, the Commission recommend that changes be made to the current tariff structures, the substitute price direction provides discretion to implement the changes either during the current regulatory period or during the next period commencing 1 July 2018. Clause 10(f) of the substitute price direction provides a trigger event for the former to allow the Commission to vary the substitute price direction to implement the tariff changes during this regulatory period (see Box 1.2).
4 ICRC, 2013b: 13.5 Industry Panel, 2015b: 12.
Issues paperTariff Review 2016 3

Error: Reference source not found – Error: Reference source not foundError: Reference source not found – Error: Reference source not found
Box 1.2 Clause 10 substitute price direction extract
10 Price Direction variation trigger events
Pursuant to sections 20A(3)(c) and 24F(2) of the Act, the following events are price variation trigger events, the occurrence of which allows the Commission to initiate a reference for the variation of the Price Direction:
...........
(f) a decision by the Commission under clause 11(b) that the tariff structure must be amended during the regulatory period.
Source: Industry Panel (2015b).
In addition to the legislative basis for conducting the tariff review discussed above, the Commission’s view is that it is timely to undertake a review for two other reasons.
The first is that it is some time since the last substantive review of Icon Water’s water and sewerage tariff structures was undertaken in 2007 as part of the 200813 price investigation process.
The second is that there is a sharp contrast between the ACT’s water security situation then and now, due to the breaking of the Millennium Drought, significant increases in water storage capacity and substantial reductions in water demand. While some of these elements were known during the 2013 price investigation, the Commission has a better understanding now of the outlook for the ACT’s water security than it did back then. The ACT water security context is explained in more detail in section 2.6.
1.3 Purpose of the issues paper
The purpose of this issues paper is twofold. The first is to alert stakeholders that the Commission is commencing a review of Icon Water’s water and sewerage services tariff structures and will be seeking stakeholder input on any issues they consider relevant.
The second purpose is to inform stakeholders of those issues that the Commission has identified as relevant to the review at this early stage in the process. These include issues arising from the scope of the review, theoretical and practical pricing matters and experience of utilities in other jurisdictions.
The Commission, through submissions in response to the issues paper (and subsequent technical papers), is keen to get a thorough understanding of the issues that stakeholders consider important. Stakeholder input will inform the Commission’s development of the draft report, scheduled for release in late 2016.
It is important to note that the issues paper does not define the agenda for the tariff review. The ACT community and other stakeholders are free to put forward any
4 Issues paperTariff Review 2016
matters they consider are relevant to the review for the Commission’s consideration.
1.4 Scope of the review
In the absence of detailed terms of reference for the tariff review, the Commission has been guided by the provisions of the substitute price direction as discussed in section 1.2, relevant provisions of the ICRC Act and its general approach to determining prices.
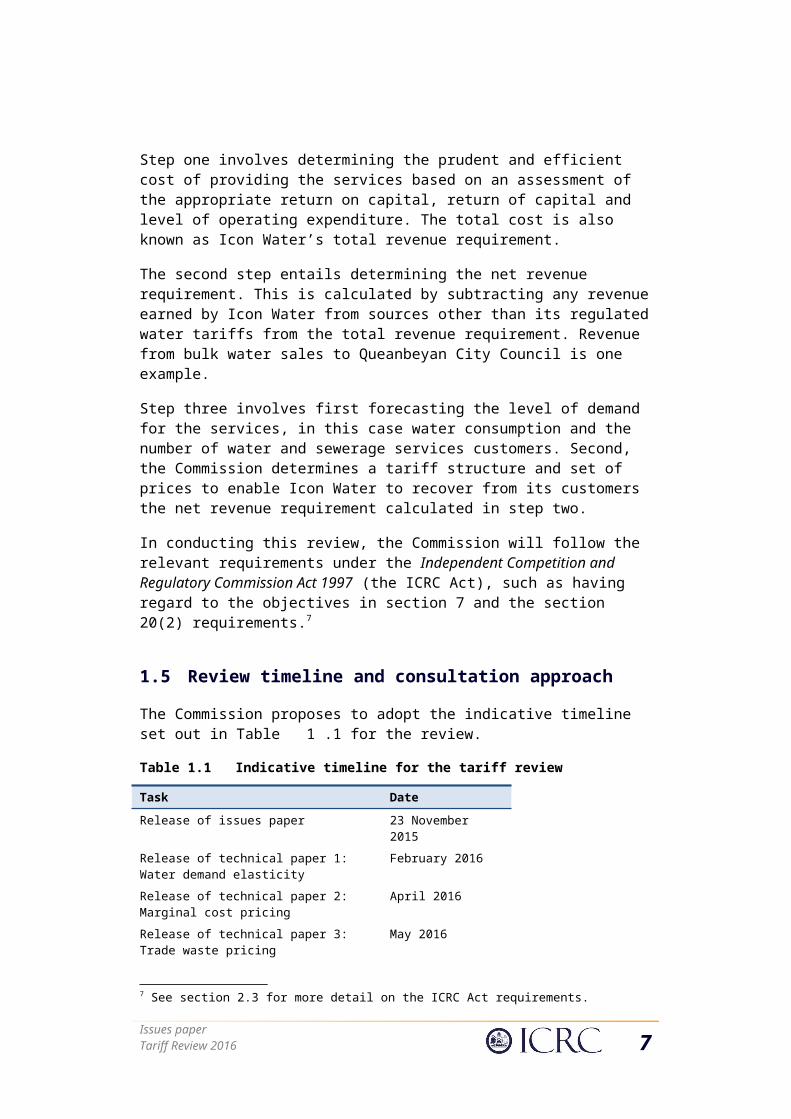
In simple terms, when determining prices for Icon Water’s regulated water and sewerage services over a particular regulatory period, the Commission employs a three-step process.6
Step one involves determining the prudent and efficient cost of providing the services based on an assessment of the appropriate return on capital, return of capital and level of operating expenditure. The total cost is also known as Icon Water’s total revenue requirement.
The second step entails determining the net revenue requirement. This is calculated by subtracting any revenue earned by Icon Water from sources other than its regulated water tariffs from the total revenue requirement. Revenue from bulk water sales to Queanbeyan City Council is one example.
Step three involves first forecasting the level of demand for the services, in this case water consumption and the number of water and sewerage services customers. Second, the Commission determines a tariff structure and set of prices to enable Icon Water to recover from its customers the net revenue requirement calculated in step two.
In conducting this review, the Commission will follow the relevant requirements under the Independent Competition and Regulatory Commission Act 1997 (the ICRC Act), such as having regard to the objectives in section 7 and the section 20(2) requirements.7
1.5 Review timeline and consultation approach
The Commission proposes to adopt the indicative timeline set out in Table 1.1 for the review.
Table 1.1 Indicative timeline for the tariff review
Task DateRelease of issues paper 23 November 2015
Release of technical paper 1: Water demand elasticity February 2016Release of technical paper 2: Marginal cost pricing April 2016
6 A more fulsome explanation of the Commission’s pricing approach is provided in a schematic in Appendix 1.7 See section 2.3 for more detail on the ICRC Act requirements.
Issues paperTariff Review 2016 5

Error: Reference source not found – Error: Reference source not foundError: Reference source not found – Error: Reference source not found
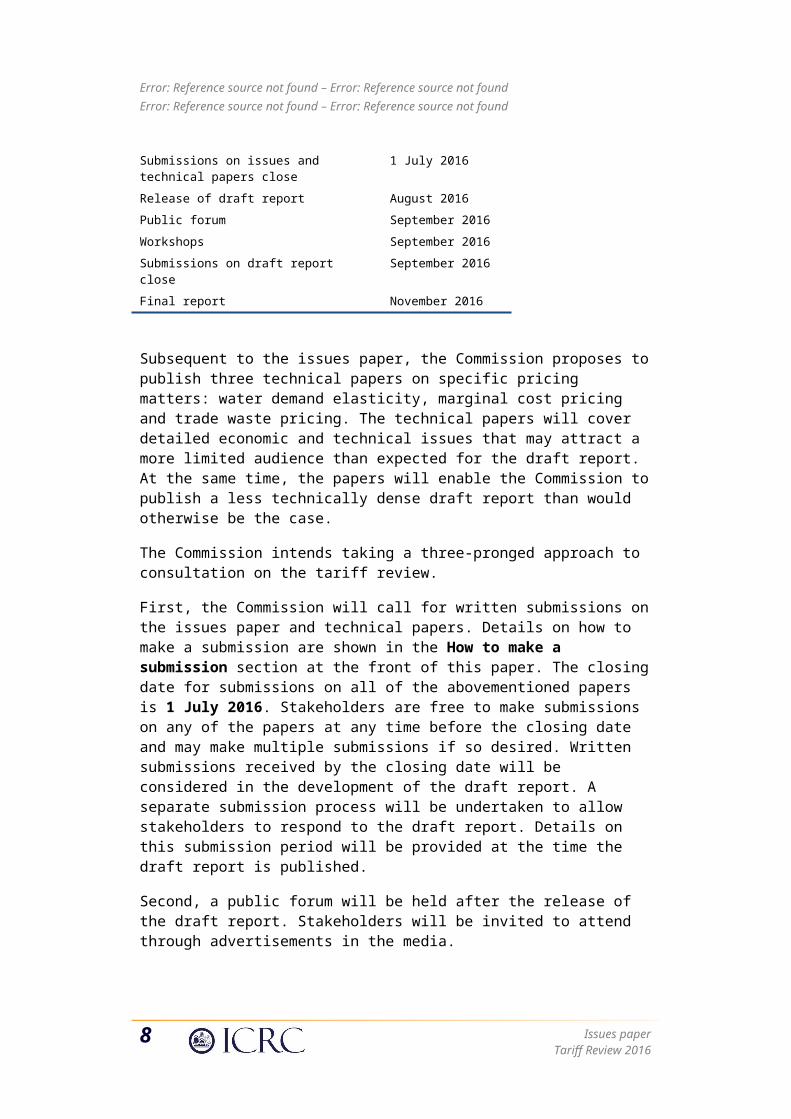
Release of technical paper 3: Trade waste pricing May 2016Submissions on issues and technical papers close 1 July 2016
Release of draft report August 2016
Public forum September 2016
Workshops September 2016Submissions on draft report close September 2016
Final report November 2016
Subsequent to the issues paper, the Commission proposes to publish three technical papers on specific pricing matters: water demand elasticity, marginal cost pricing and trade waste pricing. The technical papers will cover detailed economic and technical issues that may attract a more limited audience than expected for the draft report. At the same time, the papers will enable the Commission to publish a less technically dense draft report than would otherwise be the case.
The Commission intends taking a three-pronged approach to consultation on the tariff review.
First, the Commission will call for written submissions on the issues paper and technical papers. Details on how to make a submission are shown in the How to make a submission section at the front of this paper. The closing date for submissions on all of the abovementioned papers is 1 July 2016. Stakeholders are free to make submissions on any of the papers at any time before the closing date and may make multiple submissions if so desired. Written submissions received by the closing date will be considered in the development of the draft report. A separate submission process will be undertaken to allow stakeholders to respond to the draft report. Details on this submission period will be provided at the time the draft report is published.
Second, a public forum will be held after the release of the draft report. Stakeholders will be invited to attend through advertisements in the media.
Third, a more specific set of workshops with customer groups or a range of customers around a specific issue will be considered by the Commission if there is sufficient interest. This would involve directly inviting selected participants and having a more in-depth, targeted discussion about particular issues of interest.
In terms of media, the Commission will utilise its website for consultation purposes.8
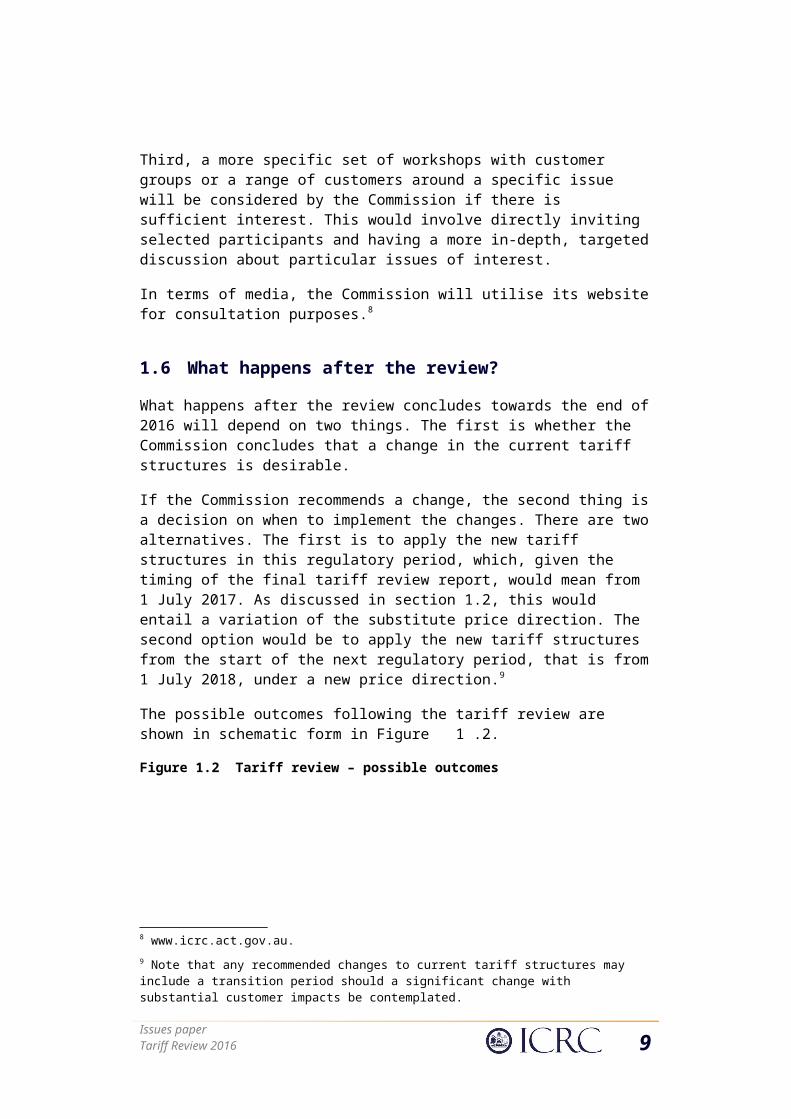
1.6 What happens after the review?
What happens after the review concludes towards the end of 2016 will depend on two things. The first is whether the Commission concludes that a change in the current tariff structures is desirable.
8 www.icrc.act.gov.au.
6 Issues paperTariff Review 2016

If the Commission recommends a change, the second thing is a decision on when to implement the changes. There are two alternatives. The first is to apply the new tariff structures in this regulatory period, which, given the timing of the final tariff review report, would mean from 1 July 2017. As discussed in section 1.2, this would entail a variation of the substitute price direction. The second option would be to apply the new tariff structures from the start of the next regulatory period, that is from 1 July 2018, under a new price direction.9
The possible outcomes following the tariff review are shown in schematic form in Figure 1.2.
Figure 1.2 Tariff review – possible outcomes
Tariff review conclusion
No change Change
Next regulatory period
This regulatory period
New tariffs applied from 1 July 2018
Pulls price variation trigger
Commission-initiated price
direction variation
Commission writes own terms of
reference
Draft reportCall for submissions
Public hearing
Final report and varied price
direction
New tariffs applied from 1 July 2017
Usual price investigation
process
1.7 Structure of the issues paper
The remainder of the issues paper is structured as follows:
Chapter 2 provides relevant water security, legislative, policy and regulatory context for the tariff review.
Chapter 3 presents a proposed objective for economic regulation and a set of pricing principles intended to guide the Commission’s decision-making throughout the review.
9 Note that any recommended changes to current tariff structures may include a transition period should a significant change with substantial customer impacts be contemplated.
Issues paperTariff Review 2016 7

Error: Reference source not found – Error: Reference source not foundError: Reference source not found – Error: Reference source not found
Chapter 4 details a range of specific issues related to water pricing.
Chapter 5 details a range of specific issues related to the pricing of sewerage services.
Chapter 6 sets out the next steps in the tariff review process.
Appendix 1 contains a schematic of the Commission’s price-setting process.
8 Issues paperTariff Review 2016

2 Context for the review
2.1 Why is context important?
At the start of any review process, it is necessary to document and consider a range of issues that have a bearing on the subject matter that will be debated during the review. This is particularly important for any particular issue that has changed substantially since the last tariff review. The contextual discussion phase is important to properly inform final conclusions.
This chapter introduces a number of contextual issues that the Commission considers relevant to this review of water and sewerage service tariffs for a regulated business. These include:
Regulatory context the determination of tariff structures is but one part of the broader regulatory framework under which the Commission regulates Icon Water’s regulated water and sewerage services prices.
Legislative requirements in making regulatory decisions, such as on tariff structures, the Commission is guided by the objectives and other requirements of the ICRC Act.
Government policy implications there are a number of ACT Government water policies and programs and national commitments that have direct implications for water and sewerage services pricing.
Recent public debate on economic pricing issues there has been a range of reviews and publications since the Commission’s last tariff review that serve to inform the tariff debate.
Water supply and demand situation a key debate in the tariff review will be about the role of water pricing as means to efficiently balance water supply and demand.
2.2 Regulatory context
There are two regulatory issues that are pertinent to the tariff review: the method of controlling prices and the implications of the current price direction for any changes to the water tariff in the next regulatory period.
2.2.1 Form of price control
Regulators can apply a range of different approaches to controlling regulated utility prices. Two of the most common are the price cap and revenue cap approaches.
Price cap regulation involves the regulator determining or approving the maximum prices for each regulated service that the utility provides. This generally involves the regulator being responsible for setting the tariff structures and calculating the level of prices to be applied by the utility. The Commission’s approach in its 2013 price direction could be characterised as a price cap approach.
Issues paperTariff Review 2016 9
1 – Introduction
Revenue cap regulation entails the regulator determining or approving a maximum revenue amount that can be earned by the utility. In contrast to price cap regulation, the utility is generally given the task of setting tariffs and prices. The regulator’s involvement in tariffs and prices is often restricted to determining a set of pricing principles to be applied by the utility and then confirming that proposed prices do not breach the utility’s revenue cap. An example of this approach is the way in which the Australian Energy Regulator regulates electricity distribution businesses.
As noted in section 1.2, Icon Water is currently operating under the substitute price direction. The form of regulation under this price direction has been characterised as a hybrid price and revenue cap with:
individual price caps set for water and sewerage charges and a demand volatility adjustment mechanism used to account for deviations between actual and forecast volumetric water sales revenue (i.e., revenue from tier 1 and tier 2 water sales) in excess of a 6% deadband over the full five-year regulatory period (2013–14 to 2017–18).10
The form of price control that will apply to Icon Water during the next regulatory period will be determined as part of the broader price investigation process subsequent to the completion of the tariff review. While it seems likely that the Commission will set prices for the next regulatory period, the conclusions of this review will be useful for whoever is responsible for setting prices.
Generally speaking, decisions on the form of price control can be separated from decisions on the structure of tariffs. The exception is the relationship between the price control approach and the level of revenue risk for the utility associated with the regulator having to forecast water sales volumes in advance of the regulatory year.
For example, the hybrid price and revenue cap under which Icon Water is currently operating provides some insulation from the sales volume uncertainty. This contrasts with the pure price cap approach where the utility and ultimately the ACT taxpayer in the case of a wholly government-owned entity such as Icon Water bears the volume risk. Under the former price control approach, there may be less emphasis on revenue recovery in the tariff design than would be the case under the latter.
The Commission will consider the interaction above during the course of the tariff review.
2.2.2 Current price direction arrangements
The substitute price direction was determined by the Industry Panel in May 2015 and has effect from 19 May 2015 until the end of the current regulatory period on 30 June 2018.
In its May 2015 response to the Industry Panel’s final decision, the Commission noted that the Industry Panel had adopted a very different approach to forecasting water sales
10 Industry Panel, 2015a: 27.
10 Issues paperTariff Review 2016
than any previously used by the Commission or Icon Water, producing forecasts well above any recently suggested by either of those entities.11
The Industry Panel’s final report forecast water sales of 43.15 gigalitres (GL) for 201415 with sales in subsequent years rising by about half a gigalitre per year. This compared to Icon Water’s estimate of 39.5 GL based on data for the first eight months of 201415, which included the months of heaviest water consumption. The most recent work of the Commission at the time, using monthly billed sales data through to March 2015 and daily dam releases data through to 31 March 2015, produced a similar figure. The actual water sales for 201415 are now available, and, at 39.2 GL, are about 9 per cent lower than the Panel’s forecast (see Figure 2.3).
Figure 2.3 ACT billed water sales, actual and forecast, 1999–2000 to 2017–18
2000 2001 2002 2003 2004 2005 2006 2007 2008 2009 2010 2011 2012 2013 2014 2015 2016 2017 20180
10,000
20,000
30,000
40,000
50,000
60,000
Actual billed Industry Panel forecasts
Year ending 30 June
Meg
alitr
es
Source: Icon Water billed water sales data; Industry Panel (2015a).
With Icon Water already down by about 4 GL of sales in 201415, the likelihood of the Panel’s projected bounce-back in water sales over the rest of the current regulatory period is called into question. Should there be a return to water forecasts that reflect more recent outcomes at the beginning of the next regulatory period, this is likely to put upward pressure on water prices. In addition, if actual water sales are low enough to trigger the deadband, it will be necessary to increase prices further to recover that portion of water revenue lost by Icon Water in the current period that lies outside the deadband established under the substitute price direction.12 The Commission therefore considers that there is a possibility that the next regulatory period may begin with a water price shock.
Looking ahead, should the Commission recommend a change in the water tariff structure, its introduction may provide flexibility to minimise the impacts of any rise in
11 ICRC, 2015a: 11.12 Industry Panel, 2015b: 13.
Issues paperTariff Review 2016 11
1 – Introduction
the general level of water prices. On the other hand, any gains and losses among customer groups are likely to be amplified by any general increase in the level of prices.
2.3 Legislative context
In addition to being instructed by the substitute price direction, in conducting this review the Commission is also subject to the broader provisions of the ICRC Act.
In carrying out its functions under the ICRC Act, the Commission has the following objectives set out in section 7:
(a) to promote effective competition in the interests of consumers;
(b) to facilitate an appropriate balance between efficiency and environmental and social considerations;
(c) to ensure non-discriminatory access to monopoly and near-monopoly infrastructure.13
In making a price direction, the Commission is required to have regard to the provisions set out in section 20(2):
(a) the protection of consumers from abuses of monopoly power in terms of prices, pricing policies (including policies relating to the level or structure of prices for services) and standard of regulated services; and
(b) standards of quality, reliability and safety of the regulated services; and
(c) the need for greater efficiency in the provision of regulated services to reduce costs to consumers and taxpayers; and
(d) an appropriate rate of return on any investment in the regulated industry; and
(e) the cost of providing the regulated services; and
(f) the principles of ecologically sustainable development mentioned in subsection (5);
(g) the social impacts of the decision; and
(h) considerations of demand management and least cost planning; and
(i) the borrowing, capital and cash flow requirements of people providing regulated services and the need to renew or increase relevant assets in the regulated industry; and
(j) the effect on general price inflation over the medium term; and
(k) any arrangements that a person providing regulated services has entered into for the exercise of its functions by some other person.14
13 ACT Government, 1997: 8.14 ACT Government, 1997: 26–27.
12 Issues paperTariff Review 2016

Although not strictly required to follow section 20(2) for the purposes of the tariff review, the Commission proposes to have regard to these requirements as if it were conducting a price investigation.
2.4 Government policy context
When undertaking a price investigation, the Commission is often instructed by a terms of reference to take into consideration the policies of the ACT Government as they relate to water security and the use of water and national water initiatives, policies and agreements. In line with the Commission’s decision on the section 20(2) requirements, the Commission will take into account ACT Government and national policies relevant to tariff design and pricing in conducting the tariff review.
2.4.1 ACT Government policies, arrangements and projects
The Commission has identified a number of ACT Government policies, administrative arrangements and projects, discussed below, that are relevant to tariff review.
The ACT Water Strategy 201444
The ACT Water Strategy 201444: Striking the Balance (the ACT water strategy) sets out the ACT Government’s overarching long-term water resources management policy. The strategy is intended to achieve three outcomes, the second of which a sustainable water supply used efficiently is of primary interest for the tariff review. Strategy 5, directed to this outcome, is to manage and promote the sustainable use of water. Action 15 under this strategy is to encourage water users to conserve and use water wisely (see Box 2.1).
Box 2.3 ACT water strategy Outcome 2
OUTCOME 2: A sustainable water supply used efficiently
An integrated and efficient water supply system that provides for the optimal mix of supply options, encourages efficient use of water, and is resilient to climate variability, and supports the social, economic and environmental needs of the ACT community.
STRATEGY 5: Manage and promote the sustainable use of water
Actions 14 Improve and monitor provision of water services
15 Encourage water users to conserve and use water wisely
Source: ACT Government (2014c).
The ACT water strategy notes the progress in reducing per capita water consumption since the introduction of the previous water strategy Think water, Act water in 2004, stating that the previous strategy’s target has already been met:
Issues paperTariff Review 2016 13

1 – Introduction
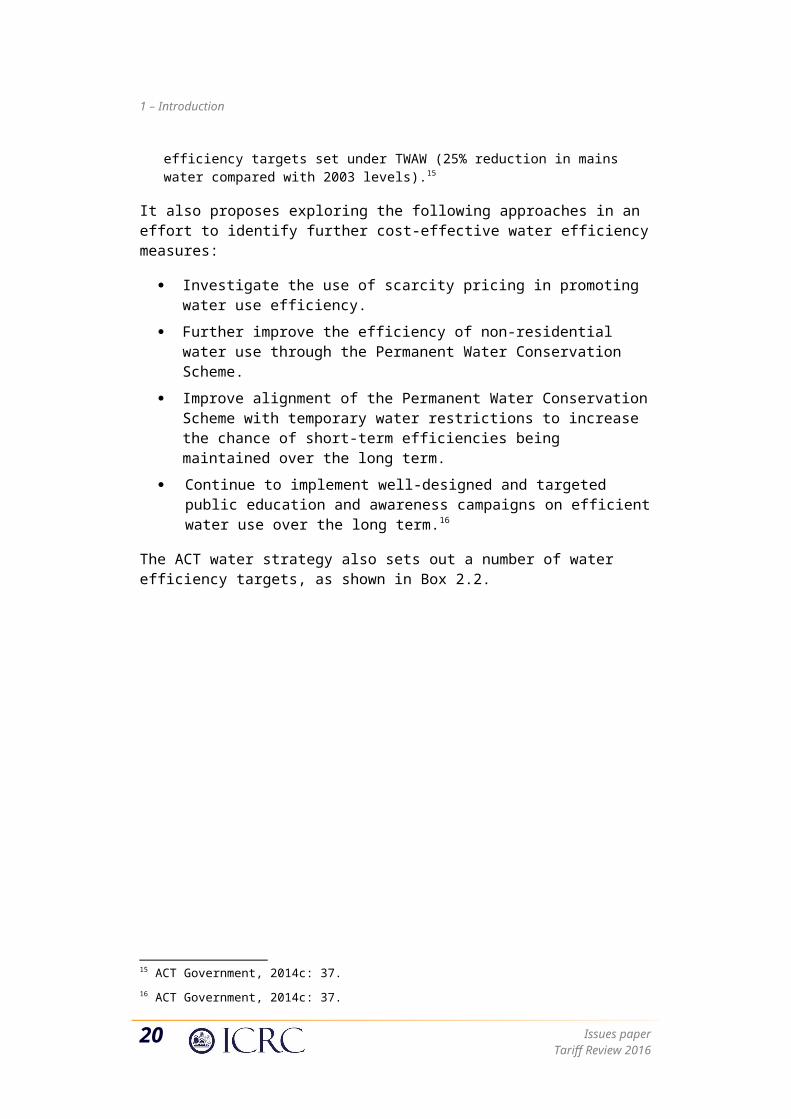
The ACT Government has made significant investments in actions to reduce demand from the ACT’s primary water supply system, and has already achieved its water efficiency targets set under TWAW (25% reduction in mains water compared with 2003 levels).15
It also proposes exploring the following approaches in an effort to identify further cost-effective water efficiency measures:
Investigate the use of scarcity pricing in promoting water use efficiency.
Further improve the efficiency of non-residential water use through the Permanent Water Conservation Scheme.
Improve alignment of the Permanent Water Conservation Scheme with temporary water restrictions to increase the chance of short-term efficiencies being maintained over the long term.
Continue to implement well-designed and targeted public education and awareness campaigns on efficient water use over the long term.16
The ACT water strategy also sets out a number of water efficiency targets, as shown in Box 2.2.
Box 2.4 ACT water strategy water efficiency targets
Targets related to Outcome 2 – A sustainable water supply used efficiently
2. Live within the sustainable diversion limit set for the ACT (30-year target)
Indicators
Meeting the Think water, act water (2004) 25% reduction in mains water usage per capita target by 2023.
Meeting the 40% target under the Water Sensitive Urban Design Code for reducing mains water usage in new developments, extensions and refurbishments.
Maintaining the measures set under the Permanent Water Conservation Scheme and investigate any possible extension of the measures.
2a. (Interim target) Measurable reduction in mains consumption for non-residential water use (five-year target, 2019)
Indicators
Measurable reduction in mains consumption for non-residential water use (against 2013 levels) (five-year target, 2019).
Reduction in water use through schools (overall water use, litres per student per annum water use) through the Actsmart Schools program.
Source: ACT Government (2014c).
15 ACT Government, 2014c: 37.16 ACT Government, 2014c: 37.
14 Issues paperTariff Review 2016

Along with the water strategy, the ACT Government also published an implementation plan for the first four years of its 30-year planning horizon. This includes a number of sub-actions to encouraging water users to conserve and use water wisely, as shown in Box 2.3.
Box 2.5 ACT water strategy sub-actions
Action 15: Encourage water users to conserve and use water wisely
15.1 Explore the effectiveness of water pricing in promoting water use efficiency (2016).
15.2 Improve efficiency of non-residential water use: develop a Permanent Water Conservation Scheme for non-residential water users in consultation with industry (2014).
15.3 Deliver water efficiency programs and education to ACT residents, schools and businesses through Actsmart programs.
Source: ACT Government (2014d).
Permanent water conservation measures and temporary water restrictions
The ACT has recourse to two administrative schemes, administered by Icon Water and approved under the Utilities (Water Conservation) Regulation 2006, to reduce water use by ACT and Queanbeyan residents, and therefore extend supply: permanent water conservation measures and a temporary water restrictions scheme.
Permanent water conservation measures are intended to conserve water on a permanent basis.17 This is achieved by imposing requirements such as the use of hand-held hoses, prohibitions on watering gardens at designated times and other restrictions on use.
The temporary water restrictions scheme is imposed in times of acute water shortage and is intended to restrict water use rather than conserve water.18 Temporary water restrictions are applied through a four-stage scheme of progressively higher levels of restrictions based on water scarcity.
The ACT has been under permanent water conservation measures since Stage 2 temporary restrictions were revoked on 31 October 2010.19
Water sensitive urban design
The ACT Government’s overarching planning act, the Territory Plan, includes the Waterways: Water Sensitive Urban Design General Code, which places mandatory water efficiency requirements on developers in the ACT.20 The code also places a
17 ACT Government, 2010c: 1–9.18 ACT Government, 2010b: 1–6.19 ACT Government, 2010a: 1.20 The Water Sensitive Urban Design Code applies to the development of new residential neighbourhoods and estates, redevelopment or infill development within the existing built environment and institutional,
Issues paperTariff Review 2016 15

1 – Introduction
number of water quality requirements on developers relating to the control of stormwater and run-off.
The Water Sensitive Urban Design Code, introduced in 2009, requires new building developments and redevelopments in the ACT to comply with a primary water use reduction target of 40 per cent on 2003 levels. The installation of rainwater tanks (of various sizes depending on block size) connected to the toilet, laundry and external taps is listed in the code as an acceptable solution to meet the 40 per cent target on single residential blocks.21
The Water Sensitive Urban Design Code has been reviewed following the Commission’s recommendations, in its 2012 final report on secondary water use in the ACT, that the ACT Government review the code and in particular the merits of the mandatory water efficiency requirements.22 At the outset of the review process, the ACT Government announced that it would not change the 40 per cent mains water use reduction target:
The ACT Government has decided that this target will not be changed as part of this review.23
The review was completed in August 2014.24 Not surprisingly, the review focused on the water quality aspects of the Water Sensitive Urban Design Code and makes no recommendations regarding the water efficiency requirements. As such, for the purposes of the tariff review, the Commission will assume that the mandatory 40 per cent water reduction target will remain in place as a demand measure.
Secondary water initiatives
There are a number of public and privately funded secondary water initiatives in the ACT (see Box 2.4). Public initiatives include the ACT Government’s Canberra Integrated Urban Waterways Project. Private initiatives range from household greywater recycling and rainwater tanks to the Royal Canberra Golf Club drawing irrigation water from Lake Burley Griffin. The Commission’s 2012 investigation into secondary water use in the ACT provides more detailed information on these various initiatives.25
In the context of the tariff review, secondary water initiatives are significant because they provide a substitute for the primary water supply provided by Icon Water through its distribution network in non-potable applications.
commercial and industrial developments with a site area greater than 2,000 square metres.21 ACT Government, 2009: 23.22 ICRC, 2012: 79.23 ACT Government, 2013: 3.24 ACT Government, 2014e: 1–88.25 See www.icrc.act.gov.au/wp-content/uploads/2013/03/Report_6_of_2012_July_2012.pdf.
16 Issues paperTariff Review 2016

Box 2.6 Secondary water initiative examples
Harvesting precipitation
Public collecting stormwater from rain events in urban ponds and lakes for irrigating sports fields – the ACT Government’s Canberra Integrated Urban Waterways Project.
Private collecting rainfall roof run-off in rainwater tanks for household irrigation purposes – primarily a household initiative.
Wastewater recycling
Public Icon Water’s Lower Molonglo Water Quality Control Centre supplies treated sewage effluent to nearby vineyards (100 hectares) and a golf course (30 hectares).
Public Icon Water’s North Canberra Water Reuse Scheme provides treated sewage effluent to 70 hectares of ovals and open spaces across North Canberra.
Public Icon Water’s Southwell Park Watermining Project (now decommissioned) was a sewer mining scheme where a small treatment plant supplied treated sewage effluent to 10 hectares of playing ovals.
Private greywater from bathrooms and laundries can be used to water gardens through a gravity-fed hose from the laundry.
Private greywater storage, treatment and pumping systems allow recycling of wastewater from bathrooms and laundries for irrigation or internal reuse in toilets and laundries.
Private residential third-pipe systems (using greywater or treated sewage effluent) can be used for toilet flushing or garden watering – a third-pipe system was considered for the Molonglo Valley residential development.
Source: Updated from ICRC (2012).
2.4.2 National agreements and initiatives
The Murray–Darling Basin
The ACT is a signatory to the Murray–Darling Basin Agreement, an intergovernmental agreement between Basin jurisdictions. The agreement, among other things, sets a long-term cap – or upper limit – on surface water diversions. This allows the ACT to take out of the ACT watercourses (dams and rivers) a long-term average of 40 GL net per year for consumptive use.26
The Murray–Darling Basin Agreement has been superseded by the Murray–Darling Basin Plan, made in 2012 under the Commonwealth Water Act 2007. The Basin Plan provides a coordinated water resource management approach across the Basin’s four
26 A net cap means gross water extractions minus water returned to the river system after use.
Issues paperTariff Review 2016 17

1 – Introduction
states (New South Wales, Victoria, Queensland and South Australia) and the ACT.27 Among many other things, from 2019 the Basin Plan will replace the cap with sustainable diversion limits for both surface water and groundwater resources for each catchment and aquifer in the Basin.
The ACT’s sustainable diversion limit for surface water will be 50.5 GL per year, comprising:28
40.5 GL per year taken from watercourses;
1 GL per year taken by run-off dams; and
11 GL per year take by commercial forestry plantations.
From a water security context, it is the ACT’s watercourse sustainable diversion limit component that is of primary interest. Importantly, this component is measured on a net basis. That is, the measured volume of treated sewage effluent from the Lower Molonglo Water Quality Control Centre and Queanbeyan Sewage Treatment Plant returned to the river system after use is subtracted from the gross volume of water taken from ACT water resources.
Figure 2.4 shows the net watercourse take over the last 25 years. Total watercourse extractions, which include Icon Water dam releases, private irrigator diversions, and from 201213, Commonwealth Government diversions from Lake Burley Griffin, have fallen substantially over this period from highs of over 80 GL per year to about 50 GL in 201314. At the same time, returns to the river system from the sewage treatment plants have fallen less sharply to about 32 GL per year in recent years.
27 For more detail on the Basin Plan, see www.mdba.gov.au/what-we-do/basin-plan.28 Commonwealth of Australia, 2012: 199.
18 Issues paperTariff Review 2016
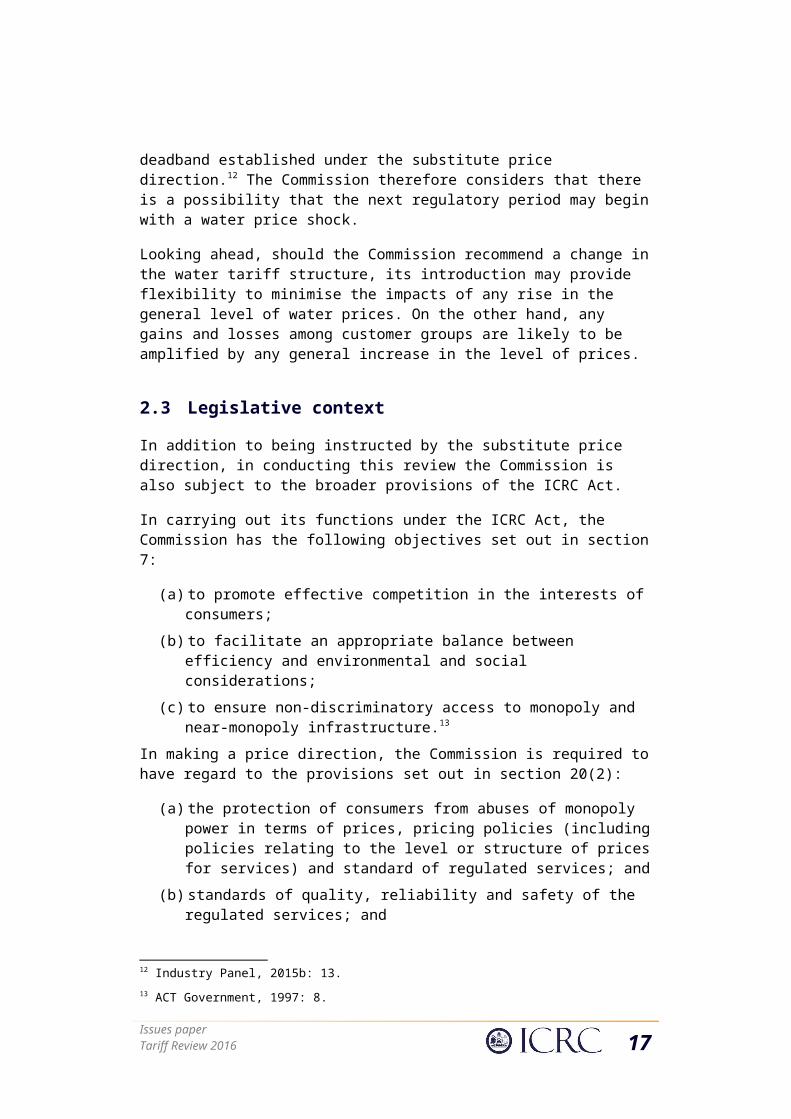
Figure 2.4 ACT net watercourse take, 1989–90 to 2013–14
0
10
20
30
40
50
60
70
80
90Net take (GL)Total take (GL)Icon Water and Queanbeyan City Council returns (GL)
Year ending 30 June
GL
Source: Icon Water dam releases data; Environment and Planning Directorate diversion and return data.
As a consequence, net take (the green bars in Figure 2.4) has fallen significantly to remain at or below 20 GL per year from 200708. This is well below the cap and the watercourse sustainable diversion limit. Given this, and the much lower levels of per capita water consumption discussed earlier, it is likely to be some time before the ACT watercourse sustainable diversion limit becomes a water security constraint.29
National Water Initiative
The 2004 National Water Initiative commits the ACT Government to a number of best practice water pricing and institutional arrangements.30 The intended outcomes of the pricing arrangements are shown in Box 2.5, and the agreed actions relevant to the provision of urban water services shown in Box 2.6.
29 In any case, following the introduction of the Basin Plan, should the ACT be unable to use water stored in its dams because it has reached the sustainable diversion limit, water trading offers a relatively simple solution, albeit with cost implications. Icon Water already holds 4.145 GL of New South Wales high-security water access entitlements.30 The National Water Initiative is an intergovernmental agreement between the Commonwealth of Australia and the governments of New South Wales, Victoria, Queensland, South Australia, the Australian Capital Territory and the Northern Territory.
Issues paperTariff Review 2016 19

1 – Introduction
Box 2.7 National Water Initiative best practice pricing outcomes
Outcomes
64. The Parties agree to implement water pricing and institutional arrangements which:
i) promote economically efficient and sustainable use of:
a) water resources;
b) water infrastructure assets; and
c) government resources devoted to the management of water;
ii) ensure sufficient revenue streams to allow efficient delivery of the required services;
iii) facilitate the efficient functioning of water markets, including inter-jurisdictional water markets, and in both rural and urban settings;
iv) give effect to the principles of user-pays and achieve pricing transparency in respect of water storage and delivery in irrigation systems and cost recovery for water planning and management;
v) avoid perverse or unintended pricing outcomes; and
vi) provide appropriate mechanisms for the release of unallocated water.
Source: COAG (2004).
20 Issues paperTariff Review 2016

Box 2.8 National Water Initiative best practice pricing actions
Actions
Water Storage and Delivery Pricing
65. In accordance with National Competition Policy commitments, the States and Territories agree to bring into effect pricing policies for water storage and delivery in rural and urban systems that facilitate efficient water use and trade in water entitlements, including through the use of:
i) consumption based pricing;
ii) full cost recovery for water services to ensure business viability and avoid monopoly rents, including recovery of environmental externalities, where feasible and practical; and
iii) consistency in pricing policies across sectors and jurisdictions where entitlements are able to be traded.
66. In particular, States and Territories agree to the following pricing actions: Metropolitan
i) continued movement towards upper bound pricing by 2008;
ii) development of pricing policies for recycled water and stormwater that are congruent with pricing policies for potable water, and stimulate efficient water use no matter what the source, by 2006;
iii) review and development of pricing policies for trade wastes that encourage the most cost effective methods of treating industrial wastes, whether at the source or at downstream plants, by 2006; and
iv) development of national guidelines for customers’ water accounts that provide information on their water use relative to equivalent households in the community by 2006.
Source: COAG (2004).
In 2010, a set of National Water Initiative pricing principles, agreed by all Australian governments and endorsed by the Natural Resource Management Ministerial Council, was developed as the basis for setting water prices in all jurisdictions.31 The 10 pricing principles for setting urban water tariffs are summarised in Box 2.7.
Box 2.9 National Water Initiative urban water price-setting principles
31 See www.environment.gov.au/topics/water/australian-government-water-leadership/national-water-initiative/national-water.
Issues paperTariff Review 2016 21
1 – Introduction
Principle 1: Cost recovery full recovery of efficient costs through upper bound pricing.32
Principle 2: Tariff structures two-part tariffs (service availability and water usage charge) unless demonstrated to not be cost-effective.
Principle 3: Cost-reflective tariffs for economic efficiency reasons, water usage charge should have regard to the long-run marginal cost of the supply of additional water (does not preclude inclining block charges where governments seek to promote efficient water use).
Principle 4: Setting the service availability charge should recover the difference between revenue collected from variable water charges and developer charges and total revenue requirement.
Principle 5: Pricing transparency tariffs should be set using a transparent methodology and subject to public consultation and scrutiny.
Principle 6: Over recovery of revenue – where water usage charges lead to revenue recovery in excess of upper bound revenue requirements in respect of new investments, jurisdictions are to address the over recovery.
Principle 7: Differential water charges water charges should be differentiated by the cost of servicing different customers where the benefits of doing so outweigh the costs of identifying differences and the equity advantages of alternatives.
Principle 8: Setting developer charges charges should reflect the investment in both new and existing assets required to serve a new development and have regard to the way in which ongoing water usage and service availability charges are set.
Principle 9: Capping developer charges charges should not exceed the costs of serving new developments, including investment in both new and existing assets.
Principle 10: Revenue from developer charges to avoid over-recovery, revenue from developer charges should be offset against the total revenue requirement either by excluding or deducting the contributed assets from the regulatory asset base or by offsetting the revenue recovered using other mechanisms.
Source: NRMMC (2010).
As the ACT Government is a signatory to the National Water Initiative and the Initiative’s pricing principles, the Commission is required to ensure, to the extent possible, that Icon Water’s water tariff structure is consistent with both.
32 The National Water Initiative defines upper bound pricing as ‘the level at which, to avoid monopoly rents, a water business should not recover more than the operational, maintenance and administrative costs, externalities, taxes or tax equivalent regimes, provision for the cost of asset consumption and cost of capital, the latter being calculated using a weighted average cost of capital’ (COAG, 2004: 30).
22 Issues paperTariff Review 2016

2.5 Recent pricing reviews and reports
There have been a number of water-specific and other relevant monopoly infrastructure pricing reviews and reports published in the last five years that provide useful context for the tariff review.
2.5.1 Grafton and Ward 2010 dynamic water pricing paper
In November 2010, Professors Quentin Grafton and Michael Ward of the Crawford School of Economics and Government at the Australian National University published a research paper on dynamically efficient urban water policy. This paper evaluated the welfare losses from the typical water restrictions approach to demand management and supply augmentation by comparing this approach to:
the use of dynamically efficient water pricing to determine: (1) the volumetric price and (2) the optimal time to invest in additional supply given variability in water availability.33
The paper concludes by advocating a dynamically efficient volumetric water price schedule that varies with available water storages, the adoption of which would ‘reduce or eliminate the need for quantitative water restrictions’ with consequent welfare benefits.34
2.5.2 Productivity Commission 2011 urban water sector report
The Productivity Commission published a report into Australia’s urban water sector in August 2011. The Independent Competition and Regulatory Commission made a submission on the draft report in June 2011.35 The submission raised concerns about the merits of the Productivity Commission’s support for marginal cost pricing and its inadequate consideration of the costs and benefits of flexible pricing.
As matters of interest for the tariff review, the final report included findings and recommendations on water, wastewater and stormwater, non-price demand management and rethinking price regulation.
Water, wastewater and stormwater
The findings included:
Substantial efficiency gains are available from no longer prescribing inclining block tariff structures.
There is scope for efficiency gains in moving to location-specific pricing, particularly where cost differences within the ‘postage stamp’ region are large and easy to quantify.
33 Grafton and Ward, 2010: i.34 Grafton and Ward, 2010: 2.35 ICRC, 2011: 1–5.
Issues paperTariff Review 2016 23

1 – Introduction
The National Water Initiative pricing principles provide scope to implement pricing policies that are inconsistent with economic efficiency.
The recommendations included:
Upfront developer charges should be used where the incremental costs of development are well established and benefits accrue mainly to those in the development.
Where, as in the case of urban infill, the benefits also accrue to incumbents, costs should be spread across all users.
All new single and multi-unit dwellings should have separate water meters installed. The case for retro-fitting existing single and multi-unit dwellings with separate water metering technology should be assessed by utilities.
Utilities should charge tenants directly for both the fixed and volumetric charges where water is separately metered. Where metering is in place, charges should include a volumetric component using a two-part tariff.
Greater choice in tariff offerings should be available to water consumers, based on the marginal opportunity cost of supply, which includes the direct short-run marginal cost of supplying water, the value of any externalities and the scarcity value of water as supply and demand conditions change.36
Non-price demand management
The Productivity Commission found that water restrictions generate net welfare losses for households, businesses and the community and that the evidence suggests that the costs of restrictions are substantial, with many consumers preferring to incur a larger bill rather than be subject to restrictions.37
The final report made three recommendations:
Water restrictions should be the exception, limited to emergencies and of short duration. Utilities should make decisions on when to prescribe restrictions, subject to supply obligations set out in utility governance charters.
Governments should not prescribe water use efficiency and conservation activities unless there is a market failure and the benefits of intervention exceed the costs.
Government education and information campaigns should be refocused to provide consumers with objective information on the costs and benefits of managing demand using prices, restrictions, water use efficiency and conservation measures.
36 Productivity Commission, 2011: XLIX–L.37 Productivity Commission, 2011: L–LI.
24 Issues paperTariff Review 2016

Rethinking price regulation
The Productivity Commission recommended a move away from regulatory price setting to a price monitoring regime with some form of prices oversight. 38 Further to this, it recommended that independent regulatory price setting should only be applied where it can be demonstrated that price monitoring and appropriate governance arrangements are unlikely to prevent misuse of market power.
2.5.3 NWC 2011 water pricing reform report
The National Water Commission (NWC) published a review of pricing reform in the Australian water sector in April 2011.
The review questioned the effectiveness of inclining block tariffs in managing variability in urban water supplies, stating that:
[f]or example, the second (top) tier price in the Australian Capital Territory is $4 per kL, which is likely to be far greater than the opportunity cost of water, particularly when dams in the territory are currently full.39
The review supported more flexibility in water pricing to help balance supply and demand and recommended that:
replacing an [inclining block] structure (which has no relationship to water scarcity) with a volumetric price that is based on the long-run marginal cost of supply when dam levels are high and the opportunity cost of water when dam levels are low would be an improvement.40
2.5.4 Frontier Economics 2011 water pricing paper
The NWC published a report written by Frontier Economics on dynamic or scarcity pricing in Australia in April 2011. This report explored the potential role of pricing, and particularly scarcity pricing, as one of several policy instruments, in helping to efficiently balance water supply and demand over both the short and long term. The report found that:
Overall, scarcity pricing has many potential advantages over the current arrangements which entail inclining block tariffs based on long-run marginal cost (LRMC) supplemented with activity-based water restrictions to manage short-term shortages.41
2.5.5 IPART 2012 water and sewerage services tariff review
The New South Wales Independent Pricing and Regulatory Tribunal (IPART) undertook a review of pricing structures for the four metropolitan water utilities it
38 Productivity Commission, 2011: LVI.39 NWC, 2011b: xiii.40 NWC, 2011b: xvi.41 NWC, 2011a: vii.
Issues paperTariff Review 2016 25

1 – Introduction
regulates Sydney Water, Hunter Water, Gosford Council and Wyong Council publishing a final report in March 2012.
The review did not concern itself with the utilities’ current two-part tariff structure for water and sewerage services on the basis that IPART is ‘satisfied it is efficient and equitable’.42 Instead, the review examined the current fixed and variable charges applicable to different groups of customers within the broad categories of residential and non-residential customers.
The review made a number of findings, including:
There are some significant differences between the charges applicable to customer groups that impose similar costs on their utility. For example, the structure of the residential water service charges of three of the four utilities leads to customers with free-standing houses typically paying a lot more than those with flats or units in a building with a shared water meter.
There is no evidence that the cost of services to residential dwellings varies by the type of dwelling; rather, the cost of service was more likely to vary with locational differences.
While the utilities’ water usage charges are appropriately set with reference to their long-run marginal costs of water supply, there is less rationale or cost-reflective basis for their sewerage usage charges for non-residential customers.
IPART took the view that it is better to set sewerage usage charges ‘with reference to the short run marginal cost of transporting, treating and disposing of domestic-strength effluent’.43
The review also presented a set of principles for reforming water and sewerage price structures to improve their cost reflectivity and horizontal equity. IPART subsequently applied these principles in its price reviews for the urban water utilities.
42 IPART, 2012a: 1.43 IPART, 2012a: 2.
26 Issues paperTariff Review 2016

Box 2.10 IPART’s principles for price structure for metropolitan water utilities
General principles
Changes to the structure of water and sewerage prices are to be phased in over a transition period where necessary to minimise customer impacts.
The total revenue collected from residential customers is to reflect the costs incurred in serving those customers. The total revenue collected from non-residential customers is to reflect the costs incurred in serving those customers.
Customers imposing similar costs on the system should pay similar charges.
Residential and non-residential water usage charges
The water usage charge is to be a standard variable charge for all customers – residential and non-residential – and be set with reference to the utility’s long-run marginal cost of supply.
Residential water and sewerage service charges
The residential water service charge is to be a standard annual charge for all residential dwellings unless there is evidence that there are material differences in the costs of servicing different residential property types.
The residential sewerage service charge is to be a standard annual charge for all residential dwellings unless there is evidence that there are material differences in the costs of servicing different residential property types.
Non-residential water service charges and sewerage usage and service charges
The non-residential sewerage usage charge is to be a standard variable charge for all customers set with reference to, but not necessarily equal to, the utility’s short-run marginal cost of transporting, treating and disposing of domestic-strength effluent.
The total sewerage revenue (usage and service charges) collected from non-residential customers is to reflect the costs incurred in servicing those customers.
The total water revenue (usage and service charges) collected from non-residential customers is to reflect the costs incurred in servicing those customers.
Source: IPART (2012a).
2.5.6 Essential Services Commission 2013 water review
In advance of its review of water and sewerage services prices charged by Victoria’s 19 water businesses, the Essential Services Commission developed a set of tariff
Issues paperTariff Review 2016 27

1 – Introduction
assessment principles to guide water businesses in developing their water plans on which prices would be based. These principles are shown in Table 2.2.
Table 2.2 Essential Services Commission 2013 water review – tariff assessment principles
Area PrincipleSustainable revenue
Tariff structures, levels and the form of price control should ensure an economically sustainable revenue stream over the Water Price Review period.
Subsidy-free pricing and inefficient bypass
For each tariff class, the revenue expected to be recovered should lie on or between an upper bound representing the stand-alone cost of serving the customers in that class and a lower bound representing the avoidable cost of not serving those customers.
Tariff structures Tariff structures should be simple, understandable and cost-reflective.Bulk water charges structure – A two-part charge comprising a fixed charge and a volumetric component is preferred to recover a bulk supplier’s revenue requirement from its customers for each bulk water service.Retail water tariffs structure – A two-part tariff comprising a fixed charge and a volumetric component is preferred to recover a water business’s revenue requirement from each tariff class. If a business proposes an alternative tariff structure, it should set out the objectives of this tariff structure and provide supporting analysis showing how these objectives would be better met by the proposed tariff structure.Sewerage charges – The tariff structure should reflect the cost structure – and may comprise a one- or two-part tariff (all fixed, all volumetric or a fixed charge and a volumetric component).Trade waste – Trade waste charges should be load-based where measurement is feasible and where the benefits outweigh the costs.
Determining fixed charges
Fixed charges should be calculated to recover the difference between the total revenue requirement for a tariff class and the revenue recovered through volumetric charges.
Determining volumetric charges
The volumetric charge should have regard to the long-run or short-run marginal costs, where appropriate.
Customer focus and equity
Retail tariff and service offerings, and the form of price control, should have regard to the ability of customers to understand the tariff and service offering and respond to price signals, customer preferences and needs in relation to service standards or new services, the costs of implementing the tariff offering, including administration and marketing costs and price path stability.
Source: ESC (2011a).
2.5.7 2014 AEMC electricity distribution networks tariff reform
In common with the ACT water and sewerage industry, the electricity distribution industry in Australia is a regulated monopoly network. As such, pricing arrangements and reforms in the electricity distribution space are relevant to the tariff review.
In November 2014, the Australian Energy Market Commission (AEMC) made a final determination that sets out new rules that will require electricity distribution network businesses to develop prices that better reflect the costs of providing services to individual consumers so that they can make more informed decisions about how they use electricity.44 The final determination is summarised in Box 2.9.
44 AEMC, 2014: 1–232.
28 Issues paperTariff Review 2016

Box 2.11 Electricity Distribution Network Pricing Arrangements Rule 2014 summary
Pricing objective
Under the final rule, network businesses’ pricing decisions will be guided by a pricing objective that network prices should reflect the businesses’ efficient costs of providing services to each consumer. Businesses will be required to comply with several pricing principles when determining the structure and level of their network prices.
Pricing principles businesses must comply with the pricing principles in a way that contributes to the pricing objective.
Each network tariff must be based on the long-run marginal cost of providing the service.
The revenue to be recovered from each network tariff must reflect the network businesses’ total efficient costs of providing services to the consumers assigned to that tariff.
Distribution businesses must also give effect to a consumer impact principle when developing their tariffs.
Network tariffs must also comply with any jurisdictional pricing obligations imposed by state or territory governments.
The revenue expected to be recovered from a tariff class should lie between the stand-alone cost of providing the service to the relevant consumers and the avoidable cost of not providing the service.
Customer consultation
There will also be more consultation with consumers and retailers in the development of network prices, and the process for setting prices will be more transparent. Network prices will be finalised earlier, allowing consumers and retailers more time to prepare for price changes.
Source: AEMC (2014).
The AEMC also commissioned a number of consultant reports, two of which, NERA (2014) and The Brattle Group (2014), provide background material on the economic concepts underpinning the pricing of infrastructure distribution networks and promoting efficiency through tariff design.
2.6 Water supply and demand context
In 2007, the ACT was at the tail end of the Millennium Drought, which affected southeast Australia from about 1997 to 2009. The ACT water security situation had rapidly deteriorated – severe Stage 3 temporary water restrictions were introduced in November 2006 and combined dam volume fell to a low of 31 per cent of capacity, or
Issues paperTariff Review 2016 29

1 – Introduction
about 64 GL, by mid-2007. This was due to very low rainfall in 2006, which, together with the residual impact from the 2003 bushfires, translated into extremely low annual dam inflows of 28 GL, only 12 per cent of the long-term average inflow of 235 GL per annum.45
The Millennium Drought broke in spectacular fashion in 2010. Over the period 2009 to 2014, ACTEW Water, as it was then known, also invested heavily in new major water security projects, including the enlarged Cotter Dam and the Murrumbidgee to Googong pipeline project. The enlarged Cotter Dam increased total ACT dam storage capacity from 207 to 278 GL. In September 2015, combined dam volume was about 82.5 per cent of capacity or 229 GL.
On the demand side, average water consumption per capita for the ACT and Queanbeyan has fallen dramatically from the relatively high levels seen before 2007.46 As shown in Figure 2.5, the average consumption over the 1998–99 to 2005–06 period was about 164 kilolitres per person per annum (kL/person/a). The average over the period from 2006–07 to 2014–15 has fallen sharply to about112 kL/person/a.
Figure 2.5 ACT and Queanbeyan per capita water consumption, 1998–99 to 2014–15
1999 2000 2001 2002 2003 2004 2005 2006 2007 2008 2009 2010 2011 2012 2013 2014 20150
20
40
60
80
100
120
140
160
180
200
175 166 177 183 181 143 141 146 134 113 114 112 100 100 113 114 107
Year ending 30 June
kL p
er c
apita
Average 1998–99 to 2005–06
Average 2006–07 to 2014–15
Source: Icon Water dam releases data; ABS (2014); ACT Government (2014a).
As expected, demand fell particularly sharply during the period when the more severe Stage 2 and Stage 3 temporary water restrictions were in place over the period 2006 to 2010. However, the more interesting point is that per capita consumption has not risen since the removal of restrictions in 2010. This is likely to be due to a number of factors, including the adoption of water-efficient devices such as low-flow shower
45 ICRC, 2012: 17.46 Consumption in this context refers to water abstracted from ACT dams and rivers by Icon Water to supply the ACT and Queanbeyan. It incorporates network losses through leakage and the like as water is delivered to the final end-user through Icon Water’s distribution and treatment network.
30 Issues paperTariff Review 2016

heads, installation of rainwater tanks, more customers living in units and houses on smaller blocks, and a significant increase in the price of water in recent years.47,48
A separate matter relates to the structure of water demand under Icon Water’s inclining block structure. In its forecasting work earlier this year, the Commission analysed the relationship between the average amount of water consumed by each customer per year and the observed proportion of sales falling into the tier 1 category, shown in Figure 2.6. The analysis suggests that should total water sales remain at current levels and customer numbers rise each year, the proportion of tier 2 sales will fall. This has direct implications for the value of tier 2 sales as a revenue recovery mechanism for Icon Water.
Figure 2.6 Observed tier 1 water sales proportion, 2008–09 to 2013–14
0.220 0.230 0.240 0.250 0.260 0.270 52
54
56
58
60
62
64
ML per customer
Tier
1 p
ropo
rtion 2010–11 2011–12
2012–13
2009–10
2013–14
2008–09
Source: ICRC (2015b).
In summary, ACT water security is in much better shape now, from both a supply and demand perspective, than it was when the tariff structures were last substantively reviewed in 2007. Indeed, in the Commission’s 2012 final report on secondary water use in the ACT, the Commission stated:
Based on results from the ActewAGL water supply and demand model, the ACT is likely to be water secure for the next 20 years. Existing dams are full and the completion of the enlarged Cotter Dam will increase current ACT dam capacity by more than a third. The ACT is unlikely to face any water restrictions in the near term,
47 See section 4.1 for more details on current and historical water prices.48 For example, the ACT Government’s report into its review of the Waterways: Water Sensitive Urban Design General Code notes that there is a trend towards reduced block sizes and larger building envelopes (ACT Government, 2014e: 26).
Issues paperTariff Review 2016 31

1 – Introduction
and restrictions are only likely to be imposed on rare occasions over the medium term.49
The water demand and supply context is particularly relevant to tariff structure debates, such as using water prices as a demand-side alternative to temporary water restrictions in time of drought, or having an inclining block tariff to reduce water use more generally. In addition, understanding the determinants of the reductions in per capita demand, and the light they may shed on whether the current low levels are likely to continue into the future, is important in designing a tariff structure that will not require frequent changes.
49 ICRC, 2012: xi.
32 Issues paperTariff Review 2016

3 Proposed economic regulation objective and pricing principles
3.1 Introduction
It is common practice, at the start of a tariff review process, for the regulator to present a frame of reference to guide its evaluation of the existing tariff structure and potential alternatives. The frame of reference has the added benefit of clarifying the regulator’s decision-making approach for stakeholders and so enabling more productive engagement.
Such a framework generally starts by describing the overarching objective or goal of economic regulation of the regulated utility, followed by a set of tariff design or pricing principles, the application of which will help achieve that objective. In other words, given an objective, the principles postulate the general characteristics that any tariff structure should exhibit if it is to achieve the objective.
In developing the proposed objective and pricing principles, the Commission has taken into account the legislative requirements set out in the ICRC Act and the relevant ACT Government policies and national commitments. The Commission has also been informed by the approaches adopted by other jurisdictional regulators in reviewing tariffs.
As discussed in section 2.3 of this paper, the Commission is generally guided by the objectives set out in section 7 of the ICRC Act, and, more specifically, when making a price or varying a price direction, must have regard to the requirements set out in section 20(2). Mr Peter Grant, in his recent review of the regulatory framework for the pricing of water and sewerage services in the ACT, noted two key concerns regarding the matters the Commission is required to take into account.
The first is that the ICRC Act does not articulate any overarching or primary objective. The second is that the various objectives in section 7 and the requirements of section 20(2) of the ICRC Act are potentially conflicting, requiring trade-offs to be made between them.50
In response to the Grant review’s first concern, the Commission is proposing to adopt, for the purposes of this tariff review, an overarching objective for economic regulation. This objective will assist the Commission in dealing with the second concern by providing guidance as to the relevance of the various legislative requirements to the development of a set of pricing principles for the review.
Given the importance of the frame of reference in guiding the Commission’s assessment of the current and alternative tariff structures, the Commission welcomes early comment from stakeholders on the proposed overarching objective and pricing principles set out in the remainder of this chapter.
50 Grant, 2015: xii.Issues paperTariff Review 2016 33

Error: Reference source not found – Error: Reference source not foundError: Reference source not found – Error: Reference source not found
3.2 Proposed economic regulation objective
As noted above, the Commission does not have one overarching objective that guides its approach to economic regulation. Instead, the Commission is required to have regard to a range of objectives, including economic efficiency, social and environmental objectives, and financial viability of the regulated utility. Similarly, the overarching objective of the National Water Initiative, set out in paragraph 23, focuses on optimising economic, social and environmental outcomes.51
The Grant review concluded by recommending that:
There is a strong case to insert an overarching objects clause into the ICRC Act which makes it clear that the primary objective of the regulatory framework is to promote the goal of economic efficiency, while safeguarding the financial viability of the regulated entity. This would provide useful guidance to the ICRC in balancing the multiple considerations listed in section 20(2) of the ICRC Act, and making the necessary trade-offs.52
The Grant review cited the National Electricity Objective, set out in the National Electricity Law, and shown in Box 3.1, as an example of an overarching efficiency objective for the economic regulation of electricity services.
Box 3.12 National Electricity Objective
The objective of this Law is to promote efficient investment in, and efficient operation and use of, electricity services for the long term interests of consumers of electricity with respect to
(a) price, quality, safety, reliability and security of supply of electricity; and
(b) the reliability, safety and security of the national electricity system.
Source: SA Government, 1996: Schedule, National Electricity Law, part 1, section 7.
In its response to the Grant review, the ACT Government agreed with the recommendation to adopt an overarching economic efficiency objective, stating:
The Government will undertake further consideration of the exact form of the objectives clause, including whether it should be reflective of an existing objectives clause, for example the National Electricity Objective.53
The Commission agrees that the introduction of an overarching economic efficiency objective would be helpful to guide the Commission’s decision-making processes. In assessing the benefits of adopting an objective similar to the National Electricity Objective for the economic regulation of water and sewerage services in the ACT, the phrase ‘long-term interests of consumers’ requires further elucidation.
51 COAG, 2004: 3.52 Grant, 2015: 86.53 ACT Government, 2015a: 7.
34 Issues paperTariff Review 2016

First, the term ‘interests’ is rather broad. The Commission’s preference is to consider the social welfare of the ACT community when undertaking its economic regulatory functions. More specifically, the objective of economic regulation of a utility should be the maximisation of social welfare for the community.
The economic question at the heart of this approach is what constitutes a socially optimal or economically efficient plan of production and allocation of water and sewerage services among consumers. The economic literature generally avoids evaluating changes that involve a loss in welfare for some groups in order to achieve a gain in welfare for others. Instead, economics has developed the concept of ‘Pareto optimality’, also known as ‘Pareto efficiency’.54 An economic outcome is Pareto-efficient if it is impossible to make some individuals better off without making some other individuals worse off. When examining a single market using the tools of partial equilibrium analysis, embodied in the familiar supply and demand curves, the concept of Marshallian aggregate surplus provides a ready means of judging whether a change in market outcomes increases or decreases social welfare.55
This social welfare approach, discussed in more detail later in this chapter and in Chapter 4, when applied in the case of a market failure such as a natural monopoly, is consistent with Train (1991), who argues that:
[t]he purpose of regulation is to ensure socially desirable outcomes when competition cannot be relied on to achieve them.56
Second, the phrase ‘long-term’ requires further elucidation. In its 2014 report on best practice retail electricity pricing, the Australian Energy Market Commission articulated an objective for retail price regulation, based on the National Electricity Objective, that required ‘promoting the long-term interests of customers’.57 In its draft report for the 2014 retail electricity price investigation, the Commission commented on this objective and in particular the fact that ‘long term’ could be interpreted in a range of ways.
When economists speak of the long term, they usually have in mind some point in the, possibly far, future. To adopt this interpretation would lead to considering only the welfare of some distant descendants of the present community of the ACT. The Commission takes the view that common sense and the statutory framework within which it operates weigh against adopting such an interpretation. The Commission’s preference is to adopt an interpretation that recognises that a particular measure or decision might reduce welfare in the immediate future but confer benefits at some later point. In recognising this possibility, the Commission would, however, expect that the
54 For a full treatment of welfare economics and Pareto efficiency, see Mas-Colell, Whinston and Green, 1995: Chapter 10.55 Measuring welfare using the concept of aggregate surplus, which is the sum of producers’ and consumers’ surplus, was introduced by Alfred Marshall in his analysis of the effects of taxes and price shifts on market equilibrium.56 Train, 1991: 2.57 AEMC, 2013: 9.
Issues paperTariff Review 2016 35

Error: Reference source not found – Error: Reference source not foundError: Reference source not found – Error: Reference source not found
benefits of the measure should outweigh its costs, where more distant costs and benefits may be given less weight in the assessment than those accruing earlier.
The Commission’s proposed economic regulation objective for the purposes of the tariff review is set out below.
Economic regulation objective: To promote the efficient investment in, and efficient operation and use of, Icon Water’s regulated water and sewerage services to maximise the social welfare of the community over the long term.
Q1: Do you think that the proposed overarching objective will provide an effective foundation for assessing current and alternative tariff structures? If not, why?
3.3 Proposed pricing principles
This section sets out the proposed pricing principles, the application of which is intended to assist in maximising the long-term social welfare of the community.
As noted above, the ICRC Act requires the Commission to have regard to a range of objectives, including economic efficiency, social and environmental objectives, and financial viability of the regulated utility. The advent of the overarching objective of maximising social welfare, discussed above, would allow the Commission to give primacy to the role of tariffs in promoting economic efficiency and, therefore, maximising social welfare in developing a set of pricing principles.58 This is not to say that the Commission should entirely jettison its other legislative requirements in considering tariffs.
The financial viability requirements cannot be avoided and can be considered as a constraint in the exercise of maximising social welfare. That is, we are dealing with a constrained maximisation problem, with social welfare maximised subject to a revenue constraint.59
As for the social or community impact requirements, the Commission’s view is that while income distribution questions are more efficiently dealt with by the general government tax and transfer system, these matters cannot be completely overlooked when considering alternative tariff designs.
The Commission has categorised its set of proposed principles into three streams: economic efficiency, financial viability and community impacts. These are discussed in turn.
58 The environmental requirements are considered within the rubric of economic efficiency.59 This is important because, as discussed below, it is likely that the nature of the water and sewerage services industry is such that the (unconstrained) social optimum would involve less than full recovery of the costs of providing the services.
36 Issues paperTariff Review 2016

3.3.1 Economic efficiency
In addition to the proposed overarching social welfare objective, section 20(2) of the ICRC Act specifically requires the Commission to have regard to the need for greater efficiency in the provision of regulated services to reduce costs to consumers and taxpayers. Paragraph 64(i) of the National Water Initiative further commits Australian jurisdictions to implement water pricing arrangements that promote the economically efficient and sustainable use of water resources and water infrastructure assets. This suggests an efficiency focus on the water itself, as well as the storage, treatment and delivery infrastructure necessary to provide the water to customers.
Pareto optimality addresses the ‘fundamental issue of economics: the organisation of production and the allocation of resulting commodities among consumers’.60 The ‘organisation of production’ part deals with what is commonly termed productive or technical efficiency and is concerned with the allocation of factors of production to ensure goods and services are produced at the lowest possible resource cost. The ‘allocation of resulting commodities among consumers’ part deals with what is often called ‘allocative efficiency’ and is concerned with the efficient allocation of resources and commodities between competing uses. A Pareto optimal outcome is one where the commodities, or services in this particular case, are produced at least cost and allocated efficiently between consumers.
The productive efficiency of the delivery of water and sewerage services is a key consideration in the Commission’s assessment of the prudence and efficiency of Icon Water’s operating and capital costs as part of a price investigation process leading up to a new regulatory period. In considering the design of water and sewerage services tariffs in this review, it is the allocative efficiency aspect of Pareto optimality which is of primary relevance that is, the efficient allocation of water and sewerage services to Icon Water customers.61
Pricing principle 1: Tariff structures and prices should promote the economically efficient use of Icon Water’s water and sewerage services infrastructure, and in the case of water should also encourage economically efficient use of the water resource.
An economically efficient (to the extent possible given the natural monopoly situation and a revenue constraint) tariff structure will assist in achieving the objective of maximising social welfare by providing price signals often called cost-reflective pricing to Icon Water customers about the efficient costs and therefore the efficient use of the service infrastructure and water resource.62
60 Mas-Colell, Whinston and Green, 1995: 307.61 This encompasses both the total amount of water and sewerage services consumed and the distribution of that consumption among customers. The objective is to secure an outcome in which social welfare could not be improved by consuming more of the services, nor by reallocating consumption between users, nor by some combination of the two.62 It is important to note that prices can be cost-reflective only if the costs reflected are prudent and efficient.
Issues paperTariff Review 2016 37

Error: Reference source not found – Error: Reference source not foundError: Reference source not found – Error: Reference source not found
Marginal cost pricing is an approach commonly advocated to give effect to this proposed principle when regulating monopoly utility prices. There are a number of theoretical and practical implications associated with marginal cost pricing, especially in a monopoly situation, including:
the need for pricing mechanisms such as the two-part tariff structure to recover total costs where average costs are decreasing and, therefore, marginal costs are less than average costs;
the question of whether consumers respond to marginal or average costs; and
whether to use short-run or long-run marginal costs as a reference point for setting prices.
The theory and practice of marginal cost pricing in a regulated monopoly situation is discussed in more detail in section 4.5.1. During the course of the tariff review, and in the planned technical paper on marginal cost pricing, the Commission will assess the benefits and practicality of applying the marginal cost pricing approach to Icon Water’s water and sewerage services tariffs to encourage efficient use of the water network.
There is also the separate question of whether the marginal cost or value of the water resource itself should be considered in addition to marginal infrastructure costs. The argument here is that this cost increases as water availability decreases to send a signal to consumers about the scarcity of the resource. The Commission will also further investigate the potential application of marginal cost pricing in promoting the efficient use of ACT water resources, such as through scarcity pricing approaches. This is discussed in more detail in section 4.5.2.
3.3.2 Financial viability
Full cost recovery
Section 20(2) of the ICRC Act contains a number of items that require the Commission to have regard to the financial viability of the utility providing the regulated services. These include:
the standards of quality, reliability and safety of the regulated services;
an appropriate rate of return on any investment in the regulated industry;
the cost of providing the regulated services; and
the borrowing, capital and cash flow requirements of people providing regulated services and the need to renew or increase relevant assets in the regulated industry.
In a similar vein, paragraph 65(iii) of the National Water Initiative commits jurisdictions to full cost recovery for water services to ensure business viability. This commitment is also reflected in the National Water Initiative urban water price-setting principles.
38 Issues paperTariff Review 2016

The Commission’s view is that the full recovery of allowed revenue through tariffs is a legislative requirement, in large part because the alternatives are not attractive.
If a deliberate choice is made to allow Icon Water not to recover its costs through tariffs, there are two possible outcomes. Icon Water eventually goes bankrupt and ceases to operate, with clear negative implications for social welfare. Alternatively, the ACT Government meets the revenue shortfall by providing a subsidy on behalf of the ACT community as taxpayers. To avoid any reduction in the level of existing government services, this would likely result in the level of taxation going up commensurate with the shortfall. Given that the ACT community as water and sewerage customers and the ACT community as taxpayers are not necessarily the same, this shifting of the burden between the two is likely to be controversial.63
Pricing principle 2: Tariff structures and prices should reflect the full recovery of the prudent and efficient costs of providing regulated water and sewerage services to ensure business viability.
If this principle is adopted, at the business level it will define the revenue constraint to which the maximisation of social welfare is subject. Further, it is the Commission’s view that the full cost recovery principle should also be applied at the customer segment or tariff class level to ensure that no tariff class requires a cross-subsidy from other customers.64 This approach is consistent with cost-reflective pricing, and accords with community notions of equity. It will also assist in promoting a socially optimal outcome if the full costs of providing the service are reflected in the prices for each class.
Currently, ACT water tariffs do not distinguish between customer classes. Should the tariff review reveal evidence that there are cost differences between servicing different customer classes, such as residential and business customers, adoption of this principle would imply the need for different tariffs.
Section 20(2)(a) of the ICRC Act requires the Commission to have regard to the protection of consumers from abuses of monopoly power in terms of prices and pricing policies, including policies relating to the level or structure of prices for services. Tailoring the full cost recovery principle to the recovery of prudent and efficient costs only is consistent with this requirement.65
63 In its 2013 final report on regulated water and sewerage services, the Commission noted the distinction between the ACT community as customers and taxpayers on the basis that there are likely to be taxpayers who consume virtually no water and large water customers who may pay little tax (ICRC, 2013a: 63).64 Note that the current 50 per cent rebate on water and sewerage charges for educational and church institutions is not subsidised by other water and sewerage services customers. Rather, Icon Water is compensated for the cost of the rebate by the ACT Government.65 The Commission already applies this approach when setting Icon Water’s regulated prices. It does this by determining Icon Water’s prudent and efficient operating and capital costs as the first step in the price determination process.
Issues paperTariff Review 2016 39

Error: Reference source not found – Error: Reference source not foundError: Reference source not found – Error: Reference source not found
Revenue sustainability
Another factor pertinent to full cost recovery is the risk faced by the utility in recovering its revenue allowance over the regulatory period.66 In Icon Water’s case, given the current two-part water tariff that includes a volumetric component, which recovers a substantial portion of its revenue requirement, a major source of uncertainty relates to demand for its water services.67
The Commission is required to determine Icon Water’s prices in advance of the period in which it provides water and sewerage services. This requires the Commission to determine a forecast water sales volume for each year of the regulatory period. Actual sales, and therefore revenue outcomes, will differ from the forecast depending in large part on the weather conditions that eventuate. An added complication under an inclining block tariff is the requirement to forecast not only the aggregate level of water sales but also the tier 1 and tier 2 volumes.
As discussed in section 2.2.1, the form of price control can have implications for revenue uncertainty. In addition, there are a number of specific regulatory tools for dealing with this type of revenue uncertainty, including cost pass-throughs and under-recovery/over-recovery arrangements. These, however, are topics for discussion in the price investigation leading up to the next regulatory period. More pertinently, the choice of tariff structure and levels of prices can have a direct impact on revenue sustainability. For example, under a two-part water tariff, the higher the fixed charge, the lower the revenue uncertainty, as a smaller portion of total revenue recovery depends on the level of water sales.
Pricing principle 3: Tariff structures and prices should facilitate the recovery of Icon Water’s allowed revenue over the regulatory period.
Should this principle be adopted, a practical implication concerns consideration of introducing a volumetric charge for sewerage services under a two-part tariff arrangement. Should such a proposal require a forecast of the volumetric element, it would add a layer of revenue uncertainty to Icon Water’s sewerage services business, which would need to be offset by other benefits to make it worthwhile.
3.3.3 Community impacts
Section 20(2) of the ICRC Act contains a number of things that require the Commission to have regard to the implications of its pricing decisions for the ACT community. These include:
66 It is important to note that the broader question of determining a revenue allowance that allows recovery of Icon Water’s full costs over the lifetime of its infrastructure assets multiple regulatory periods is not a matter for the tariff review. The Commission, in its response to the Industry Panel process, has commented at length on the longer-term financial risks associated with the indexed RAB approach adopted by the Industry Panel to determine Icon Water’s cost of capital (ICRC, 2015a: Appendix 2).67 Given the current water security situation as discussed in section 2.6, the Commission’s view is that the likelihood of Icon Water facing any water supply-side risk is remote.
40 Issues paperTariff Review 2016

the need for greater efficiency in the provision of regulated services to reduce costs to consumers and taxpayers; and
the social impacts of the decision.
It is a widely accepted principle that the most efficient and effective way to redistribute income between socioeconomic groups is the general government tax and transfer system. Alternatively, it is less efficient to use tariffs, which do not reflect full cost in the deliberate pursuit of the social goal of redistributing income between socioeconomic groups. Moreover, it is the Commission’s view that the pursuit of economic efficiency will best achieve a socially optimal outcome for the ACT community, as long as the government deals with distributional issues through the general tax and transfer system. This is in line with the Grant review’s position:
A primary emphasis on economic efficiency can be expected to best serve the overall public interest, provided that social and equity objectives are addressed by government in other ways.68
Nonetheless, as the cost of provision of an essential service such as water and sewerage services can have a significant impact on individual consumer welfare, the Commission has identified a number of areas in which tariff design can assist by providing price path stability, simplicity and pricing transparency. These are discussed in turn below.
Price path stability
There are two aspects that relate to price path stability. The first is the stability of the tariff structure over a period of time. The second concerns the transition from one tariff structure to another. These are dealt with in turn.
Stability over timeThe tariff structure should be robust enough to promote economic efficiency over a reasonable period of time for a number of reasons. The first is that any change from current arrangements may result in winners and losers. Frequent changes are therefore to be avoided if possible. The second reason is the cost involved in the administrative process of changing tariff structures.
Pricing principle 4: Tariff structures should be robust enough to promote the economically efficient use of Icon Water’s water and sewerage services infrastructure over a reasonable period of time.
The application of marginal cost pricing to promote efficiency relies on customers understanding the prices they face and adjusting their usage accordingly. Frequent changes in tariff structures are likely to work against this. Should this pricing principle be adopted, it will contribute to the proposed overarching economic regulation objective by minimising the requirement for frequent tariff structure changes.
68 Grant, 2015: xii.
Issues paperTariff Review 2016 41

Error: Reference source not found – Error: Reference source not foundError: Reference source not found – Error: Reference source not found
If adopted, this principle will require the Commission, among other things, to investigate the reasons for the significant fall in per capita water use over the last decade or so in order to form a view on whether the current levels are likely to continue into the future.
Transition arrangementsNot surprisingly, customers generally prefer a stable price path from one year to the next. Price instability increases the uncertainty associated with customer investment decisions – for example, the decision to invest in additional rainwater tanks or a swimming pool. Given that a tariff structure change, all other things being equal, may result in winners and losers among different customer groups, any change should be implemented in a way that minimises any price shocks for the losers.
Pricing principle 5: Any change to the structure of tariffs and prices that will have substantial customer impacts should be phased in over a transition period to allow customers reasonable time to adjust to the change.
Should this principle be adopted, practical implications, such as the length of the transition period and how a price shock might be defined, are matters that will depend on the particular circumstances prevailing when a tariff change is implemented. If adopted, as part of the tariff review process, the Commission will assess the distributional impacts on customer bills of the various tariff alternatives being considered and explore possible transition paths to any new arrangements.
Simplicity
In its analysis of the case for introducing a competition allowance in the ACT retail electricity market in 2014, the Commission examined the role of the rational consumer in responding to market signals. The Commission found a sizable economics literature that suggests a range of seemingly irrational behaviour by consumers at both the theoretical and empirical level for a number of reasons, including tariff complexity. This is discussed in more detail in section 4.5.4.
Pricing principle 6: Tariff structures should be simple for customers to understand and straightforward for the utility to implement.
Although water and sewerage services consumers face a much simpler choice with only one provider in the ACT, the principal findings are still relevant: to ensure that customers can respond to the price signals built into cost-reflective tariffs designed to contribute to the achievement of a socially optimum outcome. This implies that tariffs should be simple and easy to understand. Readily understood tariff structures have the added benefit of being easier and cheaper for the utility to implement.
Pricing transparency
The ACT Government has committed to pricing transparency in signing up to the National Water Initiative urban water pricing principles. The fifth pricing principle
42 Issues paperTariff Review 2016

under the Initiative states that tariffs should be set using a transparent methodology and subject to public consultation and scrutiny.
Pricing principle 7: Tariffs should be set using a transparent methodology and subject to public consultation and scrutiny.
This proposed principle relates more to process than outcomes. Indeed, it is currently being applied with the release of this tariff review issues paper for public consultation. As the review progresses, the Commission will endeavour to clearly explain how each of the alternative tariff structures, and ultimately the level of prices, would operate.
Q2: Do you think that the set of proposed principles will provide an effective basis for assessing current and alternative tariff structures? If not, why? Are there any additional principles that you think the Commission should consider? If yes, what are they and why?
3.4 Conclusion
The proposed overarching economic regulation objective and pricing principles are summarised in Box 3.2. It will be evident to the astute reader that the primacy given to economic efficiency in the proposed overarching objective will assist the Commission in making any potential trade-offs between the proposed pricing principles.
Issues paperTariff Review 2016 43

Error: Reference source not found – Error: Reference source not foundError: Reference source not found – Error: Reference source not found
Box 3.13 Commission’s proposed economic regulation objective and pricing principles
Economic regulation objective: To promote the efficient investment in, and efficient operation and use of, Icon Water’s regulated water and sewerage services to maximise the social welfare of the community over the long term.
Pricing principle 1: Tariff structures and prices should promote the economically efficient use of Icon Water’s water and sewerage services infrastructure, and in the case of water should also encourage economically efficient use of the water resource.
Pricing principle 2: Tariff structures and prices should reflect the full recovery of the prudent and efficient costs of providing regulated water and sewerage services to ensure business viability.
Pricing principle 3: Tariff structures and prices should facilitate the recovery of Icon Water’s allowed revenue over the regulatory period.
Pricing principle 4: Tariff structures should be robust enough to promote the economically efficient use of Icon Water’s water and sewerage services infrastructure over a reasonable period of time.
Pricing principle 5: Any change to the structure of tariffs and prices that will have substantial customer impacts should be phased in over a transition period to allow customers reasonable time to adjust to the change.
Pricing principle 6: Tariff structures should be simple for customers to understand and straightforward for the utility to implement.
Pricing principle 7: Tariffs should be set using a transparent methodology and subject to public consultation and scrutiny.
44 Issues paperTariff Review 2016

4 Water pricing
4.1 Introduction
This chapter starts by describing water pricing arrangements in the ACT and other Australian jurisdictions. This is followed by a brief description of the water market characteristics in the ACT. Finally, a range of specific theoretical and practical issues related to water pricing are canvassed.
4.2 Arrangements in the ACT
Table 4.3 shows Icon Water’s water tariffs as determined by the Commission since 199899. From 199899 to 200304, a two-part tariff with a two-step inclining block structure was applied, with the consumption step being reduced from 300 kL per annum (kL/a) to 175 kL/a over this period.
In 200405, the Commission introduced a new structure for the price of water with a reduced fixed charge and an additional block in the inclining block structure, with steps at 100 kL/a and 300 kL/a. This resulted in the average price of water increasing with consumption and was aimed at sending a clear message to customers to reduce their consumption of water. This structure was applied until 200708.
In 200809, the Commission reverted to a one-step inclining block structure with the step at 200 kL/a and the second-tier price twice that of the first.69 The Commission considered moving to single volumetric price, but rejected this because of the social impacts and the short-term benefits of retaining a tariff structure with a higher top-tier price given the water supply shortage at the time. The Commission also introduced daily volumetric pricing, discussed in more detail in section 4.5.3. This structure remains in place today.
Over the period 199899 to 200708, the ACT Government’s water planning and management charge, known as the water abstraction charge (WAC), was levied separately in addition to the prices determined by the Commission.70 From 200708 onwards, the WAC has been incorporated into the prices set by the Commission. The WAC is currently set at $0.54 per kL of water abstracted for the purposes of urban water supply.71
69 The Commission’s daily pricing regime allows for 548 L/day, which approximates to 50 kL/quarter or 200 kL/year.70 See www.environment.act.gov.au/water/water_planning_and_management/ for more information.71 ACT Government, 2015b: 3.Issues paperTariff Review 2016 45

4 – Water pricin
Table 4.3 Icon Water’s water tariffs, 1998–99 to 2015–16 ($, current prices)
1998–99 1999–2000 2000–01 2001–02 2002–03 2003–04 2004–05 2005–06 2006–07 2007–08
Fixed charge ($/a) 125.00 125.00 125.00 125.00 125.00 125.00 75.00 75.00 75.00 75.00
Tier 1 price ($/kL) 0.37 0.38 0.38 0.40 0.41 0.43 0.515 0.58 0.66 0.78
Tier 2 price ($/kL) 0.76 0.83 0.86 0.94 0.97 1.05 1.00 1.135 1.29 1.67
Tier 3 price ($/kL) 1.35 1.53 1.74 2.57
Plus water abstraction charge ($/kL)(a) 0.10 0.10 0.10 0.10 0.15 0.20 0.25 0.55 0.55
First consumption step (kL/a) 300 275 250 225 200 175 100 100 100 100
Second step (kL/a) 300 300 300 300
2008–09 2009–10 2010–11 2011–12 2012–13 2013–14 2014–15 2015–16
Fixed charge ($/a) 85.00 89.55 92.08 95.63 99.83 100.00 102.56 101.14
Tier 1 price ($/kL) 1.85 1.95 2.00 2.33 2.43 2.55 2.64 2.60
Tier 2 price ($/kL) 3.70 3.90 4.01 4.66 4.86 5.10 5.29 5.22
Tier 3 price ($/kL)
Plus water abstraction charge ($/kL) WAC incorporated directly in prices from 2008–09
First consumption step (kL/a) 200 200 200 200 200 200 200 200
Second step (kL/a)
(a) The water abstraction charge in 200304 was $0.10/kL for the first half of the financial year and $0.20/kL for the second half.
46 Issues paperTariff Review 2016

4 – Water pricin
In the determination of water tariffs to date, the Commission has not distinguished between residential and business customers. That is, all water customers, regardless of their size and the use to which they put water, are charged the same prices. The Commission has taken this approach on the basis that a single tariff structure reduces complexity in billing, improves customer understanding of charges, and reflects the fact that the cost of supplying a kilolitre of water does not vary according to the identity of the user.
4.3 Arrangements in other jurisdictions
This section briefly introduces and compares water tariffs and prices for a number of different utilities in New South Wales, Victoria, South Australia and Tasmania. The selected utilities are all priced by independent regulators in a manner similar to the ACT. The 201516 prices being charged by the various utilities, including Icon Water for comparison purposes, are detailed in Table 4.4.
4.3.1 General observations
There are a few points worth noting from the comparison of prices charged by the utilities listed in Table 4.4:
All utilities have a two-part tariff with a fixed and volumetric charge.
A number of utilities have different prices for residential and business customers.
Annual fixed charges vary from $17.75 for Hunter Water residential customers to $116,582 for Sydney Water business customers with a 600 mm connection.
A number of utilities differentiate fixed charges on the basis of water pipe connection size.
Volumetric pricing arrangements include single and two- and three-tier inclining block structures with differing volumetric steps.
Issues paperTariff Review 2016 47

4 – Water pricin
Table 4.4 Water tariffs in various jurisdictions, 2015–16
Fixed charge
($/a)
Tier 1 price ($/kL)
Tier 2 price($/kL)
Tier 3 price($/kL)
Step 1(kL/a)
Step 2
(kL/a)
200 kL/a
bill ($)
City West Water residential 228.00 2.39 2.82 4.19
161 321 723
business 332.08 2.66 865
Hunter Water residential 17.75 2.22 462
business(a) 18.54 2.22 463
business(b) 28.27 2.22 472
Icon Water res & business 101.14 2.60 5.22 200 621
SA Water residential 286.40 2.35 3.36 3.63 120 520 837
business 286.40 3.36 958
Sydney Water residential 102.54 $2.28 558
business(c) 149.86 $2.28 605
business(d)
116,852.18 $2.28117,30
8
TasWater res & business(e) 329.48 $0.97
524
res & business(f) 51,481.25 $0.97 51,675
(a) More than one 20 mm connection.(b) 25 mm connection or greater.(c) One 20 mm connection.(d) 600 mm connection.(e) One 20 mm connection.(f) 250 mm connection.Note: This table only contains a sample of the fixed water charges by connection size for Sydney Water and TasWater. For
the full lists, see www.sydneywater.com.au/SW/accounts-billing/understanding-your-bill/our-prices/index.htm and www.taswater.com.au/Your-Account/Water-and-Sewerage-Charges.
Source: Sydney Water (2015c); Sydney Water (2015b); City West Water (2015a); Hunter Water (2015a); Hunter Water (2015b); TasWater (2015); SA Water (2015).
4.3.2 Mechanisms for setting the volumetric price
A review of the jurisdictional regulatory determinations for the various utilities shows that volumetric prices for Hunter Water, Sydney Water and TasWater were set with reference to marginal cost.
In the case of Sydney Water, IPART noted that it ‘usually set the usage price of water for retail customers with reference to the long-run marginal cost of the next increment of augmentation (LRMC), to provide a price signal of the incremental costs of consumption’.72 IPART estimated Sydney Water’s long-run marginal cost at between
72 IPART, 2012b: 101.
48 Issues paperTariff Review 2016

4 – Water pricin
$1.82 and $2.54/kL, with a mid-point of $2.18/kL.73 In the Hunter Water case, IPART used a long-run marginal cost calculation from a previous determination for reference purposes.
In contrast, the Office of the Tasmanian Economic Regulator (OTTER) determined TasWater’s prices with reference to short-run marginal cost estimates which ranged from $0.29 to $0.45/kL. More accurately, OTTER agreed to TasWater’s proposal to set the volumetric price above the short-run marginal cost, stating:
The extent to which variable charges may be set above cost is a matter of judgement. It should be noted that setting variable charges at levels above cost results in large water users (such as industrial customers, hospitals and schools) subsidising low use customers (residences and office blocks). This has the effect of creating a cross subsidy and is inconsistent with the Pricing Principles in relation to cost reflective charging.74
OTTER decided to set the variable charge at around $1.00/kL, double the highest short-run marginal cost estimate.
4.4 The market for water in the ACT
4.4.1 Introduction
The first step in an economic analysis of the pricing of a good or service is to describe the characteristics of the market for that good or service.
In its 2008 merger guidelines, the Australian Competition and Consumer Commission (ACCC) defines a market as ‘the product and geographic space in which rivalry and competition take place’. In relation to the product dimension, the ACCC further notes that ‘a market includes goods or services that are substitutable for, or otherwise competitive with, the goods or services under analysis’.75 The guidelines also consider a range other market characteristics, a number of which are relevant to this review, including concentration and market shares and vertical integration.
The ACCC guidelines provide a useful framework for describing the characteristics of the ACT water market for the purposes of this review. The implications of the defining characteristics of the ACT water market and its regulated monopoly structure are discussed in turn below.
73 IPART, 2012b: 215.74 OTTER, 2015: 78.75 ACCC, 2008: 15.
Issues paperTariff Review 2016 49

4 – Water pricin
4.4.2 Market characteristics
Geographic dimension
From a geographic perspective, the market for water for the purposes of this tariff review can be defined by the extent of Icon Water’s water supply and delivery network in the ACT. The area can be extended to include Queanbeyan, as Icon Water also provides a bulk water service to the Queanbeyan City Council.76
The schematic in Figure 4.7 illustrates the key components of the Icon Water’s water and sewerage network in the ACT and across the border into New South Wales.
Figure 4.7 ACT water and sewerage network
CANBERRA CITY RETICULATION
CORIN DAM71 GL
BENDORA DAM12 GL
COTTER DAM78 GL
GOOGONG DAM
121 GL
Mt STROMLOWater Treatment
Plant
GOOGONGWater Treatment
Plant
QUEANBEYAN RETICULATION
QUEANBEYANSewage Treatment
Plant
FYSHWICKSewage Treatment
Plant
NORTH CANBERRAWater Reuse
Facility
LOWER MOLONGLOWater Quality Control Centre
MURRUMBIDGEEPump Station
COTTERPump Station
ANGLE CROSSING
Pump Station
ACT
NSW
TANTANGARA TRANSFER (Murrumbidgee)
MURRUMBIDGEE-GOOGONG WATER TRANSFER
Burra Cr.
Queanbeyan R
.
Molonglo R.
Cotter R.
Cot
ter
R.
Mur
rum
bidg
ee
R.
COTTER-GOOGONGBULK TRANSFER
Recycled water for irrigation
Recycled water for irrigation
Excess and solids sent to LMWQCC
raw watertreated watersewagerecycled waterriver
Legend
STORMWATER RECYCLING
(CIUW)
CIUW = Canberra Integrated Urban WaterwaysLMWQCC = Lower Molonglo Water Quality Control CentreSource: Commission.
Product dimension
In terms of the water product or service being provided, the ACT water market can be split into primary and secondary water services.
Primary water is potable water provided through Icon Water’s reticulated water supply network. Potable water is water suitable for human consumption (alternatively termed 76 Prices for the bulk water service are set under a contractual arrangement between Icon Water and the Queanbeyan City Council. As such, the bulk water service is not of direct concern in the tariff review process.
50 Issues paperTariff Review 2016

4 – Water pricin
drinking water) as defined by standards established by the National Health and Medical Research Council.
Secondary water is water provided from any source other than Icon Water’s primary water network. It includes water sourced from wastewater (such as treated effluent from a water treatment plant and greywater from bathrooms and laundries), stormwater and rainwater. All secondary water currently available in the ACT is non-potable as none of it meets the required standards for human consumption.
A good or service that satisfies the same needs as another good or service is known as a substitute. Generally, two goods are substitutes if the quantity demanded of one is positively related to the price of the other.77
Primary water is used for drinking purposes, other indoor uses such as bathing, toilet flushing and dish and clothes washing, and outdoor uses such as garden irrigation. Secondary water is non-potable and therefore mainly used for outdoor irrigation purposes. Therefore, for the purposes of the tariff review, secondary water can be considered a demand-side substitute for the outdoor usage of primary water. That is, the higher the primary water price, the greater the demand for secondary water for irrigation purposes.
Monopoly structure
The other key market characteristic is that the market for potable or primary water in the ACT is a regulated monopoly market. The industry is in the hands of a single regulated firm, Icon Water. In addition, Icon Water is a vertically integrated water business that provides both bulk water and retail services to the ACT community. There are a number of implications for the tariff review process that flow in particular from the regulated monopoly structure of the water market.
The first is that, under the current regulatory model, water prices are set well before the level of water demand is known. The Commission applies a typical or average-year approach to forecasting demand, which assumes that the quantity of water demanded will be equal to the amount demanded under typical climate conditions. Actual demand will of course vary considerably from year to year depending on actual weather conditions. Prices are set before demand is known and there is no market mechanism to adjust prices based on changes in demand due to external factors such as unseasonal heat or rain. This contrasts with, for example, the price of petrol, which varies more frequently in response to changes in worldwide and local supply and demand factors.
Second, on the supply side of the market, the cost of water, or more importantly the marginal cost of water, is potentially unknown at the time when prices are determined.
77 It should be noted that it is possible for two goods to be substitutes where wealth effects are taken into account, and complements in circumstances where wealth effects are not considered. In the former case, if the price of one good is raised, the compensated demand for the other increases. In the latter case, an increase in the price of one good can decrease the demand for both goods: that is, in gross terms, the two goods may be complements. See Mas-Colell, Whinston and Green (1995) for a full treatment of Hicksian compensated demand curves and the gross substitution concept.
Issues paperTariff Review 2016 51

4 – Water pricin
In the ACT, water sourced from the Googong Dam has a different average and marginal cost than water sourced from the Cotter Dam and this is different from the cost of obtaining water from the Bendora Dam.
The third implication relates to the monopoly structure of the water market and the use of a two-part tariff (discussed in section 3.3.1) coupled with a quarterly billing system. While economic theory generally assumes that consumers respond to marginal prices when making economic choices, empirical studies of electricity and water demand have often found that, when faced with multipart tariffs, consumers behave as if they are responding to the average price and not the marginal price.78,79
4.4.3 Conclusion
The Commission takes the view that careful consideration of the ACT water market, including the regulatory process and any potential government policy considerations, is necessary when considering the structure of tariffs. Unless the complexities of the market are understood, standard economic approaches to setting prices may fail to deliver the best outcomes. For example, if consumers respond not to marginal costs but to average costs, setting price equal to marginal cost may not elicit the anticipated response.
In the following discussion, the Commission attempts to tease out some of these complexities in more detail.
4.5 Theoretical and practical issues
4.5.1 Marginal cost pricing in a monopoly situation
As noted in section 3.3.1, marginal cost pricing is a common approach applied when regulating monopoly utility prices as a means to promote the efficient use of utility infrastructure. There are a number of theoretical issues related to marginal cost pricing that have implications for setting water prices for a monopoly utility. These issues are discussed below.
Benchmarking the socially optimal outcome
Returning to the economic welfare concept first introduced in Chapter 3, we start with the first fundamental theorem of welfare economics.
The first theorem is that when markets are complete, any competitive equilibrium is necessarily Pareto optimal. This theorem is a demonstration of Adam Smith’s ‘invisible hand’ of the market, which equates private goals with optimum social outcomes. The first theorem establishes the perfectly competitive case as a benchmark for considering optimal outcomes in market economies, and, perhaps more
78 The average price is defined as the total bill for water including the fixed charge divided by the number of kilolitres consumed.79 For example, see Borenstein, 2009: 1–37; and Ito, 2014: 1–55.
52 Issues paperTariff Review 2016

4 – Water pricin
importantly, for thinking about optimal outcomes in cases of market failure, such as the natural monopoly example. As noted by Mas-Colell et al. (1995):
In particular, any inefficiencies that arise in a market economy, and hence any role for a Pareto-improving intervention, must be traceable to a violation of at least one of the assumptions of this theorem.80
While, in principle, the analysis of Pareto optimal outcomes requires general equilibrium analysis that is, simultaneous consideration of the whole economy partial equilibrium analysis allows us to consider equilibrium outcomes in a particular market in isolation from all other markets.81 It also allows us to apply the concept of Marshallian surplus, which conveniently lends itself to graphic representation, as shown by the competitive equilibrium demonstrated in Figure 4.8.82
Figure 4.8 The socially optimal competitive equilibrium
Supply curve
Quantity
Price
Qc
Demand curve
Pc
Consumers’surplus
Producers’surplus
Ec
Consumers’ surplus, the blue-shaded area under the demand curve and above the market price line Pc, is the difference between the total value consumers place on the all the units consumed of some good and the total amount they are required to pay for the good.83 Producers’ surplus, the pink-shaded area under the price line and above the
80 Mas-Colell, Whinston and Green, 1995: 308.81 For full treatment of Marshallian partial equilibrium analysis, see Mas-Colell, Whinston and Green, 1995: Part 3.82 Note that consumers’ surplus is the aggregate of all individual consumers’ surplus in the particular market, and likewise for producers’ surplus.83 George Stigler, in his 1966 textbook on the theory of price, provides an apt description of consumers’ surplus: ‘When a reflective man buys a crowbar to pry open a treasure chest, he may well remark to himself that if necessary he would have been prepared to pay tenfold the price. When a parched man
Issues paperTariff Review 2016 53

4 – Water pricin
supply curve, is the difference between the total value of all the units sold of some good at the market price and the total value at the minimum price at which the seller would be prepared to sell the good.84 Marshallian aggregate surplus is the sum of the consumers’ and producers’ surplus.
In the perfectly competitive case, firms equate marginal cost to price in order to maximise their profits, which produces a market outcome where the demand and supply curves intersect, the point E in Figure 4.8. The Marshallian aggregate surplus is maximised at the same point. Recalling that the socially optimal outcome is the one in which Marshallian aggregate surplus is maximised, ipso facto, the economically efficient outcome achieved by setting price equal to marginal cost is the one which maximises social welfare.85
Market failure and deadweight loss
Natural monopoly is the classic case of a market failure. Train (1991) loosely defines a natural monopoly as existing ‘when the costs of production are such that it is less expensive for market demand to be met with one firm than with more than one’.86 Natural monopolies arise due to economies of scale or scope. The former, in which we are primarily interested here, arises when the average cost of production decreases as output expands that is, the average cost curve slopes downwards up to and perhaps beyond the overall size of the market.
The monopoly situation, which requires one firm to achieve least-cost production and is characterised by market power, violates the first fundamental welfare theorem’s assumption that all agents act as price takers. As such, the market equilibrium will not be Pareto optimal with a resulting welfare loss. This can be demonstrated graphically by recourse once again to Marshallian aggregate surplus, as shown in Figure 4.9.
drinks a free beer on a hot day, he is apt to consider it a bargain. Marshall gave the odd name of ‘consumer’s surplus’ to these fugitive sentiments.’ (Stigler, 1966: 78).84 Producers’ surplus can also be defined as the earnings of firms over and above their variable costs.85 Remembering, of course, that this conclusion depends on the same assumptions as those underpinning the first fundamental theorem of welfare economics, as discussed above.86 Train, 1991: 1.
54 Issues paperTariff Review 2016

4 – Water pricin
Figure 4.9 Deadweight welfare loss under monopoly
MC
Quantity
Price
Qc
D
Pc
MR
Ec
EmPm
Qm
CS
PS
AC
F
Assume we are dealing with a natural monopoly, with a declining average cost curve with a minimum scale beyond market demand. The monopolist maximises profits by producing quantity Qm at price Pm determined by the intersection of its marginal revenue and marginal cost curves. This outcome is not Pareto optimal as the Marshallian surplus is smaller than that attainable with price Pc. The difference, referred to as the efficiency or deadweight loss, is equal to the area of the grey-shaded triangle bounded by Em, Ec and F.87
In the case of a regulated monopoly, the regulator could direct the monopolist to set price equal to marginal cost at Pc in an attempt to ensure a Pareto optimal outcome. The problem facing the regulator is that in many cases, as here, the monopolist is on the falling portion of its average cost curve. This means that its marginal cost is less than its average cost, as depicted by the AC curve in Figure 4.9. Such a direction from the regulator will result in the monopolist not recovering enough revenue to cover its total costs, leading to an unsustainable financial situation.
Directing the monopolist to set prices based on average cost to ensure full cost recovery, with a quantity produced somewhere between Qm and Qc, will also result in a suboptimal Pareto outcome. Brown et al. (1992) state:
Regulated natural monopolies are usually required to recover losses in the marketplace. Average cost pricing is frequently used, though the resulting allocation has no hope of being Pareto-efficient.88
87 If the monopolist was able to perfectly discriminate among its customers by knowing customer preferences and making a distinct offer to each customer, there would be no welfare deadweight loss. Mas-Colell, Whinston and Green (1995) note that such discrimination is impractical, in particular due to a lack of information about customer preferences and the possibility of customer resale.88 Brown, Heller and Starr, 1992: 53.
Issues paperTariff Review 2016 55

4 – Water pricin
In short, in the monopoly case the first-best Pareto optimal outcome that achieved by setting price equal to marginal cost is infeasible due to the cost recovery constraint. In order to allow cost recovery, the regulator is faced with achieving the second-best outcome. This exercise can be broadly described as maximising social welfare subject to a revenue constraint.
Two-part tariffs
Coase (1946) introduced a tariff structure that employs a connection charge and a single volumetric charge, the latter set at marginal cost. The revenue shortfall is then recovered equally from customers through the connection charge. Brown et al. (1992) and Vohra (1990) both contend that equilibria under two-part marginal cost pricing are not Pareto optimal, in contrast to the impression left by much of the partial equilibrium literature on two-part tariffs. For example, Brown et al. (1992) state:
Two-part marginal cost pricing equilibria are not generally Pareto-efficient. This is in contrast to the impression left by much of the partial equilibrium literature on two-part tariffs.89
The two-part tariff structure therefore provides a means to enable regulators to use marginal cost pricing to achieve an outcome that, while not Pareto-efficient, is at least second-best. Train (1991) states:
Multipart tariffs have important welfare implications. Perhaps the most relevant is the fact that a regulator, by applying an appropriately designed multipart tariff, can induce a natural monopolist to operate closer to the first-best outcome than would be possible with only one price.90
Ramsey pricing
In the case of monopolies that produce more than one good or service or have different prices for customer groups, Ramsey pricing provides an alternative means to recover the revenue shortfall or residual cost associated with pricing at marginal cost. Ramsey pricing, also known as the inverse elasticity rule, deals with the problem of how to set prices to minimise changes in the pattern of demand caused by deviating from marginal cost in order to recover the residual costs.91
Baumol and Bradford (1970) presented the simple rule for setting prices under this approach to minimise price distortions. The rule is that each price be set so that its percentage deviation from marginal cost is inversely proportionate to the item’s price elasticity of demand.92
89 Brown, Heller and Starr, 1992: 71.90 Train, 1991: 191.91 Frank Ramsey, in his 1927 seminal article on optimal taxation, provided at least implicitly a solution to the optimal pricing problem for an industry in which marginal cost prices do not cover total costs (Ramsey, 1927: 47–61).92The price elasticity of demand is the percentage change in quantity demanded divided by the percentage change in price that brought it about. Demand is said to be elastic if the percentage change in quantity is greater than the percentage change in price (elasticity is greater than one). Demand is inelastic if the percentage change in quantity is less than the percentage change in price (elasticity is less than one).
56 Issues paperTariff Review 2016

4 – Water pricin
Ramsey pricing, somewhat counter-intuitively, involves deliberate price discrimination on the basis of elasticities of demand to allow the monopoly business to recover residual costs while minimising the deviations from optimal consumption patterns that is, those based on marginal cost pricing. Customers who are price inelastic are charged a higher price than those who are price elastic, with more of the residual costs recovered from customers who are price inelastic than from the customers with elastic demand.
The Brattle Group (2014) considered the Ramsey pricing approach as part of the Australian Energy Market Commission’s 2014 electricity tariff reform process. They note that in the electricity context, at the customer class level, Ramsey pricing would suggest that residential customers pay a greater proportion of residual costs, and industrial customers a lesser portion, if the former are less price elastic and the latter are more price elastic. The Brattle Group also notes that Ramsey pricing has rarely been applied, at least not explicitly, for price discrimination across customers in the same class, for equity reasons:
It is often asserted that individuals who are relatively better-off are likely to show a higher elasticity for consuming certain goods such as electricity than individuals who are less well-off, because the better-off customers use some electricity for “luxuries”, whereas the less well-off customers use electricity only for “essential” purposes.93
The Commission is planning to publish a technical paper as part of this review that will estimate the price elasticity of demand for water in the ACT, at the aggregate level and possibly by customer class, data permitting. This should provide useful information to enable further analysis of the practical implications of applying a Ramsey pricing approach in the ACT.
Short- versus long-run marginal cost
Another important issue when considering a marginal cost pricing approach is whether to set volumetric prices equal to the marginal cost over the short or long run. Even where it is agreed that price should be set at marginal cost to ensure the economically efficient allocation of resources, there is still the question of whether this should be the short-run or the long-run marginal cost or somewhere in between.94
The difference between the two is the timeframe applied. Short-run marginal cost refers to the incremental cost of producing an additional unit of the good or service when some of the inputs of production are fixed. Long-run marginal cost allows for all inputs to be varied. In the short run, inputs such as the number and size of dams is fixed, while the calculation of long-run marginal cost would assume that all inputs, including the composition of the dams, can be varied.
Much economic debate has gone into proving that the two concepts are equivalent when the firm is in an equilibrium state, implying that it is optimal to set prices at long-
93 The Brattle Group, 2014: 5.94 Della Valle, 1988: 283.
Issues paperTariff Review 2016 57

4 – Water pricin
run marginal cost. For example, Marcel Boiteux advocated this concept for peak-load electricity pricing in France:
Provided there is an optimal investment policy, short-term pricing is also long-term pricing, and there is no longer any contradiction between the two.95
This view was supported by Ralph Turvey, who noted:
If capacity is optimally adjusted to output, the enterprise is on the long-run cost curve and on that short-run cost curve which is [tangential] to it at that point. Hence the two curves have the same slope, that is, marginal short- and long-term costs are equal.96
Andersson and Bohman (1985) argue that the equivalence between short- and long-run marginal costs is only valid in very limited circumstances:
The equivalence, however, is valid only under the very restrictive assumption that the capacity can be varied continuously. This means that indivisibilities, irreversibilities and durability of investments are ignored. Where such phenomena exist, as in electricity production and distribution, pricing according to LRMC is neither theoretically valid nor applicable.97
Della Valle (1988) argues that economic efficiency is maximised when price is set at short-run marginal cost at each moment in time on the basis that it is this cost that reflects the actual incremental cost to society imposed by the use of one more unit of output. Della Valle adds a word of caution that pricing at short-run marginal cost is likely to be impractical and expensive, noting that:
For one thing, it varies frequently and may be very difficult to measure. Furthermore, it may lead to under-recovery of costs over time. Thus, the popularity of [long-run marginal cost] pricing.98
More recently, in the same issue of Agenda, Dwyer (2006) supports setting the volumetric price equal to short-run marginal cost, while in the next article, Sibly (2006) proposes that price should equal long-run marginal cost.
Calculating long-run marginal cost
Theoretically, long-run marginal cost is defined as the cost of producing an additional unit when all factors of production (capital and labour) are variable. That is, the least-cost combination of inputs able to produce a given level of output when all factors of production may vary.
Clearly, in the case of a water utility such as Icon Water, it is not practically possible to continuously vary all factors of production given its existing dams and reticulation
95 Boiteux, 1960: 165.96 Turvey, 1964: 427.97 Andersson and Bohman, 1985: 279.98 Della Valle, 1988: 283.
58 Issues paperTariff Review 2016

4 – Water pricin
system and the lumpy nature of new investments. As such, the cost we are dealing with is better termed ‘long-run incremental cost’ rather than long-run marginal cost. That is:
Incremental cost is defined as the costs that would be incurred by the [business] to meet increasing demand over the long-term given the present capacity.99
Marsden Jacob Associates (2004), in a paper prepared for the Queensland Competition Authority, describe the two most common methods of calculating incremental cost for the purposes of setting prices: average incremental cost and marginal incremental cost.
Average incremental cost is calculated by:
forecasting demand into the foreseeable future;
estimating the capital works required to meet this forecast demand;
estimating the cost of these capital works; and
calculating the average cost per unit delivered by these capital works in net present value terms.
Marginal incremental cost, also known as the Turvey or perturbation method, is calculated by:
forecasting demand into the foreseeable future;
estimating the capital works required to meet this forecast demand;
estimating the cost of these capital works;
adjusting demand upwards by an increment;
reconsidering the capital works required to meet this adjusted demand; and
calculating the difference in cost between these two demand scenarios in net present value terms.
Marginal incremental cost is marginal in the sense that it determines a marginal cost increase associated with an incremental increase in demand. This is compared to the average cost of future capital works calculated using the average incremental cost approach.
The Australian Energy Market Commission also examined this issue in formulating its advice on best practice retail electricity pricing, noting that:
The average incremental cost method represents a relatively straightforward means of estimating the LRMC, but is generally considered to be a less precise method than the perturbation method.100
99 London Economics, 1997: 13.100 AEMC, 2013: 29.
Issues paperTariff Review 2016 59

4 – Water pricin
Marginal cost pricing and inclining block tariffs
Inclining block tariffs present an added complication for marginal cost pricing. An inclining block tariff differs from the simple two-part tariff in that there is more than one volumetric rate. Under an inclining block structure, the volumetric rate increases in a stepped manner as consumption increases. As discussed in section 4.1, current ACT water tariffs are an example of an inclining block, where a lower price is set for consumption up to 200 kL per year and higher price is set for consumption above this level.
Inclining block tariffs are adopted for a range of reasons, but most often on equity and water conservation grounds. The first consumption block is intended to provide essential water to households at a relatively cheap rate, while the second, more expensive block encourages water conservation as the more discretionary consumption increases.
The difficulty with inclining block tariffs is that the key requirement for economic efficiency, which is that the volumetric charge should equal the opportunity cost of water, implies a single marginal price for water. If two customers are paying for water at different marginal prices due to different levels of consumption under an inclining block structure, one of the two prices cannot be efficient. As such, inclining block tariffs are often criticised for being inefficient.
The equity argument for inclining block tariffs has also been criticised in the economic literature. Grafton and Ward (2010) cite empirical studies that show that the number of people in a household increases water consumption. The implication of this is that an increasing block structure may have the unfortunate consequence that large and poor households, who may have little discretionary use about water they can use, may pay a higher price for water than small and high-income households.
The Commission is interested in hearing from stakeholders about their views on inclining block tariffs.
Q3: What is your view on the equity and water conservation benefits of inclining block tariffs?
Do consumers respond to average or marginal prices?
As discussed earlier, economic theory usually assumes that consumers react to marginal prices when making consumption decisions. However, there are a number of characteristics of the water market, including the market in the ACT, that indicate this may not necessarily be the case. These characteristics include the manner in which water consumption is measured and bills calculated and presented to customers.
In the ACT, water consumption is measured using accumulation meters. These meters simply record the volume of water used, with customers billed on a quarterly basis.
60 Issues paperTariff Review 2016
4 – Water pricin
Accumulation meters store no information about when consumption has occurred and are often in inaccessible locations, making it impractical for customers to monitor their own consumption. This results in customers being generally unaware of how much they have consumed. The only time at which customers receive information about their consumption is on receipt of a bill, which typically covers the preceding three-month period. Because water customers are unaware of their level of consumption (and therefore the tier price to which they are exposed), they may be unaware of the price they are being charged.
This situation differs from that which exists for products provided in a competitive market – for example, petrol. Motorists purchasing petrol know the price they face in advance and determine their level of consumption based on that knowledge. In that situation, it is reasonable to consider that consumption decisions are based on an analysis of the marginal price per litre of petrol. However, water customers, who receive their bills after consumption has occurred, may base their future consumption decisions on an analysis of the most recent available information. This would mean that customers may make consumption decisions based on an analysis of average costs calculated from recent bills.
There have been a number of empirical studies in the economics literature examining the question of whether consumers respond to marginal or average price. Shin (1985) examined residential electricity consumption under a declining block tariff and found that the empirical evidence supported the hypothesis that customers who are not well informed respond to perceived average price as opposed to marginal price.
A later study by Nieswiadomy and Molina (1991) found that residential water customers responded to marginal price when faced with inclining block structures and average price when responding to declining block structures. A further study by Nieswiadomy (1992), which among other things investigated the effect of price structure on residential water demand, confirmed the Shin hypothesis that customers react more to average price than marginal price.
The mere existence of a debate about whether customers respond to marginal or average price has important consequences. Clearly, if consumers appear not to respond to marginal prices, there is limited benefit in setting prices with reference to marginal costs.
The implications of this issue for tariff design boil down to the complexity of the tariff structure. The more complex, the less likely that consumers will be able to calculate marginal prices and therefore respond to them. For example, all other things being equal, an inclining block structure is more complex than a single volumetric rate.
The Commission is interested in hearing from Icon Water customers about how current water prices and bills impact their water consumption decisions.
Q4: Do you monitor your water use on a more regular basis than your three-monthly bill interval? If yes, are you able to estimate when you are about to trigger the top-tier
Issues paperTariff Review 2016 61

4 – Water pricin
price and does this affect your subsequent water usage?
Concluding remarks on marginal cost pricing
As discussed above, there are a number of theoretical debates and practical issues concerning the application of marginal cost pricing in a regulated monopoly situation. The Commission is planning to publish a technical paper as part of this review that will further explore the short- versus long-run debate and estimate the short- and long-run marginal costs for water in the ACT. This will provide useful information to enable further analysis of the practical implications of setting Icon Water’s volumetric water prices with reference to marginal cost.
A final word on the practical implications of marginal cost pricing is best left to Nobel Laureate William Vickrey:
As a preface to a discussion of the role of marginal cost pricing, it is perhaps well to state explicitly that in common with any other theoretical principle, the principle of marginal cost pricing is not in practice to be followed absolutely and at all events, but is a principle that is to be followed insofar as this is compatible with other desirable objectives, and from which deviations of greater or lesser magnitude are to be desired when conflicting objectives are considered.101
4.5.2 Using price to manage demand
As discussed in Chapter 2, the ACT has primarily relied on supply-side restrictions in the form of temporary water restrictions to reduce water consumption during times of water resource scarcity, such as during the Millennium Drought.
Quantity rationing
Water restrictions are a quantity-rationing scheme. Quantity rationing is viewed as being economically inefficient because the rationed outcome can result in an allocation where consumers who most value the product or service do not necessarily consume it. The economic inefficiency exists because there are potential gains from trade between consumers, where consumers with low valuations for the product could sell their allocation to consumers with higher valuations, thus making both consumers better off. For example, a consumer with a large garden who places a high value on irrigating during a drought might be prepared to purchase water allocation from a consumer without a garden.
Price rationing
An alternative to quantity rationing is to use price to ration water demand by sending price signals to consumers about the scarcity of the water resource.
The economics underpinning this approach is straightforward. Quantity demanded is inversely related to price the higher the price of the product, the less the consumer 101 Vickrey, 1955: 605.
62 Issues paperTariff Review 2016

4 – Water pricin
will demand. If the goal is to limit the quantity demanded, simply raise the price to the level at which demand is reduced to the desired amount. Armed with the price elasticity of demand for water, one can calculate the required change in price to achieve a desired reduction in consumption. For example, if a 20 per cent reduction in quantity is the goal and the elasticity of demand is minus 0.2, a 100 per cent increase in price would be required.
Inclining block approach
In practice, the inclining block tariff structure has commonly been applied as a general means of using price signals to influence demand. In the ACT, the fact that that the second-tier price is twice that of the first tier is intended to discourage discretionary water consumption above 200 kL per year.
However, Grafton and Ward (2010) argue that an inclining block structure, because it introduces discontinuities in the price schedule, is ‘economically inefficient if consumers differ in their preferences because it results in households with different marginal benefits of water consuming the same volumes of water while facing the same marginal price’.102
As noted in section 3.3.2, a consequence of the inclining block approach is the need to forecast water sales not only at the aggregate but also at the block sales level. This of course has implications for the level of revenue uncertainty deriving from the forecasting process. As shown in Figure 4.10, the proportion of tier 1 sales has shown significant variation since the introduction of the two-step structure in 200809.
102 Grafton and Ward, 2010: 6.
Issues paperTariff Review 2016 63

4 – Water pricin
Figure 4.10 Icon Water tier 1 proportion of total water sales, 200809 to 201314
2009 2010 2011 2012 2013 2014 52
54
56
58
60
62
64
Year ending 30 June
Tier
1 p
ropo
rtion
(per
cent
)
Source: Icon Water billed consumption data.
Scarcity pricing
Scarcity or dynamic pricing has been proposed as a more efficient way to use price to manage demand during times of water scarcity. Scarcity pricing, or more precisely administered scarcity pricing (as opposed to market-based), involves a water utility adjusting the volumetric water price in inverse relation to a measure of water scarcity, such as dam levels. In effect, scarcity pricing involves pricing at the short-run marginal cost of the resource. The National Water Commission (2011a) define scarcity pricing as follows:
A scarcity-based pricing approach is one that seeks to set urban water prices to reflect the scarcity value expected during the relevant period such that available supply would be rationed on the basis of the willingness to pay its scarcity value (rather than through water use restrictions).103
In addition to sending signals about the value of the water resource itself, scarcity pricing has the added benefit of sending a signal that the next supply augmentation may cause a sharp increase in price.
Grafton and Ward (2010), using data from Sydney, show that using supply-inflexible volumetric water pricing generates large welfare losses in excess of the annual average household water bill, which they attribute to water restrictions and premature supply augmentation. Grafton and Ward argue that these losses ‘could be avoided if dynamically efficient volumetric pricing were to be adopted by price regulators or water utilities in response to variability in water availability’.104
103 NWC, 2011a: 5.104 Grafton and Ward, 2010: 1.
64 Issues paperTariff Review 2016

4 – Water pricin
While theoretically attractive, there are a number of implementation constraints to employing a scarcity pricing approach, which have limited its practical application. Indeed, Grafton and Ward (2010) note that:
Our results are of general interest because, as far as we are aware, there are no water utilities or water regulators that have systematically implemented dynamically efficient volumetric water pricing.105
The first is that the approach relies on an estimate of price elasticity of demand in order to adjust the volumetric price to cause a desired adjustment in water use. As noted in section 4.5.1, the Commission is planning to publish a technical paper that will estimate the price elasticity of water in the ACT.
A scan of the empirical literature shows that the demand elasticity for urban water is generally inelastic and, in line with theoretical expectations, is usually negative. Dalhuisen et al. (2001) undertook a meta-analysis of published studies and found the distribution of price elasticities has a sample mean of minus 0.43, a median of minus 0.35, and a standard deviation of 0.92.
Grafton et al. (2011) estimated the price elasticity of household water demand in the ACT at about minus 0.16 for metered residential dwellings.106 Under the current ACT temporary water restrictions scheme, Stage 3 restrictions target a 35 per cent reduction in water use relative to permanent water conservation measures.107 Given the ACT elasticity estimate above, to achieve this reduction in demand would require about a 220 per cent increase in the volumetric price.
There are three implications from this scenario. The first is that as consumers have not faced a price increase of such magnitude at any one time, the effect on demand of such a large change in the level of the price is unknown. The second implication, which is self-evident, is that it will lead to price path instability as customers will be exposed to frequent price fluctuations. The third is that extended periods at high prices may lead to revenue over-recovery by the utility.
The second practical issue relates to the ACT billing system described in section 4.5.1. Meters are read and customers billed quarterly, with bills determined on a cumulative annual basis. Because the meters do not record any information about when consumption occurred, and because of the delay between consumption and when customers are billed, the ability to continually adjust prices to send updated price signals is restricted.
A third issue, which is shared with quantitative measures, is the difficulty in determining the desirable reduction in water use at any point in time.
105 Grafton and Ward, 2010: 20.106 Grafton, Kompas and Ward, 2011: 21.107 ACT Government, 2010b: 3.
Issues paperTariff Review 2016 65

4 – Water pricin
Seasonal or peak pricing
A less dynamic approach that might be considered is seasonal or peak pricing. Many utilities, such as Icon Water, experience distinct seasonal peaks attributable to weather-sensitive usage. Icon Water dam releases show a distinct peak over the summer period from December through February, as shown in Figure 4.11. This is due to increased outdoors usage during the period of warmer weather.
Figure 4.11 Monthly Icon Water dam releases
Mar-
99Se
p-99
Mar-
00Se
p-00
Mar-
01Se
p-01
Mar-
02Se
p-02
Mar-
03Se
p-03
Mar-
04Se
p-04
Mar-
05Se
p-05
Mar-
06Se
p-06
Mar-
07Se
p-07
Mar-
08Se
p-08
Mar-
09Se
p-09
Mar-
10Se
p-10
Mar-
11Se
p-11
Mar-
12Se
p-12
Mar-
13Se
p-13
Mar-
14Se
p-14
Mar-
15
2,000
3,000
4,000
5,000
6,000
7,000
8,000
9,000
ML/
mon
th
Source: Icon Water releases data.
As an example, seasonal prices could be implemented with an off-peak tariff for the months from March through November and a peak tariff for December through February. Setting a higher price in the summer months when discretionary water usage is high sends a signal to customers about the value of water conservation.
Mann and Schlenger (1982) suggest that there may be an economic efficiency argument for adopting seasonal pricing, as during periods of peak usage the incremental cost of water may be higher than during periods of low usage:
The potential benefits include increased production efficiency by improving annual load factors and reduction in future capacity requirements by reducing peak demands.108
The Commission is interested in hearing from stakeholders about their views on using some form of scarcity or seasonal pricing as a mechanism to manage demand rather than relying on water restrictions.
Q5: Would you be prepared to pay more for water during periods of scarcity rather than be subject to temporary water restrictions?
108 Mann and Schlenger, 1982: 7.
66 Issues paperTariff Review 2016

4 – Water pricin
Interaction between prices and the water abstraction charge
As noted in section 4.1, the ACT Government levies a water management charge, the WAC, at a rate of $0.54 per kL of water abstracted for the purposes of urban water supply. The WAC is incorporated in the prices set by the Commission, with Icon Water effectively collecting the WAC from customers on behalf of the ACT Government.
The level of the WAC, described in Box 4.1, reflects ACT Government expenditure on water planning and management activities, the scarcity value of the water resource and environmental costs related to environmental water flows.
The key point to note is that there is a scarcity pricing element built into the WAC that Icon Water customers are already facing in their water bills. This should be taken into account in any discussion on scarcity pricing. The difficulty is that it is not immediately clear how much of the $0.54/kL is allocated to the scarcity component.
Box 4.14 ACT water abstraction charge
The water abstraction charge (WAC) also reflects the value of a scarce natural resource vested in the ACT Government, including offsetting costs incurred by the Territory, providing a return on a valuable and scarce resource, and assists in managing demand. As such, the WAC comprises the following components:
urban and non-urban water supply costs: Government expenditure on activities such as catchment management, environment protection of ACT streams and lakes, water policy and administration;
scarcity: the value associated with the consumptive use of water in the Territory preventing its alternative use for other economically valuable purposes such as irrigation; and
environmental: costs relating to environmental flow, including the effect of storing water in dams on downstream flows.
Source: ACT Government (2014b).
4.5.3 Daily pricing
The current ACT pricing inclining block arrangements are based on daily pricing, with the annual price structure applied on a daily basis at each meter reading. That is, the annual allocation of water in each of the two consumption bands, up to 200 kL and greater than 200 kL, is determined as a daily allowance. The 200 kL per year allowance translates to approximately 0.548 kL per day under this system. The daily allowance is then multiplied by the number of days in the billing period to determine the quarterly bill.
This approach was introduced to avoid the circumstance whereby a customer who consumes a constant volume of water during each quarter may receive a larger bill for the final quarter compared to the first quarter of the financial year.
Issues paperTariff Review 2016 67

4 – Water pricin
Before the Commission introduced daily pricing from 200708, it noted a concern about the possible creation of perverse outcomes. Under daily pricing, it is possible that two customers who consume the same amount annually but with different consumption profiles may face different bills. For example, under daily pricing, a customer who consumes 50 kL per quarter will face a lower bill than someone who consumes 200 kL in a single quarter.109 The Commission also noted that:
given what it believes is a limited (if indeed any) improved price signals from daily pricing, it may be disinclined to adopt daily pricing if it simply added to the complexity of setting annual tariffs.110
The Commission ultimately decided in favour of daily pricing on the basis that customers would benefit from the fact that bills are likely to be more even across the year, which may make planning and budgeting easier, particularly for low-income households where outdoor use is low.111
The Commission is interested in hearing from stakeholders about their views on daily pricing under an inclining block structure.
Q6: Do you think the benefits from more even bills outweigh any complexities associated with daily pricing?
4.5.4 Optional tariff choice
Another matter for discussion is the question of whether individual water customers should be offered more tariff choices. While common in the electricity industry, where many different retail tariffs are on offer, as a visit to www.energymadeeasy.gov.au will quickly reveal, examples of tariff choices in the water industry are much harder to find.112
A potential example in the water industry might be a choice between tariff A, offering a high fixed charge coupled with a low volumetric rate, and tariff B, offering a low fixed charge coupled with a high volumetric rate. A large water user might prefer tariff A while a low water user may opt for tariff B.
109 ICRC, 2007a: 32.110 ICRC, 2007c: 72.111 ICRC, 2007b: 124.112 A common tariff distinction in the electricity industry is between time-of-use tariffs and standard flat-rate tariffs.
68 Issues paperTariff Review 2016

4 – Water pricin
Train (1991), who refers to optional tariff choices as self-selecting tariffs, states that:
Under traditional assumptions about customer behaviour, self-selecting tariffs provide utilities and their regulators with a mechanism for increasing surplus.113
The traditional assumption about customer behaviour is that customers know which tariff is best for them. As noted in section 3.3.3, there is a sizable economic literature from the electricity industry that suggests that this assumption might not hold.
For example, Wilson and Waddams Price (2010) report on two studies in the United Kingdom of electricity consumers who switched from one retailer to another. While they find results consistent with search models, such as some consumers settling for prices above the minimum available price, the surprising result is that a considerable number of consumers faced a higher electricity bill as a result of switching. In one study, 20 per cent of consumers were worse off after switching electricity retailers.
Waddams et al. (2011) note that the introduction of more tariffs may increase the complexity of consumer choice, adding to the concerns about whether consumers always choose what is in their own best interests.
An added complication is that the introduction of additional tariffs may make it more difficult to calculate the prices necessary to recover Icon Water’s revenue requirement.
The Commission is interested in hearing from stakeholders about their views on self-selecting water tariff options.
Q7: Would you like to have choice between different water tariffs? If yes, are you confident that you will be able to select the best tariff for your particular circumstances?
4.5.5 Tariff differentiation
Icon Water’s current water tariff structure does not differentiate between type of customer or by location.
Customer type
As discussed in section 4.3, a number of utilities in other jurisdictions have different tariffs for residential and business customers. Where there is a difference between the tariffs charged to each customer group, there appears to be a tendency for non-residential customers to face a comparable fixed charge to that of residential customers, but for non-residential customers to face a single volumetric charge typically set at the lowest or middle residential tier.
113 Train, 1991: 264. Train also notes that the popularity of such tariffs is due to the fact that it is easier for a regulated firm to get a new tariff approved if presented as a self-selecting alternative to the existing tariff.
Issues paperTariff Review 2016 69

4 – Water pricin
To avoid any cross-subsidisation of one tariff class by another, the key issue is whether there is any difference between the cost of servicing residential and business customers. It is possible that it may be less expensive to service business customers compared to residential customers due to reduced costs such as lower meter-reading costs and default rates.
Location
Icon Water’s tariffs are applied equally across its customers in the ACT irrespective of their location. This is known as postage stamp pricing.
The alternative is differential pricing to reflect cost differentials for different parts of the network, also known as nodal pricing. Nodal pricing is utilised in the electricity industry in other parts of the world, particularly in regard to electricity spot price markets.114 In the electricity context, the argument is that:
The first-best price of electricity at each point on a network (node) equals the marginal cost of providing electricity at that node.115
Nodal pricing effectively takes marginal cost pricing to a geographic level. In the case of water, if the cost of supplying water to suburb A is substantially lower than to suburb B, say because A is at lower elevation and incurs lower pumping costs, nodal pricing would involve a lower water price for A than B.
The Commission is interested in hearing from stakeholders, and particularly Icon Water, about their views on the costs of servicing different customer types and locations.
Q8: Do you think there are any cost differences between providing water services to business and residential customers or to customers in different locations? If yes, what are these differences due to?
4.5.6 Developer charges
An alternative approach to reflect locational cost differences is to impose developer charges that are designed to reflect the costs of supplying new water or sewerage infrastructure to service new (green-field or brown-field) developments.116
In the case of a new development, it is first necessary to distinguish between the costs of local reticulation assets and connection to the existing network, and the costs of having to augment or upgrade the existing water network to service the development.
114 In the electricity industry, nodal pricing is commonly referred to as locational marginal pricing.115 Green, 2007: 126.116 Green-field developments would include brand new estates. Brown-field developments would include infill developments in already established areas.
70 Issues paperTariff Review 2016

4 – Water pricin
Local reticulation and connection costs
As noted by Frontier Economics (2008), most water infrastructure pricing regimes require developers to install and pay for local reticulation assets and the costs of connection to the existing grid – given that these costs are directly attributable to the development. These costs are generally recovered from the block purchasers, with the developer handing over the assets to the local water utility after completion as a gifted asset or capital contribution.
Recovering augmentation costs through developer charges
Network augmentation or upgrade costs to the existing water network to service a new development could include the construction of additional trunk assets such as mains pipelines or water reservoirs. It is in relation to these costs that the question of developer charges generally arises. The water utility has two choices: it can either fund this infrastructure itself and recover the costs from all water customers through postage stamp pricing; or it can levy an up-front charge on the developer.
Frontier Economics notes that developer charges can serve two purposes:
price signalling to encourage efficient patterns of development by signalling to developers the infrastructure costs associated with development in different locations; and
cost recovery a means of recovering the costs incurred in extending or upgrading infrastructure.117
Developer charges in practice
Icon Water requires developers to install and pay for local reticulation assets and the costs of connection to the existing grid, but does not levy developer charges for any augmentation requirements. In its submission to the Productivity Commission’s review of urban water, Icon Water (then ACTEW) stated:
Under the Utilities Act 2000 (ACT), ACTEW is able to levy a capital contribution charge on developers for the development or augmentation of its network. However, ACTEW has not introduced a capital contributions policy.
To levy developer contribution charges, ACTEW would be required to develop a capital contributions code under the Act. ACTEW considers that the administration of such a code for water and wastewater sector assets would be resource intensive, and in any case a code would be of questionable merit in the ACT given the Territory’s ordered approach to development, which removes the need for locational signals. As a result, ACTEW continues to fund required water and sewerage urban infill development.118
Sydney Water has a similar approach for mains water:119
117 Frontier Economics, 2008: 20.118 ACTEW, 2011: 4.119 Sydney Water does require developer charges for recycled water developments.
Issues paperTariff Review 2016 71

4 – Water pricin
Each year, Sydney Water takes over the ownership of about $100 million worth of infrastructure, which has been built by developers. Generally developers hand over smaller reticulation assets to Sydney Water ‘free of charge’, but Sydney Water pays for larger trunk assets.120
City West Water has the following general arrangements:
City West Water is responsible for providing shared assets and temporary shared assets;
developers are responsible for providing reticulation assets and temporary reticulation assets; and
developers are responsible for the financing costs associated with bringing forward the provision of shared assets and/or temporary shared works.121
The Commission is interested in hearing from stakeholders, and particularly Icon Water and estate developers, about their views on the introduction of developer charges.
Q9: Do you think Icon Water should consider levying developer charges for new developments in an effort to send the right price signals about the actual costs involved?
4.5.7 Uneconomic bypass
As discussed in section 2.4.1, there are a number of public and privately funded secondary water initiatives in the ACT. Initiatives of any significant size have implications for the pricing of primary water. This is because they raise the possibility of economically inefficient bypass of the primary network.
As noted in its 2011 tariff issues paper, the Essential Services Commission in Victoria has adopted an upper and lower bound pricing approach as a means to avoid incentives for the inefficient bypass of regulated infrastructure:
For each tariff class, the revenue expected to be recovered should lie on or between:
1) an upper bound representing the stand alone cost of serving the customers who belong to that class; and
2) a lower bound representing the avoidable cost of not serving those customers.122
120 Sydney Water, 2011: 1.121 City West Water, 2015b: 17.122 ESC, 2011b: 10.
72 Issues paperTariff Review 2016

4 – Water pricin
Putting this approach into practice is best explained with reference to an ACT example: Icon Water facing competition for water for irrigation purposes from the Inner North pilot of the Canberra Integrated Urban Waterways Project.
In its 2012 secondary water report, the Commission assessed the cost-effectiveness of various secondary water initiatives against that of the primary water supply system.123 The analysis undertaken for that inquiry indicated a levelised cost for the Inner North pilot of $4.12/kL.124 This compared to the short-run marginal cost of water from the Icon Water primary supply of about $0.30/kL. Icon Water’s top-tier water price at the same time (201213) was $4.86/kL.
Should the Inner North pilot set its stormwater price at $4.12/kL, this would be lower than the Icon Water top-tier price and result in Icon Water losing sales. This would be an example of inefficient bypass as the lower bound avoidable cost of Icon Water not servicing these customers is the short-run marginal cost of $0.30/kL. A rational response from Icon Water under the Essential Services Commission approach would be to lower its top-tier price, for these customers only, to just below $4.12.
The potential for the uneconomic bypass of Icon Water’s primary water network is a product of the broader regulatory arrangements in the ACT, and there is no mechanism for intervention by the Commission. When undertaking a price investigation, however, the Commission will consider any potential impact of secondary water initiatives on Icon Water’s revenue stream.
123 See ICRC (2012) for more detail.124 Levelised unit cost is a common cost-effectiveness analysis tool and is usually calculated as the present value of the costs of an initiative divided by the present value of the water supplied (or saved in the case of demand-management measures).
Issues paperTariff Review 2016 73

5 Sewerage services pricing
5.1 Introduction
This chapter starts by describing sewerage services pricing arrangements in the ACT and other Australian jurisdictions. This is followed by canvassing a number of specific theoretical and practical issues related to the pricing of sewerage services.
5.2 Arrangements in the ACT
Since 200304, sewerage tariffs in the ACT have comprised a fixed annual supply charge for residential premises, and the same fixed supply charge plus an annual charge per flushing fixture (in excess of two) for non-residential premises. Icon Water does not apply any volume- or strength-based trade waste charges.
Table 5.5 shows Icon Water’s sewerage services tariffs since the 199899 regulatory period as determined by the Commission.
Table 5.5 Icon Water sewerage services tariffs, 1998–99 to 2015–16 ($, current prices)
1998–99 1999–2000 2000–01 2001–02 2002–03 2003–04
Supply charge ($/a) 300.00 310.50 317.60 327.80 339.20 354.20
Fixture charge non-residential customers ($/a)(a)
366.20
2004–05 2005–06 2006–07 2007–08 2008–09 2009–10Supply charge ($/a) 375.32 389.00 398.80 413.76 443.82 484.25
Fixture charge non-residential customers ($/a)
366.20 380.72 390.00 404.64 434.04 473.58
2010–11 2011–12 2012–13 2013–14 2014–15 2015–16
Supply charge ($/a) 516.11 555.39 600.65 492.02 505.41 523.18
Fixture charge non-residential customers ($/a)
504.74 543.15 587.42 481.18 494.28 511.66
(a) For every additional flushing fixture greater than two.
5.3 Arrangements in other jurisdictions
5.3.1 Tariff comparison
This section compares sewerage services tariffs and prices for the same utilities listed in section 4.3. The 2015–16 prices being charged by the various utilities, including Icon Water for comparison purposes, are detailed in Table 5.6.
Issues paperTariff Review 2016 75
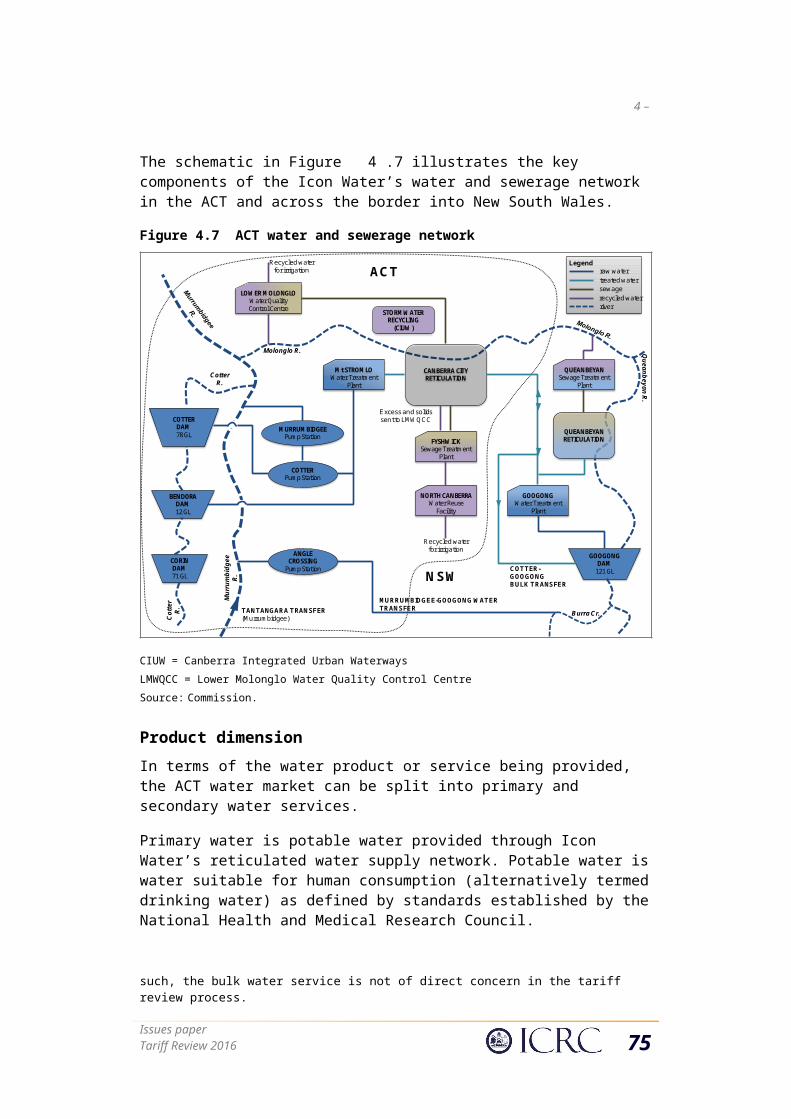
4 – Water pricin
Table 5.6 Sewerage services tariffs in various jurisdictions, 2015–16
Fixed charge($/a)
Volumetric price($/kL)
City West Water residential 253.00 1.84 business 446.84 1.79
Hunter Water residential house 593.58
residential unit/flat 430.34
business (1 x 20 mm connection) 593.58 0.67
business (+1 20 mm connection) 1,179.58 0.67
business (+25 mm connection) 1,843.09 0.67
Icon Water supply charge res & business 523.18 fixture charge res & business 511.66
SA Water res & business 355.80
Sydney Water residential 609.14 business (1 x 20 mm connection) 1,042.70 1.10 business (600 mm connection) 938,406.18 1.10
TasWater res & business 562.68
res & business 14,067.00
Notes: This table only contains a sample of the fixed sewerage services charges by connection size for Sydney Water. For the full list, see www.sydneywater.com.au/SW/accounts-billing/understanding-your-bill/our-prices/index.htm.This table only contains a sample of the fixed sewerage services charges by tenement size for TasWater. For the full list, see www.taswater.com.au/Your-Account/Water-and-Sewerage-Charges.
Source: Sydney Water (2015c); Sydney Water (2015b); City West Water (2015a); Hunter Water (2015a); Hunter Water (2015b); TasWater (2015); SA Water (2015).
5.3.2 Observations
General
There are a few points worth noting from the comparison of prices charged by the utilities listed in Table 5.6:
Two of the six utilities have a two-part tariff with a fixed and volumetric charge.
Three utilities have different prices for residential and business customers and one differentiates between types of residential customer.
Annual fixed charges vary from $355.80 for SA Water customers to $938,406 for Sydney Water business customers with a 600 mm connection.
Two utilities differentiate fixed charges for business customers on the basis of pipe connection size while one, TasWater, sets fixed charges based on tenement size.
76 Issues paperTariff Review 2016

Mechanisms for setting the volumetric price
In addition, a review of the jurisdictional regulatory determinations for the various utilities shows that volumetric prices for Hunter Water and Sydney Water were set with reference to short-run marginal cost. IPART’s view is that:
SRMC is more applicable for sewerage usage pricing since the current sewerage systems are based around individual sewerage plants that are not interconnected. Hunter Water has 18 sewerage treatment catchments.125
In the case of Sydney Water, IPART stated:
To improve cost reflectivity, and send appropriate price signals, we consider that this [sewerage usage] charge should reflect Sydney Water’s short run marginal cost (SRMC) of sewage transportation, treatment and disposal, which is estimated to be $0.23/kL.126
Given that this estimate is much lower than the prevailing usage charge, IPART determined a transition towards this cost over the regulatory period.
Basis for administering the volumetric charge
City West Water’s volumetric sewage disposal fee is based on the volume of sewage each customer is estimated to discharge to City West Water’s sewerage networks. The volumes are calculated on the basis of each customer’s metered water use, using the default formula in Box 5.1.127
Box 5.15 City West Water sewage volume calculation
Volume of sewage=VW × SF × DF
Where:
VW is the total volume of water and recycled water supplied to the customer;
SF is the seasonal factor; and
DF is the discharge factor.
Source: City West Water (2015a).
Trade waste pricing
Many water utilities in other jurisdictions have trade waste charges for commercial customers.
125 IPART, 2013: 118.126 IPART, 2012b: 103.127 City West Water also offers alternative sewage volume calculation options. For more detail, see www.citywestwater.com.au/residents/charges_explained.aspx.
Issues paperTariff Review 2016 77

4 – Water pricin
For example, Sydney Water applies two types of fees: a range of management fees for managing the trade waste and waste quality charges for treating the trade waste. The management fees are fixed charges while the waste quality charges are levied by volume based on the pollutant level of the waste material. For example, high-strength biochemical oxygen demand food waste, such as Asian-style barbecue, attracts a rate of $3.497/kL.128
Where the property is separately metered, Sydney Water prefers to apply a discharge factor to determine how much trade waste is discharged. Where the property is not separately metered, Sydney Water assesses how much is discharged based on a representative sample of similar businesses.
5.4 Theoretical and practical issues
While there is some overlap between the water tariff issues raised in the previous chapter, such as developer charges, there are three specific issues that require consideration in the review of sewerage services pricing: pricing based on the sewage volume, the current fixture charge arrangement for business customers, and non-domestic or trade waste pricing. These are considered in turn.
5.4.1 Volumetric pricing
As discussed above, in contrast to Icon Water’s one-part fixed charge tariff, a number of utilities in other jurisdictions apply a two-part tariff for sewerage services – a supply charge and a volumetric-based rate.
Unlike the economic literature on pricing of water, there is almost no literature on the pricing of sewerage services. Nonetheless, the argument for applying a volumetric rate based on the sewage volume disposed of through the sewerage system is essentially the same – that is, to communicate the costs of providing sewerage services to customers and, in theory, allow customers to balance the costs and benefits of producing sewage such that they would produce an efficient level.
The practical difficulty associated with introducing volumetric-based pricing is that, for residential customers, sewage is not metered and no information is available on the volume of sewage produced by any particular customer. In addition, there is currently no way in which to monitor the type or strength of sewage produced and therefore the cost associated with treatment.
Other utilities have sidestepped the metering issue by using water consumption as a proxy for volumetric discharge into the sewerage system. The premise here is that there is a direct relationship between the amount of indoor water used and the volume of sewage that is discharged into the sewerage network. This approach therefore requires the application of a seasonal factor, to account for the seasonal pattern of outdoor water use.
128 Sydney Water, 2015a: 3.
78 Issues paperTariff Review 2016

There are a number of issues that need to be considered in relation to adopting such a scheme in the ACT.
The first is, as in the case of volumetric water pricing, whether to set volumetric sewage prices with reference to short- or long-run marginal cost. As noted above, IPART’s preference is to set prices for Sydney Water and Hunter Water to reflect the short-run marginal cost of sewage transportation, treatment and disposal. The Commission intends to examine this issue further in its planned technical paper on marginal cost pricing.
The second is whether, in the absence of a reliable measure of actual volumetric discharge, any potential economic efficiency benefits from attempting to estimate discharge may be outweighed by the added complexity of the scheme.
The third is that adding a volumetric pricing component requires a forecast of sewage discharge in order to calculate prices in advance of the regulatory year. If water is used as a proxy, any revenue uncertainty associated with water volumes would then be extended to Icon Water’s sewerage services business. Similarly, a volumetric component would also introduce more variability into quarterly customer bills.
The fourth issue is that lower volumes entering the sewerage network do not necessarily translate into reduced costs for Icon Water. For example, low sewage volumes during a drought can result in difficulties moving sewage through the network. A classic example of this was played out in the Zimbabwean city of Bulawayo in 2012, which involved a simultaneous ‘big flush’ by all community residents to move congealed sewage through the system.129
The Commission is interested in hearing from stakeholders, and particularly Icon Water customers, about their views on the introduction of volumetric pricing for sewerage services.
Q10: Do you think the benefits from introducing volumetric sewerage services pricing will outweigh the costs?
5.4.2 Business charging arrangements
The current business charging arrangements for business customers are based on the number of flushing fixtures, with every additional fixture greater than two attracting another annual fixture charge. The question is whether the number of fixtures is necessarily a good indicator of the impact of a business on the sewerage network.
The Commission notes that, as discussed above, a number of other utilities differentiate business charges on the basis of other measures of impact, such as pipe connection size.
129 Gotora, 2012: 1.
Issues paperTariff Review 2016 79

4 – Water pricin
The Commission is interested in hearing from stakeholders, and particularly Icon Water and its business customers, about their views on the introduction of an alternative approach to sewerage service charges, such as pipe connection size.
Q11: Do you think Icon Water should consider introducing sewerage services pricing based on something other than the number of fixtures?
5.4.3 Trade waste pricing
In the ACT, non-domestic sewage, also known as trade waste, that requires more effort to treat than standard residential sewage, must be approved by Icon Water before discharge into the sewer. Icon Water notes that this category also includes discharges from sewage recycling plants, cooling towers, rainwater filters, garbage bin enclosures, pumped sewage and stormwater run-off directed to the sewer.
In contrast to many other water and sewerage utilities, however, Icon Water does not currently have a specific pricing regime for trade waste.
Paragraph 66(iii) of the National Water Initiative states that states and territories agree to the:
review and development of pricing policies for trade wastes that encourage the most cost effective methods of treating industrial wastes, whether at the source or at downstream plants, by 2006.130
Consistent with cost-reflective pricing, the Commission has in the past noted that where Icon Water incurs material trade waste–related increased costs, these higher costs should be passed on to the relevant customers.
The Commission understands that Icon Water is in the process of finalising a trade waste policy and pricing regime. This will be discussed in the Commission’s forthcoming technical paper on trade waste pricing.
The Commission is interested in hearing from stakeholders, and particularly Icon Water business customers who produce trade waste, about their views on the introduction of a specific trade waste pricing regime.
Q12: Do you think Icon Water should consider introducing trade waste pricing?
130 COAG, 2004: 14.
80 Issues paperTariff Review 2016

6 Next steps
6.1 Consultation – key questions
This issues paper commences the Commission’s consultation on the tariff review. The questions posed by the Commission in this paper are summarised below.
Q1: Do you think that the proposed overarching objective will provide an effective foundation for assessing current and alternative tariff structures? If not, why?
Q2: Do you think that the set of proposed principles will provide an effective basis for assessing current and alternative tariff structures? If not, why? Are there any additional principles that you think the Commission should consider? If yes, what are they and why?
Q3: What is your view on the equity and water conservation benefits of inclining block tariffs?
Q4: Do you monitor your water use on a more regular basis than your three-monthly bill interval? If yes, are you able to estimate when you are about to trigger the top-tier price and does this affect your subsequent water usage?
Q5: Would you be prepared to pay more for water during periods of scarcity rather than be subject to temporary water restrictions?
Q6: Do you think the benefits from more even bills outweigh any complexities associated with daily pricing?
Q7: Would you like to have choice between different water tariffs? If yes, are you confident that you will be able to select the best tariff for your particular circumstances?
Q8: Do you think there are any cost differences between providing water services to business and residential customers or to customers in different locations? If yes, what are these differences due to?
Q9: Do you think Icon Water should consider levying developer charges for new developments in an effort to send the right price signals about the actual costs involved?
Q10: Do you think the benefits from introducing volumetric sewerage services pricing will outweigh the costs?
Issues paperTariff Review 2016 81

Error: Reference source not found – Error: Reference source not found
Q11: Do you think Icon Water should consider introducing sewerage services pricing based on something other than the number of fixtures?
Q12: Do you think Icon Water should consider introducing trade waste pricing?
Stakeholders are of course free to respond to any relevant matter and will have further opportunities to participate in the consultation process as the tariff review progresses.
6.2 Timeline
The proposed timing of the next steps in the review process is set out in Table 6.7. The Commission encourages stakeholders to participate in the consultation process.
Table 6.7 Indicative timeline for the review
Task DateRelease of issues paper 23 November 2015Release of technical paper 1: Water demand elasticity February 2016
Release of technical paper 2: Marginal cost pricing April 2016Release of technical paper 3: Trade waste pricing May 2016
Submissions on issues and technical papers close 1 July 2016
Release of draft report August 2016
Public forum September 2016Workshops September 2016
Submissions on draft report close September 2016Final report November 2016
82 Issues paperTariff Review 2016

Appendix 1 Determining prices
Operational and maintenance costs
Return on capital The cost of capital
Depreciation (return of capital)
Value of the regulated asset base
Value of the regulated asset base divided by the average remaining effective life of the assets included in the asset base
Includes costs of:• maintaining dams and pipes & treating water • reticulating water & maintaining the reticulation system • reading meters and billing consumers• collecting, pumping and treating sewage
Total revenue requirement
The amount of revenue needed to be recovered by Icon Water to cover all prudent and efficient costs
Revenue from sources other than Icon Water tariffs
This includes non-tariff revenue such as from bulk water sales to Queanbeyan City Council and Commonwealth subvention payments
Net revenue requirement
The amount of revenue needed to be recovered from water and sewerage tariffs
Step 1: Determine prudent and efficient operating and capital costs
Step 2: Determine the net revenue requirement
Fixed charge revenue
Fixed chargeNo. customers
Step 3: Set tariff structure & calculate prices to recover net revenue requirement
Variable charge revenue Tier 1
price
Tier 1 volume of water sold
(for water only)
Tier 2 price
Tier 2 volume of water sold
Issues paperTariff Review 2016 83

Abbreviations and acronymsACCC Australian Competition and Consumer Commission
ACT Australian Capital Territory
AEMC Australian Energy Market Commission
COAG Council of Australian Governments
Commission Independent Competition and Regulatory Commission
ESC Essential Services Commission (of Victoria)
GL gigalitre
ICRC Independent Competition and Regulatory Commission
ICRC Act Independent Competition and Regulatory Commission Act 1997 (ACT)
IPART Independent Pricing and Regulatory Tribunal (of New South Wales)
kL kilolitre
LRMC long-run marginal cost
ML megalitre
NWC National Water Commission
OTTER Office of the Tasmanian Economic Regulator
price direction Price Direction: Regulated Water and Sewerage Services – 1 July 2013 to 30 June 2019
SRMC short-run marginal cost
substitute price direction
Substituted Price Direction: Regulated Water and Sewerage Services – 1 July 2013 to 30 June 2018
WAC water abstraction charge
Issues paperTariff Review 2016 85

ReferencesABS 2014. Australian Demographic Statistics, December 2014. Cat. no. 3101.0.
Canberra: Australian Bureau of Statistics.
ACCC 2008. Merger Guidelines. Melbourne: Australian Competition and Consumer Commission.
ACT Government 1997. Independent Competition and Regulatory Commission Act 1997. Canberra: ACT Government.
ACT Government 2009. Waterways: Water Sensitive Urban Design General Code. Canberra: ACT Planning and Land Authority.
ACT Government 2010a. Utilities (Water Conservation) Declaration 2010 (No. 2). Canberra: ACT Legislative Assembly.
ACT Government 2010b. Utilities (Water Restrictions Scheme) Approval 2010 (No. 1). Canberra: ACT Legislative Assembly.
ACT Government 2010c. Utilities Water Conservation Measures Approval 2010. Canberra: ACT Legislative Assembly.
ACT Government 2013. Waterways: Water Sensitive Urban Design Code Review – Issues Paper. Canberra: Environment and Sustainable Development Directorate.
ACT Government 2014a. ACT Population Projections 2013. Canberra: ACT Treasury.
ACT Government 2014b. ACT Water Abstraction Charge (WAC). Canberra: Environment and Planning Directorate.
ACT Government 2014c. ACT Water Strategy 2014–44: Striking the Balance. Canberra: ACT Government.
ACT Government 2014d. ACT Water Strategy 2014–44: Striking the Balance – Implementation Plan 1 (2014–18). Canberra: ACT Government.
ACT Government 2014e. Water Sensitive Urban Design: Review Report. Canberra: Environment and Sustainable Development Directorate.
ACT Government 2015a. Government Response to the Final Report – Pricing of Regulated Water and Sewerage Services: Review of the Regulatory Framework (The Grant Review). Canberra: ACT Government.
ACT Government 2015b. Water Resources (Fees) Determination 2015 (No. 1). Canberra: ACT Legislative Assembly.
ACTEW 2011. ACTEW submission to Productivity Commission Inquiry. Canberra.
Issues paperTariff Review 2016 87

AEMC 2013. Advice on Best Practice Retail Price Methodology: Final Report. Sydney: Australian Energy Market Commission.
AEMC 2014. Rule Determination: National Electricity Amendment (Distribution Network Pricing Arrangements) Rule 2014. Sydney: Australian Energy Market Commission.
Andersson, R and Bohman, M 1985. ‘Short- and long-run marginal cost pricing: On their alleged equivalence’. Energy Economics. 7, 279–288.
Baumol, WJ and Bradford, DF 1970. ‘Optimal departures from marginal cost pricing’. The American Economic Review. 60, 265–283.
Boiteux, M 1960. ‘Peak-load pricing’. The Journal of Business. 33, 157–179.
Borenstein, S 2009. ‘To what electricity price do consumers respond? Residential demand elasticity under increasing-block pricing’. Draft, available at http://faculty.haas.berkeley.edu/borenste/download/NBER_SI_2009.pdf.
Brown, DJ, Heller, WP and Starr, RM 1992. ‘Two-part marginal cost pricing equilibria: Existence and efficiency’. Journal of Economic Theory. 57, 52–72.
City West Water 2015a. 2015–16 Pricing Handbook. Melbourne: City West Water.
City West Water 2015b. Land Development Manual. Melbourne: City West Water.
COAG 2004. Intergovernmental Agreement on a National Water Initiative. Canberra: Council of Australian Governments.
Coase, RH 1946. ‘Marginal cost controversy’. Economica. 13, 169–182.
Commonwealth of Australia 2012. Basin Plan. Canberra: Australian Government.
Dalhuisen, JM, Florax, RJ, De Groot, HL and Nijkamp, P 2001. ‘Price and income elasticities of residential water demand: Why empirical estimates differ’. Discussion paper. Amsterdam: Tinbergen Institute.
Della Valle, AP 1988. ‘Short-run versus long-run marginal cost pricing’. Energy Economics. 10, 283–286.
Dwyer, T 2006. ‘Urban water policy: In need of economics’. Agenda. 13, 3–16.
ESC 2011a. 2013 Water Price Review: Guidance on Water Plans. Melbourne: Essential Services Commission.
ESC 2011b. 2013 Water Price Review: Tariff Issues Paper. Melbourne: Essential Services Commission.
88 Issues paperTariff Review 2016

Frontier Economics 2008. Approaches to Urban Water Pricing: Frontier Economics. Canberra: National Water Commission.
Gotora, G 2012. ‘Zimbabwe: Bulawayo urges residents to flush together to unblock sewers’. Associated Press, 24 September.
Grafton, RQ, Kompas, T and Ward, M 2011. Estimates of Price Elasticities of Demand for Water in the ACT. Canberra: Sustainable Environment Group.
Grafton, RQ and Ward, M 2010. Dynamically Efficient Urban Water Policy. Canberra: Centre for Water Economics, Environment and Policy, Australian National University.
Grant, P 2015. Pricing of Regulated Water and Sewerage Services: Review of the Regulatory Framework – Final Report. Canberra: ACT Government.
Green, R 2007. ‘Nodal pricing of electricity: How much does it cost to get it wrong?’ Journal of Regulatory Economics. 31, 125–149.
Hunter Water 2015a. Customer Charges 2015–16. Newcastle: Hunter Water.
Hunter Water 2015b. Non-residential Pricing and Charges 2015–16. Newcastle: Hunter Water.
ICRC 2007a. Water and Wastewater Discussion Paper 3: Prices. Canberra: Independent Competition and Regulatory Commission.
ICRC 2007b. Water and Wastewater Price Review: Draft Report and Price Determination. Canberra: Independent Competition and Regulatory Commission.
ICRC 2007c. Water and Wastewater Price Review: Working Conclusions. Canberra: Independent Competition and Regulatory Commission.
ICRC 2011. Productivity Commission Draft Report: Australia’s Urban Water Sector – Submission. Canberra: Independent Competition and Regulatory Commission.
ICRC 2012. Final Report: Secondary Water Use in the ACT. Canberra: Independent Competition and Regulatory Commission.
ICRC 2013a. Final Report: Regulated Water and Sewerage Services – 1 July 2013 to 30 June 2019. Canberra: Independent Competition and Regulatory Commission.
ICRC 2013b. Price Direction: Regulated Water and Sewerage Services – 1 July 2013 to 30 June 2019. Canberra: Independent Competition and Regulatory Commission.
Issues paperTariff Review 2016 89

ICRC 2013c. Public forum on the draft report – record of proceedings. Chatham House Room, Waldorf on London, 26 March 2013. Canberra: Independent Competition and Regulatory Commission.
ICRC 2015a. Regulated Water and Sewerage Services – The Industry Panel Process: Outcomes and Prospects. Canberra: Independent Competition and Regulatory Commission.
ICRC 2015b. Water Demand Forecasting: Final Technical Paper. Canberra: Independent Competition and Regulatory Commision.
Industry Panel 2015a. Final Report: Review of the Independent Competition and Regulatory Commission’s 2013 Price Direction for Regulated Water and Sewerage Services in the ACT. Canberra: Industry Panel.
Industry Panel 2015b. Substituted Price Direction: Regulated Water and Sewerage Services – 1 July 2013 to 30 June 2018. Canberra: Industry Panel.
IPART 2012a. Review of Price Structures for Metropolitan Water Utilities: Final Report. Sydney: Independent Pricing and Regulatory Tribunal.
IPART 2012b. Review of Prices for Sydney Water Corporation’s Water, Sewerage, Stormwater Drainage and Other Services from 1 July 2012 to 30 June 2016 – Water: Final Report. Sydney: Independent Pricing and Regulatory Tribunal.
IPART 2013. Hunter Water Corporation’s Water, Sewerage, Stormwater Drainage and Other Services: Review of Prices from 1 July 2013 to 30 June 2017 – Water: Final Report. Sydney: Independent Pricing and Regulatory Tribunal.
Ito, K 2014. ‘Do consumers respond to marginal or average price? Evidence from nonlinear electricity pricing’. American Economic Review, 104, 537-63.
London Economics 1997. Water Pricing: The Importance of Long Run Marginal Costs. London: Office of Water Services.
Mann, PC and Schlenger, DL 1982. ‘Marginal cost and seasonal pricing of water service’. Journal of the American Water Works Association. 74, 6–11.
Marsden Jacob Associates 2004. Estimation of Long Run Marginal Cost (LRMC): A Report Prepared for the Queensland Competition Authority. Brisbane.
Mas-Colell, A, Whinston, MD and Green, JR 1995. Microeconomic Theory. New York: Oxford Economic Press.
NERA 2014. Economic Concepts for Pricing Electricity Network Services: A Report for the Australian Energy Market Commission. Melbourne: NERA Economic Consulting.
90 Issues paperTariff Review 2016

Nieswiadomy, ML 1992. ‘Estimating urban residential water demand: Effects of price structure, conservation, and education’. Water Resources Research. 28, 609–615.
Nieswiadomy, ML and Molina, DJ 1991. ‘A note on price perception in water demand models’. Land Economics. 67, 352–359.
NRMMC 2010. National Water Initiative Pricing Principles. Canberra: Natural Resource Management Ministerial Council.
NWC 2011a. Efficient Water Resource Pricing in Australia: An Assessment of Administered Scarcity Pricing in Urban Areas. Canberra: National Water Commission.
NWC 2011b. Review of Pricing Reform in the Australian Water Sector. Canberra: National Water Commission.
OTTER 2015. 2015 Price Detrmination Investigation – Regulated Water and Sewerage Services in Tasmania: Final Report. Hobart: Office of the Tasmanian Economic Regulator.
Productivity Commission 2011. Australia’s Urban Water Sector. Report no. 55, Final Inquiry Report, vol. 1. Canberra: Productivity Commission.
Ramsey, FP 1927. ‘A contribution to the theory of taxation’. The Economic Journal. 37, 47–61.
SA Water 2015. Fees and Charges Schedule 2015–16. Adelaide: South Australian Water Corporation.
Shin, J-S 1985. ‘Perception of price when price information is costly: Evidence from residential electricity demand’. Review of Economics and Statistics. 67, 591–598.
Sibly, H 2006. ‘Urban water pricing’. Agenda. 13, 17–30.
Stigler, GJ 1966. Theory of price. New York: Macmillan Company.
Sydney Water 2011. Policy: Funding Infrastructure to Service Growth. Sydney: Sydney Water Corporation.
Sydney Water 2015a. Commercial Customers: Trade Wastewater Fees and Charges for 2015–16. Sydney: Sydney Water Corporation.
Sydney Water 2015b. Prices for Your Business: 1 July 2015 to 30 June 2016. Sydney: Sydney Water Corporation.
Sydney Water 2015c. Prices for Your Home: 1 July 2015 to 30 June 2016. Sydney: Sydney Water Corporation.
Issues paperTariff Review 2016 91

TasWater 2015. Price and Service Plan 2015–18: Schedule of Fees and Charges. Hobart: TasWater.
The Brattle Group 2014. Structure of Electricity Distribution Network Tariffs: Recovery of Residual Costs. Sydney: Australian Energy Market Commission.
Train, KE 1991. Optimal Regulation: The Economic Theory of Natural Monopoly. London: MIT Press.
Turvey, R 1964. ‘Marginal cost pricing in practice’. Economica. 31, 426–432.
Vickrey, W 1955. ‘Some implications of marginal cost pricing for utilities’. The American Economic Review. 45, 605–620.
Vohra, R 1990. ‘On the inefficiency of two-part tariffs’. The Review of Economic Studies. 57, 415–438.
Waddams, C, Clayton, K and Webster, K 2011. Benefits and Costs of Introducing Tariff Choice in Uncontested Markets: A Report for Ofwat. United Kingdom: Ofwat.
Wilson, CM and Waddams Price, C 2010. ‘Do consumers switch to the best supplier?’ Oxford Economic Papers. 62, 647–668.
92 Issues paperTariff Review 2016