regular article kinetic study of fischer tropsch synthesis
TRANSCRIPT
PHYSICAL CHEMISTRY
RESEARCH
Published by the Iranian Chemical Society
www.physchemres.org [email protected]
Regular article
Phys. Chem. Res., Vol. 1, No. 1, 69-80, June 2013.
Kinetic Study of Fischer Tropsch Synthesis over co Precipitated Iron-Cerium Catalyst
A.A. Mirzaeia,*, M. Arsalanfara
, F. Ebrahimzadeha, H. Atashib and S.H. Mirhoseini Moghaddamc aDepartment of Chemistry, Faculty of Sciences, University of Sistan and Baluchestan, Zahedan 98135-674
bDepartment of Chemical Engineering, Faculty of Engineering, University of Sistan and Baluchestan, P.O. Box 98164-161, Zahedan, Iran
cIran Polymer and Petrochemical Institute, P.O. Box 14965/115, Tehran, Iran (Received 13 November2012, Accepted 23 January 2013)
The kinetic of Fischer-Tropsch synthesis over a co-precipitated Fe-Ce catalyst was investigated in a fixed bed micro reactor. Experimental conditions were varied as follow: reaction pressure 1-15 bar, H2/CO feed ratio of 1-3 and space velocity of 3600-5400 h-1 at the temperature range of 270-310 °C. Four models according to the Langmuir-Hinshelwood-Hougen-Watson (LHHW) type rate equation were derived on the basis of detailed set of possible reaction mechanisms. The reaction rate of this study is fitted fairly well by one kinetic expression based on LHHW mechanism. The kinetic parameters were estimated via non-linear regression method and the MARR% values for all proposed models were obtained. The activation energy was 72 kJ mol-1 for optimum kinetic model. This model had the lower MARR% value than those of the other proposed models. Keywords: Fischer-Tropsch synthesis, Co-precipitation, Kinetic model, Fe-Ce catalyst
INTRODUCTION The Fischer-Tropsch synthesis (FTS) in which syngas is converted into a wide product spectrum consisting of a complex multi-component mixture of linear and branched hydrocarbons and oxygenates, has been found renewed interest particularly in the context of the indirect conversion of coal or natural gas to liquid transportation fuels. Synthesis gas can be obtained from any carbonaceous material, preferentially containing hydrogen [1]. Coal and natural gas are the most common sources to produce synthesis gas. Advantages of the FT hydrocarbons compared to crude oil derivatives are, e.g., the absence of sulfur, nitrogen, and the low aromatic content [2]. From the viewpoint of economic viability, the selectivity considerations are extremely important in the design of FTS processes. To achieve an optimum in performance for the complete process, the catalyst and the reactor should be optimum comprehensively. It requires hierarchically the development of an engineering kinetics model, in which detailed product distribution information of FTS can self-consistently be reflected. The *Corresponding author. E-mail: [email protected]
quality of a detailed kinetic model is closely related to the understanding of the mechanism in the FTS catalytic reaction system, in which a polymerization process has been recognized to be dominant; however, sufficient details on the FTS mechanistic aspect are not yet fully understood [3-5]. In 1946, Herington first treated the molar distribution of hydrocarbons from FTS in terms of a polymerization mechanism [5,6]. The same formulation was rediscovered by Anderson et al. in 1951 and named the ASF distribution [6]. Investigating the kinetics of FT is important not only for optimizing process parameters, but also for shedding light on the catalytic mechanism [7,8]. In kinetic studies for developing of the CO consumption rate expressions, the hydrocarbon production information is always high significant [9-11]. The kinetic description of the FT reaction is very important task for the industrial practice, being a prerequisite for the industrial process design, optimization and simulation [12]. Iron-based catalysts provide both CO hydrogenation (FTS) and water-gas-shift (WGS) reaction activities, and allow the direct processing of synthesis gas with a low H2/CO ratio (as produced by coal gasification in advanced gasifiers) without an additional WGS reactor [13]. The kinetics of FTS and WGS reactions over the iron-based catalyst were

Mirzaei et al. ./Phys. Chem. Res., Vol. 1, No. 1, 69-80, June 2013.
70
investigated by many researchers [14-17]. It is generally accepted that FTS and WGS reactions take place on different active sites over a precipitated iron catalyst and the two reactions will only influence each other via gas phase [15]. The main objectives of the present work are the investigation of the kinetic and mechanism of the CO hydrogenation on the co-precipitated Fe-Ce catalyst and also determining the kinetic parameters. EXPERIMENTAL Preparation In this study the iron cerium catalyst was prepared using co-precipitation method as follows. Aqueous solutions Ce(NO3)2.6H2O (1 M) and Fe(NO3)3.9H2O (1 M) with molar ratio of [Fe]/[Ce] = 4/1 were pre-mixed and the resulting solution heated to 70 °C in a round-bottomed flask fitted with a condenser. Aqueous Na2CO3 (1 M) was added dropwise to the mixed nitrate solution with stirring while the temperature was maintained at 70 °C until pH = 8.3 ± 0.1 was achieved. The resulting precipitate was then left in this medium for 2 h. The aged suspension was then filtered, washed several times with warm distilled water until no further Na+ was observed in the washings [18], as tested by flame atomic absorption. The precipitate was then dried in an oven at 110 °C for 16 h to give a material denoted as the catalyst precursor, which was subsequently calcined in static air in the furnace at 650 °C for 6 h to give the final catalyst. Catalyst Testing The catalyst tests were carried out in a fixed bed micro reactor operating at atmospheric pressure (Fig. 1). All gas lines to the reactor bed were made from 1/4” stainless steel tubing. Three mass flow controllers (Brooks, Model 5850E) equipped with a four-channel read out and control equipment (Brooks 0154) were used to adjust automatically the flow rate of the inlet gases (CO, H2 and N2 with purity of 99.999%). The mixed gases in the mixing chamber passed into the reactor tube, which was placed inside a tubular furnace (Atbin, Model ATU 150-15) capable of producing temperature up to 1500 ºC and controlled by a digital programmable controller (DPC). The reactor tube was constructed from stainless steel tubing; internal diameter of 20 mm, with the catalyst bed situated in
Fig. 1. Schematic representation of the reactor in a flow
diagram used.
the middle of the reactor. The reaction temperature was controlled by a thermocouple inserted into catalyst bed and visually monitored by a computer equipped with software. Some thermocouples inserted in the catalyst bed for monitoring the inlet, outlet and bed temperatures by a DPC. The meshed catalyst (1.0 g) was held in middle of the reactor using quartz wool. It consist of an electronic back pressure regulator which can control the total pressure of the desired process using a remote control via the TESCOM software package integration that improve or modify its efficiency that capable for working on pressure ranging from atmospheric pressure to 100 bar. The catalyst was in situ pre-reduced at atmospheric pressure under H2-N2 (flow rate of each gas = 30 ml min-1) at 400 ºC for 12 h before synthesis gas exposure. The FTS was carried out under in the range of 270-310 °C, P = 1-15 bar, H2/CO = 1/1-3/1 and GHSV = 3600-5400 h-1. In each test, 1.0 g catalyst was loaded and the reactor operated about 12 h to ensure steady state operations were attained. Reactant and product streams were analyzed on-line using a gas chromatograph (Thermo ONIX UNICAM PROGC+) equipped with sample loop, two Thermal Conductivity Detector (TCD) and one Flame Ionization Detector (FID) able to perform the analysis of a wide variety of gaseous hydrocarbon mixtures, one TCD used for the analysis of hydrogen and the other one used for all the permanent gases such as N2, O2 and CO. The FID is used for the analysis of hydrocarbons. The contents of the sample loop were injected

Kinetic Study of Fischer Tropsch Synthesis./Phys. Chem. Res., Vol. 1, No. 1, 69-80, June 2013.
71
automatically into an alumina capillary column (30 m × 0.550 mm). Helium was employed as a carrier gas for optimum sensitivity (flow rate = 30 ml min-1). The GC calibration was carried out using various calibration mixtures and pure compounds obtained from American Matheson Gas Company (USA). The results in terms of CO conversion and selectivity of products are given at each space velocity. The CO conversion (%) is calculated according to the normalization method: 100
)CO of (Moles)CO of Moles()CO of (Moles(%)conversion CO
in
outin
(1) The selectivity (%) towards the individual components on carbon-basis is calculated according to the same principle: 100
CO converted of Molesjproduct in carbon of Moles(%)product j ofy Selectivit
(2) RESULTS AND DISCUSSION Reactor Model An integral reactor model was used to describe the operation of the micro fixed bed reactor. The heat transfer in this reactor was also such that the catalyst packing was essentially isothermal for the operating conditions used. The effects of axial dispersion and pressure drop were examined with well-established criteria [19,20] and it was found that all of these effects can be neglected. It was accordingly deduced that an isothermal one-dimensional pseudo homogeneous model with plug flow was applicable. The equations describing this model consist of a mass balance for each particular component which may be written as flows: 0)(
irdZuCid (3)
Where Ci refers to the concentration of component i (mol m-3), u the superficial velocity (m s-1), ri the overall reaction rate of component i [mol kgcat
-1 s-1)], and ρβ the catalyst bed density (kgcat m-3). With the boundary condition Ci = Ci
° at reactor entrance (Z = 0), the overall synthesis reaction can be written
as follows: nCO + (n + m/2)H2 → CnHm + nH2O (4) where n is the average carbon chain length of the hydrocarbon product and m is the average number hydrogen atoms per hydrocarbon molecule [21]. Experimental Results Experiments were carried out with mixtures of H2, CO and N2 in a temperature range of 270-310 °C, H2/CO feed ratio of 1/1-3/1 and a pressure range of 1-15 bar. The experimental conditions and obtained data are presented in Table 1. To avoid the effect of deactivation, fresh catalysts were loaded in each experiment series. To achieve the isothermal conditions in a catalytic bed, the catalyst was diluted with inert materials (quartz and asbestos), axial temperature distribution was ensured using Mear’s criterion [22,23]. To avoid of channelization phenomena, the following simplified relation between catalyst bed length (Lb) and mean catalyst particle diameter (dp) was fulfilled, Lb/dp > 50. We have a differential flow reactor when we choose to consider the rate to be constant at all points within the reactor. Since rates are concentration-dependent this assumption is usually reasonable only for small conversions or for shallow small reactors. For each run in a differential reactor, the plug flow performance equation becomes as follows:
´´´´
01
A
outx
xA
inoutx
xAA
x
CO rx
rxxdx
rrd
FW out
in
out
in
(5)
According to the above equation, the average rate for each run is derived as follow:
WxFr outCO
A
´ (6)
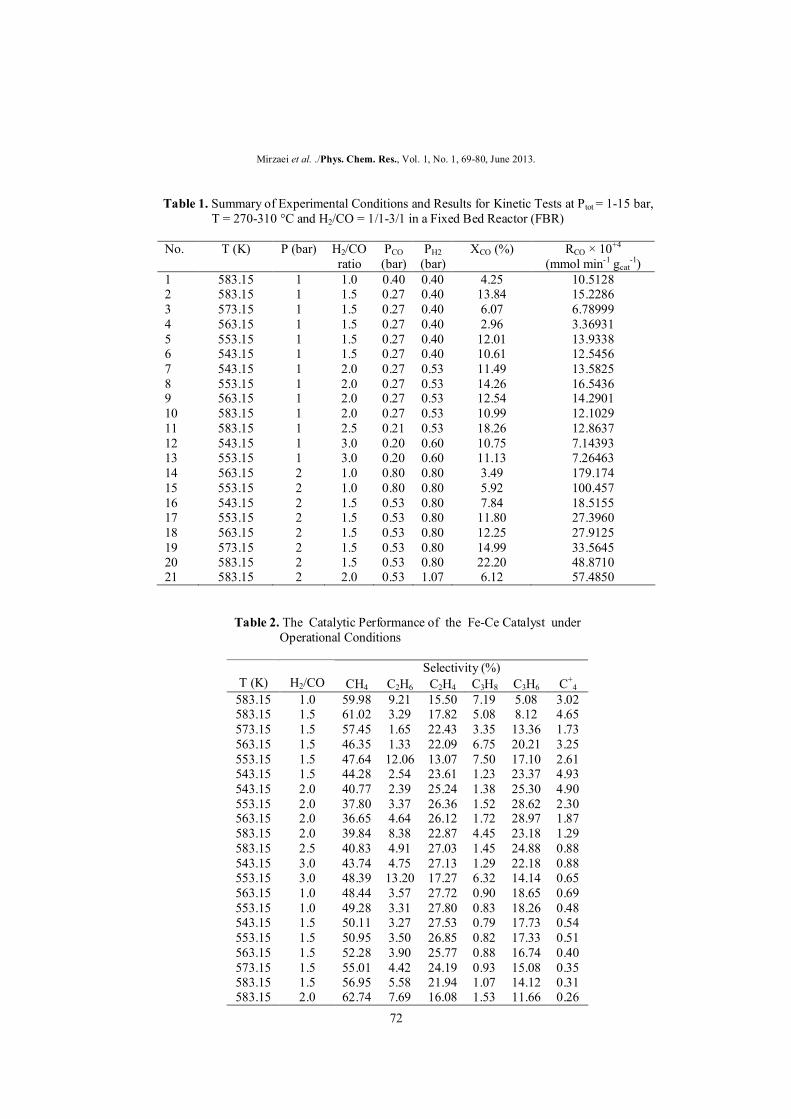
The CO conversion and percentages of product selectivities, present in steady state catalytic performance are presented in Table 2. As seen, at different operational conditions the CO conversion and selectivities toward different products have been changed. Kinetic Modeling and Reaction Rate Equations To obtain the rate equation, a reaction mechanism should
Mirzaei et al. ./Phys. Chem. Res., Vol. 1, No. 1, 69-80, June 2013.
72
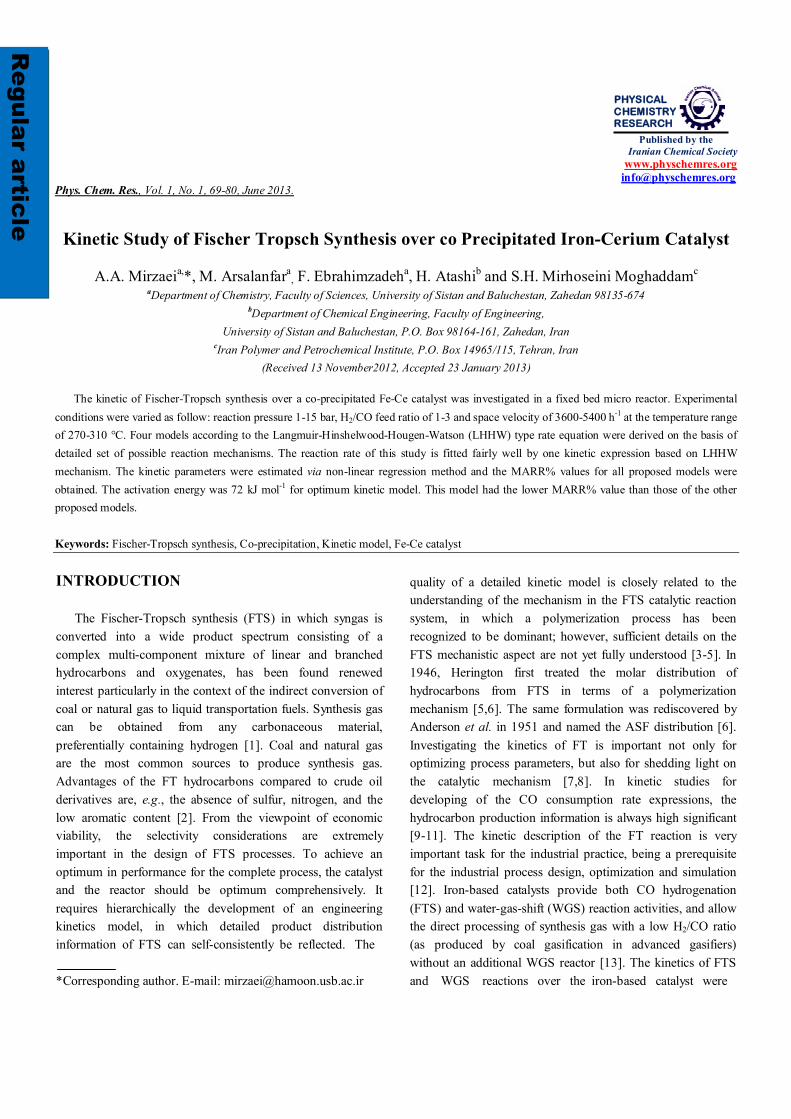
Table 1. Summary of Experimental Conditions and Results for Kinetic Tests at Ptot = 1-15 bar, T = 270-310 °C and H2/CO = 1/1-3/1 in a Fixed Bed Reactor (FBR)
No. T (K) P (bar) H2/CO ratio
PCO (bar)
PH2 (bar)
XCO (%) RCO × 10+4
(mmol min-1 gcat-1)
1 583.15 1 1.0 0.40 0.40 4.25 10.5128 2 583.15 1 1.5 0.27 0.40 13.84 15.2286 3 573.15 1 1.5 0.27 0.40 6.07 6.78999 4 563.15 1 1.5 0.27 0.40 2.96 3.36931 5 553.15 1 1.5 0.27 0.40 12.01 13.9338 6 543.15 1 1.5 0.27 0.40 10.61 12.5456 7 543.15 1 2.0 0.27 0.53 11.49 13.5825 8 553.15 1 2.0 0.27 0.53 14.26 16.5436 9 563.15 1 2.0 0.27 0.53 12.54 14.2901 10 583.15 1 2.0 0.27 0.53 10.99 12.1029 11 583.15 1 2.5 0.21 0.53 18.26 12.8637 12 543.15 1 3.0 0.20 0.60 10.75 7.14393 13 553.15 1 3.0 0.20 0.60 11.13 7.26463 14 563.15 2 1.0 0.80 0.80 3.49 179.174 15 553.15 2 1.0 0.80 0.80 5.92 100.457 16 543.15 2 1.5 0.53 0.80 7.84 18.5155 17 553.15 2 1.5 0.53 0.80 11.80 27.3960 18 563.15 2 1.5 0.53 0.80 12.25 27.9125 19 573.15 2 1.5 0.53 0.80 14.99 33.5645 20 583.15 2 1.5 0.53 0.80 22.20 48.8710 21 583.15 2 2.0 0.53 1.07 6.12 57.4850
Table 2. The Catalytic Performance of the Fe-Ce Catalyst under Operational Conditions
Selectivity (%) C+
4 C3H6 C3H8 C2H4 C2H6 CH4
H2/CO T (K)
3.02 5.08 7.19 15.50 9.21 59.98 1.0 583.15 4.65 8.12 5.08 17.82 3.29 61.02 1.5 583.15 1.73 13.36 3.35 22.43 1.65 57.45 1.5 573.15 3.25 20.21 6.75 22.09 1.33 46.35 1.5 563.15 2.61 17.10 7.50 13.07 12.06 47.64 1.5 553.15 4.93 23.37 1.23 23.61 2.54 44.28 1.5 543.15 4.90 25.30 1.38 25.24 2.39 40.77 2.0 543.15 2.30 28.62 1.52 26.36 3.37 37.80 2.0 553.15 1.87 28.97 1.72 26.12 4.64 36.65 2.0 563.15 1.29 23.18 4.45 22.87 8.38 39.84 2.0 583.15 0.88 24.88 1.45 27.03 4.91 40.83 2.5 583.15 0.88 22.18 1.29 27.13 4.75 43.74 3.0 543.15 0.65 14.14 6.32 17.27 13.20 48.39 3.0 553.15 0.69 18.65 0.90 27.72 3.57 48.44 1.0 563.15 0.48 18.26 0.83 27.80 3.31 49.28 1.0 553.15 0.54 17.73 0.79 27.53 3.27 50.11 1.5 543.15 0.51 17.33 0.82 26.85 3.50 50.95 1.5 553.15 0.40 16.74 0.88 25.77 3.90 52.28 1.5 563.15 0.35 15.08 0.93 24.19 4.42 55.01 1.5 573.15 0.31 14.12 1.07 21.94 5.58 56.95 1.5 583.15 0.26 11.66 1.53 16.08 7.69 62.74 2.0 583.15

Kinetic Study of Fischer Tropsch Synthesis./Phys. Chem. Res., Vol. 1, No. 1, 69-80, June 2013.
73
be adopted. For determination of kinetic model, four mechanisms were offered on the basis of various monomer formation (elementary reactions) and carbon chain distribution pathways. An elementary reaction set on sites for each model is summarized in Table 3. To derivation of each kinetic model, initially one of the elementary reaction steps was assumed as rate determination step and all other steps were considered at equilibrium. Then, all of the obtained models were fitted separately, against experimental data. Table 4 displays the final form of different rate expressions for the 4 kinetic models. The development of the kinetic equations will be illustrated for FT-III2 model (the second step of the elementary reaction for the FT-III model). The model codes refer to the set of elementary reactions and the elementary reaction is not at equilibrium (that is the rate-determining step, so in this case reaction 2). The set of elementary reactions for FT-III2 model is shown in Table 3. The reaction rate of the rate-determining step is: )min..(. 11
22 catCOHCOCO gmolPkR (7)
where θCO is the surface fraction occupied with the associative absorbed carbon monoxide. The surface fractions of carbon monoxide can be calculated from the site balance, the preceding reaction steps which are at quasi-equilibrium: 1 COS (8)
1
1 11
COCO CO S
CO S
kK K Pk P
(9)
Substituting Eq. (9) into Eq. (8), the concentration of free active site can be expressed as:
COSSCOSCOS PK
PK.1
11..11
1 (10)
By substituting of Eq. (10) into Eq. (9), the expression of θCO becomes:
CO
COCO PK
PK.1
.
1
1
(11)
With substituting the surface fraction of CO (Eq. (11)) in Eq.
Table 3. Reaction Schemes of FTS
Elementary reaction No. Model
CO + 2s ↔ Cs + Os H2 + 2s ↔ 2Hs Cs + Hs ↔ HCs + s HCs + Hs ↔ H2Cs + s Os + Hs → HOs + s HOs + Hs → H2O + 2s
1 2 3 4 5 6
FT-I
CO + s ↔ COs H2 + 2s ↔ 2Hs COs + Hs ↔ HCOs + s HCOs + Hs ↔ Cs + H2O + s Cs + Hs↔ CHs + s CHs + Hs↔ CH2s + s Os + Hs↔ HOs + s HOs + Hs→ H2O + 2s
1 2 3 4 5 6 7 8
FT-II
CO + s ↔ COs COs + H2 ↔ H2COs H2COs + H2 ↔ CH2s + H2O
1 2 3
FT-III
CO + s ↔ Cos H2 + s ↔ H2s Cos + H2s ↔ H2Cos + s
H2Cos + H2s↔ H2O + s
1 2 3 4
FT-IV
(7), the final rate expression is obtained:
2
1CO H
COCO
KP PR
aP
(12)
which K and a parameters are defined as follow: K = k2K1 and α = K1

Mirzaei et al. ./Phys. Chem. Res., Vol. 1, No. 1, 69-80, June 2013.
74
Table 4. Reaction Rate Expressions for the FTS MARR (%) Parameters Rate equation Number of proposed model
15.21 1kK
1
1
kk
2
2
kk
25.02
5.0 ])()(21[.
HCO
COCO PP
PKR
FT-I-1
17.32 1kK
1
1
kk
2
2
kk
25.02
5.02
])()(21[.
HCO
HCO PP
PKR
FT-I-2
19.45 5.02
5.013 .. KKkK
1
1
kk
2
2
kk
25.02
5.0
5.02
5.0
])()(21[..
HCO
HCOCO PP
PPKR
FT-I-3
21.62 5.01234 ... KKKkK
1
1
kk
2
2
kk
25.02
5.02
5.0
])()(21[..
HCO
HCOCO PP
PPKR
FT-I-4
13.49 1kK
1
1
kk
2
2
kk
5.02 )(1
..
HCO
COCO PP
PKR
FT-II-1
22.75 1kK
1
1
kk
2
2
kk
5.02
2
)(1.
HCO
HCO PP
PKR
FT-II-2
24.63 213 .. KKkK
1
1
kk
2
2
kk
25.0
2
5.02
])(1[..
HCO
HCOCO PP
PPKR
FT-II-3
19.53 4324 ... KKKkK
1
1
kk
2
2
kk
25.02
2
])(1[..
HCO
HCOCO PP
PPKR
FT-II-4
27.41 1kK
1
1
kk
CO
COCO P
PKR
1. FT-III-1
12.14 12 .KkK
1
1
kk
CO
HCOCO P
PPKR
1.. 2
FT-III-2
25.41 213 .. KKkK
1
1
kk
CO
HCOCO P
PPKR
1.. 2
2 FT-III-3
16.27
1kK
1
1
kk
2
2
kk
21.
HCO
COCO PP
PKR
FT-IV-1
28.56
1kK
1
1
kk
2
2
kk
2
2
1.
HCO
HCO PP
PKR
FT-IV-2
19.68
213 .. KKkK
1
1
kk
2
2
kk
22
2
)1(..
HCO
HCOCO PP
PPKR
FT-IV-3

Kinetic Study of Fischer Tropsch Synthesis./Phys. Chem. Res., Vol. 1, No. 1, 69-80, June 2013.
75
Parameters Optimization Model parameters were calculated from the experimental data and optimized with statistical indicators. The various plots were provided by the Poly math software 6.0 to assess the quality of the regression models and compare the various models. The parameters used in the Poly math software 6.0 consist of graph, residual plot, confidence interval, R2, R2
adj Variance and Rmsd which are defined as follows: Graph. Graph is a plot, on the bases of the calculated and measured values of RCO for each proposed model. An appropriate model shows different trends. Figure 2 compares the experimental and calculated RCO for expression which was obtained for FT-III-2 (Table 3) with assumption that the step 2 is the rate controlling step.
Residual plot. The residual plot shows the difference between the calculated and measured values of the dependent variable as function of the measured values. The residuals between proposed model and experiment should be normally distributed with zero average line. A comparison between calculated and experimental CO conversion is presented in Fig. 3. This figure showed that the residual relative errors (RRs) between model and experiment are mostly distributed within zero line. Confidence interval. If the confidence interval be smaller (or at least equal) than the respective parameter values (in absolute values), then the regression model is stable and statistically valid. R2 and R2
adj. The correlation coefficients were used to
Fig. 2. Comparison between experimental and calculated reaction rate using equation 12. Reaction conditions:
T = 270-310 °C, P = 1-15 bar, H2/CO = 1/1-3/1 (o Rexp□ Rcal).
Fig. 3. The relative residuals for CO consumption rate (o Rexp - Rcal).

Mirzaei et al. ./Phys. Chem. Res., Vol. 1, No. 1, 69-80, June 2013.
76
judge whether the model represents correctly the data. These parameters are defined as Eqs. (13-15).
n
iyi
ny
1 exp )(1 (13)
n
i
n
i calc
yyi
yiyiR
1 exp
12
exp2
)(
)(1 (14)
pnnRR adj
)1)(1(1
22 (15)
In above formulas, the notations n, yi,exp and calc denote the number of experimental, specific observation, observed data and calculated data, respectively. Variance and Rmsd. Variance and R msd are defined as Eqs. (16) and (17).
)1(
)(1
22
nyy
Sn
i i (16)
n
i calcmsd yiyin
R 2exp )(1 (17)
Some statically indicators used to assess the quality of the proposed model (expression FT-III, RDS.2), in Table 4, are summarized in Table 5. Estimation of Kinetic Parameters For estimation of the best kinetic model we assumed that: 1- Because of the small particle size of catalyst (180-250 µm), dilution of catalyst particles by asbestos and low CO conversion, the mass transport limitations and pressure drop can be neglected. 2- All parameters must be positive and all proposed models with negative parameters were rejected. Parameters estimation and model discrimination have done by nonlinear regression model and using of the Poly math software 6.0. Figure 3 showed the residuals between proposed model and experimental data distributed randomly around zero line. Therefore, the proposed models were in good agreement with the experimental data. We obtained the best expression that described the experimental results for FT reaction and it is as follow (Eq. (12)):
2
1CO H
COCO
KP PR
aP
Table 5. Values of Kinetic Parameters of FT-III-2 Model
Dimension Value Parameter
mmol gcat-1 min-1 bar-1 5.40 × 10³ K0
kJ mol-1 72.00 E0
mmol gcat-1 min-1 bar-1 6.49 × 10⁴ k(543.15)
mmol gcat-1 min-1 bar-1 8.42 × 10⁴ k(553.15)
mmol gcat-1 min-1 bar-1 1.09 × 10⁴ k(563.15)
mmol gcat-1 min-1 bar-1 1.53 × 10⁴ k(573.15)
mmol gcat-1 min-1 bar-1 1.98 × 10⁴ k(583.15)
mmol gcat-1 min-1 bar-1 8.30 × 10⁻⁸ a0
kJ mol-1 -47.00 HΔ - 0.95 R2 - 1.01 × 10⁻⁷ Rmsd
- 0.93 R2adj
- 2.26 × 10⁻¹³ Variance - 12.14 MARR (%)

Kinetic Study of Fischer Tropsch Synthesis./Phys. Chem. Res., Vol. 1, No. 1, 69-80, June 2013.
77
The reaction rate of the FT reaction was evaluated over a range of temperature (523-573K), using Arrhenius-type equations (Eq. (18)) for the temperature dependence of the reaction rate constants. RTEKTK iii /)exp()( 0, (18)
RTHaTa ads /)exp()( 0 (19)
where: Ei: activation energy ΔHads = adsorption enthalpy by substituting Eqs. (18) and (19) in best fitted model (FT-III-2) we have:
COads
HCOiiCO PRTH
PPRTEKR
)/)exp((.)/)exp((
0
20,
(20)
The relation between the temperature and reaction rate constant is shown in Fig. 4. According to the Arrhenius-type equation (Eq. (18)), a plot of ln(k) vs. 1/T should give a straight line with negative slope of -Ei/R. The logarithm of the rate constant (k) which plotted in Fig. 4 as a function of reverse of temperature for catalyst shows this relationship between the temperature and rate constant. The relation between the temperature and adsorption enthalpy (Vanthouff plot) for the FT-III-2 model, is shown in Fig. 5. The mean absolute relative residual (MARR%) between experimental and calculated consumption rate of CO is defined as: 1001(%)
exp1 exp
expexp
Nrrr
MARRN
i
cal (21)
where, Nexp is the number of data points included. Equation
Fig. 4. The Arhenius plot of rate constant (k).
Fig. 5. The Van’t Hoff plot of (a) constant.

Mirzaei et al. ./Phys. Chem. Res., Vol. 1, No. 1, 69-80, June 2013.
78
(12) shows the best fit to the experimental data. The comparison of the calculated and experimental consumption rate of CO for the FT-III-2 model is shown in Fig. 6 and the MARR% of this model was obtained 12.14%. This value is reasonable and shows that the predicted values are 12.14% different from the observed values. The MARR% values of the other obtained kinetic models are presented in Table 4; as shown the FT-III-2 model having the minimal MARR% value fits the experimental data well. Catalyst Characterization The XRD technique was carried out to identify the actual phases of Fe-Ce catalyst in different states of precursor and fresh calcined sample (the catalyst before the test). The XRD patterns of these samples are shown in Fig. 7. In the case of precursor, a high background in the low angle region reveals the presence of an amorphous phase in the different pattern due to indiscriminate scattering of X-rays. Consequently,
other phases that may be poorly crystalline or have small crystallite size, and hence broader peaks, are more difficult to detect. The actual phases identified in the calcined catalyst before the test, were Fe2O3 (rhombohedral) and Fe3O4 (cubic). The XRD results showed that different carbonate and nitrate phases in the precursor state after calcination process were transformed to different oxidic phases of iron and cerium. In order to investigate the morphological features and changes in different states of precursor and fresh calcined samples (before the test) these samples were characterized using SEM method. The obtained electron micrographs presented in Fig. 8 show that the morphological features of the catalyst precursor and calcined samples are completely differed. The catalyst precursor is comprised of the particles with different sizes and undefined geometrical shapes; these particles have high dense agglomerate (Fig. 8a). After the calcination process the catalyst morphological feature is completely changed and this sample is comprised of the
Fig. 6. Thecomparison of calculated and experimental consumption rate of CO.
Fig. 7. XRD patterns of the Fe-Ce catalyst precursor and fresh calcined sample (▲Fe2O3, * Fe3O4, ● CeO2).

Kinetic Study of Fischer Tropsch Synthesis./Phys. Chem. Res., Vol. 1, No. 1, 69-80, June 2013.
79
(a)
(b)
Fig. 8. The SEM images of the Fe-Ce catalyst in (a) precursor and (b) fresh calcined states. spherical particles with the same sizes and has the lower particle agglomeration in compression with the precursor state (Fig. 8b).The SEM observation also confirmed that the calcinations process changed the morphological features of the catalyst. CONCLUSIONS The kinetic and mechanism of CO hydrogenation were investigated over the co-precipitated Fe-Ce catalyst in a fixed bed micro reactor. A number of Langmuir-Hinshelwood-Hougen-Watson type rate equations were derived on the basis of a detailed set of possible reaction mechanism. The unknown kinetic parameters were estimated from experimental data using linear regression method. The kinetic parameters
estimated the best fitted model (Eq. (12)), presented reasonable confidence intervals. The best fitted model (FT-III-2) shows that the rate-determining step proceeds via reaction associative adsorbed CO and H2 molecule. The activation energy for the best fitted model was 72 kJ mol-1; the logarithm of the rate constant (k) as a function of reveres of temperature showed a plot with negative slope of -Ea/R and the rate equation of CO consumption was found as: -RCO = KPCO. PH2/1 + aPCO. The catalyst characterization was carried out using XRD and SEM techniques and the obtained results showed that characteristics of the catalyst are completely different in the cases of precursor and calcined sample. REFERENCES
[1] M.E. Dry, A.P. Steynberg, Stud. Surf. Sci. Catal. 152
(2004) 406. [2] M.E. Dry, Appl. Catal., A: Gen. 189 (1999) 185. [3] A. Gribval-Constant, A.Y. Khodakov, R. Bechara, V.L.
Zholobenko, Stud. Surf. Sci. Catal. 144 (2002) 609. [4] V. Ponec, in H. Knoezinger, G. Ertl, J. Weitkamp
(Eds.), Handbook of Heterogeneous Catalysis, VCH: Weinheim, Germany, Vol. 4, pp. 1879-1883.
[5] E.F.G. Herington, Chem. Ind. (London), 65 (1946) 346. [6] R.A. Friedel, R.B. Anderson, J. Am. Chem. Soc. 72
(1950) 1212. [7] W. Ma, G. Jacobs, D.E. Sparks, M.K. Gnanamani,
V.R.R. Pendyala, C.H. Yen, J.L.S. Klettlinger, T.M. Tomsik, B.H. Davis, Fuel. 90 (2011) 756.
[8] M. Arsalanfar, A.A. Mirzaei, H. Atashi, H.R. Bozorgzade, S. Vahid, A. Zare, Fuel. Proc. Tech. 96 (2012) 150.
[9] M.J. Keyser, R.C. Everson, R.L. Espinoza, Ind. Eng. Chem. Res. 39 (2000) 48.
[10] G.P. Van der Laan, A.A.C.M. Beenackers, Appl. Catal. A: Gen. 193 (2000) 39.
[11] M.A. Vannice, J. Catal. 37 (1975) 462. [12] H. Atashi, F. Siami, A.A. Mirzaei, M. Sarkari, J. Ind. &
Eng. Chem. 16 (2010) 952. [13] A. Nakhaei Pour, S.M.K. Shahri, Y. Zamani, M. Irani,
S. Tehrani, J. Nat. Gas. Chem. 17 (2008) 242. [14] B.-T. Teng, C.-H. Zhang, J. Yang, D.-B. Cao, J. Chang,
H.-W. Xiang, Y.-W. Li, Fuel. 84 (2005) 719.

Mirzaei et al. ./Phys. Chem. Res., Vol. 1, No. 1, 69-80, June 2013.
80
[15] A. Nakhaei Pure, M.R. Housaindokht, S.F. Tayyari, J.
Zarkesh, J. Natur. Gas. Chem. 19 (2010) 362. [16] Y.-N. Wang, W.-P. Ma, Y.-J. Lu, J. Yang, Y.-Y. Xu,
H.-W. Xiang, Y.-W. Li, Y.-L. Zhao, B.-J. Zhang, Fuel. 82 (2003) 195.
[17] B.-T. Teng, J. Chang, J. Yang, G. Wang, C.-H. Zhag, Y.-Y. Xu, H.-W. Xiang, Y.-W. Li, Fuel. 84 (2005) 917.
[18] X. An, B. Wu, W. Hou, H. Wan, Z. Tao, T. Li, Z. Zhang, H. Xiang, Y. Li, B. Xu, F. Yi, J. Mol. Catal. A:
Chem. 263 (2007) 266. [19] R.C. Everson, H. Mulder, M.J. Keyser, Appl. Catal. A:
Gen. 142 (1996) 223. [20] G.F. Forment, K.B. Bischoff, Chemical Reactor
Analysis and Design, 2nd ed., Wiley, New York, 1990. [21] R.F. Blanks, Chem. Eng. Sci. 47 (1992) 959. [22] D.E. Mears, ACS Monogr. 133 (1974) 218. [23] M. Mollavali, F. Yaripour, H. Atashi, S. Sahebdelfar,
Ind. Eng. Chem. Res. 47 (2008) 3265.