regression problems for magnitude silvia castellaro 1, peter bormann 2, francesco mulargia 1 and yan...
Post on 19-Dec-2015
217 views
TRANSCRIPT

Regression problems Regression problems for magnitudefor magnitude
Silvia Castellaro1, Peter Bormann2, Francesco Mulargia1 and Yan Y. Kagan3
1 Sett. Geofisica, Università Bologna (Italy)
2 GFZ, Potsdam (Germany)3 UCLA, Los Angeles
IUGG (Perugia), 11 July 2007
The need for a unified magnitudeThe need for a unified magnitude
A large variety of earthquake size A large variety of earthquake size indicator exists (mindicator exists (ms,s, m mb,b, m md, d, mmL,L, M M0, 0,
MMe,e, M Mw ,w ,etc.)etc.)
Each one with a different meaningEach one with a different meaning

Ignoring the fact that a single indicator of size may be inadequate in seismic hazard estimates,
The state of the art is to use on account of its better definition in seismological terms
MMww

The magnitude conversion problem
In converting magnitude, It is commonly assumed that the relation Mx – My is
linear
(this is justified as long as none of them shows a much stronger saturation than the other)
Least-Squares Linear Regression
is so popular that it is mostly applied without checking whether its basic requirements are satisfied

Linear Least-Squares RegressionBASIC ASSUMPTIONS
The uncertainty in the independent variable is at least one order of magnitude smaller than the one on the dependent variable,
Both data and uncertainties are normally distributed,
Residuals are constant.

Fail to satisfy the basic assumptions may:
1) Lead to wrong magnitude conversions,
2) Have severe consequences on the b-value of the Gutenberg-Richter magnitude-frequency distribution, which is the basis for probabilistic seismic hazard estimates
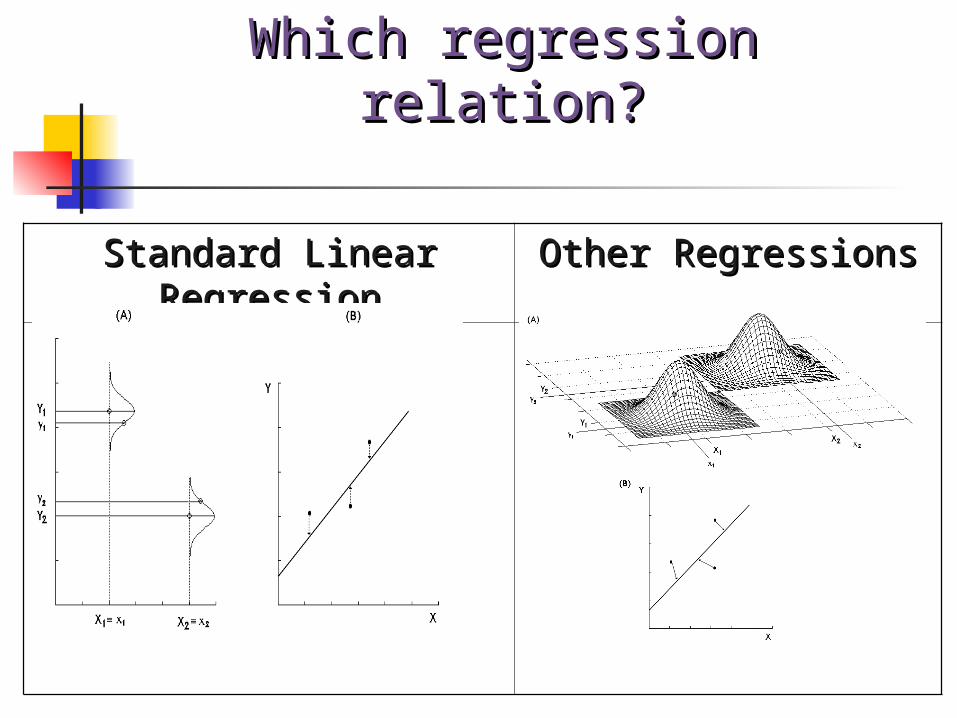
Which regression relation?Which regression relation?
Standard Linear RegressionStandard Linear Regression Other RegressionsOther Regressions

Here we focus on the performance ofHere we focus on the performance of
Standard RegressionStandard Regression Orthogonal RegressionOrthogonal Regression
2y / 2
x
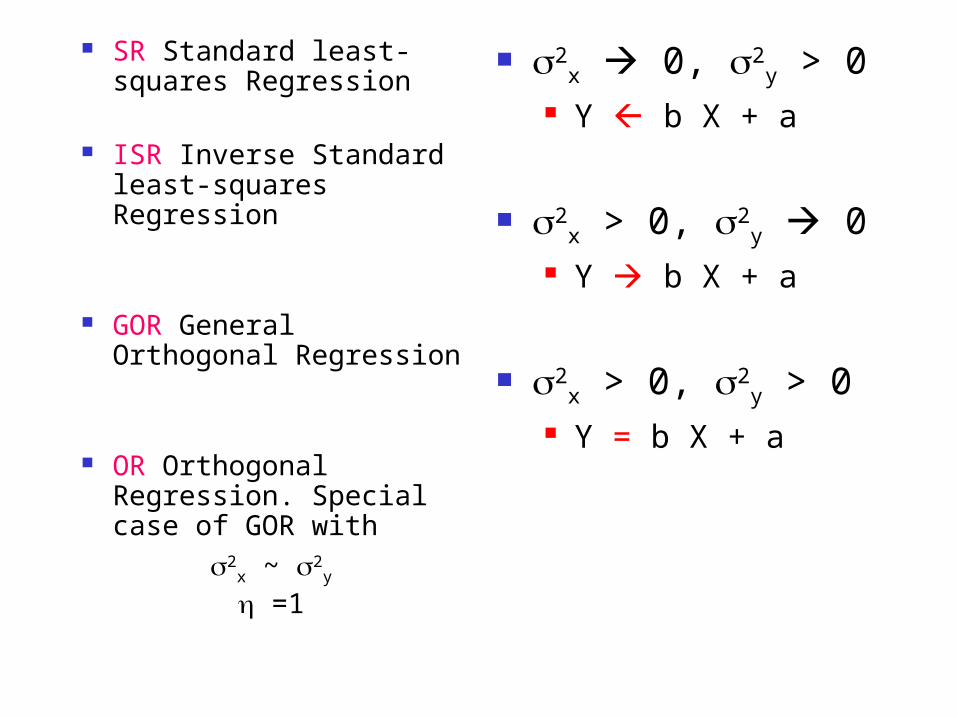
SR Standard least-squares Regression
ISR Inverse Standard least-squares Regression
GOR General Orthogonal Regression
OR Orthogonal Regression. Special case of GOR with
2x ~ 2
y
=1
2x 0, 2
y > 0 Y b X + a
2x > 0, 2
y 0 Y b X + a
2x > 0, 2
y > 0 Y = b X + a

It has already been demonstrated that GOR produces better results than SR/ISR (Castellaro et al., GJI, 2006)
On normally, log-normally and exponentially distributed variables
On normally, log-normally and exponentially dstributed errors
On different amount of errors

GOR
SR
ISR
Example:
(X, Y) exponentially distributed,
Exponentially distributed errors added to X and Y,
True slope () = 1.
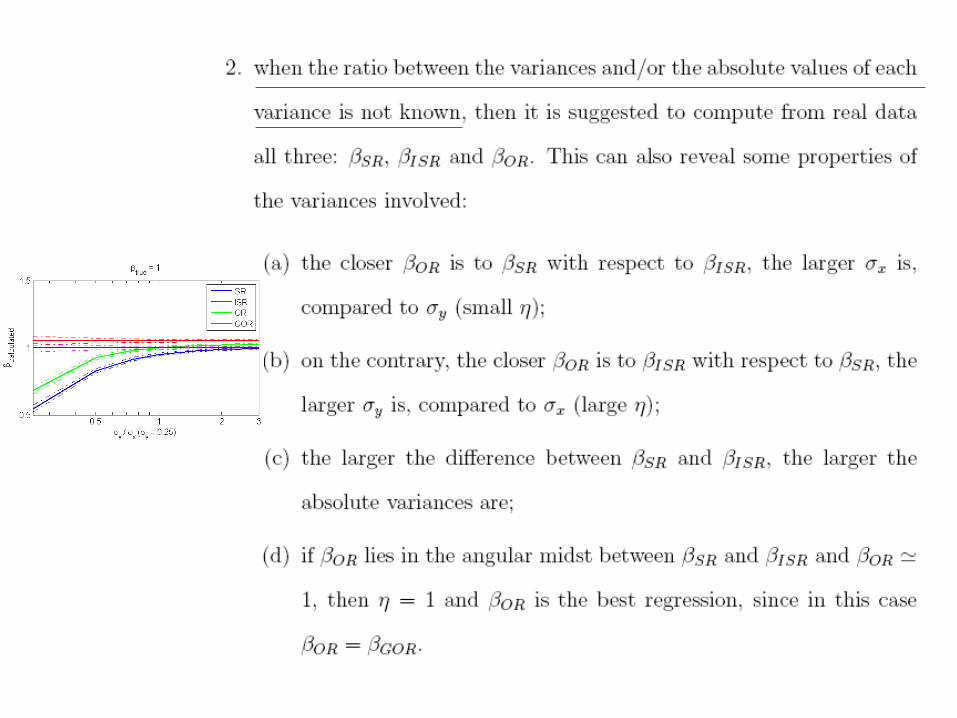
However the point with GOR is
That the error ratio between the y and the x variables (2
y / 2x) needs to be
known.
In practice is mostly ignored since the seismological data centers do not publish standard deviations for their average event magnitudes.

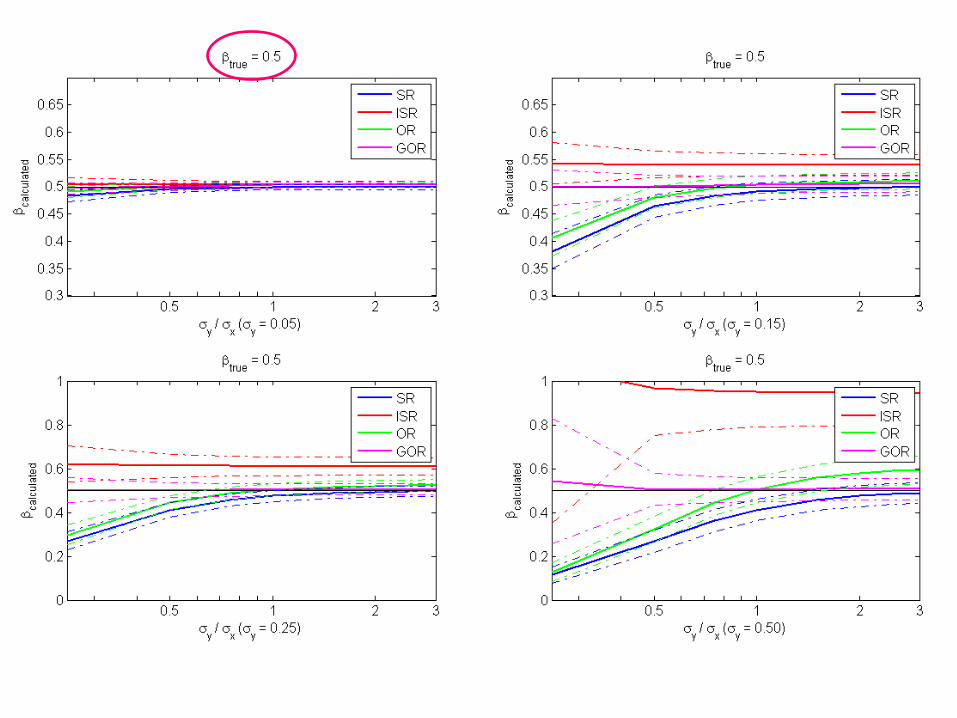
To define the performance of the different procedures we run enough simulations to cover the ranges of
Slopes
Ratios between variances
Absolute values of errors x, y
which may be enocuntered when converting magnitudes
Parameters used in the simulations
In order to produce realistic simulations, parameters are inferred from the study of CENC (Chinese Earthquake Network Center), GRSN (German Regional Seismic Network) and Italian official catalogues
0.5 <true < 2 0.05 <x, y < 0.50 0.25 < < 0.3

1) 103 couples of magnitudes (Mx, My) with
3.5 < Mx, My < 9.5
2) Sampled from exponential distribution (Utsu, 1999, Kagan, 2002, 2002b, 2005, Zailiapin et al. 2005)
3) From (Mx, My) to (mx, my) by addition of errors sampled from Gaussian distributions with deviations x and y
Steps 1) to 3) are repeated 103 times and 103 SR, ISR, GOR and OR regressions are performed to obtain the average SR, ISR, GOR, OR and their deviations.
Generation of the datasets


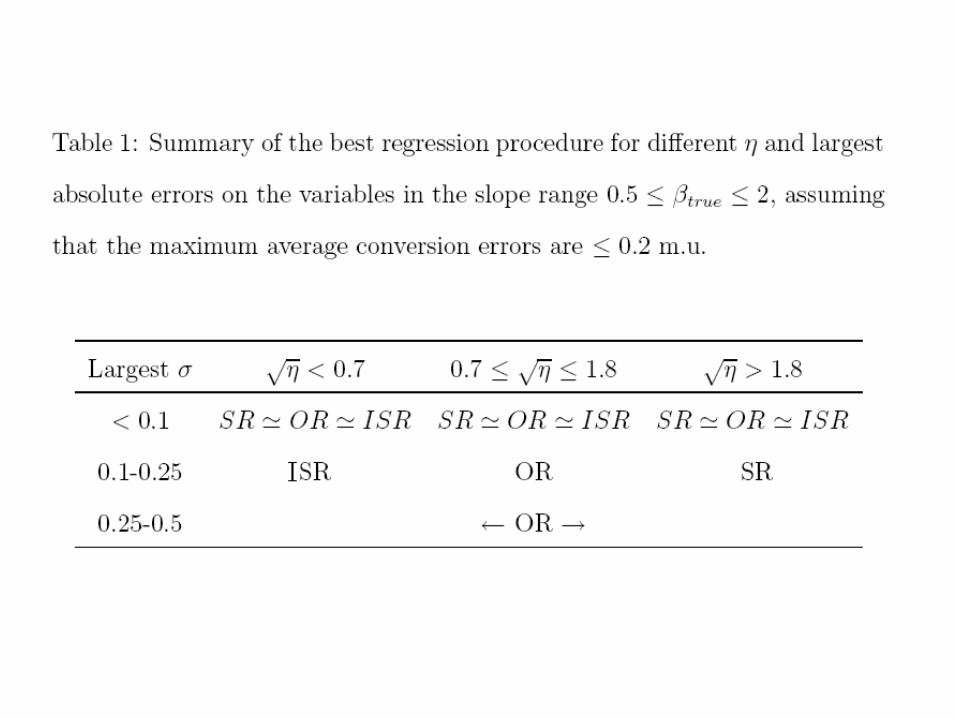
Results
GOR is always the best fitting procedure
However, if is unknown…

Attention should be paid to the mb-MS relation which is not linear (due to saturation of the short-period mb for strong earthquakes), has an error ratio of about 2 and usually a rather large absolute scatter in the mb data
If nothing is known about the variable variances, compare your case to the whole set of figures posted in www.terraemoti.net to get some examples for chosing the best regression procedure
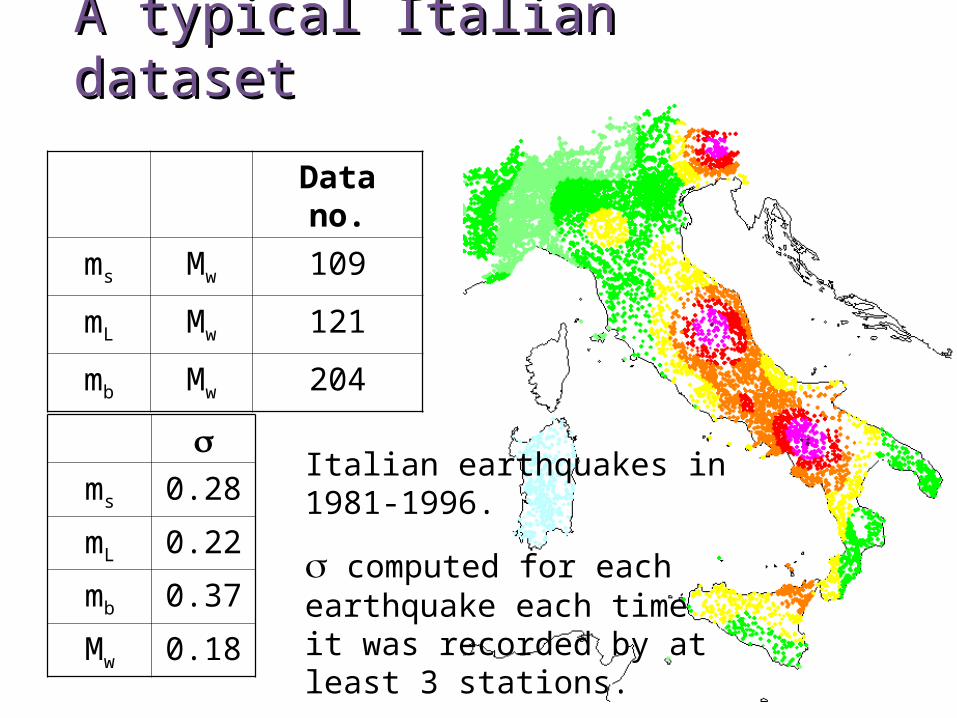
A typical Italian datasetA typical Italian dataset
Data no.
ms Mw 109
mL Mw 121
mb Mw 204
ms 0.28
mL 0.22
mb 0.37
Mw 0.18
Italian earthquakes in 1981-1996.
computed for each earthquake each time it was recorded by at least 3 stations.

MMww-m-mss

MMww-m-mLL
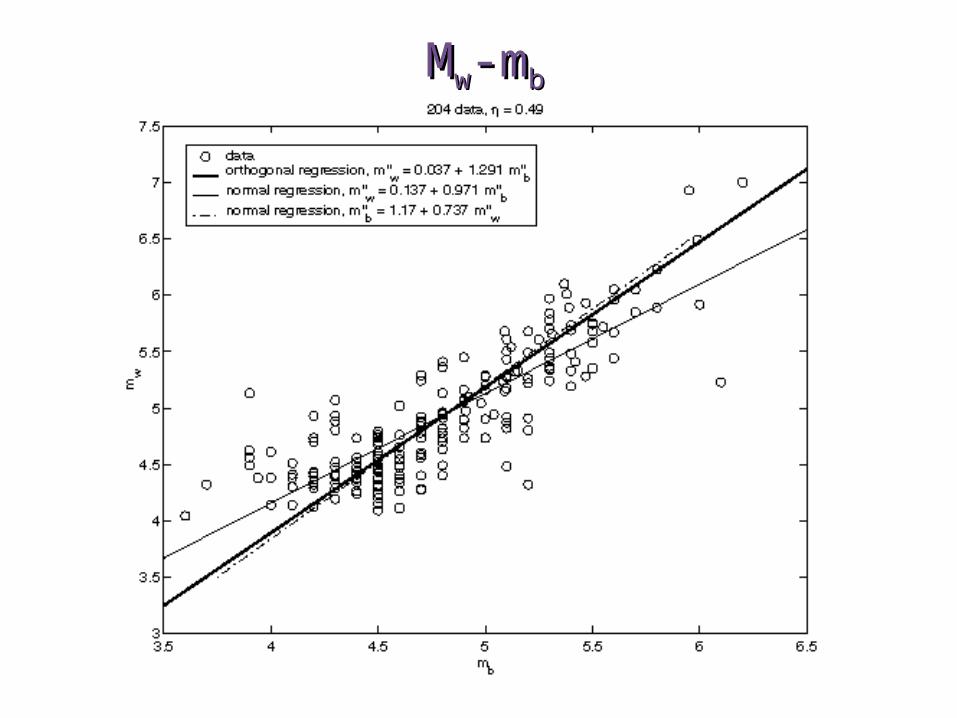
MMww-m-mbb

The magnitude conversion problem may appear a solved problem while it is not!
For example, some authors in the BSSA (2007) state “this work likely represent the final stage of calculating local magnitude relation ML-Md by regression analysis…” but they forgot to consider the variable errors at all!
It follows that…
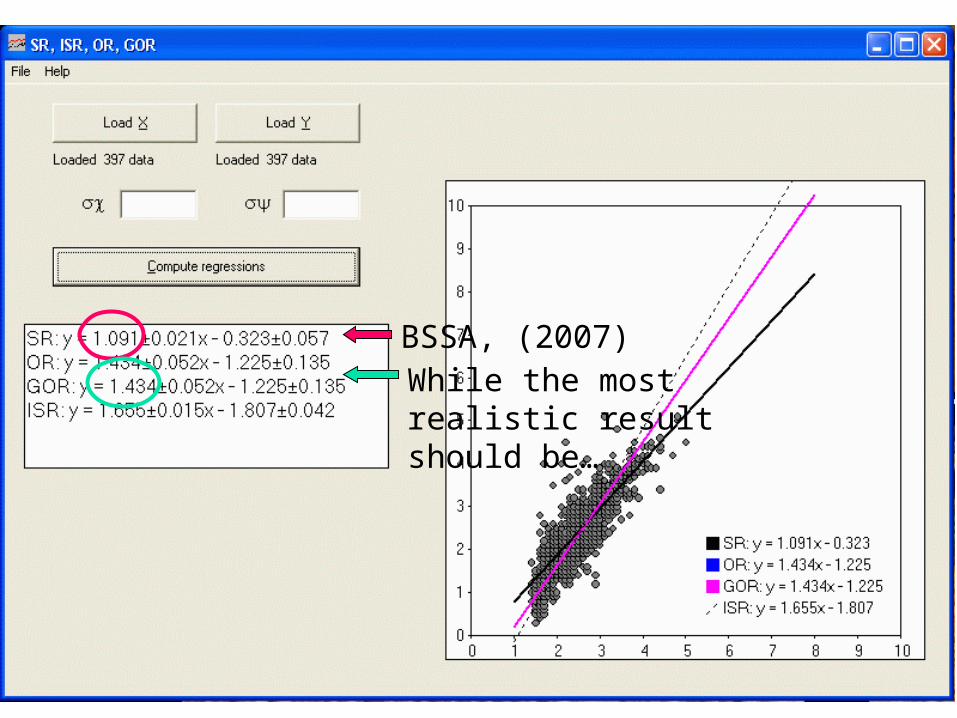
BSSA, (2007)While the most realistic result should be…

The use of SR without any discussion on the applicability of the model is unfortunately still too common

The problem of the magnitude conversion can of course be approached also through other techniques
1. Panza et al., 2003; Cavallini and Rebez, 1996; Kaverina et al., 1996; Gutdeutsch et al., 2002; Grünthal and Wahlström, 2003; Stromeyer et al., 2004:
1. Apply the OR for magnitude-intensity relations
2. but = 1
2. Gutdeutsch et al., 2002 finds the mL-ms relation through OR ( = 1) for the Kàrnik (1996) catalouge of central-southern Europe
3. Grünthal and Wahlström, 2003 applied the 2 regression to central Europe
4. Gutdeutsch and Keiser are studing the 2 regressions for magnitudes
IN EUROPEIN EUROPE

The software to run SR, ISR, OR and GOR is available on www.terraemoti.net