aiddatadocs.aiddata.org/ad4/pdfs/wps57_secondary_school_electrification_in... · registration for...
TRANSCRIPT
AIDDATAA Research Lab at William & Mary
WORKING PAPER 57 June 2018
Secondary School Electrification in Western Kenya
Susanna BerkouwerUniversity of California, Berkeley
Kenneth Lee EPIC-India
Michael WalkerUniversity of California, Berkeley
Abstract
Weestimate the impact of the rollout of a Kenyanprogram that connected the vastmajority of Kenyan sec-ondary schools to the electricity grid on the number of students taking a secondary completion exam andtheir exam performance. Using administrative data from western Kenya and a differences-in-differencesapproach, and controlling for school and time fixed effects, we find no significant impact on either thenumber of students taking the exams, or on exam scores. We explore secondary school energy usagevia an original school survey and find that electricity access is still unreliable for many schools, with overhalf of schools reporting a blackout in the last three days.
Author Information
Susanna BerkouwerUniversity of California, Berkeley
Kenneth LeeEPIC-India
Michael WalkerUniversity of California, Berkeley
The views expressed in AidData Working Papers are those of the authors and should not be attributedto AidData or funders of AidData’s work, nor do they necessarily reflect the views of any of the manyinstitutions or individuals acknowledged here.
Acknowledgments
This research was supported by AidData at the College of William and Mary and the USAID Global De-velopment Lab through cooperative agreement AID-OAA-A-12-00096. The views expressed here do notnecessarily reflect the views of AidData, USAID, or the United States Government. We thank Innovationsfor Poverty Action-Kenya for data collection and research assistance.
Contents 1. Introduction .................................................................................................................................................... 1
2. Background .................................................................................................................................................... 2
2.1 REA’s Secondary School Electrification Program ................................................................................. 2
2.2 Secondary Schooling in Kenya............................................................................................................... 3
3. Data ................................................................................................................................................................. 4
3.1 Administrative Data ................................................................................................................................. 4
3.2. Letters Data ............................................................................................................................................. 5
3.3 School Survey Data ................................................................................................................................. 5
4. Empirical Strategy .......................................................................................................................................... 6
4.1 De Janvry, McIntosh and Sadoulet (2010) Test .................................................................................... 7
4.2 Letters Analysis ........................................................................................................................................ 8
5. Results ............................................................................................................................................................. 9
5.1 Impacts of Electrification ......................................................................................................................... 9
5.2 Energy Usage ......................................................................................................................................... 11
6. Conclusion .................................................................................................................................................... 12
References......................................................................................................................................................... 14
Tables and Figures ........................................................................................................................................... 16
1
1. Introduction
It is often argued that access to electricity leads to improved educational outcomes. Electric lighting
makes it easier for students to read, and electricity is a critical input for appliances that can enhance the
education process, like fans, computers, and photocopiers (see, e.g., IEG WB 2008). Yet existing studies
on the impacts of electrification on educational outcomes, such as hours spent studying and
performance on test scores, find mixed results.1 Furthermore, much of the existing literature focuses on
the impacts of electrification at the household or community-level, rather than on school connections.2
Does electrifying schools lead to measurable gains in educational outcomes? In this paper, we analyze
the impact of school-level electrification in Kenya on secondary schooling outcomes. Specifically, we
focus on the number of students at each school writing the Kenya Certificate of Secondary Education
(KCSE) examination, a national standardized exam that is required for graduation and is administered at
the end of the four-year secondary school program, and KCSE examination results by subject. We look
at four KCSE subjects: English, Kiswahili and Math, required subjects to be taken by all test-takers, and
Computing, one option among several to meet the “technical” subject requirement and which may be
specifically relevant to electrification. Our empirical strategy takes advantage of the rapid rollout of
public secondary school electricity connections that took place following the establishment of Kenya’s
Rural Electrification Authority (REA) in 2006 as part of their Strategic Plan to connect all public facilities
to electricity by 2012. In 2003, a mere 285 public secondary schools across the country had access to
electricity. By November 2012, Kenyan newspapers were predicting that 100 percent of public
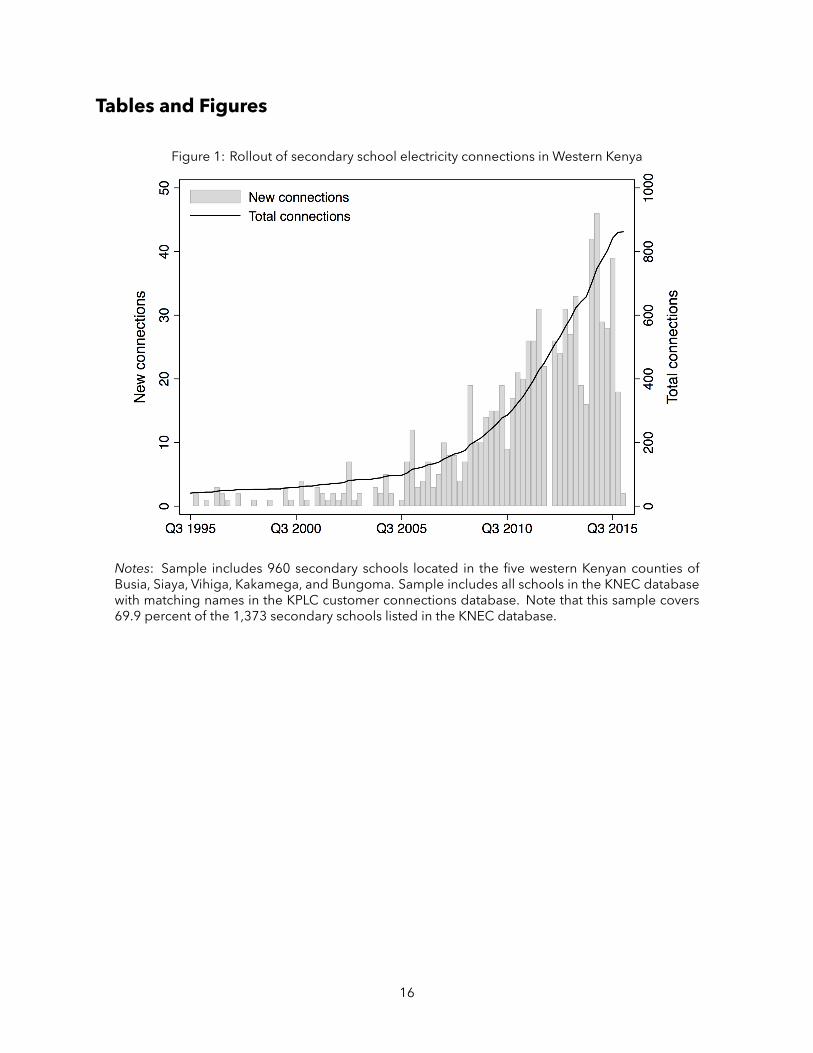
secondary schools in Kenya would be electrified by the end of 2012.3 In Figure 1, we illustrate how
rapidly secondary schools were connected to the grid in our sample of 960 schools in Western Kenya.
1 In terms of the impact of household electrification on hours spent studying, Khandker, Barnes, and Samad (2012) estimate an increase of 12 to 14 minutes per day in Bangladesh; Khandker et al. (2014) estimate an increase of 1.4 to 1.6 hours per day in India; and Barron and Torero (2014) estimate a 78 percent increase in time spent studying and at school in El Salvador. In terms of the impact of household electrification on test scores, Hassan and Lucchino (2016) find that distributing solar lanterns to 7th grade pupils in Kenya increases math grades by 0.88 standard deviations, although spillover effects for control students complicate the interpretation of the results; Furukawa (2014) finds that distributing solar lanterns in Uganda reduces test scores (possibly due to the flickering, low quality of light), but increases studying time by roughly 30 minutes per day. 2 For instance, key studies at the household level include: Khandker, Barnes, and Samad (2012); Grogan and Sadanand (2013); Barron and Torero (2014); Khandker et al. (2014); van de Walle et al. (2015); Chakravorty, Emerick, and Ravago (2016); and Lee, Miguel, and Wolfram (2018). Key studies at the community-level include: Dinkelman (2011); Rud (2012); Lipscomb, Mobarak, and Barham (2013); Kitchens and Fishback (2015); and Burlig and Preonas (2016). There is little comparable work at the public facility-level. 3 See Lee, Miguel, and Wolfram (2018) for a brief summary of the history of rural electrification in Kenya.
2
Since the rollout of school-level electricity connections was not random, we first demonstrate that the
sequence of connections was not endogenous to the schooling outcomes of interest, using a test
developed in de Janvry, McIntosh and Sadoulet (2010). We augment this by investigating letters
exchanged by the electrification authority with key decision makers in each constituency. We then use
the timing of the connections as a source of identification in a differences-in-differences approach that
incorporates school and year fixed effects.
Based on the assembled data, we find no evidence of any impacts from school-level electrification on
the KCSE-related outcomes. Given this, we then explore the ways in which schools are using electricity
based on original surveys of secondary school principals conducted in 2017. We find that electricity
reliability continues to be a reported challenge for many schools: over half of schools report
experiencing blackouts in the last three days.
The remainder of this paper is organized as follows. Section II provides background information on rural
electrification and secondary schooling in Kenya; Section III describes the data assembled; Section IV
discusses the empirical strategy; and Section V presents the results.
2. Background
2.1 REA’s Secondary School Electrification Program
In 2004, the national electrification rate in Kenya was estimated to be 9.1 percent, well below the average
rate of 23.5 percent across Sub-Saharan Africa (IEA 2004). In 2008, REA began implementation of their
Strategic Plan covering the period 2008-2012 to connect all public facilities including trading centers,
health centers, community water works, secondary schools, primary schools, and administrative facilities
located in rural areas to electricity. While the goal was eventually to connect all such facilities to
electricity, due to logistical and financial constraints it would be feasible to connect only a limited
number of projects each year. In addition, due to the large scale and high visibility of these types of
public infrastructure projects, the investment placement decisions were politically very sensitive.
Therefore, REA relied on the local institutional knowledge of Members of Parliament (MP’s) for each
constituency to determine the order in which facilities would be connected. In most cases, projects were

3
jointly funded between REA and the constituency’s public funds, with REA matching the funds
committed by the constituency.
The rollout of connections, including those to secondary schools, was not random and was based on
regional electrification targets, local political objectives, and infrastructure cost considerations. To
determine which projects were to be electrified every year, REA engaged in a series of back-and-forth
letter exchanges with each MP over the course of several years, beginning in 2008. We have collected
and analyzed letters between REA and MPs, which we discuss further in Section IV.B.
2.2 Secondary Schooling in Kenya Education in Kenya follows an 8-4-4 system with eight years of primary, four years of secondary, and four
years of university education. At the end of Class 8, students write the Kenya Certificate of Primary
Education (KCPE), a nationwide exam that is required for entry into secondary school. At the time of
registration for the KCPE, students submit a list of preferred secondary school choices. Secondary school
admissions are then based on a combination of KCPE scores, student preferences, and predetermined
district quotas. It is possible that the electrification status of a school plays a role during this selection
process, for example directly through students’ preferences to attend a school that is connected to
electricity or indirectly by affecting student outcomes.
The secondary school system consists of four years of education, beginning with Form 1 and ending
with Form 4. Given the competitive admissions process, a relatively low number of students transfer
across schools after Form 1. At the end of Form 4, secondary school students write the KCSE, which is
held between October and November of each year. The KCSE marks the completion of secondary
education and is also required for entry into university. Public secondary schools include both day and
boarding schools, and are classified as either sub-county, county, extra-county, or national, based on
the pool of students that they admit students from and the level of funding they receive.
4
3. Data
In this section, we describe a series of administrative and survey data collected and compiled between
2015 and 2017. The datasets include administrative data, data on letters between REA and MPs, and
original school survey data.
3.1 Administrative Data
We construct a panel dataset of school-level student performance on the KCSE and electricity
connection dates for public secondary schools over the period 2001 to 2016. The dataset combines a
number of secondary data sources, including: (1) school-level KCSE exam score distributions obtained
from Kenya National Examination Council (KNEC); (2) electricity connection dates and GPS coordinates
obtained from Kenya Power; and (3) a survey of secondary school characteristics published by the
Kenyan Ministry of Education in 2007.
This paper focuses on data from five counties in western Kenya: Bungoma, Busia, Kakamega, Siaya, and
Vihiga.4 These counties were selected as they formed a substantial portion of the area covered by REA's
western Kenya office, and match the more detailed data that we were able to obtain on electrification
projects over time.
The KNEC records include the student distribution of KCSE scores (for English, Kiswahili, Math, and
Computing) for each school that officially reported scores for at least one year between 2001 and 2016.
Annual records are merged to create an unbalanced panel of test scores.5 In total, there are 91,311
records for 10,851 schools nationwide, and 12,484 records for 1,373 schools in western Kenya. Our main
analysis uses test scores are standardized by subject by first calculating the mean at the subject-school
level, then standardizing by the mean subject score and standard deviation across all schools for a given
year.6
4 Ongoing work seeks to construct this data at a national level. 5 We match secondary schools based on KNEC codes, which were assigned based on province and district. In many cases, the KNEC code for the same school varies from year to year. As a result, the sixteen years of data are strung together using a fuzzy matching algorithm based on school names, codes, and districts. 6 We check the robustness of our results to using school means in the appendix.
5
The Kenya Power database of secondary school electricity connection installation dates is extracted from
a larger database of over four million geo-tagged Kenya Power customers nationwide. These data are
narrowed down into a list of 7,254 likely secondary schools, which are then matched to the KNEC
database.7 Focusing on western Kenya, we are able to match 862 schools with KNEC records to Kenya
Power installation dates. Importantly, this is the date in the Kenya Power system listed as the connection
date; in some instances, this may differ from the first billing date.8 Finally, we are able to match 660 of
these schools to the Ministry of Education survey, which provides useful information on whether a school
is a day or boarding school.
3.2. Letters Data Through extensive data collection and digitization efforts, we scanned and analyzed the letters
exchanged between REA and the MP’s to determine which public facilities would be electrified every
year. In addition to many letters exchanged in subsequent years, we analyzed 511 letters from 162
constituencies across 40 counties in Kenya that were sent by either an MP or REA during the period
between 14 April 2008 and 1 July 2009. The 511 letters referred to a total of 3,202 individual facilities,
of which 36 percent were markets, 20 percent were secondary schools, 13 percent were primary schools,
11 percent were health centers or dispensaries, and 5 percent were water points. In many cases, facilities
were referred to repeatedly across multiple letters. Within the Busia, Bungoma, Kakamega, Siaya, and
Vihiga counties of western Kenya, we analyzed 468 unique facilities referred to across 78 letters.
3.3 School Survey Data The administrative data we collect allows us to estimate impacts on KCSE examinees and test scores. To
better understand how secondary schools utilize electricity, we conducted a survey of secondary schools
in the same five counties in western Kenya covered by our administrative data in June and July 2017.
We used REA project data to identify a candidate set of 477 potential secondary schools that had been
electrified on the basis of REA project descriptions. In some cases, REA projects involved connecting
multiple public facilities, such as market centers and primary schools, in conjunction with (or in addition
7 We identify “likely” secondary schools by searching for different variations of the words “secondary” and “school” in the customer account names. 8 Ongoing work seeks to match billing data with connection data to provide a better indication of the amount of electricity used by schools in this sample.
6
to) secondary schools. During visits, we learned that 48 schools on our initial list were actually primary
schools, 11 were duplicates, and 13 schools were judged not to exist, in part based on conversations
with school head teachers. We removed these schools from our final sample, leaving us with a final target
of 409 secondary schools.
These surveys interviewed principals or deputy principals in order to collect information on school
energy usage, electrical appliances, and the main benefits and challenges of electricity. We successfully
surveyed 387 out of the 409 secondary schools in our final sample (94.6 percent). Table 1 presents
summary statistics on the schools in our sample. 98 percent of the schools are public schools, and 92
percent are sub-county secondary schools, meaning they primarily draw in local students. The fact that
most of these schools are local is reinforced by the fact that 72 percent are exclusively day schools, while
another 24 percent offer both boarding and day options. 88 percent of schools in the sample are mixed-
sex (i.e. serve both boys and girls), while 10 percent are girls schools and 2 percent are boys schools.
Schools have a mean of 17 teachers, with 10 teachers funded by the central government (TSC teachers)
and 7 teachers funded by the school board of governors (BOG teachers). We also collected information
on enrollment from schools that kept enrollment records. The mean school had 282 students in 2016,
with 59 students in Form 4, the last year of secondary school (and the year in which students take the
KCSE exam).
4. Empirical Strategy
Using the panel dataset of electrification dates and KCSE results, we estimate the impacts of school-level
electrification on multiple educational outcomes of interest. Specifically, we estimate difference-in-
difference regressions with school and year fixed effects. As outlined in Section II.A, the rollout of the
program was not random, and therefore this approach relies on the assumption that there is no
difference in the rate of improvement in test scores between schools that were selected for electrification
earlier and schools that were selected later. We use several approaches to test this assumption and
check whether the rollout of the program was endogenous to outcomes.
7
4.1 De Janvry, McIntosh and Sadoulet (2010) Test First, we perform a simple test to support our assumption that the rollout was not endogenous to
outcomes. Following De Janvry, McIntosh and Sadoulet (2010), we estimate equations of the following
form:
𝛥𝑦#$ = 𝛽𝑇# + 𝜆$ + 𝑢#$ (1)
where 𝛥𝑦#$ is the change in the outcome of interest (e.g., the number of KCSE examinees) for school i in
constituency c, over a given pre-period; 𝑇# is the numerical order of connection for school i; and 𝜆+
captures constituency fixed effects. Note that we are primarily concerned with the possibility that higher-
performing schools were prioritized for electrification.9
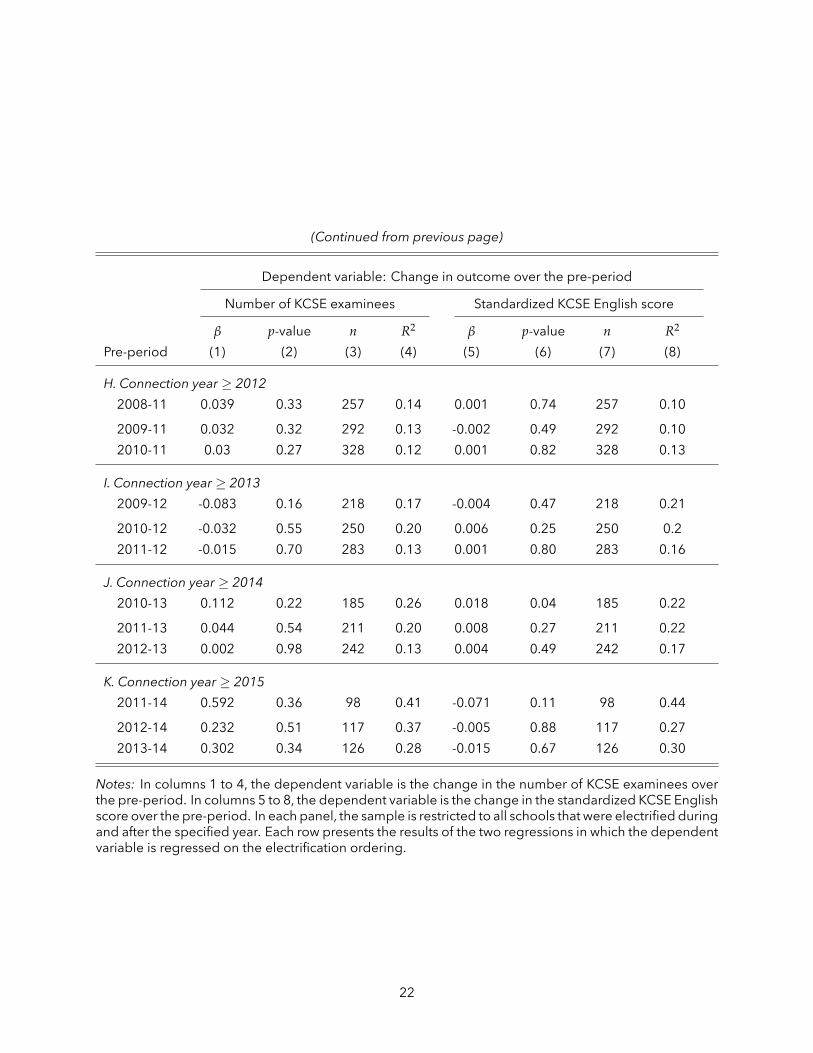
In Table 2, we report the results for 1, 2, and 3-year pre-periods for two outcomes of interest: (a) the
change in the number of KCSE examinees (columns 1 to 4); and (b) the change in the standardized
school-level KCSE English score (columns 5 to 8).10 In each of the eleven panels (i.e., A to K), we limit the
sample to only include schools that were connected in the years following the pre-period. For instance,
in Panel A, the sample is limited to include schools connected in 2005 and afterwards, and we estimate
the effect of 𝑇# on changes in the outcome of interest over the 1-year (i.e., 2003-04), 2-year (i.e., 2002-
04), and 3-year (2001-04) pre-periods.
If pre-period trends are uncorrelated with the sequence of the subsequent rollout, the coefficient on 𝑇#
will be zero. With the exception of the regressions in Panel A, the results show no indication of a
meaningful relationship between 𝑇# and pre-period trends. 11 This suggests the rollout of REA’s
electrification program was not endogenous to school quality as measured by student test-taking and
test scores. In particular, coefficient estimates for connections between 2006 and 2012 are both small in
magnitude and not statistically significant. As a robustness check, we restrict attention to schools that
were connected to the grid between these dates.
9 In other words, we are concerned that 𝛽 is negative and statistically significant. Alternatively, if lower-performing schools were targeted for electrification, then we would find that 𝛽 is positive and statistically significant. 10 Although we only report results for English, the results are similar for Kiswahili, Math, and Computing. 11 In Panel A, all of the regressions result in statistically significant coefficients on 𝑇#. The magnitudes of the coefficients, however, are near zero and positive, suggesting that schools with better pre-period performances were connected at later dates.
8
4.2 Letters Analysis
Analyzing the letters between REA and MPs allows us to determine how the project selection process
worked in practice, rather than just in theory. We find that the process by which schools were selected
for electrification each year was largely independent of schooling outcomes, which supports the results
to the test for endogeneity above. The process by which priority projects were selected was as follows.
First, REA sent a letter initiating the process to the MP for each constituency. The initiating letter would
describe the purpose of REA’s Strategic Plan, detail the exact amount of funding that REA had set aside
to contribute to this constituency for this financial year, and propose a list of facilities that were to be
prioritized during the first year of construction. We have 150 such initiating letters, 91 percent of which
were sent during a 3-day period from 16-18 April, 2008.
MP’s were then requested to respond to these letters by either agreeing or disagreeing with the
proposed list of facilities. If the MP disagreed, they would write back with a new list, which most
frequently would be an edited version of REA’s initially proposed list that often included additional
proposed projects. We have 173 such response letters, 92 percent of which were sent by August of
2008. While the MP’s often do not explicitly list their motivations for modifying REA’s original list and
suggesting a new list, we expect that MP’s were using either political preferences or economic
considerations when determining their list of priorities or suggesting additional projects.
After the relatively standard exchange of these two initial letters, the format of interaction between REA
and the MP often becomes much less standardized. In some cases, REA was able to proceed by
completing all construction projects listed on the first year’s priority list. However, in most cases, REA
was not able to complete all projects due to funding constraints. In these situations, most frequently REA
selected which sites to prioritize unilaterally. Because of REA’s location in Nairobi, relatively far away
from the local projects and therefore removed from the political and economic considerations that the
MP was likely weighing, we believe that REA’s selection was unlikely driven by trends in schooling
outcomes, supporting the assumption needed for identification of our differences-in-differences model.

9
5. Results
5.1 Impacts of Electrification To estimate the impact of school-level electrification on the KCSE, we estimate the following equation:
𝑦#, = ∑ 𝛽.. 𝕀(𝑝 = 𝑦𝑒𝑎𝑟𝑜𝑓𝑒𝑥𝑝𝑜𝑠𝑢𝑟𝑒)#, + 𝜆# + 𝛾, + 𝜖#, (2)
where 𝑦#, is the outcome of interest (e.g., the number of KCSE examinees) for school i in year t; 𝜆#
captures school fixed effects; and 𝛾, captures year fixed effects. School fixed effects capture time-
invariant characteristics that are unique to each school, such as school reputation, the quality of teachers
and facilities, local attitudes towards educational achievement, and others. Year fixed effects capture
differences between years that are universal across schools, including time trends and the effects of
national policies such as the Free Primary Education and Free Secondary Education programs which
were launched in 2003 and 2008, respectively.
We are primarily interested in the coefficients 𝛽. on 𝕀(𝑝)#,, which indicates the length of time the test-
taking cohort at school i in year t was exposed to an electricity connection at school. In our specification,
we include six indicators in total, where:
𝑝 ∈ {Form 4 (i.e., KCSE year), Form 3, Form 2, Form 1, KCPE year; Earlier}
In this specification, the baseline is electrified in 2015, the terminal year in our dataset. If electrification
has a positive effect on the number of KCSE examinees, or the standardized school-level mean on
various topics (e.g., English, Kiswahili, Math, and Computing), we would find positive and significant
coefficients on the 𝕀(𝑝) indicators.
In Table 4, we report the results of estimating equation 2. In general, we find no evidence of measurable
impacts of school-level connections on the number of students taking the KCSE nor on KCSE test scores.
The number of KCSE examinees (column 1) is essentially unchanged across our connection variables,
with the exception of schools connected prior to the four years ago. Here, we find a negative 6 percent
effect statistically significant at the 95 percent level. However, Table 5 reports estimates of the same
10
regression equation, but restricting the sample to schools connected between 2006 and 2012. Given
the smaller number of observations, our estimates are less precise, but we find similar results for all
outcomes. The coefficient estimate on log examinees for cohorts connected earlier is now -0.02 and no
longer statistically significant.
Likewise, coefficients on subject test scores are small and not statistically significant across both Tables
4 and 5 for all subjects analyzed (English, Kiswahili, Math and Computing). There also do not appear to
be pronounced trends on test scores to students exposed to a greater number of years of electricity
(assuming they progressed normally through secondary school). Surprisingly, the coefficient estimates
on computing are negative, though insignificant. As the Computing test was introduced more recently,
we have a more limited number of years of data, leading to less precise standard errors.
We conduct several additional robustness checks in the appendix. First, we use school-level subject
mean test scores, rather than standardized scores, in Appendix Table A1. Second, we restrict attention
to schools present in all periods, so that we have a balanced panel across all years. In both cases, we
again find no evidence of effects.
It is possible that electricity would have a larger effect on boarding schools, since boarding students can
use electric lighting in their dormitories, and in some cases, watch television and listen to the radio. We
estimate the following specification:
𝑦#, = ∑ 𝛽?,.. 𝕀(𝑝)#, + ∑ 𝛽?,.
. 𝕀(𝑝)#, × 𝐵# + 𝜆# + 𝛾, + 𝜖#, (3)
where 𝐵# indicates whether school i is a boarding school (as reported in the Ministry of Education survey)
and the baseline is electrified in 2015 for both boarding and day schools. Note that 𝐵# is omitted from
the specification because its effect is captured in 𝜆#. If electrification has a differential effect on boarding
schools, we would find positive coefficients on the𝕀(𝑝)#, × 𝐵# interaction terms. In Table 6, we report the
results of estimating equation 3. In general, we do not find compelling evidence of an effect, and in
some cases, find counterintuitive results. In columns 1 and 3, for example, the interaction terms yield
negative coefficients, suggesting that longer exposure to electricity differentially reduced the number
of students taking the KCSE in boarding schools and reduced math exam scores, while having no effects
11
on English and Kiswahili test scores.12 That said, the number of boarding schools in western Kenya is
relatively small (64); as we discuss in the Conclusion, this will be a topic to explore in future research
using a national sample of schools.
5.2 Energy Usage
The previous subsection found little impact of electrification on secondary school enrollment and test
score performance in western Kenya. This naturally raises the question of how schools are using
electricity. Here, we use data from our school survey to investigate electricity utilization by secondary
schools. These data come from 2017, on average about 5 years after schools were connected to the
electricity grid.
Table 7 provides descriptive statistics on energy usage by schools in our sample. At the time of our
surveys in 2017, 95 percent of schools had been connected to the electricity grid, while another 3
percent of schools had transformers installed, but had yet to be connected to the grid. The vast majority
of these schools were connected in 2008 or later: only 6 percent of schools report having been
connected prior to 2008.
However, while almost all schools are connected to electricity, grid electricity is not always reliable. 91
percent of schools report that their grid connection delivered power at some point in the last three days,
and 55 percent of schools experienced a blackout in the last three school days. Among schools
experiencing blackouts, the mean school was without power for eight hours, a full school day. Figure 5
presents a histogram of the hours schools have experienced blackouts. 92 percent of principals and
deputy principals report blackouts as a challenge for electricity usage at their school, by far the leading
challenge (see Figure 6).
This is also highlighted by schools’ usage of other energy sources: in addition to the electricity grid, 18
percent of schools have installed a diesel generator, 12 percent installed a solar power system, and 3
percent had access to another type of alternative energy source. Roughly 60 percent of schools that
12 For the outcome log examinees, we also estimate equation 1 separately for day and boarding schools, plotting the 𝕀(𝑝) coefficients in Figure 4. In general, we do not find the anticipated effects.

12
have installed other energy sources report having done so after they were connected to the electricity
grid. The fact grid electricity is not always reliable provides one potential rationale for why we find limited
impacts of electrification on secondary schooling outcomes.
Table 8 presents the share of schools with different technologies potentially useful for teaching
requiring electrical power. Almost all schools have some sort of printing and computer capacity.
However, while these are used extensively by administrative staff, usage rates are lower for teachers and
students: in schools with computers, students used computers in only 24 percent of these. Electricity
usage patterns are similar for schools with any boarding students (Appendix Table A3).
We asked principals and deputy principals open-ended questions about the three main benefits to their
school as a result of electrification. The two main categories reported were lighting for student studying
and printing or photocopying study materials (Figure 6). 83 percent of schools reported that students
used classroom lighting to study before 7 AM, while 45 percent of schools reported that students used
classroom lighting to study after 7 PM. Increased security from lighting was also mentioned by almost
half of respondents. Blackouts remain the most frequent challenge to electricity usage highlighted by
schools, with 92 percent of schools citing this as a challenge. Close to 40 percent of schools also
mentioned the high cost of electricity, and found it difficult to pay their bills. A quarter of schools had
difficulties getting KPLC technicians to conduct needed repairs and maintenance at their schools, with
many of these reporting extensive delays.
6. Conclusion
In this paper, we have analyzed the impact of secondary school electrification implemented by Kenya’s
Rural Electrification Authority (REA) on the number of students taking a secondary school completion
exam (the KCSE) and on test scores in western Kenya. REA electrified hundreds of secondary schools
between 2006 and 2015. Using a differences-in-differences specification with school and year fixed
effects, we find no evidence of increases in the number of students taking the secondary completion
exam, and no effect on exam test scores.

13
We also highlight the challenges that remain in getting secondary schools reliable electricity access. Our
survey data shows that this remains a large challenge for many schools, with a majority of schools
experiencing recent blackouts, and school administrators citing blackouts as a major challenge. More
speculatively, the fact that many school administrators view electricity reliability as a challenge could
dampen investment in technologies that would allow schools to benefit more from electricity. As such,
our estimates should be interpreted as the effects of electrification in a context where, even once
connected to the grid, electricity access remains uneven.
This paper has several limitations that provide exciting avenues for additional research. First, we have
restricted attention to western Kenya, given current data availability. Future work will seek to expand this
to a national sample. Second, our identifying assumption assumes that school trends are similar for
schools electrified earlier rather than later. While we have provided some evidence in support of this,
we cannot fully rule out these concerns. Future work will leverage the letters between MPs and REA, as
well as project cost estimates from REA, to further check the robustness of these results.13 Lastly, our
measure of school electricity usage is the date at which schools connected to the electricity grid. This
provides limited insight into the intensity with which schools are using electricity, which is especially
important in an environment with poor reliability. Ongoing work seeks to match schools to billing
records in order to provide a finer-grained measure of actual electricity utilization over time.
13 For example, with a larger (national) sample, one can consider comparing schools included as a priority by MPs or communities in the initial request to REA, with similar estimated connection costs, that get electrified at different points in time.
14
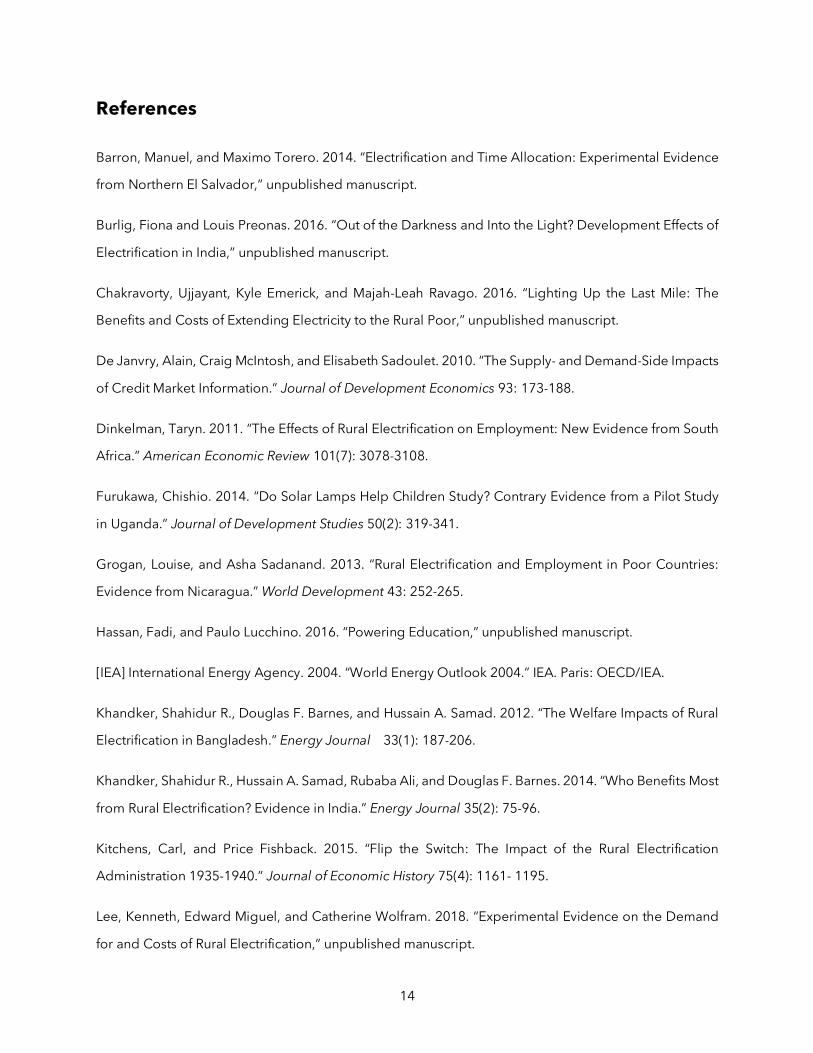
References
Barron, Manuel, and Maximo Torero. 2014. “Electrification and Time Allocation: Experimental Evidence
from Northern El Salvador,” unpublished manuscript.
Burlig, Fiona and Louis Preonas. 2016. “Out of the Darkness and Into the Light? Development Effects of
Electrification in India,” unpublished manuscript.
Chakravorty, Ujjayant, Kyle Emerick, and Majah-Leah Ravago. 2016. “Lighting Up the Last Mile: The
Benefits and Costs of Extending Electricity to the Rural Poor,” unpublished manuscript.
De Janvry, Alain, Craig McIntosh, and Elisabeth Sadoulet. 2010. “The Supply- and Demand-Side Impacts
of Credit Market Information.” Journal of Development Economics 93: 173-188.
Dinkelman, Taryn. 2011. “The Effects of Rural Electrification on Employment: New Evidence from South
Africa.” American Economic Review 101(7): 3078-3108.
Furukawa, Chishio. 2014. “Do Solar Lamps Help Children Study? Contrary Evidence from a Pilot Study
in Uganda.” Journal of Development Studies 50(2): 319-341.
Grogan, Louise, and Asha Sadanand. 2013. “Rural Electrification and Employment in Poor Countries:
Evidence from Nicaragua.” World Development 43: 252-265.
Hassan, Fadi, and Paulo Lucchino. 2016. “Powering Education,” unpublished manuscript.
[IEA] International Energy Agency. 2004. “World Energy Outlook 2004.” IEA. Paris: OECD/IEA.
Khandker, Shahidur R., Douglas F. Barnes, and Hussain A. Samad. 2012. “The Welfare Impacts of Rural
Electrification in Bangladesh.” Energy Journal 33(1): 187-206.
Khandker, Shahidur R., Hussain A. Samad, Rubaba Ali, and Douglas F. Barnes. 2014. “Who Benefits Most
from Rural Electrification? Evidence in India.” Energy Journal 35(2): 75-96.
Kitchens, Carl, and Price Fishback. 2015. “Flip the Switch: The Impact of the Rural Electrification
Administration 1935-1940.” Journal of Economic History 75(4): 1161- 1195.
Lee, Kenneth, Edward Miguel, and Catherine Wolfram. 2018. “Experimental Evidence on the Demand
for and Costs of Rural Electrification,” unpublished manuscript.

15
Lipscomb, Molly, Mobarak, Ahmed Mushfiq, and Tania Barham. 2013. “Development Effects of
Electrification: Evidence from the Topographic Placement of Hydropower Plants in Brazil.” American
Economic Journal: Applied Economics 5(2): 200-231.
Rud, Juan Pablo. 2012. “Electricity provision and industrial development: Evidence from India.” Journal
of Development Economics 97: 352-367.
[WB IEG] World Bank Independent Evaluation Group. 2008. “The Welfare Impact of Rural Electrification:
A Reassessment of the Costs and Benefits.”
van de Walle, Dominique, Martin Ravallion, Vibhuti Mendiratta, and Gayatri Koolwal. 2015. “Long-Term
Gains from Electrification in Rural India.” World Bank Economic Review: 1-36.
Tables and Figures
Figure 1: Rollout of secondary school electricity connections in Western Kenya
Notes: Sample includes 960 secondary schools located in the five western Kenyan counties ofBusia, Siaya, Vihiga, Kakamega, and Bungoma. Sample includes all schools in the KNEC databasewith matching names in the KPLC customer connections database. Note that this sample covers69.9 percent of the 1,373 secondary schools listed in the KNEC database.
16
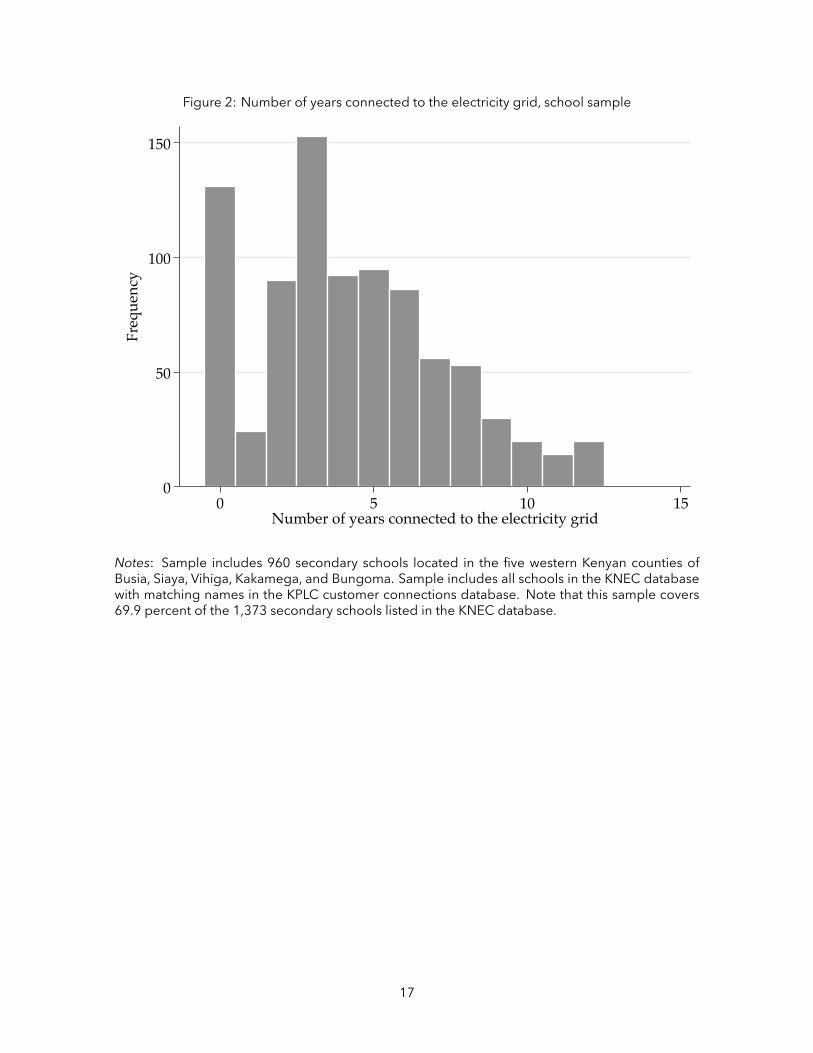
Figure 2: Number of years connected to the electricity grid, school sample
0
50
100
150Fr
eque
ncy
0 5 10 15Number of years connected to the electricity grid
Notes: Sample includes 960 secondary schools located in the five western Kenyan counties ofBusia, Siaya, Vihiga, Kakamega, and Bungoma. Sample includes all schools in the KNEC databasewith matching names in the KPLC customer connections database. Note that this sample covers69.9 percent of the 1,373 secondary schools listed in the KNEC database.
17
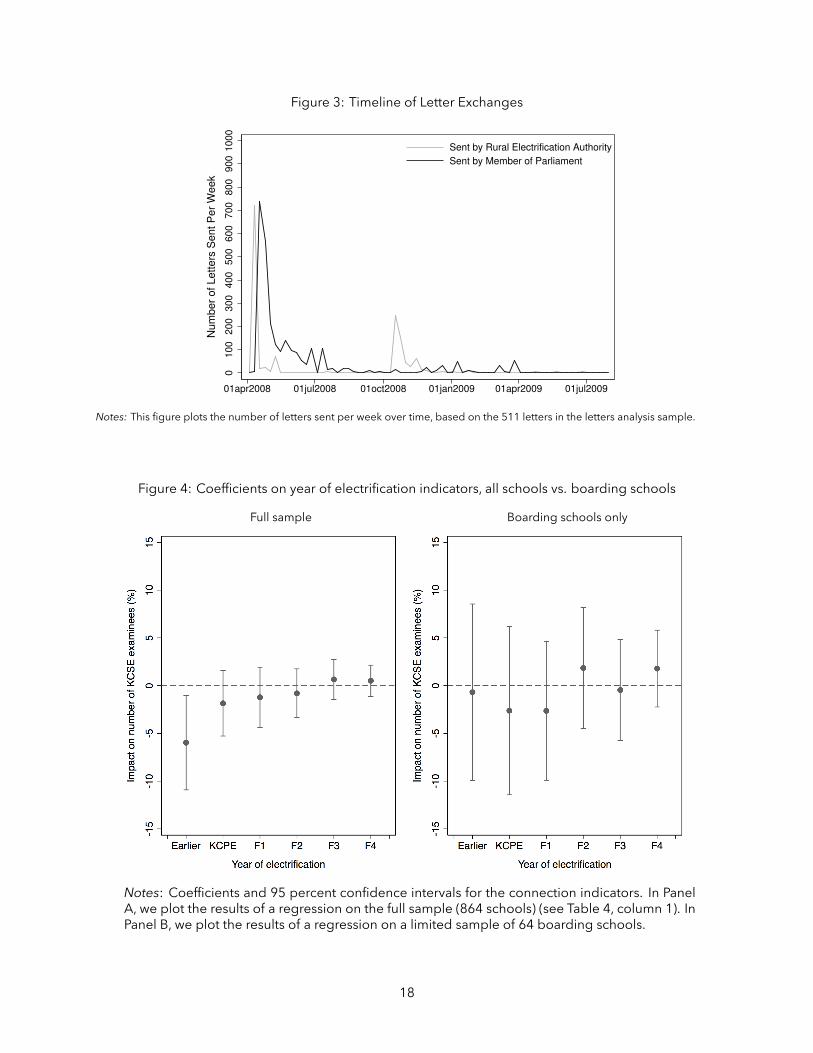
Figure 3: Timeline of Letter Exchanges
0100
200
300
400
500
600
700
800
900
1000
Nu
mb
er
of
Le
tte
rs S
en
t P
er
We
ek
01apr2008 01jul2008 01oct2008 01jan2009 01apr2009 01jul2009
Sent by Rural Electrification Authority
Sent by Member of Parliament
Notes: This figure plots the number of letters sent per week over time, based on the 511 letters in the letters analysis sample.
Figure 4: Coefficients on year of electrification indicators, all schools vs. boarding schools
Full sample Boarding schools only
Notes: Coefficients and 95 percent confidence intervals for the connection indicators. In PanelA, we plot the results of a regression on the full sample (864 schools) (see Table 4, column 1). InPanel B, we plot the results of a regression on a limited sample of 64 boarding schools.
18
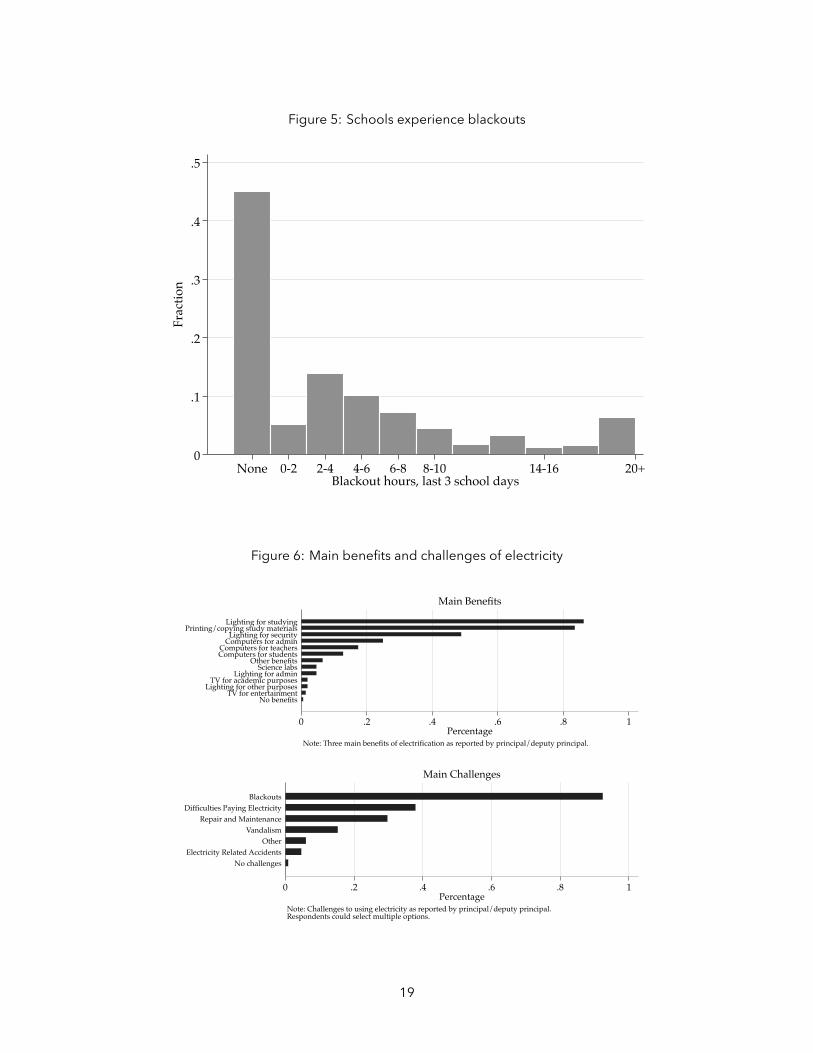
Figure 5: Schools experience blackouts
0
.1
.2
.3
.4
.5Fr
actio
n
None 0-2 2-4 4-6 6-8 8-10 14-16 20+Blackout hours, last 3 school days
Figure 6: Main benefits and challenges of electricity
0 .2 .4 .6 .8 1Percentage
No benefitsTV for entertainment
Lighting for other purposesTV for academic purposes
Lighting for adminScience labs
Other benefitsComputers for studentsComputers for teachers
Computers for adminLighting for security
Printing/copying study materialsLighting for studying
Note: Three main benefits of electrification as reported by principal/deputy principal.
Main Benefits
0 .2 .4 .6 .8 1Percentage
No challengesElectricity Related Accidents
OtherVandalism
Repair and MaintenanceDifficulties Paying Electricity
Blackouts
Note: Challenges to using electricity as reported by principal/deputy principal.Respondents could select multiple options.
Main Challenges
19

Table 1: School Characteristics
Mean Obs
School Type
Public school 0.98 387
Boarding school 0.04 387
Day School 0.72 387
Both boarding and day school 0.24 387
National school 0.01 387
County school 0.07 387
Subcounty school 0.92 387
Boys school 0.02 387
Girls school 0.10 387
Mixed gender school 0.88 387
Establishment Year
Year school established 2001.68 387
School established before 2008 0.57 387
School established 2008-13 0.37 387
School Size
Number of TSC teachers 10.19 386
Number of BOG teachers 6.98 386
Total number of students, 2016 281.74 270
Total number of students enrolled in form 4, 2016 58.55 289
Notes: This table reports results from all schools taking part in the school survey, conductedin 2017. Data reported by school principals and deputy principals. TSC teachers are teach-ers hired and paid for by the central government. BOG teachers are those hired and paid forby the school itself. Enrollment data collected from schools able to provide administrativedata.
20
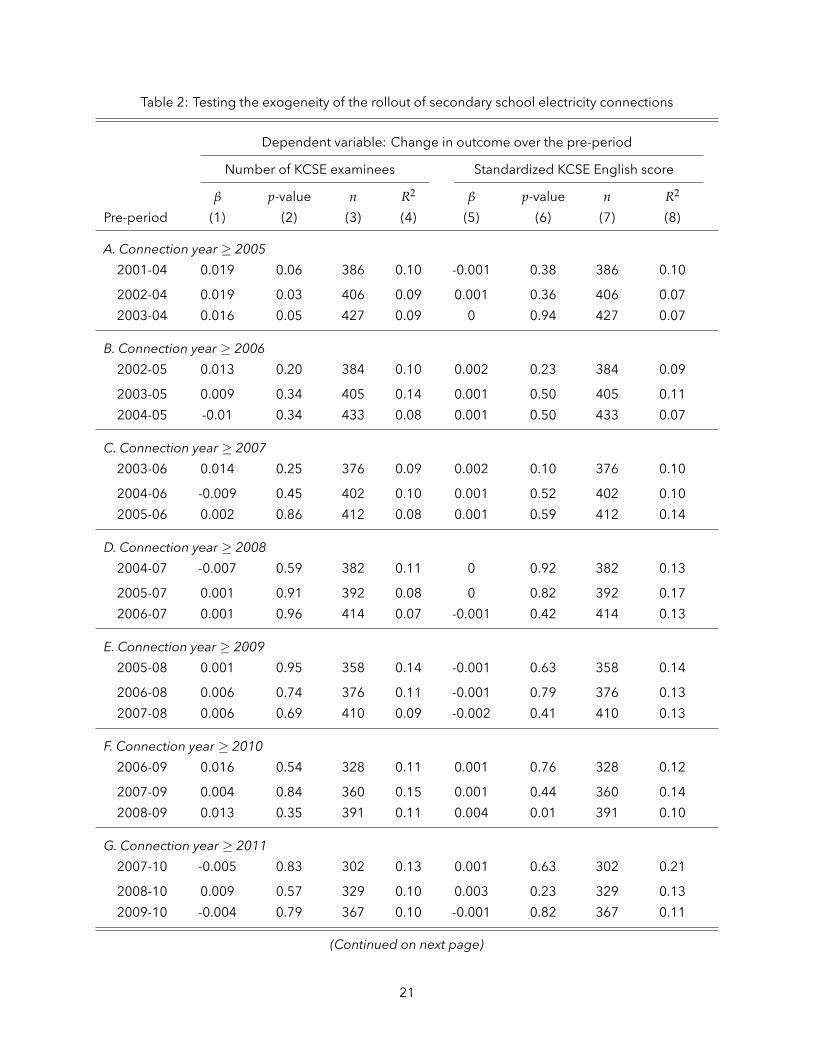
Table 2: Testing the exogeneity of the rollout of secondary school electricity connections
Dependent variable: Change in outcome over the pre-period
Number of KCSE examinees Standardized KCSE English score
β p-value n R2 β p-value n R2
Pre-period (1) (2) (3) (4) (5) (6) (7) (8)
A. Connection year ≥ 2005
2001-04 0.019 0.06 386 0.10 -0.001 0.38 386 0.10
2002-04 0.019 0.03 406 0.09 0.001 0.36 406 0.07
2003-04 0.016 0.05 427 0.09 0 0.94 427 0.07
B. Connection year ≥ 2006
2002-05 0.013 0.20 384 0.10 0.002 0.23 384 0.09
2003-05 0.009 0.34 405 0.14 0.001 0.50 405 0.11
2004-05 -0.01 0.34 433 0.08 0.001 0.50 433 0.07
C. Connection year ≥ 2007
2003-06 0.014 0.25 376 0.09 0.002 0.10 376 0.10
2004-06 -0.009 0.45 402 0.10 0.001 0.52 402 0.10
2005-06 0.002 0.86 412 0.08 0.001 0.59 412 0.14
D. Connection year ≥ 2008
2004-07 -0.007 0.59 382 0.11 0 0.92 382 0.13
2005-07 0.001 0.91 392 0.08 0 0.82 392 0.17
2006-07 0.001 0.96 414 0.07 -0.001 0.42 414 0.13
E. Connection year ≥ 2009
2005-08 0.001 0.95 358 0.14 -0.001 0.63 358 0.14
2006-08 0.006 0.74 376 0.11 -0.001 0.79 376 0.13
2007-08 0.006 0.69 410 0.09 -0.002 0.41 410 0.13
F. Connection year ≥ 2010
2006-09 0.016 0.54 328 0.11 0.001 0.76 328 0.12
2007-09 0.004 0.84 360 0.15 0.001 0.44 360 0.14
2008-09 0.013 0.35 391 0.11 0.004 0.01 391 0.10
G. Connection year ≥ 2011
2007-10 -0.005 0.83 302 0.13 0.001 0.63 302 0.21
2008-10 0.009 0.57 329 0.10 0.003 0.23 329 0.13
2009-10 -0.004 0.79 367 0.10 -0.001 0.82 367 0.11
(Continued on next page)
21
(Continued from previous page)
Dependent variable: Change in outcome over the pre-period
Number of KCSE examinees Standardized KCSE English score
β p-value n R2 β p-value n R2
Pre-period (1) (2) (3) (4) (5) (6) (7) (8)
H. Connection year ≥ 2012
2008-11 0.039 0.33 257 0.14 0.001 0.74 257 0.10
2009-11 0.032 0.32 292 0.13 -0.002 0.49 292 0.10
2010-11 0.03 0.27 328 0.12 0.001 0.82 328 0.13
I. Connection year ≥ 2013
2009-12 -0.083 0.16 218 0.17 -0.004 0.47 218 0.21
2010-12 -0.032 0.55 250 0.20 0.006 0.25 250 0.2
2011-12 -0.015 0.70 283 0.13 0.001 0.80 283 0.16
J. Connection year ≥ 2014
2010-13 0.112 0.22 185 0.26 0.018 0.04 185 0.22
2011-13 0.044 0.54 211 0.20 0.008 0.27 211 0.22
2012-13 0.002 0.98 242 0.13 0.004 0.49 242 0.17
K. Connection year ≥ 2015
2011-14 0.592 0.36 98 0.41 -0.071 0.11 98 0.44
2012-14 0.232 0.51 117 0.37 -0.005 0.88 117 0.27
2013-14 0.302 0.34 126 0.28 -0.015 0.67 126 0.30
Notes: In columns 1 to 4, the dependent variable is the change in the number of KCSE examinees overthe pre-period. In columns 5 to 8, the dependent variable is the change in the standardized KCSE Englishscore over the pre-period. In each panel, the sample is restricted to all schools that were electrified duringand after the specified year. Each row presents the results of the two regressions in which the dependentvariable is regressed on the electrification ordering.
22

Table 3: Characteristics of allocation letters exchanged between REA andMembers of Parliament
A. Total Number of Facilities
Sample Other Total
Total 468 2734 3202
Markets 153 998 1151
Secondary Schools 126 524 650
Primary Schools 69 334 403
Health Centers 53 303 356
Water Points 9 137 146
Other 58 438 496
“Sample” includes all facilities located in Bungoma, Busia, Kakamega, Siaya, andVihiga. “Other” includes facilities located in all other counties.
B. Letters sent by the Rural Electrification Authority and Members of Parliament
By REA By MPs Total
Total 320 191 511
Bungoma 8 7 15
Busia 7 6 13
Kakamega 15 9 24
Siaya 10 5 15
Vihiga 6 5 11
Other 274 159 433
23
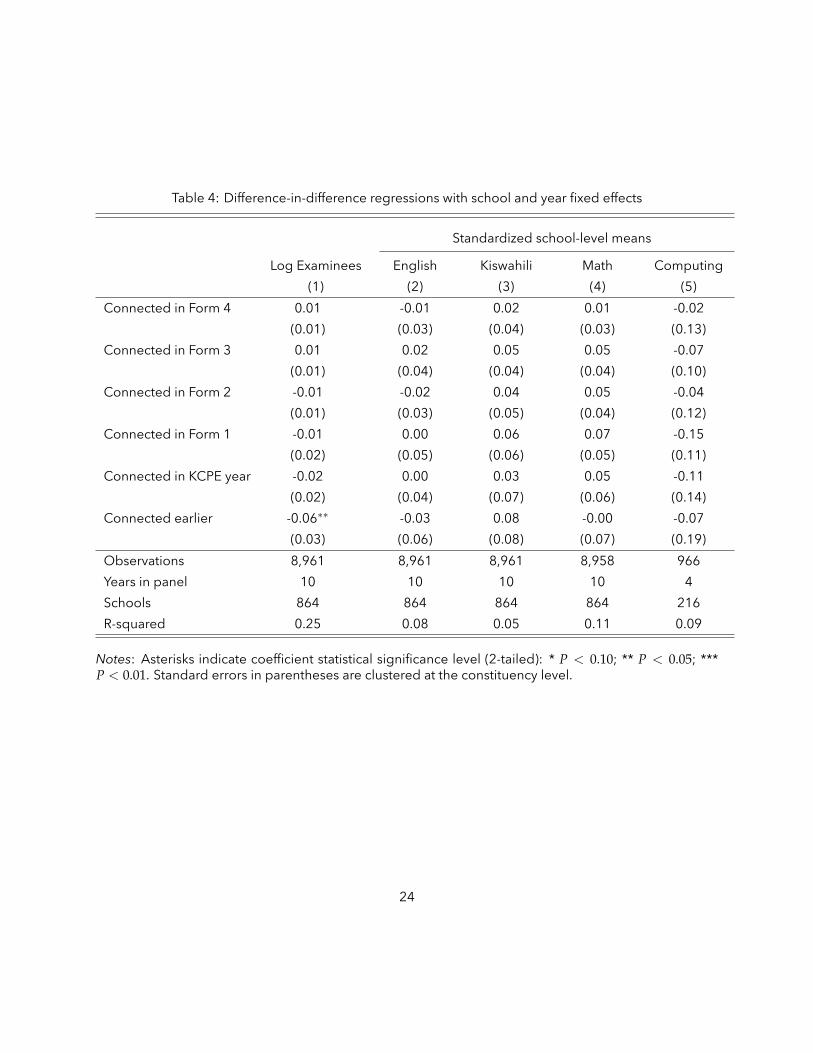
Table 4: Difference-in-difference regressions with school and year fixed effects
Standardized school-level means
Log Examinees English Kiswahili Math Computing
(1) (2) (3) (4) (5)
Connected in Form 4 0.01 -0.01 0.02 0.01 -0.02
(0.01) (0.03) (0.04) (0.03) (0.13)
Connected in Form 3 0.01 0.02 0.05 0.05 -0.07
(0.01) (0.04) (0.04) (0.04) (0.10)
Connected in Form 2 -0.01 -0.02 0.04 0.05 -0.04
(0.01) (0.03) (0.05) (0.04) (0.12)
Connected in Form 1 -0.01 0.00 0.06 0.07 -0.15
(0.02) (0.05) (0.06) (0.05) (0.11)
Connected in KCPE year -0.02 0.00 0.03 0.05 -0.11
(0.02) (0.04) (0.07) (0.06) (0.14)
Connected earlier -0.06∗∗ -0.03 0.08 -0.00 -0.07
(0.03) (0.06) (0.08) (0.07) (0.19)
Observations 8,961 8,961 8,961 8,958 966
Years in panel 10 10 10 10 4
Schools 864 864 864 864 216
R-squared 0.25 0.08 0.05 0.11 0.09
Notes: Asterisks indicate coefficient statistical significance level (2-tailed): * P < 0.10; ** P < 0.05; ***P < 0.01. Standard errors in parentheses are clustered at the constituency level.
24
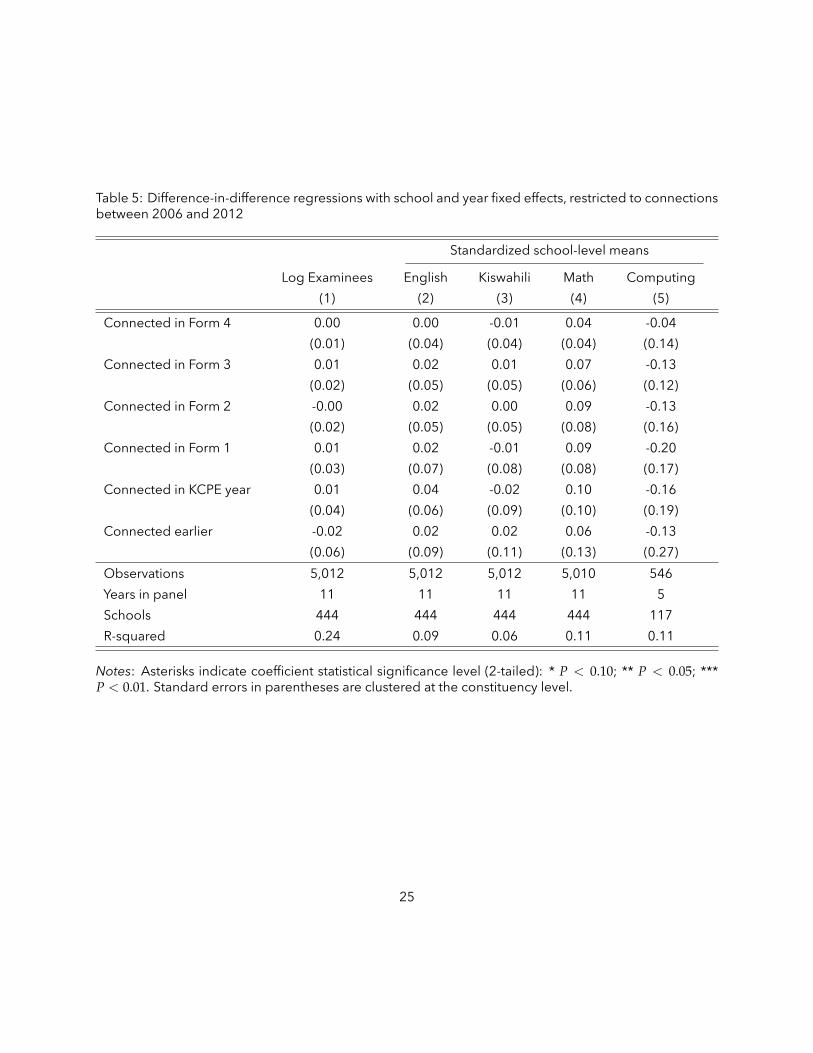
Table 5: Difference-in-difference regressions with school and year fixed effects, restricted to connectionsbetween 2006 and 2012
Standardized school-level means
Log Examinees English Kiswahili Math Computing
(1) (2) (3) (4) (5)
Connected in Form 4 0.00 0.00 -0.01 0.04 -0.04
(0.01) (0.04) (0.04) (0.04) (0.14)
Connected in Form 3 0.01 0.02 0.01 0.07 -0.13
(0.02) (0.05) (0.05) (0.06) (0.12)
Connected in Form 2 -0.00 0.02 0.00 0.09 -0.13
(0.02) (0.05) (0.05) (0.08) (0.16)
Connected in Form 1 0.01 0.02 -0.01 0.09 -0.20
(0.03) (0.07) (0.08) (0.08) (0.17)
Connected in KCPE year 0.01 0.04 -0.02 0.10 -0.16
(0.04) (0.06) (0.09) (0.10) (0.19)
Connected earlier -0.02 0.02 0.02 0.06 -0.13
(0.06) (0.09) (0.11) (0.13) (0.27)
Observations 5,012 5,012 5,012 5,010 546
Years in panel 11 11 11 11 5
Schools 444 444 444 444 117
R-squared 0.24 0.09 0.06 0.11 0.11
Notes: Asterisks indicate coefficient statistical significance level (2-tailed): * P < 0.10; ** P < 0.05; ***P < 0.01. Standard errors in parentheses are clustered at the constituency level.
25
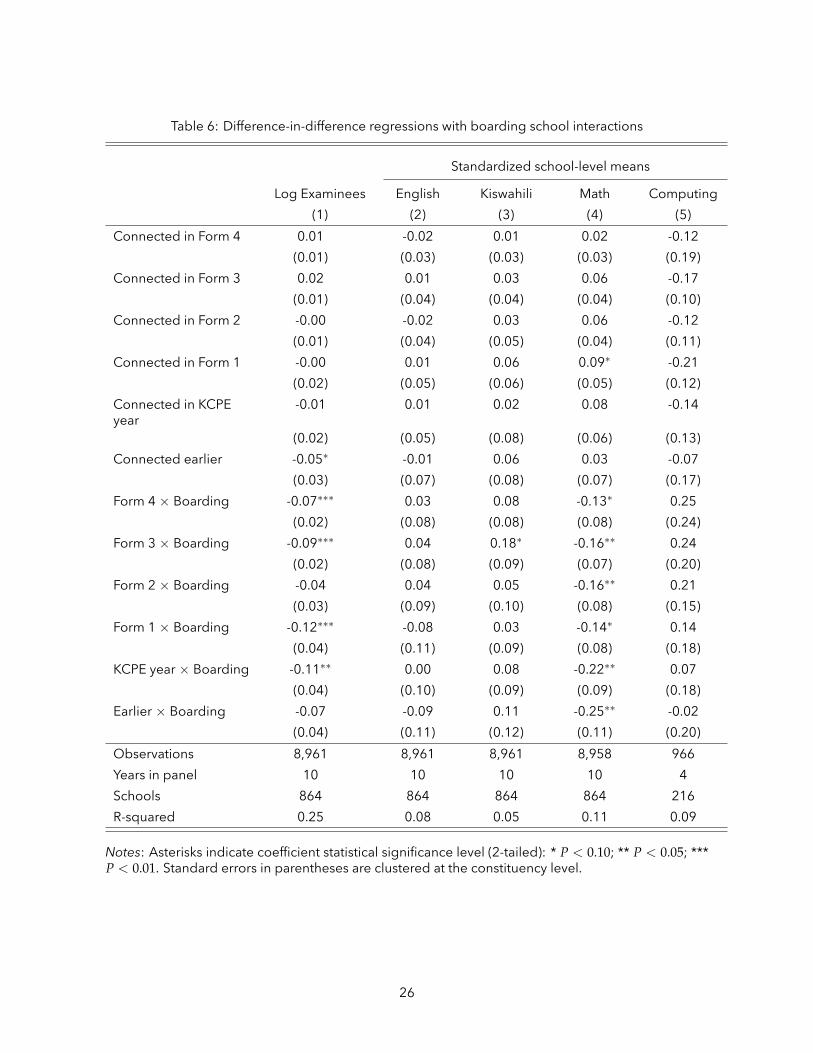
Table 6: Difference-in-difference regressions with boarding school interactions
Standardized school-level means
Log Examinees English Kiswahili Math Computing
(1) (2) (3) (4) (5)
Connected in Form 4 0.01 -0.02 0.01 0.02 -0.12
(0.01) (0.03) (0.03) (0.03) (0.19)
Connected in Form 3 0.02 0.01 0.03 0.06 -0.17
(0.01) (0.04) (0.04) (0.04) (0.10)
Connected in Form 2 -0.00 -0.02 0.03 0.06 -0.12
(0.01) (0.04) (0.05) (0.04) (0.11)
Connected in Form 1 -0.00 0.01 0.06 0.09∗ -0.21
(0.02) (0.05) (0.06) (0.05) (0.12)
Connected in KCPEyear
-0.01 0.01 0.02 0.08 -0.14
(0.02) (0.05) (0.08) (0.06) (0.13)
Connected earlier -0.05∗ -0.01 0.06 0.03 -0.07
(0.03) (0.07) (0.08) (0.07) (0.17)
Form 4 × Boarding -0.07∗∗∗ 0.03 0.08 -0.13∗ 0.25
(0.02) (0.08) (0.08) (0.08) (0.24)
Form 3 × Boarding -0.09∗∗∗ 0.04 0.18∗ -0.16∗∗ 0.24
(0.02) (0.08) (0.09) (0.07) (0.20)
Form 2 × Boarding -0.04 0.04 0.05 -0.16∗∗ 0.21
(0.03) (0.09) (0.10) (0.08) (0.15)
Form 1 × Boarding -0.12∗∗∗ -0.08 0.03 -0.14∗ 0.14
(0.04) (0.11) (0.09) (0.08) (0.18)
KCPE year × Boarding -0.11∗∗ 0.00 0.08 -0.22∗∗ 0.07
(0.04) (0.10) (0.09) (0.09) (0.18)
Earlier × Boarding -0.07 -0.09 0.11 -0.25∗∗ -0.02
(0.04) (0.11) (0.12) (0.11) (0.20)
Observations 8,961 8,961 8,961 8,958 966
Years in panel 10 10 10 10 4
Schools 864 864 864 864 216
R-squared 0.25 0.08 0.05 0.11 0.09
Notes: Asterisks indicate coefficient statistical significance level (2-tailed): * P < 0.10; ** P < 0.05; ***P < 0.01. Standard errors in parentheses are clustered at the constituency level.
26
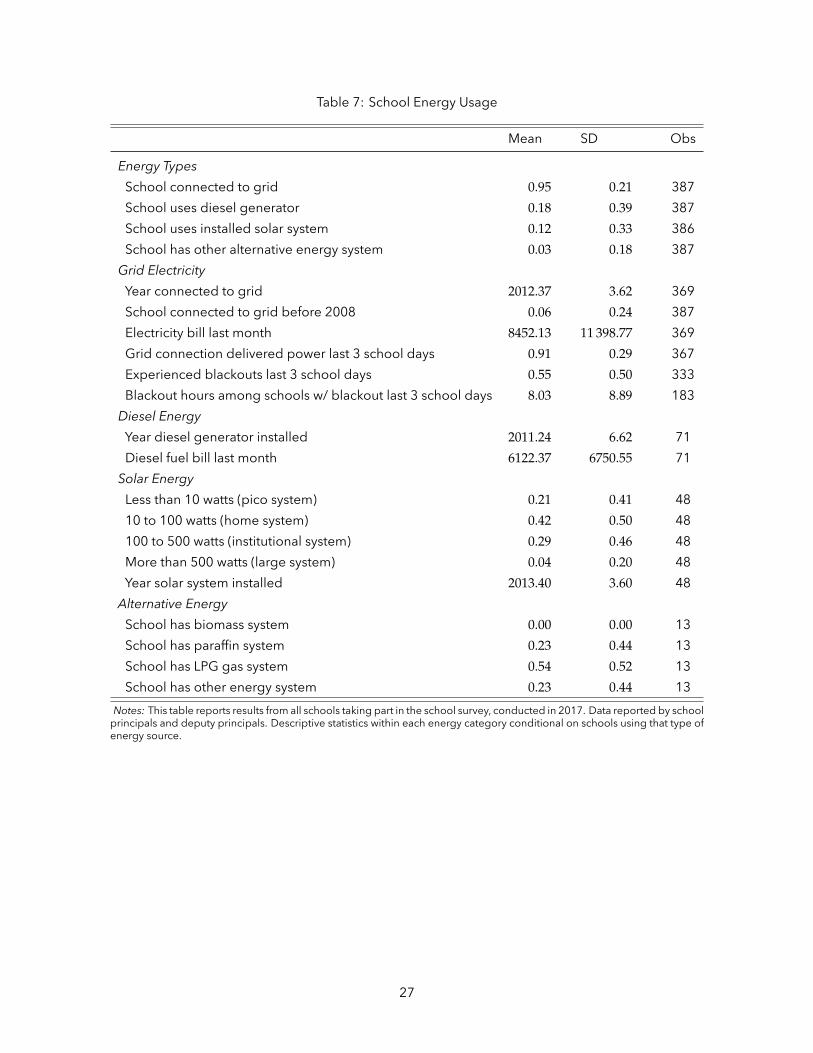
Table 7: School Energy Usage
Mean SD Obs
Energy Types
School connected to grid 0.95 0.21 387
School uses diesel generator 0.18 0.39 387
School uses installed solar system 0.12 0.33 386
School has other alternative energy system 0.03 0.18 387
Grid Electricity
Year connected to grid 2012.37 3.62 369
School connected to grid before 2008 0.06 0.24 387
Electricity bill last month 8452.13 11 398.77 369
Grid connection delivered power last 3 school days 0.91 0.29 367
Experienced blackouts last 3 school days 0.55 0.50 333
Blackout hours among schools w/ blackout last 3 school days 8.03 8.89 183
Diesel Energy
Year diesel generator installed 2011.24 6.62 71
Diesel fuel bill last month 6122.37 6750.55 71
Solar Energy
Less than 10 watts (pico system) 0.21 0.41 48
10 to 100 watts (home system) 0.42 0.50 48
100 to 500 watts (institutional system) 0.29 0.46 48
More than 500 watts (large system) 0.04 0.20 48
Year solar system installed 2013.40 3.60 48
Alternative Energy
School has biomass system 0.00 0.00 13
School has paraffin system 0.23 0.44 13
School has LPG gas system 0.54 0.52 13
School has other energy system 0.23 0.44 13
Notes: This table reports results from all schools taking part in the school survey, conducted in 2017. Data reported by schoolprincipals and deputy principals. Descriptive statistics within each energy category conditional on schools using that type ofenergy source.
27
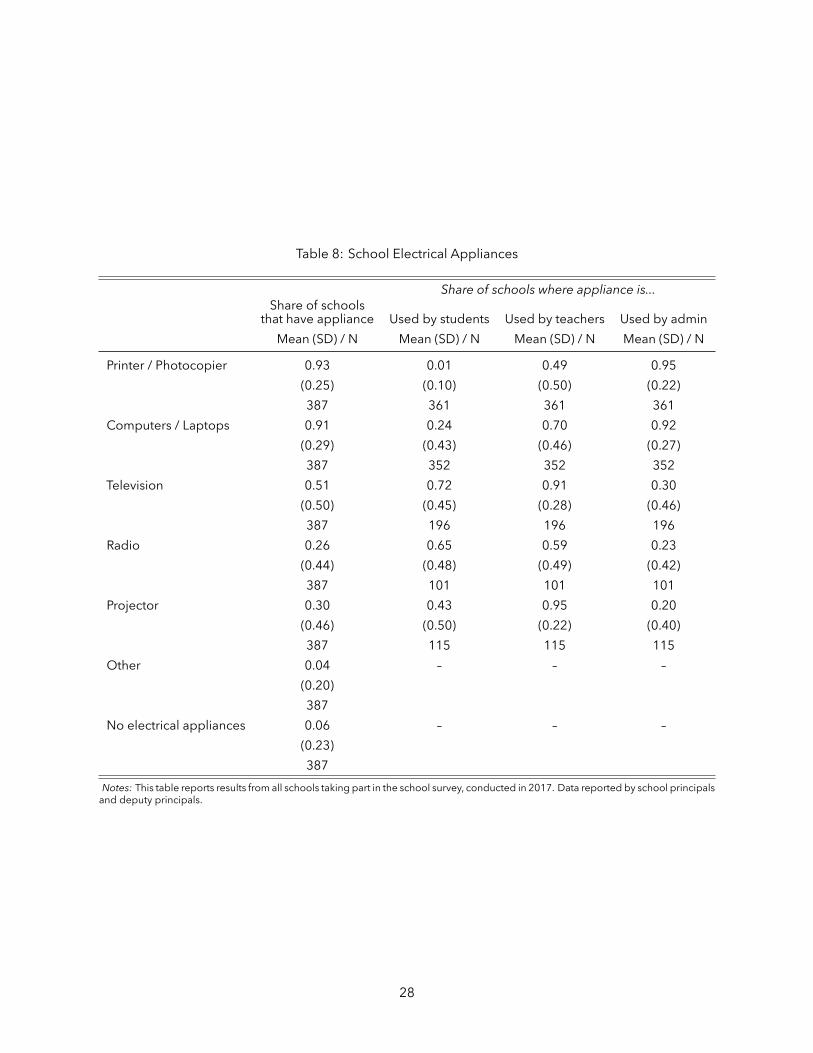
Table 8: School Electrical Appliances
Share of schools where appliance is...Share of schools
that have appliance Used by students Used by teachers Used by admin
Mean (SD) / N Mean (SD) / N Mean (SD) / N Mean (SD) / N
Printer / Photocopier 0.93 0.01 0.49 0.95
(0.25) (0.10) (0.50) (0.22)
387 361 361 361
Computers / Laptops 0.91 0.24 0.70 0.92
(0.29) (0.43) (0.46) (0.27)
387 352 352 352
Television 0.51 0.72 0.91 0.30
(0.50) (0.45) (0.28) (0.46)
387 196 196 196
Radio 0.26 0.65 0.59 0.23
(0.44) (0.48) (0.49) (0.42)
387 101 101 101
Projector 0.30 0.43 0.95 0.20
(0.46) (0.50) (0.22) (0.40)
387 115 115 115
Other 0.04 – – –
(0.20)
387
No electrical appliances 0.06 – – –
(0.23)
387
Notes: This table reports results from all schools taking part in the school survey, conducted in 2017. Data reported by school principalsand deputy principals.
28
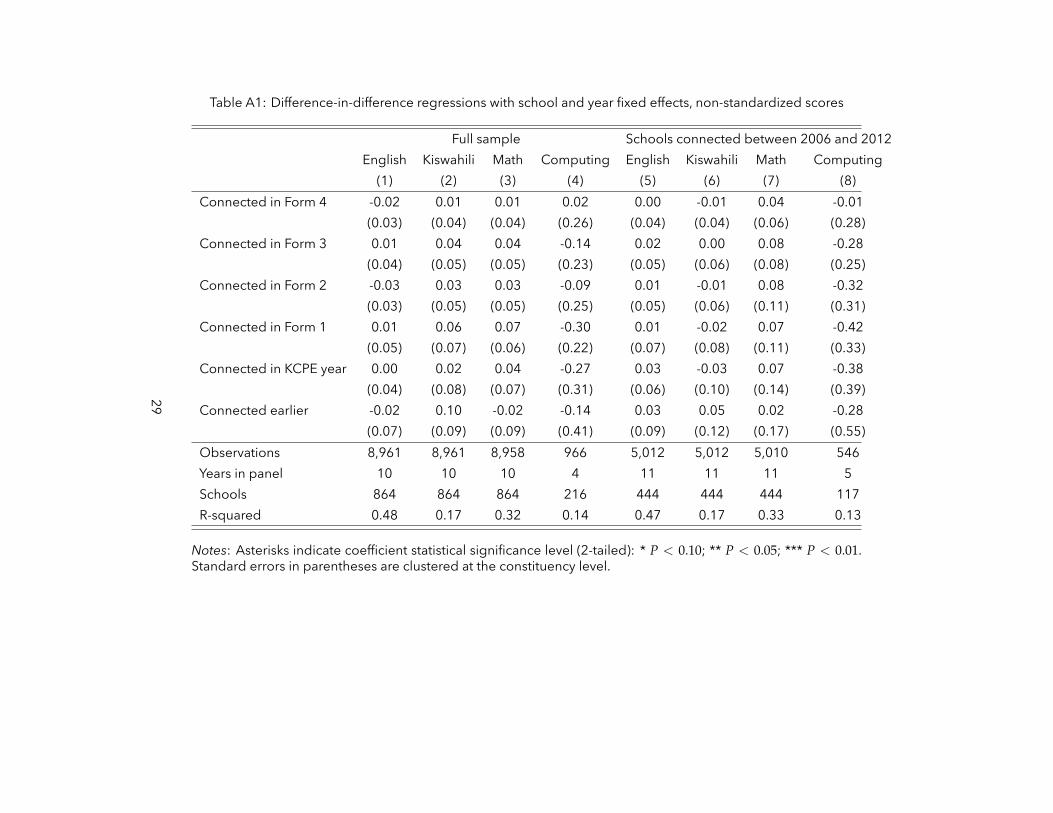
Table A1: Difference-in-difference regressions with school and year fixed effects, non-standardized scores
Full sample Schools connected between 2006 and 2012
English Kiswahili Math Computing English Kiswahili Math Computing
(1) (2) (3) (4) (5) (6) (7) (8)
Connected in Form 4 -0.02 0.01 0.01 0.02 0.00 -0.01 0.04 -0.01
(0.03) (0.04) (0.04) (0.26) (0.04) (0.04) (0.06) (0.28)
Connected in Form 3 0.01 0.04 0.04 -0.14 0.02 0.00 0.08 -0.28
(0.04) (0.05) (0.05) (0.23) (0.05) (0.06) (0.08) (0.25)
Connected in Form 2 -0.03 0.03 0.03 -0.09 0.01 -0.01 0.08 -0.32
(0.03) (0.05) (0.05) (0.25) (0.05) (0.06) (0.11) (0.31)
Connected in Form 1 0.01 0.06 0.07 -0.30 0.01 -0.02 0.07 -0.42
(0.05) (0.07) (0.06) (0.22) (0.07) (0.08) (0.11) (0.33)
Connected in KCPE year 0.00 0.02 0.04 -0.27 0.03 -0.03 0.07 -0.38
(0.04) (0.08) (0.07) (0.31) (0.06) (0.10) (0.14) (0.39)
Connected earlier -0.02 0.10 -0.02 -0.14 0.03 0.05 0.02 -0.28
(0.07) (0.09) (0.09) (0.41) (0.09) (0.12) (0.17) (0.55)
Observations 8,961 8,961 8,958 966 5,012 5,012 5,010 546
Years in panel 10 10 10 4 11 11 11 5
Schools 864 864 864 216 444 444 444 117
R-squared 0.48 0.17 0.32 0.14 0.47 0.17 0.33 0.13
Notes: Asterisks indicate coefficient statistical significance level (2-tailed): * P < 0.10; ** P < 0.05; *** P < 0.01.Standard errors in parentheses are clustered at the constituency level.
29

Table A2: Difference-in-difference regressions with school and year fixed effects, balanced panel
Standardized school-level means
Log Examinees English Kiswahili Math Computing
(1) (2) (3) (4) (5)
Connected in Form 4 -0.01 -0.02 -0.01 -0.04 -0.05
(0.01) (0.04) (0.05) (0.04) (0.13)
Connected in Form 3 -0.01 -0.01 0.05 0.00 -0.04
(0.01) (0.05) (0.05) (0.04) (0.13)
Connected in Form 2 -0.02 -0.04 -0.01 0.01 0.07
(0.02) (0.04) (0.06) (0.04) (0.12)
Connected in Form 1 -0.01 -0.00 0.03 0.05 -0.04
(0.02) (0.05) (0.07) (0.05) (0.12)
Connected in KCPE year -0.03 0.06 0.05 -0.01 -0.08
(0.02) (0.05) (0.09) (0.06) (0.17)
Connected earlier -0.05 0.01 0.09 -0.01 -0.07
(0.03) (0.06) (0.08) (0.07) (0.25)
Observations 4,992 4,992 4,992 4,990 685
Years in panel 16 16 16 16 5
Schools 312 312 312 312 125
R-squared 0.26 0.08 0.05 0.09 0.10
Notes: Asterisks indicate coefficient statistical significance level (2-tailed): * P < 0.10; ** P < 0.05; ***P < 0.01. Standard errors in parentheses are clustered at the constituency level.
30
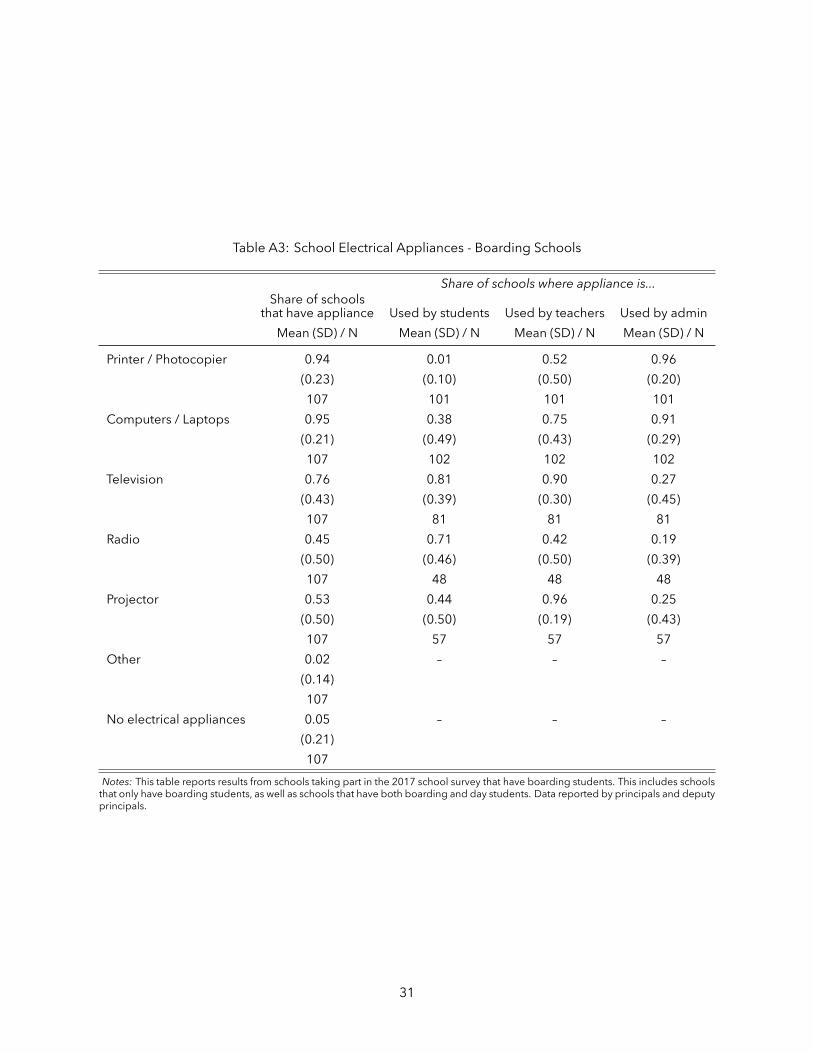
Table A3: School Electrical Appliances - Boarding Schools
Share of schools where appliance is...Share of schools
that have appliance Used by students Used by teachers Used by admin
Mean (SD) / N Mean (SD) / N Mean (SD) / N Mean (SD) / N
Printer / Photocopier 0.94 0.01 0.52 0.96
(0.23) (0.10) (0.50) (0.20)
107 101 101 101
Computers / Laptops 0.95 0.38 0.75 0.91
(0.21) (0.49) (0.43) (0.29)
107 102 102 102
Television 0.76 0.81 0.90 0.27
(0.43) (0.39) (0.30) (0.45)
107 81 81 81
Radio 0.45 0.71 0.42 0.19
(0.50) (0.46) (0.50) (0.39)
107 48 48 48
Projector 0.53 0.44 0.96 0.25
(0.50) (0.50) (0.19) (0.43)
107 57 57 57
Other 0.02 – – –
(0.14)
107
No electrical appliances 0.05 – – –
(0.21)
107
Notes: This table reports results from schools taking part in the 2017 school survey that have boarding students. This includes schoolsthat only have boarding students, as well as schools that have both boarding and day students. Data reported by principals and deputyprincipals.
31