regionality and/or locality - gwdgwebdoc.sub.gwdg.de/ebook/mon/2010/ppn 622991590.pdf ·...
TRANSCRIPT

CENTRE FOR REGIONAL STUDIES OF HUNGARIAN ACADEMY OF SCIENCES
DISCUSSION PAPERS Special
Regionality and/or Locality
East-Central European Regional Seminar Budapest–Gyır–Kecskemét, 4–8 October, 2006
Editor András Donát Kovács
Series editor Zoltán Gál
Pécs 2007
ISSN 0238–2008 ISBN 978 963 9052 83 3
2007 by Centre for Regional Studies of the Hungarian Academy of Sciences Technical editor: Ilona Csapó Printed in Hungary by Sümegi Nyomdaipari, Kereskedelmi és Szolgáltató Ltd., Pécs

CONTENTS
Preface ................................................................................................................................... 5 Foreword .............................................................................................................................. 7
PROCESSES, CHANGES AND CONFLICTS
The dilemmas of creating regions in Eastern and Central Europe Gyula Horváth .............................................................................................................. 13
The development of rural areas in Central Europe – an identification of new processes Jerzy Bański .................................................................................................................. 29
Regional distribution of some demographic and land-use parameters in Bulgaria Boris Kolev – Maria Grozeva ....................................................................................... 38
The demographic crisis in Bulgaria – geographical dimensions Chavdar Mladenov ....................................................................................................... 44
Regional governance in Central European Region: the Centrope case Daniela Coimbra de Souza ........................................................................................... 53
REGIONAL PERSPECTIEVES
Environmental conditions as a driving force of regional development in Poland Marek Degórski ............................................................................................................ 67
Reflections on approaches to (regional) economic development of Slovakia Vladimír Székely ........................................................................................................... 81
External border of the European Union – permeability, co-operation, perspectives Tomasz Komornicki ...................................................................................................... 89
Polish enterprises in transition between state intervention, foreign direct investments and domestic capital Giancarlo Cotella ....................................................................................................... 104
Carpathian Euroregion as an instrument of Ukraine’s eurointegration strategy Svitlana Mytryayeva ................................................................................................... 122
Ukrainian minority in Central and Eastern European countries: ethnic, national or European identity? Anzhelika Klazyner ..................................................................................................... 137

LOCAL COURSES
Traditional industrial areas of large cities in the post-socialist era the case of Budapest and Warsaw Éva Edit Kiss .............................................................................................................. 143
City after transformation in Poland Karolina Rumińska ..................................................................................................... 156
Technical infrastructure in the dwellings in Poland and Hungary at the beginning of the 21st century Konrad Czapiewski ..................................................................................................... 161
Social and economic changes in Blagoevgrad in connection with the integration of Bulgaria’s to EU Aleksandra Ravnachka ............................................................................................... 169
The impact of technical infrastructure on entrepreneurship activity – example of rural areas in Poland Dariusz Świątek .......................................................................................................... 178
Regional problems of scattered farms in the Homokhátság area in Hungary András Donát Kovács ................................................................................................. 187
Country visions in East Central Europe Bálint Csatári ............................................................................................................. 194

PREFACE
Three decades after the 1st Polish–Hungarian Geographical Seminar, Szymbark (Poland) in 1973 – Polish and Hungarian geographers and regional researchers decided to expand their traditional and successful scientific symposium. The Insti-tute of Geography and Spatial Organization, Polish Academy of Sciences was the host of the 1st and 2nd Warsaw Regional Forum in 2004 and 2005. Those scientific conferences built upon contacts between regional representatives of regional stud-ies from Central and Eastern Europe. Continuation of co-operation between re-searchers, aiming to expand the XVth Polish–Hungarian Geographical Seminar, and to support the initiative of Warsaw Regional Forums, the Centre for Regional Studies, Hungarian Academy of Sciences and the Geographical Research Institute, Hungarian Academy of Sciences decided to organise East-Central European Re-gional Seminar 2006.
The participants were: The Polish delegation of six researchers, working for the Institute of Geography and Spatial Organization Polish Academy of Sciences (Assoc. Prof. Marek Degórski, Assoc. Prof. Jerzy Banski, Assoc. Prof. Tomasz Komornicki, Karolina Rumińska M.Sc., Dariusz Świątek M.Sc., Konrad Czapiewski M.Sc.) The Bulgarian delegation of four researchers, working for Bul-garian Academy of Sciences (A/Prof. Boris Kolev, A/Prof. Chavdar Mladenov, Maria Grozeva, Aleksandra Ravnachka). The Ukrainian delegation of two re-searchers, working for Regional Branch of the National Institute for Strategic Studies (Dr. Svitlana Mytryayeva and Anzhelika Klayzner). The Slovakian delega-tion of two researchers, working for Slovakian Academy of Sciences (Dr. Daniel Michniak and Dr. Vladimír Székely). Together with Prof. József Benedek from Babeş-Bolyai University – Romania, Daniela Coimbra de Souza – Vienna University of Economics and Business Administration and Arch. Giancarlo Cotella from Politecnico di Torino – Italy. The Hungarian delegation of researchers, working for HAS Geographical Research Institute (Prof. Zoltán Kovács and Dr. Éva Edit Kiss), and HAS Centre for Regional Studies (Prof. Dr. Gyula Horváth, Prof Dr. János Rechnitzer, Prof Dr. Irén Kukorelli, Dr. Judit Timár, Dr. Erika Nagy Dr. Bálint Csatári, András Donát Kovács M.Sc.).
The general topics of the seminar were the spatial, regional and local issues and conflicts of East-Central European regions, the complex problems of border-lands, urban areas and rural peripheries, analysis and comparison of regional and local processes.
BÁLINT CSATÁRI 6
We hope that it was a really valuable scientific workshop with discussions and colourful excursions in different hungarian places. The three-day professional pro-gram was completed by two study-trip from Budapest to Gyır and from Gyır to Kecskemét.
For us the seminar was continuation of friendship and the collegial togetherness also. At the beginning of the first plenary session we remembered one of our memorable polish colleagues – Marek.
This volume includes 18 studies – published with the hope that it can promote a better understanding of phenomena and processes of regionality and locality in urban and rural spaces, identification of euro-regions and new cross-border rela-tions and connections and the impact of regionalisation on socio-economic and environmental development in East-Central-European countries.
Kecskemét, September 2007
Bálint Csatári
Director of Great Plain Research Institute

FOREWORD
The bi-lateral geographical seminars had initiated by Polish geographers after World War II. The seminars gave an excellent and practically the only opportunity to develop personal contacts and to discuss new trends and methods of geography with Western colleagues. In 1959, I spent 4 months at the Institute of Geography, Polish Academy of Sciences, and I learned a lot there professionally – and also about the mechanism of contact-building across the rather closed Iron Curtain. Let me mention here the name of the late Professor Leszczycki and Kostrowicki, who helped me enormously during my international scientific career.
Following the Polish experiences, I succeeded to organize French–Hungarian (1962), then British–Hungarian, Polish–Hungarian and US–Hungarian Geographi-cal seminars. In 1971, the International Geographic Union organized its very first regional conference (on the geography in Europe) in Budapest – when Prof. Leszczycki was the president of the IGU and myself headed the Hungarian Na-tional Committee of the IGU.
Now, the world is open for the present generation. There are many opportunities to develop international relations, to develop multinational projects, to carry out researches abroad. The bi-lateral seminars are over – except the Polish–Hungarian one. Today, we start the XV. Polish–Hungarian Seminar, what we enlarged and transformed into an East-Central European Regional Seminar – as a follow up of the Warsaw Regional Forum.
But one could question: what are the reasons for a regional cooperation and ex-change of ideas besides the great number of other opportunities? I have four re-sponses for such a question.
The first aim may be to test and – if necessary – to modify regional models and methods what are generally used in regional researches. These models were for-mulated mostly in the most developed countries (first of all in the US and UK), based on the socio-economic processes of these leading economies. It is well known that East Central European regional processes show a lot of special peculi-arities, not only because of the consequences of communist period and the paths of transition but even of a longer period of history. I feel that, in the excitement of many new phenomena, the theoretical researches have been somewhat neglected in our region although our experiences may be useful for the whole emerging econo-mies’ world.
The second reason for such a seminar that it could contribute to our competi-tiveness in a globalizing world, may contribute to transnational regional develop-

GYÖRGY ENYEDI 8
ment plans, to a co-ordinated application of the geographical knowledge in regional policies. “Catching up with the West” has been a century-old desire in our coun-tries. Now we have a unique opportunity to reach this aim within a few decades – but it wouldn’t mean at all a simply copying of Western regional processes. Re-gional development processes – like economic rise and decline of regions, the for-mation of settlement network, etc. – have of a long-term character, consequently we should transform and modernise our – somewhat traditional – East-Central European regional structure.
The final result will be necessarily different than the northern or western European development – what is evident, it is a part of the European diversity. The differences are not the simple consequences of the 45 years of Communist rule, but they express partly the continuation of those endemic processes, which evolved before World War II, during the whole modernisation era of East-Central Europe. These processes didn’t disappear entirely, just they became deep-frozen during the state socialist period, they were conserved in traditional value judgements (e.g. in the symbolic values of the city centres), in the social memory and they resurfaced during the transition. It is our evident duty to analyse and to define these specific East-Central European features.
My third answer is that our cooperation may contribute to insert between global and local the transnational macro-region, as a possible territorial framework for regional development. Whereas the small-scale transborder cooperation are quite successful in many cases, there are very few serious attempts to prepare develop-ment schemes of larger regional units, like the Carpathian Region, or the Central Danube Valley. It’d be desirable if joint researches would explore the opportunities of the potential of large-scale regional development within East-Central Europe. It is evident, that empirical studies are generally limited on the regional processes within a single country, but we shouldn’t neglect the thinking in larger territorial frame, to set up programs for diminishing regional differences within East Central Europe (and not just within the countries), and for a better use of the economy of scale and the potential of a cultural network offered by a larger transnational re-gion. We should not start with too ambitious government programs, rather to offer opportunities to local small and medium-sized enterprises, civil associations, em-ployment in tourist and cultural industries, etc. The mutual economic interest gives a stronger cohesion than political slogans.
My favourite example is the Regio Basiliensis, the transnational region in the lower Rhine Valley, with Basel as a center, covering Swiss, German and French territories. This region started the transnational cooperation more than forty years ago, on the basis of business cooperation. The official – government – approval came much later. Besides the economic advantages, this cooperation contributed to the diminishment of the traditional French-German animosities. This outcome may

FOREWORD 9
be the fourth reason of the East-Central European cooperation in regional re-searches: to contribute – modestly – to a better understanding and to diminish ani-mosities among the different nations of East Central Europe. Budapest, October 2006
György Enyedi Full member of Hungarian Academy of Sciences
Section of Economics and Law

GYÖRGY ENYEDI 10

PROCESSES, CHANGES
AND CONFLICTS

GYÖRGY ENYEDI 12

THE DILEMMAS OF CREATING REGIONS IN EASTERN AND CENTRAL EUROPE
GYULA HORVÁTH
Introduction
Regionalism, the regional decentralisation of power and the distribution of labour among the different forms of local government have found themselves in the cross-fire of debate in the unitary states of Eastern and Central Europe. The change of the political system, the process of connecting to the globalising European economy, the construction of a local governmental structure using the concepts of civic de-mocracy, all shed new light on the mutual connections of central and regional local power, the harmonisation of settlement independence and meso-level public ad-ministration functions. In almost all of the former socialist countries the central issue became that of the economic, political and functional transformation of the basic levels of local government. The earlier sub-national levels disappeared (as in the successor states of the old Czechoslovakia), their functions to a large extent decreased (as in Hungary), changed (as in Poland), or, alternatively, new regional meso-levels were created (as in Croatia) or are being created (as in Slovenia).
The construction of regions in the countries of Eastern and Central Europe be-came one of the important debate topics for preparation for EU membership. How-ever, the application of EU structural policy relates to appropriate size in terms of the population potential of sub-national development units and their economic ca-pacities, in view of the concepts of economies of scale, and so, during the prepara-tion of the EU pre-accession programmes, planning-statistical regions had to be created in all countries. From a formal point of view, solving this task did not cre-ate any particular problem. The government of each country listed the regional public administration units as meso-level development regions, and, on the basis of EU recommendations, the formal organisational structures (regional development councils, development directorates and agencies) were also created.
In parallel with the creation of the organisational framework of an EU-compati-ble development policy, there started, in most countries, an intensive debate on issues of content. In these debates, numerous issues (which had earlier received less attention among the topics relating to the change of regime) were raised: What functions should the development regions have? How can they become public ad-ministration units serving the decentralisation of the centralised state system? What

GYULA HORVÁTH 14
resources should they have to fulfil the development programmes? Which city in the region should become the regional centre?
EU accession opened up a Pandora’s Box in the countries of Eastern and Cen-tral Europe. The fundamental issue of how unitarily structured states can be set on a decentralised path became the centre of debate. This present study searches for an explanation of the reasons for the difficulties of Eastern and Central Europe in regional construction; it summarises the administrative and political development pre-requisites of the transition to a regional outline of the possible advantages of a regional institutional system in the creation of the Cohesion Policy ensuring a de-crease in regional differences.
The formal change in regional administration
The new nation-states in Eastern and Central Europe established in the aftermath of World War I had to face – from the point of view of their future regional develop-ment – two difficulties. One of the issues to be addressed was how to create a uni-fied structure for those (new) parts of the country, which earlier had been devel-oped in different economic areas, in order to link their infra-structural systems. The other was to create a new system of regional organisation of central government power. The heavily centralised state powers created their own regional bodies partly on their former administration basis, but completing those tasks needed to create the new, unified state territory was most effectively assisted by the low number of administrative units involved. Following World War II (WWII), the Soviet-style regional administration was organised differently – now based upon different power considerations. The Communist states, in accordance with their political interests, heavily changed the countries’ regional administration on several occasions, sometimes organising smaller regional units and sometimes larger. Hungary can be considered as an exception to this, in that, in the 20th century (apart from some under-populated counties being combined) the number of sub-national units in the country has not changed (Table 1)
In Eastern and Central Europe a hierarchical planning organisational system – with a fairly powerful central planning office at the top in each country – had pre-viously been the decisive organisational form of regional development. Regional development based on central large-scale investment and state social policy did not require a multi-participant institutional system operating in horizontal co-operation, and the state’s interest in re-distribution, together with the central will, were carried out most effectively by vertically subordinated organisations. This philosophy of state organisation also defined the regional administration system.
Following the change of regime, the organisational framework of Eastern and Central European states underwent important conceptual changes. A local govern-

THE DILEMMAS OF CREATING REGIONS IN EASTERN AND CENTRAL EUROPE 15
ment structure has replaced the hierarchical, executive council system, and the related legislation has created the constitutional basis for a decentralised exercise of power. By now, in fact, local authorities have been equipped with constitutional guarantees of their organisational and decision-making independence, and very significant changes have been introduced into local government financing. In for-mal terms, public administration in Romania and Hungary has remained un-changed, although in Bulgaria the previous multi-county system was restored. At the same time, both the Czech Republic and Slovakia (as in the period between 1949 and 1960) created counties relatively small in size. Only Poland established large-size “voivod-ships” and here the reform of the country’s public administra-tion has been an important milestone in the process of preparing for EU accession.
Table 1 Changes in the number of regional administrative units
in Eastern and Central European countries
Country Pre-WW II 1950s 1960s 1970s 1980s 2005
Bulgaria 9 13 28 28 9 281999
Czech Republic 2 13 8 8 8 142001
Hungary 25 20 20 20 20 20 Poland 14 22 22 49 49 161999
Romania 9 18 18 40 41 42 Slovakia 2 6 4 4 4 81996
Source: The author’s own chart.
It is, therefore, quite evident that the question of the public administration units (meso-level) positioned between central government and the settlements will con-tinue to be an open issue – and extremely important from the point of view of re-gional policy. It is, in fact, a general phenomenon in Eastern and Central Europe that these levels – as a reaction to the negative role, which they mainly played un-der the previous system and their extremely strong political and redistributive functions – have very few local administration rights.
The development statistical regions
A pre-requisite for Eastern and Central European countries to join the EU or to benefit from support from the Structural Funds was the creation of large regions (NUTS 2 units): on this basis the most effective development concepts, and the programmes serving their realisation, could best be drawn up. The 206 NUTS 2

GYULA HORVÁTH 16
regions established in the 15 member-states of the EU are very different from the point of view of their public law and administration situation – and their physical size and population numbers. Basically, we are looking at units nationally deter-mined, in which, at the same time as the NUTS 2 system of each country should meet common requirements, they operate as statistical (calculating, analysing, planning, programming, coordinating) and developing (support policy, decentral-ising) units. In the 10 associated East European countries the number of meso-level administration units at the end of 1999 was 357, and it was clear that the EU’s sup-port policy could not supervise such a high number of regional units. In conse-quence, it became essential to create larger regional development and statistical units.
Defining boundaries within the NUTS system is, from the EU’s point of view, an internal affair – which means that, apart from size, there are no absolute EU requirements in terms of the creation of the regions: the decision lies within the scope of national governments. However, on the basis of experience with creating regions, the various concepts and likely impacts can be expressed in a way, which makes the definition of the region relatively straightforward:
− a prehistory of regional cooperation and, hence, the chances of regional cohe-sion,
− relative size status from the point of view of the national regional structure, − relative spatial homogeneity in terms of the basic aims of regional policy − an effective internal structure (centre, sub-centres, skills and the ability to
cooperate etc) of a region and the observance of public administration bor-ders,
− the existing (or demanded) “geo-political” similarity of the units united in a region and the degree of identity of the definitive, long-term, international orientations,
− the costs of creating and operating the regions (decision-preparing, decision-making and professional administrative background institutions, organising the information, planning, managing and monitoring activities, the institu-tional system of decentralised financing etc), the economies of scale from a functional point of view,
− the existence of a multi-functional, major urban regional centre.
The NUTS 2 regions are listed in the Regional Development Acts or Govern-ment Decrees of each country. However, the Regional Development Act adopted in Hungary in 1996 was quite cautious, indicating merely that the counties could create regions in order to carry out common tasks. It did not, however, define the development regions of the country; and this imprecise regulation had, as a conse-quence, the fact that counties joined together widely differing regions purely for fund-raising purposes – and there were counties which participated in three or four

THE DILEMMAS OF CREATING REGIONS IN EASTERN AND CENTRAL EUROPE 17
regional alliances However, the Amendment to the Act in 1999 defined seven de-velopment statistical regions and separated the counties into regions. In fact, a Government Decree listing, in an itemised form, the theoretical concepts defining development regions was created only in Bulgaria (Geshev, 2000). The Bulgarian Government defined the aspects of the creation of the regions in 1999 as follows:
− The number of regions should be relatively low and they should be defined on the basis of their size and natural resource potential; their economic and social capacities should be able to undertake large-scale programmes;
− The regions should not be too large to be manageable, and the number of counties comprising a region should be optimal in order to be able to be or-ganise their cooperation;
− There should be a common development problem in the region which could be felt in any point of the region and which motivates the regional develop-ment actors to cooperate;
− Natural geographical units and historical traditions should be taken into consideration;
− The region should have a relatively developed urban network and several growth-poles;
− The planning region should comprise complete public administration units.
In the other countries, and after long debate, a compromise decision was reached in terms of the creation of NUTS 2 regions, and these (more or less) matched the above basic concepts. As regards size, they parallel very closely the average of the older EU member-states (Table 2). Individual countries, however, did not come to define their central regions in the same way. In Bulgaria, Poland, Hungary and Romania, for example, the capitals, together with their surrounding “Greater” regions, made up one NUTS 2 unit, whilst, in the Czech Republic and Slovakia, the capitals alone constitute one single region. Since there is also visible in Eastern and Central Europe that general pattern of spatial economy in which the larger region surrounding a country’s most developed growth pole can show weaker performance (a consequence of the “filtering-down” effect), this solution generated strong debate in Hungary. The overall performance of the Central Hun-gary Region (due to Budapest’s high GDP per capita) is as much as 98% of the average of the EU–15 and cannot, therefore, be included in the target group for convergence. Support, therefore, will be more modest. (Budapest itself produces 125% of the EU average, whilst the region’s remaining unit, Pest County, produced just 53% in 2003). Similar problems can be noted in the other three countries also.

GYULA HORVÁTH 18
Table 2
The most significant data of NUTS 2 units in Eastern and Central Europe
Country NUTS 2 Regions
Number Average area (‘000 km2)
Average population (‘000s)
Bulgaria 6 18.5 1,407 Czech Republic 8 9.9 1,290 Hungary 7 13.3 1,463 Poland 16 19.5 2,411 Romania 8 29.8 2,851 Slovakia 4 12.2 1,319 ECE 49 14.7 1,910 EU15 206 15.3 1,830
Source: The author’s own calculations on the basis of Regions. Statistical Yearbook 2004.
The dilemma of the regional centres
Those larger towns or cities can be called regional centres, which, on the basis of their size and geographical location, fulfil the role of administrative, industrial and transport centre of a large area which is home to between one and three million inhabitants. These stand out from their surroundings and enjoy a higher proportion of the resources of their region than would be justified by their population.
Due to the influence of urban development processes, the regional centres of Western Europe built up their position over centuries, and their functional accu-mulation of wealth and growth of resources are closely connected with their region. In their development, the restructuring of the economy and the quality change in their transport and service sectors also played a major role. The settling and gradual expansion of the leading positions of central and local government administration, naturally, played their part also, in that more favourable conditions were created in these cities to enable them to accept the new economic growth-driving forces – although, in the development of their performance capacity, administrative factors can only be seen as secondary resources. Their dynamism was basically generated by the role of industry and services affecting both their regional and their wider markets. It is, therefore, no accident that, when the institutionalisation of regional-ism – in particular countries in different development phases – led to changes in public administration, the choice of headquarters for a region seemed quite obvious in each West European country: the largest city, the richest in functional terms, the most outstanding in economic potential became the centre of public administration for the region.

THE DILEMMAS OF CREATING REGIONS IN EASTERN AND CENTRAL EUROPE 19
In many countries the decentralising trends of national regional policies, and especially the growth-pole concepts, played an important role in the development of the regional centres. The essence of the use of the growth-pole strategy was that those innovations given regional development support were directed only to a lim-ited number of locations (mainly as a part of the planned concept targeting the modification of the regional spatial structure), attempting to support economic activity to raise the level of welfare within the region. The creation of the growth-pole was, first of all, motivated by complex industrial development, by the domi-nant new (or modernised) economic sectors and developed services. Using the principles of the French spatial economics school in economic policy resulted in an essential strengthening of connections in the economic space among companies and sectors.
Paralleling the clear results achieved in the development of those major urban centres, which are treated as poles, the consequences in terms of the effect as ex-perienced on regional transformation are less favourable. It is not in every country that growth-poles have been developed as the driving forces of regional develop-ment, and especially in those countries where the spatial-political, politico-eco-nomic and the political strategies involved in public administration could not be framed within a unified system, the results of the use of this paradigm are spoken of with some scepticism. The elaboration and fulfilment of their (incomplete) poli-cies were not embedded in a unified decentralised concept, but appeared as sepa-rate, disjointed steps or attempts to reform, and they were ineffective – especially since the under-performance of the synergies produced some undesired results.
As a consequence of the multi-coloured administrative structure of European countries, we can speak of regional centres in a variety of ways. In countries with a federalised and regionalised system, the public administration centres work at the meso-level as real regional centres, whereas, in decentralised, unitary countries the centres of the NUTS 2 units have more limited (planning and organising) func-tions.
In the development of regional centres in each country many identical and nu-merous specific factors played a role. However, the general trend seems clear, in that, in the great majority of European regions, the largest town or city is the centre of the region. However, as a result of European urbanisation development proc-esses, the density of the large cities in the countries across the continent differs, and the proportion of the population living in towns or cities with more than 100,000 inhabitants varies from country to country. From 8–34% of the population of the EU–15 member states live in cities with populations above 100,000. (In defining the population proportions we did not take the population of capital cities into ac-count) In terms of the number of towns or cities, Germany heads the ranking list. Germany, in fact, has 83 towns exceeding this 100,000 figure; then comes the UK with 65, Spain (55), Italy (49) and France (35). Regarding the proportion of the na-

GYULA HORVÁTH 20
tional population, which this represents, the order is: Spain, Germany, Italy, Swe-den and the Netherlands (Figure 1).
Figure 1 Number of towns or cities with over 100,000 inhabitants in selected European
countries (excluding the capital) and their proportion of the national population, 2004
Source: Author’s own construction based on data from National Statistical Yearbooks
The big city network in Eastern and Central Europe – except for Romania and Poland – is thin (Figure 2). In the whole area, 97 towns or cities are above 100,000 in population terms, and two-thirds of these are found in Poland and Romania. Slovakia has, apart from the capital, a total of one major city. In these two coun-tries the number of regions is much lower than the number of cities but the largest of the latter are evenly distributed over the whole area and can be become potential regional centres. For this reason, therefore, designating a regional centre could be much more convenient. In most of the Eastern and Central European countries the debates over the designation of regional centres became more intensive as the EU Accession process progressed. In Poland, after the introduction of the new “voivod-ship” public administration, the leading major cities became the centres of the new regions. The only exception is the Kujawsko-Pomorske voivod-ship where the regional centre is not Bydgoszcz, the industrial centre with 368,000 inhabitants,

THE DILEMMAS OF CREATING REGIONS IN EASTERN AND CENTRAL EUROPE 21
but Torun, with its historical traditions and a population of 208,000. In the other countries the competition among towns or cities goes on almost exclusively in re-spect of the setting-up of the labour organisations of the development agencies and of changing the number of the NUTS 2 regions. The latter is especially at the cen-tre of debate in Romania. Several cities with traditionally strong regional organis-ing functions in the country, such as Arad, Oradea, Sibiu, and Targa-Mures lost their potential regional centre role. These demand a change of the national regional system. The dissatisfaction in the counties belonging to the planning-statistical regions is shown by the fact that the headquarters of the regional development councils in several cases in Romania were set up in smaller county centres. There were also examples of neglect of the role of the leading cities in Bulgaria. As a result of the public administration reform undertaken in the ‘70s, in which, instead of small spatial units, six large “oblasts” were created, the leading major city was replaced, and a smaller-sized town in the geographical centre of the region became the regional centre.
Figure 2
Number of towns or cities with over 100,000 inhabitants in Eastern and Central European countries (excluding the capital) and their proportion of national
population, 2004
Source: Author’s own construction based on data from National Statistical Yearbooks.

GYULA HORVÁTH 22
Is Eastern and Central Europe unitary or de-centralised?
Should it be thought desirable to give an important future role to the meso-level units in regional policy in Eastern and Central Europe, this would clearly bring the current meso-level system into sharp focus. Both the size and economic potential of the counties in their current form are too small for them to become the basic units of decentralised regional policy, and it is to be expected that, in the future, regionalism will become stronger in more and more countries, and that this will lend weight to the re-defining of the distribution of labour between centre and provinces. There will be a serious opportunity to establish inter-regional coopera-tion operating on the basis of economic conformity and to increase cohesion in Eastern and Central Europe – but, even then, only if the tasks now accumulating (a genuine regional decentralisation of power and the creation of a regional develop-ment strategy conforming to the market economy) could be carried out, would it be possible that regionalism in its West European meaning could take root in this area. Today the driving forces of growth are concentrated in the core areas of individual countries, something which indicates, over the long term, the maintenance of the differences between the national regional units – or even their increase (Table 3).
Table 3 The weight of capital cities in Eastern and Central Europe, 2004,
as percentage of national total
Areas Sofia2002 Prague Budapest Warsaw Bratislava Bucharest2002
GDP 24.6 24.5 35.0 n.a. 24.2 16.5 Industrial output 15.9 13.0 17.6 11.8 37.3 17.0 Foreign capital investment 49.9 25.7 56.5 33.0 71.2 46.7 University student numbers 43.3 31.4 49.2 16.7 83.0 32.4 R&D employees 72.7 48.0 55.8 30.0 40.2 39.0
Source: Author’s own construction based on National Statistical Yearbooks
The changes occurring during the last decade indicate that the political scope of activity within regional policy at the beginning of the new century – over and above the self-determination of economic development – are defined by two major factors: the first of these is the EU’s organisational, operational and financial re-form together with Eastern enlargement, whilst the second (to no small extent in-fluenced by the first) is the establishment of a new distribution of labour within government in the nation states – in other words, decentralisation.
Decentralisation – as proved most clearly by the processes of previous decades – is now regarded in Europe as a perfectly normal phenomenon. In 1950 a quarter
THE DILEMMAS OF CREATING REGIONS IN EASTERN AND CENTRAL EUROPE 23
of the population of the continent lived in federalised or regionalised states, a fig-ure which, by the mid–90s had risen to 60%. By the end of the first decade of the following century – without taking into account the successor states of the former Soviet Union – more than three-quarters of the population of Europe will live in countries where influencing the factors of economic growth, it will not be the state but rather, the sub-national level which will play the defining role. This quantita-tive change – according to our current knowledge – will be the result of the crea-tion of new regional administration in two countries with a high population – the United Kingdom and Poland.
The basic interest of the nation-state in the future will be to try to use its power to determine economic policy within its borders to counter-balance the effects of external pressure from globalisation and integration – by increasing the ability of the regions to defend their interests in a regulated fashion. It is already the case that the traditional regional development practice of Keynesian economic policy cannot be used successfully in the new paradigm, and the state’s regional policy will be substituted by the region’s own policy. This paradigm exchange, however, cannot occur automatically, the interests of the regions being developed to different levels. In the institutionalisation of regionalism important differences are to be seen. The poorest regions can hope for improvement through outside (national and interna-tional) help, as in the past, their motivations depending more on traditional support systems than on what might be gained through the autonomy (in its wider sense) of a “Europe of the Regions”. The devoted fans of regional decentralisation come from the group of developed regions, which will clearly be the beneficiaries of the Single Market and of the Economic and Monetary Union. It is not by chance that, today, Europe’s most efficient regional cooperation network (not even connected territorially) comprises: Baden-Württemberg, Lombardy, Rhône-Alpes, and Cata-lonia, who created a co-operation under the name “Europe’s Four Engines” (Amin-Tomaney, 1995; Spath, 1991).
The general spread of regionalism, however, still faces large barriers, and na-tional governments will continue in the future to play an important role in the con-nections between the regions and the EU Commission. The poorest regions of Europe can realise their interests least of all in the integration decisions, as the poor countries anyway have fewer representatives in the EU bodies. The competition policy of the EU also reinforces the effects of centralisation, and community re-gional policy is less capable of counterbalancing the differences emanating from varying competitive abilities. Federal Germany is the best example of this; the re-gional regionalism and the decrease of spatial differences can also be matched at central government level.
In parallel with the irreversible deepening of European integration, the key po-sitions of the national government are still retained, at least in three areas. One of the most important tasks of the state is to regulate capitalism in public companies,

GYULA HORVÁTH 24
and industrial development, even in the future, cannot be imagined without effec-tive national financial systems, as the safest starting point for corporate strategies will be the domestic market and the regulation environment also. The other impor-tant central government task remains the coordination of national innovation and technical development programmes. Finally, as the third national level priority can be considered to be the labour market and industry-political tasks, success in ful-filling these two latter national functions, however, depends on how effective a part can sub-national public administration play in fulfilling numerous partial tasks. Consequently, regionalisation is at the same time a prerequisite for the successful operation of the nation-state, since macro-political aims cannot be fulfilled without thoughtful human resources, educational training and enterprise development; nor can well-balanced market competition be imagined without the cooperation of the social partners. The solution of these, however, is the most optimal at the level of the regions (Keating-Loughlin, 1997).
In Eastern and Central Europe today the future of the division of power between state and region still seems uncertain. The prospects for decentralisation depend on the success of economic efficiency and the results of the “top-to-bottom” managed change of regime, but the pre-conditions at regional level for setting up power are unfavourable. In the former planned economies, the organisational framework de-riving from strong centralisation has remained, even if the substance of central power has changed a great deal. Even in the most favourable cases, the process of decentralisation can be expected to be a long one.
Three possible ways of decentralisation can be envisaged in Eastern and Cen-tral Europe, and each of these differs from the others in terms of the extent and quality of the division of power. The choice of way, naturally not an arbitrary one, the historical traditions of an individual country, the nature of the economic trans-formation, the establishment of institutions of the market economy, political power relations and the degree of sophistication of the spatial structure all influence the decline of power concentration. The pressure to decentralise which falls on the central state administration is obviously stronger in those countries where the dy-namic, regional major urban centres (for example, in Poland) wish to initiate their autonomous development, their structuring into the European regional division of labour, with the help of the (possibly, most liberalised) utilisation of their internal resources and post-industrial development factors. On the other hand, the legitimi-sation of bottom-up initiatives meets greater resistance in those countries (for ex-ample, in Hungary) where the central regions have a dominant, even a strengthen-ing, position in the factors of production increasing competitiveness. Although the example of these two countries is a good one in demonstrating that the existence of regional centres capable of being made effective is no more than a potential ad-vantage, the “suction effect” towards decentralisation originating from the political legitimacy of Hungarian regional local authorities and the legal regulation of re-
THE DILEMMAS OF CREATING REGIONS IN EASTERN AND CENTRAL EUROPE 25
gional development can somehow counterbalance the lack of strong regional cen-tres of appropriate European size.
In the first possible decentralisation model, the division of labour between cen-tral and regional bodies is organised under clear, precise rules, and the develop-ment tasks for which the two types of body are responsible differ simply in respect of which regional unit these tasks affect. To solve these problems, regional au-thorities even have their own income resources and have wide-ranging rights in respect of planning, and the developments of local authorities which are part of their own circle can be subsidised from these (regional) funds. Depending on the economic development level of the region, “own” and “shared” income can be supplemented by transfers from central government funds. This strategy provides the most comprehensive form of decentralisation, and, in the long-term, this is the most effective solution. However, to create this, numerous – political, constitu-tional, public administrational and economic – pre-conditions are necessary, and, even today, the progress of regional self-government in Eastern and Central Europe does not seem a realistic prospect. Further differentiation in the region will also derive from the fact that Poland and, hopefully, Hungary will take steps along the road to regionalism.
The gist of the second decentralisation strategy model is that only certain func-tions and (planning, development, executive, authorisation and financing) is trans-ferred from the centre to the regions, with the remaining regional, political tasks continuing within the competency of the central government. The expansion of the redistribution of power depends on the tasks, which are to be decentralized, the institutional system, which is to take them over and the tools, which will be at the disposal of the regions. This version is the best in the short-term for those countries with a unitary system, since the preparations for transferring power need less effort, since there is no need for a complete transformation of the public administration system, since the actual influence of the central bodies does not change (which is the most important consideration), and, as the management of regional develop-ment through de-concentrated state organisation will be more complex, perhaps their efficiency will increase.
In the third option, the new division of responsibility between central and re-gional organs is based upon their handling of specific, occasional tasks. They cre-ate a common managing body for developing the peripheral, lagging regions, and the state provides part of its financial resources to this decision-making forum, whilst the execution of the development programmes is delegated to the spatial units. This version represents the weakest version of decentralisation, but, since there is no need to change the established power structure, it is not surprising that most Eastern and Central European countries have started to elaborate their spatial development programmes on this basis. Central governments consider this solution

GYULA HORVÁTH 26
as the easiest way to solve the problem: they do not need to put their hands into a hornet’s nest and the vertical and horizontal power relations remain untouched.
Conclusions
The region is considered to be a spatial unit serving the sustainable growth of the economy and the modernisation of the spatial structure, with independent financial resources, fulfilling autonomous development policy and equipped with local gov-ernment rights. On the basis of this term – whose factors naturally developed dif-ferently in the different periods of European development – regions have not so far existed in Eastern and Central Europe, despite the fact that some geographers (on the basis of the indisputable results obtained by geographic science in regional research) assert that we do possess some well-defined, natural regions. Such “form without content” – as in previous decades – cannot, in itself, steer the spatial structure of the country in a favourable direction, decentralise the new space-forming forces and create the pre-requisites for multi-polar development. The re-gion, if defined as a framework for regional research, is not capable of organising the space-forming powers of the 21st. century without the competencies, institu-tions and tools.
Regions in the new member-states are necessary, since European regional de-velopment clearly proves that a sub-national level comprising approximately 1–2 million inhabitants regulated on the basis of self-government concepts (as a result of the region’s economic capacity and structural abilities) is considered to be:
− the optimal spatial framework for the realisation of regional development policy, oriented towards economic development,
− the appropriate field for the operation of post-industrial spatial organisation forces, and the development of their interrelationships,
− the important area in which to enforce regional and social interests, − the most appropriate size of spatial unit to build a modern infra-structure and
the professional organising-planning-executing institution of regional policy, − the main factor in the decision-making system of the European Union’s Re-
gional and Cohesion policy.
THE DILEMMAS OF CREATING REGIONS IN EASTERN AND CENTRAL EUROPE 27
References
Benedek, J. 2004: Amenajarea teritorului şi dezvoltarea regională. Cluj-Napoca, Editura Presa Universitară Clujaeană.
Blažek, J.–Boeckhout, S. 2000: Regional policy in the Czech Republic and EU accession. – Bachtler, J.–Downes, R.–Gorzelak, G. (Eds.): 301–318. p.
Boev, J. 2002: Bulgaria: decentralization and modernization of public administration. In Péteri, G. (Ed.): Mastering Decentralization and Public Administration Reforms in Central and Eastern Europe. Budapest, Open Society Institute, Local Government and Public Service Reform Initiative. 93–120. p.
Dostál, P. 2000: Reintegrating Central European region: challenges of trans-border spatial development. – Acta Universitatis Carolinae. Geographica. 1. 21–38. p.
Geografija na Balgarija. Fizicheska geografija, socialno-ikonomicheska geografija. Sofia, Izdatelstvo ForKom. 2003.
Geshev, G. (Ed.) 1997: The Geographical Space – an Investment for the 21th Century. Sofia, Institute of Geography, BAS.
Geshev, G. 2001: The role of regions of South-Eastern space in the enlarging European Union. In Gál, Z. (Ed.): Role of the Regions in the Enlarging European Union. Pécs, Centre for Regional Studies, HAS. Discussion Papers, Special Issue. 81–100. p.
Gorzelak, G. 1998: Regional and Local Potential for Transformation in Poland. Warsaw, University of Warsaw.
Green Paper. Regional Development Policy in Romania. Bucharest, Romanian Government and the European Commission. 1997.
Horváth, Gy. 1996: Transition and regionalism in East-Central Europe. Tübingen, Europäischen Zentrum für Föderalismus-Forschung. Occasional Papers, 7.
Horváth, Gy. (Ed.) 2002: Regional Challenges of the Transition in Bulgaria and Hungary. Pécs, Centre for Regional Studies, HAS.
Ianoş, I. 2000b: Romania. In Bachtler, J.–Downes, R.–Gorzelak, G. (Eds.): Transition, Cohesion and Regional Policy in Central and Eastern Europe. Aldershot, Ashgate. 167–176. p.
Ilieva, M. 2002: Transformations in the territorial structure of Bulgarian economy in the 1990s. In Horváth, Gy.(Ed.): 49–61. p.
Illner, M. 2000: Issues of decentralization. Reforms in former communist countries. – Infomationen zur Raumforschung. 7–8. 391–401. p.
Keating, M.–Loughlin, J. (Eds.) 1997: The Political Economy of Regionalism. London, Frank Cass. Kolev, B. 2002: Legal framework of regional development in Bulgaria. In Horváth, Gy. (Ed.): 78–85.
p. Michalski, A.–Saraceno, A. 2000: Regions in Enlarged European Union. Brussels, EC, Forward
Studies Unit. A new partnership for cohesion. Convergence, competitiveness, cooperation. Third report on
economic and social cohesion. Brussels, European Commission. February 2004. Potentials for polycentric development in Europe. Annex Report A. Critical dictionary of
polycentricity European urban networking. Stockholm, Norfic Centre for Spatial Development. August 2004.
Potentials for polycentric development in Europe. Annex Report B. Stockholm, Norfic Centre for Spatial Development. August 2004.
Sekeresová, E. 2004: Institutions of regional policy at the regional level in the Slovak Republic. In Enyedi, Gy.–Tózsa, I. (Eds.): Region. Regional Development Policy, Administration and E-government. Budapest, Akadémiai Kiadó. 342–370. p.

GYULA HORVÁTH 28
Spiridonova, J.–Grigorov, N. 2000: Bulgaria. In Bachtler, J.–Downes, R.–Gorzelak, G. (Eds.): Transition, Cohesion and Regional Policy in Central and Eastern Europe. Aldershot, Ashgate. 71–83. p.
Stasiak, A. 1999: The new administrative division of Poland. – Duró, A. (ed.): Spatial Research in Support of the European Integration. Pécs, Centre for Regional Studies HAS. 31–42. p.
Szreniawski, P. 2004: Regions in Poland. In Enyedi, Gy.–Tózsa, I. (Eds.): Region. Regional Development Policy, Administration and E-government. Budapest, Akadémiai Kiadó. 277–292. p.
Tariska, M. 2004: Regional administration in the Slovak Republic. In Enyedi, Gy.–Tózsa, I. (Eds.): Region. Regional Development Policy, Administration and E-government. Budapest, Akadémiai Kiadó. 310–341. p.

THE DEVELOPMENT OF RURAL AREAS IN CENTRAL EUROPE – AN IDENTIFICATION
OF NEW PROCESSES
JERZY BAŃSKI
While a rural area is quite well understood in everyday language, and is not diffi-cult to describe, the problems become apparent when a more precise definition is sought. When the more complex definitions that scientists might seek to come up with are left aside, practice dictates that use should be made of the ones adopted by the statistical bodies – which are found to confine themselves to simpler criteria. There are attendant consequences: for example, adherence to the typology used in the European Union1 makes it necessary to accept that 96% of Hungarian territory and 91.7% of Poland is rural. It seems to the author that the matter of the delinea-tion of rural areas requires a discussion of its own. However, irrespective of the way rural areas are defined, the status of Central Europe as a weakly urbanized part of the continent persists (Figure 1).
Nevertheless, the last ten and more years have seen these rural areas of Central Europe subjected to a fundamental transformation that has been manifested in a series of new social and economic processes previously unmet with (e.g. a decline in state ownership, privatization, an increase in the significance of local govern-ment, the freeing-up of prices, etc.). The transformations have proceeded via three main stages, of which the first was the move away from the socialist economy and central planning to the free market, the second preparation for EU accession and the third actual membership of the European Union.
Each of these stages released new processes shaping the socioeconomic face of rural areas. At the outset, the most important role was that played by democratic public and economic life, as well as the privatization of state and cooperative as-sets. The period over which accession to the EU was being prepared for in turn brought multifunctional development of rural areas and a decline in the role of agriculture.
1Classification of rural areas according to the OECD typology: predominantly rural area (more than 50% of the area’s population lives in communities whose densities of population are under 150 persons/km2); significantly rural area (15–50%), predominantly urban area (less than 15%).

JERZY BAŃSKI 30
Economic assistance from ”the Fifteen” also allowed for an improvement in the outfitting of rural areas with social and technical infrastructure. The last several years has been a period of major investment, changes in agriculture entailing a strengthening of the economically-strong farms, as well a discounting of EU fund-ing designed to even out differences in levels of development.
The phenomena referred to may be treated as successes, though they were ac-companied by processes with negative dimensions. It is enough to refer to unem-ployment, rural poverty, the marginalization of certain rural areas, etc. However, it would seem that the scale of the successes outweighs those of the failures. The diagnosing of selected processes, and their assessment from the point of view of the development of rural areas is then the main task of this study.
Figure 1 Rural communities in EU
Source: EUROSTAT 2004.

THE DEVELOPMENT OF RURAL AREAS IN CENTRAL EUROPE… 31
The makeovers taking place in rural areas did so – and are doing so – in line with different detailed scenarios, albeit with similar fundamental directions. These are set out in planning and strategic documents making reference to the main as-sumptions underpinning the development of rural areas as contained in EU docu-ments. These first and foremost expounded the need for rural regions lagging be-hind to catch up, and for the living conditions of the rural population to be im-proved. This reflects the fact that changes in the rural areas of Central European countries proceeded in line with similar strategic directions and should achieve comparable results. The theoretical concepts for the development of rural areas contained in documents thus need to be set against their real implementation.
A particular place in planning is taken by the agricultural economy – which is going to be subject to further radical change in the next few years. The results of reforms to the Common Agricultural Policy make it necessary to assume that we will not be obtaining the kind of funding that farmers in Western Europe were able to count on in earlier decades. For this reason, any changes made should also fol-low a different model. For example, where the modernization of agriculture is con-cerned, there should be no blind following of the intensive, industrialized Western model, but rather a move more in the direction of environment-friendly and organic farming. It should also be recalled that agricultural intensification would entail job losses in rural areas – something that would be a very serious problem for Central Europe. These two examples make it clear just how complex the problems placed before development planning in rural areas really are.
The development of rural areas is thus a very broad and multi-dimensional is-sue, which can and should be looked at in terms of its social, economic, political, natural and technical dimensions. Each of these in turn comprises several compo-nent elements (Figure 2).
Each of the five dimensions entails steady transformation under the influence of a complex of phenomena and processes that may be of a social, economic or natu-ral character. Among these are processes stimulating or holding up the develop-ment of rural areas, as well as those having an ambiguous influence where the contemporary and future faces of rural areas are concerned. They also differ in their scope of application, being potentially either processes specific to a local area or global ones extending over the whole of Central Europe.
Work on the subject literature and statistical materials allows for the identifica-tion of several fundamental processes that have either been revealed for the first time or else intensified in the period of the economic transformation of rural areas.
1 The environmental dimension – an improvement in the quality of the natural environment through the development of technical infrastructure and an in-crease in the area of land under protection.

JERZY BAŃSKI 32
2 The social dimension – depopulation of peripheral areas and a concentration of population in the vicinity of the large cities.
3 The economic dimension – privatization of the state agricultural sector, agri-cultural diversification and a weakening of its role in the national economy.
4 The technological dimension – an improvement in the outfitting of house-holds with technical installations.
5 The political dimension – the development of local government.
The principles of sustainable development propounded and extended at the Rio “Earth Summit” in 1992 bore fruit in a new environmental policy in the countries of Central Europe. There has been a raising of the public’s level of environmental awareness, the introduction of more-stringent environmental standards and an in-crease in the amount of land within protected areas. The degree to which rural ar-eas are furnished with technical infrastructure has improved, notably as regards that serving to limit environmental pollution (comprising, for example, local wastewa-ter treatment plants and sewer systems). The result of all these activities has been an overall improvement in the quality of the natural environment.
Figure 2 Dimensions of rural development
Source: G. Heilig, 2002, European Rural Development, IIASA, http://www.iiasa.ac.at/Research/ERD/

THE DEVELOPMENT OF RURAL AREAS IN CENTRAL EUROPE… 33
Nevertheless, it has to be borne in mind that protected areas actually pose prob-lems where economic development is concerned, for it emerges that areas enjoying the different forms of protection are also subject to major attendant limitations when it comes to new investments, the introduction of modern methods and pro-duction technologies into agriculture, and even the running of the economy that had been in place previously. The Polish experience makes clear the general un-willingness of local authorities to adopt plans anticipating inclusion of part of their territory within one or other of the forms of protection.
It is usual for rural areas to be characterized by a negative migration balance. What is worse, those tending to leave are the young and entrepreneurial, the result being a worsening of the age structure of the population, of which an ever-greater proportion is of post-productive age. In general, as compared with Europe as a whole, the Central European states are in a more favourable situation. Neverthe-less, at regional level it is possible to observe a further development of differences in the age structure of the rural population, as well as a slow approach towards the proportions present in the West (Figure 3–4).
A new and interesting phenomenon taking shape is the trend for city-dwellers to relocate to rural areas, albeit ones in the immediate vicinity of the large urban cen-ters. There are thus two directions to the population changes affecting the country-side: while the suburban zone is witnessing a concentration of population, the pe-ripheral regions are continuing with their long-term trend towards depopulation.
The inputs of new population into suburban areas has been accompanied by a dynamic development of housing construction; the intensity of this activity being a function of the size of the urban centre and distance from it. This simple relation-ship is modified by the factor of transport access and quality of the natural envi-ronment, for new building focuses mainly on the main transport arteries and the most attractive areas in terms of landscape. The development and improvement of the communications infrastructure and increase in the number of private cars is ensuring that city folk penetrate ever-larger rural areas. There is also an increased interest in second homes and in recreation in the clean countryside environment. Rural tourism is becoming an ever more important economic function that is stimulating the development of new economic activity in the countryside (espe-cially in services, construction and trade).
While agriculture remains the number-one economic activity in villages, its sig-nificance in the structure of income into farm budgets is declining. The share it takes in gross domestic product is also going down, along with the level of em-ployment.

JERZY BAŃSKI 34
Figure 3
Share of population in post-productive age in Europe on rural areas (2002)
Source: CISCO 2002.

THE DEVELOPMENT OF RURAL AREAS IN CENTRAL EUROPE… 35
Figure 4
Share of population in post-productive age in Poland on rural areas (2004)
Source: own elaboration.
Thus, for example, the share of Hungary’s GDP accounted for by agriculture de-clined in the period 1990–2002 from 12.5 to 3.3%, while the proportion of the country’s labour force working on the land went down from 14.2 to 6.2% (Figure 5). The changes in Poland have been similar, though even now the farm sector continues to give employment to between 16 and 18% of the country’s profession-ally active population.
Among the most important processes to have taken place in the farm economy over the last decade of the 20th century and first years of the 21st is the privatization of the state sector. The countries of Central Europe ended the era of the commu-nist-controlled economy with very diverse ownership structures in agriculture. Collectivization took place in most of the Eastern-Bloc countries. Only in Poland and the former Yugoslavia did agriculture on individually owned forms continue to play a more major role throughout the communist era. The share of agricultural land remaining in private hands in Hungary was also relatively high.
The onset of the 1990s brought radical changes in the ownership structure of land in most of the Central European countries, though these took a variety of dif-ferent routes. In Hungary, the change was major. The amount of land utilized by the private sector increased from 14% of the total in 1990 to 54% in 2000. There

JERZY BAŃSKI 36
was an attendant process of the fragmentation of farms, whereby the number of large holdings fell, while the number of small farms increased greatly. Indeed, the number of landowners increased to 2.2 million, and they had an average of 3.65 ha each at their disposal.
The changes in ownership structure in Poland were on a smaller scale and were regional in nature. While around 75% of agricultural land was in private hands in 1988, this had increased to around 88% by 2000. Privatization was associated with the complete closedown of the State Farms, of which some were in fact in sound economic condition and hence more in need of restructuring than privatization. The result of this radical shift was a dramatic increase in unemployment in the former State Farm areas, attendant poverty and social exclusion, the recapitalization and devastation of public assets, and an increase in the area of fallow land.
Figure 5
Changes in the proportion of labour force working on the land and shares of GDP accounted for by agriculture in Hungary
0
2
4
6
8
10
12
14
16
1990 1991 1992 1993 1994 1995 1996 1997 1998 1999 2000 2001 2002
GDP enployment
Source: Own elaboration.
The privatization-related changes were as large in Slovakia as in Hungary, al-beit proceeding in line with a different model. The cooperatives and State Farms of the communist days were converted into private enterprises, in large part remaining in the hands of those who had worked on them previously. Farmland ownership in individual hands only accounts for 12% of the land. Fragmentation of the agrarian
THE DEVELOPMENT OF RURAL AREAS IN CENTRAL EUROPE… 37
structure was thus a lesser problem in this case. As of 2001, Slovakia had just 5681 small farmers, having an average of 39 ha of arable land each. This compares with an average of 1600 ha of land at the disposal of each agricultural enterprise or co-operative.
The most important goals and priorities of countries’ economic development are set out in National Development Plans, which comprise a series of Operational Programs (like the Economic Competitiveness Operational Program, Regional Development Operational Program, Agricultural and Rural Development Opera-tional Program, etc.). Among them, the one of greatest significance to the country-side is not unnaturally the program for the development of rural areas and agricul-ture. Studies of Polish and Hungarian documents make it clear that these repeat the main assumptions of the CAP and denote the same routes to the development of rural areas.
Of equal importance to the long-term development of rural regions are the con-cepts for the country’s spatial management. The majority of these would seem to be concentrating on the development of the metropolitan area and the linking of the transport systems that represent an axis of development on both the national and European scales. Little space is given over to the rural areas, which suffered most tangibly during the transformation period and became yet further distanced from urban areas. The concept that won out in Poland holds that effectiveness needs to be put ahead of equality – with all the spatial polarization effects that that entails. Perhaps this is indeed a justified concept over the longer term, but its inevitable consequence for the next few years is yet further marginalization of substantial rural areas.
Studies dealing with the issues of rural areas and agriculture form part of the planning and strategic documents drawn up for different time scales (2004–2006, 2007–2013), spatial scales (national, regional, local, etc.) and branch structures (agriculture, environmental protection, transport, etc.). Analysis of the Polish documents points to these in general being cohesive and consistent one with an-other, and indeed with the same facts and proposed solutions being repeated again and again. However, the volume and number of documents makes it difficult for these to be taken in properly, and it is possible to leave the subject with the impres-sion that planning is equated with bureaucracy.
REGIONAL DISTRIBUTION OF SOME DEMOGRAPHIC AND LAND-USE PARAMETERS IN BULGARIA
BORIS KOLEV – MARIA GROZEVA
Bulgarian socio-economic policy aimed at development of an efficient and equita-ble integration in the EU economic structures. The regional development policy is a part of this policy. The National Regional Development Strategy (NRDS) for the period 2005–2015 promulgated 2005 is the fundamental document formulating the long-term objectives and priorities of the regional policy of Bulgaria. The main tasks of this Strategy are as follows:
− to define the strategic objectives of regional development for the period al-ready mentioned;
− to provide milestones for definition and application of sectoral policies of re-gional impact and to lay the basis for coordination of the regional develop-ment with the rest of the policies in the planning regions;
− to ensure coordination between the regional development policy and territo-rial planning policies with a view to achieving a balanced territorial devel-opment;
− to provide a framework for planning and programming documents at all territorial levels.
The implementation of all these objectives will be impossible without investi-gation of the existing territorial disparities in the individual territorial levels and especially at the NUTS II (planning regions) and NUTS III levels (administrative districts).
A monitoring of the implementation of the principals, objectives and priorities of the Strategy will be performed by the Partnership on NRDS by periodic 3-years report. This report will contain propose decisions about activities to be undertaken with a view to overcoming the barriers and difficulties to its implementation.
This is a brief presentation of regional distribution of several demographic and land-use (arable land, forests and artificial areas) parameters. Some of these analy-ses are at NUTS II, and some of them – at NUTS III level.

REGIONAL DISTRIBUTION OF SOME DEMOGRAPHIC AND LAND-USE… 39
Active population (2002) at NUTS II level. The average rate is 48.4% in 2002 at the national level. Two planning regions
are below this average level – North-West (43.7%) and North-Central (45.7%). These values are a result basically of the ageing of the population. Three regions have values compared to the national average (North-East – 48.4%; South-East – 48.6%; South-Central – 47.4%). The only one region above average value is South-West – 52.1%.
Population density at NUTS II level (2003). The national value of this parameter is 70.3 inh/km2. With the respect to the
population density the least populated are North-West Region (48.3 inh/km2) and South-East Region (53.4 inh/km2). Close to the latter are the values for North-East Region (64.4 inh/km2) and North-Central Region (64.9 inh/km2). The South-Cen-tral Region (70.7 inh/km2) is just at the national level. The highest population den-sity is characteristic for the South-West Region (103.9 inh/km2). The main factor is the population of the capital Sofia situated in this region. Vast areas with low den-sity, mainly in the mountainous and rural parts, exist in each of the planning re-gions, while the large cities and district centers stand out with high population den-sity. The disparities in Bulgaria in term of the Population Density indicator are quite moderate in comparison with those in many of the European regions. For example, the correlation between the highest and the lowest populated regions was 2:1 in 2003.
Population density at NUTS III level (2003). The districts of Sofia (37.5 inh/km2), Lovech (39.6 inh/km2), Vidin (40.4
inh/km2), Smolyan (42.3 inh/km2), Dobrich (44.2 inh/km2), Yambol (44.6 inh/km2), Montana (47.7 inh/km2), Silistra (48.3 inh/km2), Haskovo (48.8 inh/km2) are with the least population density. Five of these kinds of districts are in the Northern part of the country and the rest are in the Southern Bulgaria. The highest value of population density is characteristic for the capital district of Sofia. The districts of the second and the third city of the country (Plovdiv and Varna) are with high den-sity also. 22 of all 28 administrative districts are below the average population den-sity of the country.
Urbanization at NUTS III level (inh. of cities over 20 000 inh. against the total population of the region).
The highest share of population living in the cities over 20 000 inh. of the total number of population at NUTS III level is characteristic of the district of Sofia capital. With the respect of the share of population living in this group of cities, the least is the district of Sofia (18.1%). The following group of these administrative units is between 20 and 30% – Smolyan (23.9%), Razgrad (26.4%), Kardzhali (28.2%), Targovishte (28.5%), Silistra (29.5). Four districts (Vratsa, Lovech, Pleven and Pazardzhik) have values between 30 and 40%, six (Vidin, Montana,

BORIS KOLEV – MARIA GROZEVA 40
Veliko Tarnovo, Dobrich, Shumen, Haskovo and Blagoevgrad) – 40–50%, seven (Burgas, Sliven, Yambol, Plovdiv, Stara Zagora, Kyustendil and Pernik) – 50–60% and three districts (Gabrovo, Ruse and Varna) – 60–70%. This share is an impor-tant parameter for the present stage of urbanization in Bulgaria. Normally the dis-tricts with a large population have the highest percentage of population living in the cities over 20 000 inhabitants (Sofia – capital district, Varna, Ruse, Plovdiv, Burgas).
Employment per Primary sector at NUTS III level (2003). As a result of the structural reform the employment level has dropped in all the regions and administrative units – districts, although substantial differences in the rates of the industrial regions. The statistical data show that the lower share of em-ployment in the Primary sector there are in the capital district of Sofia – 0.8%, Gabrovo – 2.9%, Plovdiv – 3.1%, Varna – 3.4% etc. There are still several districts in this group below 5% – as Vidin, Vratsa, Haskovo, Blagoevgrad and Kardzhali. The following group consists most of the rest of NUTS III level units (Montana, Veliko Tarnovo, Lovech, Pleven, Ruse, Dobrich etc.). Four 4 districts only are in the group between 10–15% employment level in the Primary sector (Kyustendil, Sofia-district, Silistra and Stara Zagora). The last two groups of districts are with relatively well-developed agriculture and forest economy.
Employment per Secondary sector at NUTS III level (2003). The national average percentage of this kind of employment is 31.6%, but there
are some territorial differences in the country. Logically, the capital district of Sofia is below this level (19.2% of the employees are in the industry). The follow-ing group includes two districts only – Varna (21.4%) and Vidin (24.4%). The main factor for this situation in Varna is the well-developed Thirstier sector and especially tourism. Quite different is the case of Vidin. Practically, there is no functioning industry, even the existing one is with very old potential and structure. The rest of districts are above already mentioned national value. The highest share of the employees in the Secondary sector are districts of Blagoevgrad (51.1%) and Gabrovo (52.1%). This is due to existence of well-established district centers. Ob-viously, it’s necessary to make efforts for its restructuring and modernization.
Employment per Tertiary sector at NUTS III level (2003). The sector structure of employment at national level shows that the share of
employees in this sector is 63.2% of total number of employees in all sectors and activities. An important fact is that the most of the NUTS III level units have the share close to the national level. Naturally, the highest level is characteristic for the capital district (80.0% of the total number of employees in all sectors). Varna (75.2%) and Burgas (66.4%) are the following group because they have very good developed tourist industry. Some of the old industrial centers – Gabrovo, Haskovo, Lovech, Blagoevgrad are characterized of the level below the national one.

REGIONAL DISTRIBUTION OF SOME DEMOGRAPHIC AND LAND-USE… 41
Agricultural areas as a percent of total area at NUTS III (2003). Agricultural areas occupy 58.7% of the total territory of Bulgaria. The percent
of this type of land is different in the individual planning regions. The regions in the North part of the country are above average percentage because there are vast plainly territories (North-West – 71.5%, North-Central – 68.6%, North-East – 69.2%). Contrarily, the South Bulgarian regions are characterized by lowest per-cent of the agricultural areas because these territories are more mountainous than the North of the country (South-West – 46%, South-Central – 49,6%, South-East – 57,8%).
Forest areas in percent of total area at NUTS II level (2000). The average percent of the forest area is 33.6% of the total national territory.
Predominantly, the most forested areas are in the mountainous parts of the South regions – South-West (47.2%), South-Central (42.5%), South-East (35.0%). The other three regions are below the average percentage of forest areas.
Artificial areas in percent of total territory at NUTS II level (2000). The artificial areas include the territories of settlements, mines, dams, transport
and other infrastructural networks, plants. The national average level is 7.7% of the country’s territory. Two regions are below this level – South-East (7.2%) and South-West (6.9%). The North-Central (8.5%) and North-West (8.2%) regions are above this percent.
Density of roads per surface (km per sq. km) The last statistical data show that the average density of roads per sq. km of the
national territory is 0.17 km. The values of this characteristic are almost equal to all planning region (North-West – 0.17 km; North Central – 0.19 km; North-East – 0.18 km; South-East – 0.15 km; South Central – 0.17 km and South-West – 0.16 km). The situation is almost the same at the NUTS III level (districts). The districts of Gabrovo (0.25 km/km2) and Pernik (0.23 km/km2) are with relatively highest density. That is why they are among the least districts by their territory. Some of them are in the group with density between 0.10 km/km2 (Blagoevgrad) and 0.17 km/sq. km (Vratsa, Montana, Burgas, Sliven, Stara Zagora etc.). The following districts are above 0.17 km/sq. km – Shumen, Pazardzhik, Plovdiv, Smolyan, Sofia. That means the density of road network per surface is relatively homogenous in all regions (NUTS II) and districts (NUTS III).
Density of roads per 1000 inhabitants (2003) Since 2003, the local IV category road network (at the municipality level) is al-
ready not a part of the national road system. The average density of roads is 2.47 km per 1000 inh. The South-West Region (1.55 km) is under this value because its great number of population. Here is situated the capital Sofia. North-West Region has the highest value (3.58 km) among Bulgarian regions. A significant part

BORIS KOLEV – MARIA GROZEVA 42
(22.0%) of the length of the roads of a high class is on the area in this region. North Central Region occupies the second place by this indicator. The highest value of this parameter at district level has recorded for the capital one – 9.51 km. This fact is may be explained by better-developed road network. District of Vidin (4.98 km) is at the second place. The lag behind in the development of the road network is the greatest in North-West Region.
Density of rails per surface (2001) The density of the railway network (0,039 km/km2) is lower than the density of
the old 15 EU Member states and of some other Eastern European countries. The railway network density is slightly above the national average in South-West (0.045 km/km2), North Central (0.045 km\km2) and South Central Region (0.040 km/km2). This kind of transport is less developing in the northwestern and south-eastern parts of the country. Relative share of the length of the railway lines in the individual planning regions is as follows: South Central – 26.1%; South-West – 21.1%; North Central – 18.7%; North-East – 15.5%; North-West – 9.4% and South-East – 9.2%.
Density of rails per 1000 inhabitants at NUTS III level The density per 1000 inh. is less in the districts of the capital Sofia Blagoev-
grad and Ruse than the other administrative districts of the area of the planning regions. That is why Blagoevgrad and Ruse are peripheral districts and Sofia is the biggest Bulgarian city with very short length railway network on its territory. On the other hand the districts of Blagoevgrad and Ruse are traversed by a little part of the entire railway network.
Density of rails per 1000 inhabitants at NUTS II level The territory serviced the best is the North-West Region because it is rare popu-
lated in comparison with the other regions. The North Central region is at the sec-ond place by this indicator. The density per 1000 inh. in South-West Region is the least. The main factor for this fact is that it is the most populated region of the country with 9.4% of the length of the entire national network only.
Connectivity to transport terminals at NUTS II level Transport accessibility (roads). The territorial distribution of roads of a higher
class is of decisive importance for the mobility of the population and the transport access to services of a higher quality. The predominant part of such roads in the country is on the area of South-West, South Central and North-East planning re-gions (respectively 22.0%, 21.7% and 20.0% of the total length of such roads). This is explained by the location there of particularly important centers from the settlements network – the city of Sofia (South-West), Plovdiv (South Central) and Varna (North -East), which have caused priority construction of highways and Class A roads specifically in these regions. The least portion of this class network

REGIONAL DISTRIBUTION OF SOME DEMOGRAPHIC AND LAND-USE… 43
is built in the area of the North-West Region (5.3%), to be explained by the ab-sence of any significant center if the settlement network there. The spatial devel-opment of the road network determines also the possibilities for transport accessi-bility of the population to the centers offering a certain type of services (health care, education, culture, administrative services, etc.). In Southern Bulgaria, more than 80% of the population has access to these services in the framework of 90 minutes ride and in the South-West Region these values are above 90 minutes, while in the Northern Bulgaria the access is more difficult and only 60% of the population of the North-West Region have such access within 90 minutes.
Accessibility to railway transport. In view of the specifics of the railway transport, an indicator of great impor-
tance for the accessibility by transport, apart from the spatial development of the railway network, is also the number of stations and stops, servicing the individual planning regions. The territory serviced the best is that of the South Central Re-gion, which is traversed by one quarter of the entire national railway network, fol-lowing by the South-West and the North Central Regions with 21.1% and 18.7% respectively. Peripheral in terms of the railway infrastructure are South-East and North-West Regions.
Air transport. From the existing 10 civil airports in the country, 5 (Sofia, Plovdiv, Varna, Bur-
gas and Gorna Oryahovitsa) officially have the international airport status, but the activities are concentrated at the Sofia, Varna and Burgas airports. They service predominantly international destinations. A total of 2 660 158 passengers and 13 228 tons of goods were serviced by regular passenger, charter and cargo flights at the five international Bulgarian airports in 2001. These are among main dispari-ties in regional distribution of some basic demographic, land-use and transport parameters in Bulgaria.
References
Bulgaria by the end of 2006: Socio-economic analysis, Agency for Economic Analysis and Forecasts, Sofia, April 2004.
Regional Development Act, promulgated State Gazette vol. 14/20 Feb. 2004.

THE DEMOGRAPHIC CRISIS IN BULGARIA – GEOGRAPHICAL DIMENSIONS
CHAVDAR MLADENOV
Introduction
The geographical aspects of demographic phenomena and processes have been the focus of research for many years. In Bulgaria these processes and phenomena were most intensive in the 1950s when the regional demographic information began to be thoroughly analyzed. General theoretical principles about the development of population and economy were employed to explain the regional differences.
The negative processes, accompanying the population development, are char-acteristic of all advanced and highly advanced nations. The consequences for the society and for the demographic systems are similar but they have different inten-sity in different periods of time. As the demographic crisis in these countries is considerably mitigated by immigration and by the extension of the average life expectancy, the aforesaid problem is not in the centre of scientific discussions in them. On a global scale the population growth, the high birth rates and the related problems with the natural resources and environmental pollution are still regarded to be of major concern. At the same time, the forthcoming demographic problems (depopulation, reduced population reproduction and population aging), which will result in irreversible negative social and economic effects and demographic crises especially in the small states, are ignored.
The demographic crisis first affects territorial units of low rank and individual settlements. In geographical terms it is characterized by depopulation with empha-sis placed primarily upon the population size while the reproduction and migration processes are underestimated.
The demographic crisis is a phenomenon, observed mainly in Eastern Europe (Latvia, Estonia, Hungary, Bulgaria) and is not so typical of the advanced coun-tries. That is why most of the investigations are general and hypothetical and do not treat it from geographical aspects. Demographers begin to show interest in this issue in the mid–1990s when the demographic situation reached its worst parame-ters – very low birth rates, high crude and age specific death rates, marked popula-tion aging, emigration, high unemployment, etc. This research aims to reveal the spatial characteristics of the demographic crisis in Bulgaria. For that purpose it analyzes the quantitative parameters of the demographic crisis, defines its phases and on their basis classifies the territorial units and describes the main socio-economic problems.

THE DEMOGRAPHIC CRISIS IN BULGARIA – GEOGRAPHICAL DIMENSIONS 45
In some respects the adverse demographic tendencies in Bulgaria can be estab-lished as early as the end of the 1960s but they become most acute at the beginning of the 1990s when the population development enters a new period notable for further demographic destabilization.
Demographic crisis – demographic situation
The term “demographic crisis” is closely related to the term. The demographic situation is an element of the “social situation” which is defined as a combination of social components (people, social communities, public relations, social institu-tions, social processes) in a certain locality and at a specific time.
The demographic situation can be also considered as a geographical category. It depends on the specific geographical and historical conditions of a territorial unit. In this paper, the “demographic situation” means the main demographic processes and structures for a certain period of time, resulting from social, demographic, economic, geographical, ethnical, cultural and some other factors. It reflects the objective socio-economic regularities in society. The demographic situation is dif-ferent in different stages of demographic transition and largely depends on its own features in the near or more distant past.
The demographic crisis illustrates the heavily aggravated processes, concerning the population – depopulation, declining birth rates, rising death rates, deteriorated population structures, etc. The adverse quantitative changes in the parameters of the demographic situation have approached thresholds, which cause qualitative transformations. “Threshold” means such processes and phenomena which lead to continuous destabilization in the population reproduction and to socio-economic problems or problems of living conditions and which requires measures so as to reduce and overcome the negative effects. The demographic crisis is specific under certain geographical and historical conditions and is associated with the specific socio-economic characteristics of an individual locality. In this paper the term “demographic crisis” denotes the extremely low values of the major demographic processes and structures which have been reached as a result of socio-economic, urban, cultural, ethnical, geographical factors and of service infrastructure.
Geodemographic analysis
The complex geodemographic analysis of the level of demographic crisis, caused by numerous factors, is based on a whole set of indicators, which characterize most of these factors. For that purpose 13 indicators have been used: birth rate (for the
CHAVDAR MLADENOV 46
period 1993–2001), death rate (1993–2001), natural increase (1993–2001), number of in-migrants (1993–2001), number of out-migrants (1993–2001), migration in-crease (1993–2001), changes in the population number (1993–2001), net migration (1993–2001), share of population at ages from 0 to 14 (2001), share of population at ages 15–59 (2001), share of population aged 60 years or older (2001), share of Turkish population (2001) and share of gypsies (2001). The demographic crisis is defined as multidimensional characteristic of the social and demographic structure, economic development, the level of urbanization, reproductive and migration be-havior of the population. Therefore, the phases of the demographic crisis are a result of different combination of indicators, characterizing the areas under investi-gation. Their parameters, describing the respective phases, are not stable in space and time and so, the territorial units can pass from one phase into another.
Generally, the demographic crises can be divided into the following phases – initial, intermediate and final. Some phases can be further divided into sub-phases, which depend on the specific nature of the demographic processes.
Initial phase of demographic crisis. It is characterized by a birth rate which varies around 10‰ on the average. At the same time this is the phase where the highest birth rate on a national scale has been recorded – 12–13‰. This figure is close to the threshold of the simple population reproduction. The death rate is about 11.9‰. The migration movements are dominated by out-migrations and hence, the migration increase and the net migration are negative. The negative net migration is twice as high as the national average (-5.2‰). The rate of population drop (–6.9‰) is lower than the national average by 0.7 points. The age structure is rela-tively good. The shares of population at below-working age (17.2%) and at work-ing age (63.6%) are by 1–2 points greater than those for the country and the share of above-working age population (19.2%) is by 3 points smaller. The ethnic struc-ture displays high concentration of Turks and gypsies. The share of Turkish popu-lation is twice as high as the national average – 18.8%, and of the gypsies – by 2 points (6%).
The initial phase of demographic crisis embraces the population of areas where the natural increase is about zero or slightly below zero. In the municipalities with negative migration increase the social, economic, geographical conditions and ser-vice infrastructure do not favour the positive reproduction pattern of population. In the municipalities with positive natural increase the low educational and cultural level, the ethnic identity, the low migration mobility, the high average numbers of children per one family encourage a considerably high birth rate.
Intermediate phase of demographic crisis. This phase is remarkable for a birth rate, which is roughly similar to the national average and yet, negligibly lower (8.6‰). It widely varies from one municipality to another (the difference is within 6 points). The same applies to death rate that is 13.9‰ on the average but depend-ing on the degree of population aging, it varies within 14 points. The natural in-

THE DEMOGRAPHIC CRISIS IN BULGARIA – GEOGRAPHICAL DIMENSIONS 47
crease is negative and is close to the national average – -5.4‰. The rate of popu-lation drop is slightly lower than that for the country – -7.0‰. This is caused pri-marily by the positive migration increase (+1.4‰). During the surveyed period the net migration is negative (-1.7‰) which is mostly due to the emigration. The in-migration and out-migration statistics substantially differ and depend on the place of the territorial unit and its center in the administrative and economic-geographi-cal division of the country. The positive migration increase predetermines rela-tively well-balanced ratios between the main sex and age groups. The age structure resembles that of the country. The shares of below-working age (14.9%) and above-working age population (22.2%) are smaller than the national average ones by 1 point and of the working age population (62.9%) – by 0.6 points bigger. The ethnic structure is notable for its share of gypsies that is close to the national aver-age (4.0%), for the smaller concentration of Turkish population (6.2%) and for a higher share of Bulgarian population as compared to the national average – 85.1%.
The intermediate phase of demographic crisis is defined by parameters of demo-graphic situation, which are similar to those throughout the country. The population structures are basically formed by the migration movements (it should be empha-sized that with the abating migrations it is the natural increase that becomes pre-dominant). The favourable economic-geographical conditions and the available economic, servicing and other potential continue to attract in-migrants, which keep the population balance irrespective of the changing population number. To a great extent the changes in the demographic situation in the individual territorial units will result from the accelerated process of population aging, reduction of in-migra-tion flows and universal transition to a one-child family pattern because of eco-nomic, social, cultural, psychological and some other transformations.
Final phase of demographic crisis. It is characterized by depopulation processes and population regressive reproduction. The birth rate is very low (about 6.5‰ on the average) and the lowest values are less than 4‰. The death rate is exceptionally high (about 25.5‰ on the average) and the extreme values are above 30‰ while the average death rate exceeds the national average by 11 points. As a result, the natural increase is negative (-19.0‰ on the average and higher than the migration increase) and is considered the primary cause for the population decrease (18‰ on the average). The migration increase and the net migration are positive but their values are too low (0.9‰ on the average) which actually does not improve the population age structure. The migration turnover in the municipalities is high which is a sign for their economic, social and demographic destabilization. There-fore, the in-migration and out-migration coefficients widely vary. The population aging has reached extreme values. The share of below-working age population is too small (12.1%) which is by 3 points smaller than the national average. There is an over-concentration of above working age population (41.4%) which is by 19 points higher than the national average. The ratio below working: above-working

CHAVDAR MLADENOV 48
age population is less than 0.3, which illustrates the heavy aging and the lack of population reproductive capacities. This fact is additionally accentuated by the low share of working age population – 26.5%, i.e. by 17 points lower than the national average. Such age structure explains the regressive type of population reproduc-tion, which leads to depopulation. The ethnic structure is homogeneous with deci-sive prevalence of the Bulgarians (90%). The share of the gypsies is 6.6% and is by 2 points higher as compared to the average figure for the country. The share of Turkish population is negligible – 2.8%, i.e. by 6 points lower than the average for the country. In many of the municipalities, this share is 0% or less than 1%. The degradation of the demographic structures in the final phase of the demographic crisis essentially restricts the economic, cultural and urban development of the municipalities. The educational level is very low and most of the people are em-ployed in agriculture. Their incomes are relatively low and include mainly pensions and relief funds. The service infrastructure is lagging behind in quantitative and qualitative terms and its utilization is inefficient. The economic-geographical loca-tion, which is rather unfavorable, the available economic, social, servicing, etc., potential and the level of urbanization impede the attraction of in-migrants and thus by means of positive migration movements to improve the demographic indicators which will result in a better demographic situation and in mitigation of the demo-graphic crisis. Consequently, the depopulation of the areas, experiencing this phase of demographic crisis, will go on.
In order to distribute the municipalities in Bulgaria according to the phases of demographic crisis, a hierarchical clustering technique has been used, based on Euclidean distance measures and Ward’s method of clusters' linkage. The cluster-ing procedure produced a tree diagram in which 3 groups of municipalities can be distinguished. Each one corresponds to the respective types and sub-types of demographic crisis (Figure 1).
During the period 1993–2001 the initial phase of demographic crisis in Bulgaria affected 77 of a total of 263 surveyed municipalities (29% of their total number), 28.3% of the country's area and 26.5% of the country’s population. They are situ-ated in 2 of the previous 4 regions of demographic stability – the Eastern Rhodope district and Northeastern Bulgaria. At the beginning of the 1990s, the birth rate of these municipalities began to decrease in comparison with the past and yet, it is still on the threshold of the simple reproduction (about 14‰). In lots of them, ei-ther the Turkish population prevails or the share of the gypsies is high. A typical feature of the municipalities, going through this phase, is that the demographic crisis occurs suddenly because of the large-scale emigration of Turkish population to Turkey.

THE DEMOGRAPHIC CRISIS IN BULGARIA – GEOGRAPHICAL DIMENSIONS 49
Figure 1 Demographic phases in Bulgaria and the used demographic parameters
Parameters Initial phase Intermediate phase
Final phase
1. Number of the municipalities 77 141 45 2. Share of the municipalities (%) 29,3 53,6 17,1 3. Share of the country’s area (%) 28,3 58,1 13,6 4. Share of the country’s population (%) 26,5 68,8 4,7 5. Birth rate (‰) 10,1 8,6 6,5 6. Death rate (‰) 11,9 13,9 25,5 7. Natural increase (‰) -1,8 -5,4 -19,0 8. Number of in-migrants (‰) 17,7 24,8 28,9 9. Number of out-migrants (‰) 21,3 23,4 28,0
10. Migration increase (‰) -3,6 1,4 0,9 11. Changes in the population number (‰) -6,9 -7,0 -18,1 12. Net migration (‰) -5,2 -1,7 0,9 13. Share of population at ages from 0 to 14 (%) 17,2 14,9 12,1 14. Share of population at ages 15–59 (%) 63,6 62,9 46,5 15. Share of population aged 60 years or older (%) 19,2 22,2 41,4 16. Share of Turkish population (%) 18,8 6,2 2,8 17. Share of gypsies (%) 6,0 4,0 6,6
Source: Edited by the author.

CHAVDAR MLADENOV 50
This phase can be divided into two sub-phases – initial phase of demographic crisis, caused by impressive exodus, and intermediate phase, occupying a border-line position between stationary and regressive type of demographic situation.
Most numerous are the municipalities, experiencing the intermediate phase of demographic crisis – 141 of a total of 263 or 53.6% of all municipalities, 58.1% of the country’s area and 68.8% of the country's population. The municipalities here perform different functions with priority given to mining industry, resort and rec-reation activities, etc. Dominant in them is the Bulgarian ethnos with its specific reproduction and migration behavior. The phase is notable for the higher negative migration increase as compared to the negative natural one and for a population aging, which is not so marked.
This phase can be divided into three sub-phases – initial stage, medial stage and final stage of the intermediate phase.
The final phase of demographic crisis includes 45 municipalities of a total of 263 surveyed ones (17% of them) which cover 13.6% of the country’s area and 4.7% of its population. The demographic indicators of the municipalities in this phase are extremely adverse. With few exceptions, the municipalities are located in regions of long lasting depopulation – Northwestern Bulgaria, the regions border-ing on Central West Bulgaria, the Central Stara Planina Mountain with its adjacent parts of the Danube Plain, the eastern half of the Upper Thracian Lowland with regions of Sredna Gora, Strandzha and Sakar. These 45 municipalities have been integrated into a separate group because of the extremely high death rate, the high rate of population drop (resulting from the extremely high negative natural in-crease), the heavy population aging and the exceptionally low birth rate.
Nowadays the demographic situation in the country is in crisis, which is evi-denced by the degraded parameters of the demographic situation as far as the urban population is concerned. The emigration of young people and the changes in the reproductive behavior as a result of the socio-economic crisis have contributed to this process. Most of the inner migration has turned into outer migration thus ac-celerating the demographic crisis. The latter has affected severely the rural popula-tion, too. In the rural regions the demographic crisis started much earlier because of the village-to-town migration (associated with the government urban policy and the poor living and labour conditions in villages) and the evolutionary changes in population reproduction. There are no prospects for overcoming the crisis and for stabilizing the demographic situation in the near future. The high unemployment level together with the low standard of living will keep negative net out-migration balance.
The demographic crisis has incurred serious (and quite often irreversible) losses on society, resulting in social, economic and settlement destabilization. Therefore systems of preventive measures are needed to restrict the adverse consequences, which have to underlie the strategies and plans for general and regional socio-eco-

THE DEMOGRAPHIC CRISIS IN BULGARIA – GEOGRAPHICAL DIMENSIONS 51
nomic development. The statistics show that due to the limited demographic re-sources a lot of schools and health centers are likely to be closed and a number of settlements – to be wiped out of the map. According to 2001-census more than 130 inhabited localities are practically depopulated, more than 3300 localities have less than 500 inhabitants and are deprived of the rights to elect a mayor and over 1400 settlements have a population of less than 100 people. The depopulation, which has affected numerous settlements, gives rise to plenty of managerial and regional planning problems.
The birth rate decrease below the level of simple reproduction is the major fac-tor for the current demographic crisis. It makes the base of the age pyramid nar-rower at the expense of its central and top parts. This is the way in which the proc-ess of population aging as an element of the demographic crisis proceeds. It is the aging, which is mainly responsible for the rising crude death rate. To sum up, the low birth rate and the high death rate disrupt the normal population reproduction pattern. Besides, the demographic crisis leads by natural causes to a population decrease throughout the country or in a certain region of different rank and to heavily degrade demographic structures.
The process of aging and the decreasing number of population hamper the or-ganization of production cycle and the efficient utilization of production technolo-gies which in turn cuts down the investments for buying expensive equipment and for carrying out a wide-range of research activities. The smaller number of popula-tion at working age induces a reduced labour potential. It reflects also on the cul-tural sphere as the production of films, the publishing of books and the construction and maintenance of libraries do not pay. Another important consequence of the population aging is the retirement insurance, which becomes more difficult in the conditions of economic crisis, unemployment, low labour productivity and wide-spread “grey economy”. With the population aging, the pension and health ex-penses grow. The reduced employment and the drastic drop in the volume of GDP adversely affect the pension fund and do not allow the old-aged people to live in dignity. The new scheme of health service and social benefits is being discussed and applied but it faces enormous difficulties and that is why is ineffective and turns out to be a subjective factor, rising the death rate. Owing to the accelerated depopulation, many buildings (houses, enterprises, administrative buildings, edu-cational establishments), service infrastructure and equipment have been aban-doned. The same refers to the local resources – farmland, recreation and tourist potential.
The most important social problem, which the government has to solve, is the adequate incomes of the old-aged people in Bulgaria. For that purpose it is neces-sary to obtain economic stabilization, to speed up the rates of economic growth and to introduce a better approach for collecting money that goes to the state budget.

CHAVDAR MLADENOV 52
The problem can partially be solved by compulsory and additional voluntary re-tirement insurance.
The birth rate can be encouraged not only by direct payments but also by tax concessions in the conditions of market economy. The first step in this respect is the application of some elements of the family income taxation in Bulgaria.
Most of the smaller Bulgarian villages exhibit highly aggravated socio-eco-nomic characteristics. These settlements and some of their buildings can be pre-served to a certain extent by the increasing purchases of country cottages and their transformation into villas for short-term or long-term recreation – a practice that is presently observed. In addition, Bulgaria’s forthcoming integration to the EU makes a lot of foreigners buy rural properties. Therefore, some of the Bulgarian villages might somewhat recover, although an overall stabilization is unlikely to occur.
References
Galabov, N. 2005: The demographic collapse in Bulgaria. Sofia. Demographic encyclopedic dictionary 1985 Moscow. Demographic development of the Republic of Bulgaria. Sofia, 2005. The European future of Bulgaria and the population development. Sofia, 2005. Encyclopedic dictionary on sociology. Sofia, 1996. Mladenov, Ch. 1993: Typology and demo geographic investigation of the municipalities in Bulgaria
according to their birth rates. A scholarly essay, Sofia. Mladenov, Ch.–Dimitrov, E. 2004: Geographical interpretation of the terms “demographic situation”
and “demographic crisis” (Bulgaria case study area). Problems of Geography Journal, book 3–4, Sofia.
Rosset, E. 1968: The process of population aging. Moscow. Statistical Year Books of Bulgaria. Sofia, 1959–2001. Ward, J. H. 1963: Hierarchical grouping to optimize an objective function. Journal of the American
Statistical Association. 58. 236.
REGIONAL GOVERNANCE IN CENTRAL EUROPEAN REGION: THE CENTROPE CASE
DANIELA COIMBRA DE SOUZA
Introduction: new modes of governance
Local governments have become increasingly engaged in fostering and encourag-ing new ways of local development and employment growth and have been in-volved in economic development activities related to production and investment. This occurs in a context of “glocalization” (Swyngedouw, 1997: 103) (and “global-local disorder” that implies a host of institutional changes within the local and regional state apparatuses (Brenner–Peck–Theodore, 2006) and a “re-scaling” that differs from the previous state development model – the “National Keynesian Welfare State” (Jessop, 2002) which emphasized the national scale. In this sense, local governments strive to respond to an enhanced scope due to the emergence of important new problems, which cannot be resolved “through top-down state plan-ning or market-mediated anarchy”, implying a “shift in the institutional centre of gravity (or institutional attractor) around which policy-makers choose among pos-sible modes of co-ordination” (Jessop, 2003: 102).
Following Moulaert et al (2002) and Harvey (1989), these changes affecting lo-cal governments have converged in an entrepreneurialist form of state that devel-ops a new type of growth coalition, involving local chambers of commerce, local financiers, industrialists, property developers, etc., resulting, therefore, in a more intricate form of state, as the power to organize space derives from a whole com-plex of forces mobilized by diverse agents. Consequently, local governments seek new technologies of government and a new form of multi-scalar governance is emerging.
There is a wide array of notions of governance, which can easily be related to various views of planning or political theories (Moulaert–Sekia, 2003). Govern-ance is here understood as the “emergence, proliferation and active encouragement of institutional arrangements of ‘governing’ which give a much greater role in pol-icy-making, administration, and implementation to the involvement of private eco-nomic actors on the one hand and to parts of civil society on the other hand in self-managing what until recently was provided or organised by the national or local state” (Swyngedouw, 2005: 1992). Additionally, governance also entails explicitly the multilaterally involved interests and the necessity of mutually satisfactory deci-sions and projects. It can also be understood as: “the reflexive self-organization of

DANIELA COIMBRA DE SOUZA 54
independent actors involved in complex relations of reciprocal interdependence; this self-organization is based on continuing dialogue and resource-sharing to de-velop mutually beneficial joint projects and to manage the contradictions and di-lemmas inevitably involved in such situations” (Jessop, 2003: 103).
In what concerns the governance of governance, i.e. the meta-governance (Jessop, 2003), states have a major and increasing role. According to Swyngedouw and Jessop (2006) states “provide the ground rules for governance and the regula-tory order in and through which governance partners can pursue their aims; ensure the compatibility or coherence of different governance mechanisms and regimes; act as the primary organizer of the dialogue among policy communities; deploy a relative monopoly of organizational intelligence and information with which to shape cognitive expectations; serve as a ‘court of appeal’ for disputes arising within and over governance; seek to re-balance power differentials by strengthen-ing weaker forces or systems in the interests of system integration and/or social cohesion; try to modify the self-understanding of identities, strategic capacities, and interests of individual and collective actors in different strategic contexts and hence alter their implications for preferred strategies and tactics; and also assume political responsibility in the event of governance failure” (Swyngedouw–Jessop, 2006: 22).
Even pursuing the meta-governance responsibility, local governments, through local governance systems, seek to promote economic development by a new insti-tutional setting which incorporates public-private-partnerships and “flexible” in-stitutions giving much greater role to actors of civil society. It, however, raises the question of the actors to which role is given and the results of the governance sys-tem in terms of policies.
Considering these lines, the present work describes the intentions and first re-sults of a PhD dissertation, which aims at investigating the governance system in terms of growth alliances in a produced space: the newly emerging so-called Cen-tral European Region – “Centrope”, in the border region of four European coun-tries: Austria, Hungary, Czech Republic and Slovakia. In this created region, which do not coincide with a formal political administrative unit, local governments launched a project to face economic challenges through a cooperation building that aimed to gather different actors.

REGIONAL GOVERNANCE IN CENTRAL EUROPEAN REGION… 55
Centrope: re-creating an old trans-national region
An emerging region
Central Europe is an intermediary region between Western and Eastern Europe with deep historical roots, though later the West became urban and industrialized, while the East remained rural and agrarian (Anderson, 1980). Within the Habsburg Empire these centre-periphery relations were found within the political-military unity of the Austro–Hungarian Empire. Austria ruled over the Western, Hungary over the Eastern part and their respective nations. After 1918 the region experi-mented with democratic, authoritarian and fascist regimes and after 1945, the East was disconnected from the West by the Iron Curtain, a border nearly identical to the border of the Carolin empire around 800 (Szücs, 1990: 13). After 1989, the fall of the Iron Curtain, attempts to cooperate with neighbours changed the geopolitical position of Vienna from the most Eastern part of Western Europe to the historical position linking Eastern and Western Europe (Musil, 2005) (Figure 1).
Figure 1 The Centrope Region
Source: CENTROPE (2006).

DANIELA COIMBRA DE SOUZA 56
“Centrope is the lead project which develops a multilateral, binding and lasting cooperation framework for the collaboration of regions and municipalities, busi-ness enterprises and societal institutions in the Central European Region” (www.centrope.info). The launching idea was to “create a prospering European Region”, where a governance system could be established.
The project is financed 50% by the European Union, in the framework of the Structural Fund INTERREG III-A, and 50% by the three Austrian Federal prov-inces of the region: the governments of Lower Austria, Burgenland and Vienna.
The very first aims of Centrope were divulged at its launching event. The pro-ject was officially inaugurated by a meeting of local governors in September 2003 in the Austrian town of Kittsee. At the occasion, local governments signed the “Kittsee Declaration”,1 the three main statements of which could be roughly summarised as: 1) to establish a common region; 2) to create an internationally attractive location; 3) intensify co-operation, networking existing initiatives, com-municate the future potential of the region to the public at large and strengthen social and entrepreneurial commitment to the region.
Additional objectives of the project involve issues such as public relations, networking and communication; assistance to the coordination of existing cross-border activities; and mobilisation to engage public, commercial and social bodies in regional attempts. Further subjects are: research and training; economy and the labour market; regional development, infrastructures, culture, location marketing and the promotion of “success in competition between European regions” (CENTROPE, 2006).
Antecedents of the Centrope Project
Efforts have been made by Austria, and more specifically from Vienna, since the early 1990’s to establish co-operation with neighbours and “to maintain but also to extend its grown role as an attractive site for international co-operation and to po-sition itself as a competence centre of European co-operation” (Vienna–Stad-tregierung, 2004: 2).
Centrope is not a first action in this direction, some of previous attempts are: (a) the association of governments of Vienna, Lower Austria and Burgenland in the so called “Vienna-Region”; (b) the sequence of seminars in the years of 2000–02 with participants from four countries launched and coordinated by the Europaforum Wien, a Viennese non-profit organisation, by initiative of Vienna’s government; (c) the cross-border project DIANE (Direct Investment Agency Net), launched in 2002
1All Political Declarations of Centrope can be downloaded at http://centrope.info/baernew/topics/ Project_Conferences.
REGIONAL GOVERNANCE IN CENTRAL EUROPEAN REGION… 57
by the three local development agencies of the “Vienna-Region” to build a network of the local (governmental) development agencies of the four countries of Centrope.
Nonetheless, before the direct attempts, the Viennese government has made other movements to benefit from the fall of the socialist regimes in Eastern-Europe and to associate with its neighbours, which had already belonged to the same state during the Habsburg Empire at the 19/20th centuries.
The cooperation after the collapse of the Iron Curtain is considered “the return to a new normality”, as “only the political events of the 20th century that split this socially, economically and culturally integrated region into a space divided by bor-ders” (Centrope 2006: 5).
Although based on the partnership idea, Centrope Project represents, however, a shift in the traditional organisation of social forces in Austria. During the interwar years, Austria went through an economic crisis and the Vienna social democrat local government – known as “Red Vienna” – opted for a local welfare state to diminish the effects of the crisis. After World War II, the whole of Austria was embedded in a Fordist economic model supported by an alliance between produc-tive capital, the middle classes and organised labour. A restrictive wage policy – achieved by agreements with labour unions – and an expansive fiscal base pro-longed the lifespan of Austrian Fordism until the 1980’s (Becker–Novy, 1999).
Austria turned towards European unification to combat the crisis, by adopting a restrictive fiscal policy and privatisation. After Austria had joined the EU, the la-bour unions and new social groups became less capable to organise themselves and to react to the changes than the enterprise associations. New agreements with un-ions ended in more restrictive wage policies, which raised unemployment rates and reduced incomes. The new challenge was to improve international competitiveness; Vienna strived to “become an international finance and service centre”, turning itself into the “Gateway to the East” (Novy et al. 2001: 132). Local institutional changes aiming at the attraction of external investments included restructuring government towards an entrepreneurial model and new institutions that aim at giving local government better capacity to respond quickly and flexibly to inves-tors’ requests (Novy–Becker, 1998: 18). Business agencies were created to imple-ment new economic policy and large urban projects based on public–private part-nerships. The new planning forms were more open to the business sector and ap-pealed to a public of “qualified” persons. Planning started serving an “ideological shift towards entrepreneurialism, managerialism and business friendly policies” (Novy et al. 2001: 139). With these attempts Vienna has abandoned the corporatist system to enter an internationalised liberal European mode of governance.
DANIELA COIMBRA DE SOUZA 58
The Organisation of Centrope Project
Centrope’s regional development initiative reflects the Viennese ideological shift towards entrepreneurialism and its engagement in building joint proposals with its eastern neighbours. Vienna has a key role in the project, which is conducted mainly by Austrian partners. Four organisational bodies are involved in Centrope:
Political Conferences are the meetings of the heads of the sixteen local govern-ments of Centrope. It represents the higher decision level, which guides the opera-tive implementation of Centrope. So far there were three conferences, all in Aus-tria: the inauguration Conference in Kittsee (Burgenland), September 2003; the second in April 2005 in St. Pölten (Lower Austria); and the third in Vienna, in March 2006. The secretary board of Centrope (see below) translate the discussions of the Conferences into documents, the “Declarations”, which contain the political guidelines to all Centrope’s actions, their common view and desired common fu-ture.
Advisory Board is a discussion forum composed by two representatives of each local government of Centrope. The representatives are “normally from lower po-litical level or higher administrative level”. That could be, for example, political secretaries of the local executive government, local legislators (connected to the head of the executive) or heads of local offices (as in Vienna, whose main repre-sentative is the head of Planning office). The Board is only a consulting body, not a decision making level.
Steering Committee: is formed by the three Austrian Federal provinces that co-fund the Centrope project, i.e. the governments of Lower Austria, Burgenland and Vienna. The Committee is the actual executive decision making body, responsible for selecting the projects presented by the Consortium that will receive financial support, i.e. will have the authorisation to be implemented.
Consortium: is the executive body, responsible for practical everyday imple-mentation actions, i.e. “building the multilateral co-operation” by assisting the coordination of existing crossborders activities and the regional working groups, writing projects to submit to the Committee, selecting ideas, etc. The main tasks are executed by governmental agencies and collaborators. It is formed by the fol-lowing Austrian entities:
− Vienna Business Agency (WWFF), the city’s governmental development agency.
− Ecoplus: the governmental business agency of the province of Lower Austria. − WIBAG – Business Service Burgenland: the governmental province’s
agency. − Regional Consulting ZT Ltd: an Austrian private consulting company. − Europaforum Wien: a non-governmental and non-profit organisation, which
has the Viennese government as main and quasi exclusive client. It holds the
REGIONAL GOVERNANCE IN CENTRAL EUROPEAN REGION… 59
secretary function: elaborating communication material (as Political Declara-tions, website and planning documents), launching and coordinating meetings to strengthen regional cooperation and engagement of neighbours.
Planning, Participation and Discourse in Centrope
In this fashion, the planning and decision making of Centrope is conducted by the Political Conferences on the general strategy and by the Consortium and Steering Committee on the tactics and practical issues. Hence, two points are remarkable: the absence of non-governmental actors; and the concentration on the Austrian governments.
The second point is already a source of conflict, as non-Austrian governments complain of the lack of a common space for financial decisions. The intended so-lution is to foster complementary INTERREG projects under a Centrope umbrella, with non-Austrian governments as projects leaders and co-financers and, as a result able to take financial decisions. The first additional project is the Slovakian was to be launched at the end of 2006. The Czech one is ongoing.
Regarding the absence of private and civil society actors in Centrope, notably is the lack of formally institutionalized channels to incorporate the interests of non-public actors. The participation could solely be achieved in the working groups, the pilot projects or the Centrope Platform. The working groups are formed by “ex-perts” and organised to discuss development themes. They can produce diagnoses and “jointly deliberate on appropriate strategies and development steps” (www.centrope.info). However, the discussed themes are selected by the Consor-tium and the Secretariat is responsible for publicizing the results of groups’ discus-sions in Centrope informative channels. Moreover the “experts” are almost totally from local and regional governments or regional agencies.
Although any local actor can suggest projects, the pilot projects are launched by the Consortium, as it has the scope of writing projects and submitting them to the financial decision level: the Committee. They are implemented by various actors, but analogously to the working groups, it involves mainly public administrators. The Platform counts in its majority on private and civil society participants, on the other hand it is an information forum with no decision making or planning scope. With this concentration on state actors, the discourse is therefore constructed by collaborators of governmental of the above described organisational levels.
The principal planning document is the brochure “We grow together – Together we grow: Centrope Vision 2015” which consolidates the results of the third Political Conference, held in Vienna in March 2006. Furthermore, it brings a syn-thesis of the working groups and pilot projects results. The common “Vision” is focused in the selected regional themes such as economy, education and culture

DANIELA COIMBRA DE SOUZA 60
and others and describes the intended regional plan, the desired common future. Its object is to reach the population and promote the project to a mass public.
Official documents related to Centrope are differentiated according to two dif-ferent target groups, but have the common characteristic of advertising folders: one aims at the population in general in order to “communicate the future potential of the region to the public at large” (Kittsee Declaration 2003; www.centrope.info). These documents stress cultural and employment/labour issues, thereby, con-structing a regional identity. The second type of documents is directed towards investors and gives information concerning locational advantages of the region. It includes information on tax cuts for corporations and all kinds of governmental subsidies or services offered.
As showed, the main actors in Centrope come from government or outsourced public bodies. These are highly educated and cosmopolitan bureaucrats who be-come key opinion maker and “organic intellectuals” (Gramsci, 1971) of regional integration. They form an increasingly internationalized elite network and elaborate their own “discourse of competence” (Chaui, 2000), which incorporates and institutionalizes new (mainly liberal) ideas and embeds it in everyday practices and common sense through documents and speeches that contain selected narratives.
Governance in Centrope
The conception of Centrope is an attempt to create at the same time a region and a mode of governance. It is a spatial as well as political innovation. This final section will display some preliminary analysis of this new arrangement by focusing on the new institutions and its balance of power and the participation of regional actors.
Centrope is a region with no constitutional status, but a long history. It articu-lates local and state governments, two federal units, in a supra-regional territory. Czech Republic, Hungary and Slovakia are unitary states, which implemented de-centralisation recently during adhesion to EU. In its totality, Centrope is a trans-borders and trans-national region as well as a top-down initiative of public policy. The region has not only a historical root, but is increasingly becoming a meaning-ful territory for living, working and investing. They condense relations of produc-tion and reproduction, regulation and accumulation and institutionalize socioeco-nomic relations, a prerequisite for formation of new territory. It shows that the regional level is becoming more suited to the challenges of socio-spatial restruc-turing than the local.

REGIONAL GOVERNANCE IN CENTRAL EUROPEAN REGION… 61
Institutional changes to a new region?
The role of the involved governments in Centrope is marked by leading executive powers that foster relatively homogeneous strategies and discourses.
Involved in governance system are the head of local governments (in the Politi-cal Conferences of Centrope) and development agencies, which belong to or con-centrate only representatives of the executive. The result is a concentration of au-thority in the executive power. The system formally opens space for local and re-gional legislators; however, room is given solely in a discussion forum (Advisory Board). Besides, the degree of their participation is minimal.
In addition, the leading role of executive power is reinforced the “flexible” agencies responsible for implementing regional development projects. The forma-tion of governance institutions in the case resulted in creation of more governmen-tal instances (development agencies) or enhancement of scope of existing ones, instead of resulting in a minimal state. The mainly public funding of initiatives, moreover, is also present in the case.
The chosen economic strategies for development emphasise the discourse of promoting the region by regional marketing, efficiency and competitiveness. Focus is on attracting foreign investments by advertising the region and on employment generation by labour market strategies that attract new companies (e.g. fostering professional qualification and advertising the qualities of their labour force). The attraction of new investments focuses in the automotive industry and modern ser-vice-firms. Supporting enterprises is also a main issue.
Implementing these economic development strategies and providing support services to enterprises became a responsibility of the governmental agencies. How-ever the embedded discourses of competence and of New Public Management re-quired a new organisational model, in order to ensure competitiveness. This guide-line asserted by top strategic level (normally the head of executive) increases the confusion of function of these agencies between public and private organisational models, principles and images. Consequently, the collaborators of agencies interi-orize the above mentioned discourses and tend to see themselves as working in efficient private services pools that implement the best strategies for development. Therefore, they reinforce the entrepreneurs discourse by knowledging technologies as meetings, planning and advertising documents, conversations with other gov-ernmental spheres and with entrepreneurs (Sum, 2005). Their everyday practices are changed in order to fit into the “modern and efficient” discourses of compe-tence and of New Public Management.

DANIELA COIMBRA DE SOUZA 62
Growth Alliances and Participation
Concerning the growth alliances in the governance system of Centrope notably is the lack of incorporation of workers in the governance institutions and planning procedures. In Centrope the former Austrian corporatist tradition based on a tripar-tite alliance between state, capital and labour is gradually disappearing.
On the other hand, strong in Centrope is the main intention of building cross-borders co-operation systems to strengthen entrepreneurial commitment to the re-gion. However, a long-lasting articulation of public and private actors has not yet been achieved, although it has contributed to the organization of capital in space: i.e. in Centrope occurred a stronger association and dialogue between the institu-tions representatives of enterprises (as industrial and business organisations). This reveal a improved capacity of enterprises to organise themselves regionally for lobbying and influencing planning, though using different channels than those in-stitutionalized by the intended regional governance system.
The structure of governance system permits a type of participation of entrepre-neurs connected to short term interests. This is mainly due leading role of executive above affirmed and the absorption by governments of the mainstream discourse of governance, which preaches that the participation and incorporation of private ac-tors must be actively encouraged. The concentration of power and actions on ex-ecutive results in obstacles to accountability and social control and enhances the effectiveness of dominant private actors’ lobby, which can concentrate their de-mands in one destiny. The governance discourse enthusiastically assimilated gen-erally leads governments to celebrate any participation of entrepreneurs in planning and dialogue. As a consequence their demands tend to be promptly accepted.
Moreover, the structure benefits large enterprises by the privileged incorpora-tion of business associations, generally administrated by large enterprises, even when majority of their members are small and medium firms. The lack of formal participation channels beyond those large enterprises as small firms, communities and population boosts narrow and exclusive mode governance.
Hence, room is given to private actors to participate in occasions connected to their short term interests but a solid and long lasting cooperation is not yet clearly achieved. Austrians invest heavily in its neighbouring countries (Musil, 2005), but these investors are not formally represented or participating in Centrope. Raffeisen, an Austrian bank, promotes its own website (www.centrope.at) and activities on Centrope, parallel to the governmental attempts. The Austrian Industrial Chambers sponsor an own “Centrope Platform” that gathers together industrials of Centrope region to discuss their intentions and needs, but this attempt is not connected to the official governance system.
In this sense, although the analysed experience of association of local govern-ments have built a new region and created conditions of furthering commodifica-

REGIONAL GOVERNANCE IN CENTRAL EUROPEAN REGION… 63
tion, by reinforcing the discourse of competitiveness and embedding the belief that an environment favourable to capital is the only requirement to employment gen-eration, the local governance systems did not achieve to connect big capital with local space. Instead, fragile and temporarily alliances were formed. The formation of accountable institutions for a continuing dialogue and for resource sharing be-tween broad ranges of relevant actors is not yet a reality in the Centrope region.
References
Anderson, P. 1980: Lineages of the Absolutist State. London: Verso Editions. Becker, J.–Novy, A. 1999: Divergence and Convergence of National and Local Regulation: the Case
of Austria and Vienna. In: European Urban and Regional Studies 6 (2), 127–143. CENTROPE 2006: We grow together – Together we grow: Centrope Vision 2015. Federal Provinces
of Lower Austria, Burgenland and Vienna. Chaui, M. 2000: Cultura e Democracia: o discurso competente e outras falas. São Paulo: Ed. Cortez. Gramsci, A. 1971: Selections from the Prison Notebooks. Edited and translated by Qu. Hoare and G.
N. Smith. London: Lawrence & Wishart. Harvey, D. 1989: From Managerialism to Entrepreneurialism: The Transformation in Urban
Governance in Late Capitalism. In: Geografiska Annaler B 713–17. Hobsbawm, E. 1990: Nations and Nationalism since 1780. Programme, Myth, Reality. Cambridge:
Press Syndicate of the University of Cambridge. Jessop, B. 2002: The Future of the Capitalist State. Cambridge: Polity Press. Jessop, B. 2003. Governance and meta-governance. On Reflexivity, Requisite Variety, and Requisite
Irony. In: Henrik P. Bang (ed.): Governance as social and political communication. Manchester: Manchester University Press. 101–116.
Moulaert, F.–Sekia, F. 2003: Territorial Innovation Models: a critical survey. In: Regional Studies 37 (3), 289–302.
Moulaert, F.–Swyngedouw, E.–Rodriguez, A. (eds.) 2002: The Globalized City. Economic restructuring and social polarization in European Cities. Oxford: Oxford University Press.
Musil, R. 2005: Wien in der internationalen Städtehierarchie: von der West-Ost-Drehscheibe zur Global City? In: Mittelungen der Österreichischen Geographischen Gesellschaft (147), 161–181.
Novy, A. – Redak, V. Jäger, Johannes/Hamedinger, A. 2001: The End of Red Vienna: Recent Ruptures and Continuities in Urban Governance. In: European Urban and Regional Studies 8 (2), 131–144.
Palme, G.–Feldkircher, M 2005: Centrope – Europa Region Mitte: eine Bestandsaufnahme. In: WIFO.
Sum, Ngai-Ling 2005: Towards a Cultural Political Economy: Discourses, Material Power and (Counter-) Hegemony. In: DEMOLOGOS FP 6 Project.
Swyngedouw, E. 1997: Neither global nor local: ‘glocalization’ and the politics of scale. In: K. R. Cox (ed.): Spaces of Globalization: Reasserting the Power of the Local. New York: Guilford. 137–166.
Swyngedouw, E. 2005: Governance Innovation and the Citizen: The Janus Face of Governance-beyond-the-state. In: Urban Studies 42 (11), 1991–2006.

DANIELA COIMBRA DE SOUZA 64
Swyngedouw, E. – Jessop, B. 2006: Regulation, reproduction, and Governance: Achilles’ heel of Development” Theoretical Synthesis Paper 3. In: DEMOLOGOS FP 6 Project.
Szücs, J. 1990: Die drei historischen Regionen Europas. Frankfurt/M. Vienna, City of/Stadtregierung, Wiener 2004: A glance on INTERREG. Magistrat Abteilung 27/EU
Strategy and Economic Development (eds.): Wiener Stadtregierung. The author would like to thank Darek Swiatek for the map and Andreas Novy for the comments, though the author still responsible for all contents of the paper.

REGIONAL PERSPECTIEVES

DANIELA COIMBRA DE SOUZA 66

ENVIRONMENTAL CONDITIONS AS A DRIVING FORCE OF REGIONAL DEVELOPMENT IN POLAND
MAREK DEGÓRSKI
Introduction
In the perception of numerous social groups environment has been, and still often is, seen as a little important part of the socio-economic system, whose management is frequently in conflict with regional development, both in spatial and in purely economic terms. The economic benefits resulting from the management of the en-vironment are seen only in the exploitation of natural resources, which are tradi-tionally treated to be the original source of economic growth. Over centuries, ex-ploitation and processing of these resources constituted the foundations for the economic development of nations, for the economic and political strategies, as well as for the theories of economic growth, and this with doubtless success. Obviously, the man-environment relations, based uniquely on the policy of exploitation of natural resources, started to have negative consequences for people. New, unprece-dented in geographical space, extreme phenomena and processes emerged, having contributed in the last decades of the 20th century to the deeper reflection of men on their relations with respect to the environment, and, consequently, to the new pro-jections of directions for the development of civilization.
During the 1970s the criticism of the socio-economic development patterns to date started to amplify. Limits to growth became an explicit subject of considera-tion (Meadows et al. 1973), in connection with the “zero growth” or “organic growth” concepts (Mesarovic–Pestel, 1977), which ultimately led to the idea of sustainable development (WCED, 1987). In the same period, as well, a new vision was defined of the functioning of people in the environment, referred to as the socio-ecological system (SES), understood to be constituted by the intimately linked and mutually interacting two components: the natural and the human re-sources (Holling, 1973). In this concept, environment is assigned not only the eco-nomic functions, but also the social (related to health, recreation, culture, educa-tion, etc.) and the ecological ones (buffering, regulation of the matter and energy cycles, etc.). It was noted that when looking at the environment only in the per-spective of acquisition of goods, human kind destroys itself, or at least worsens the qualities of its living conditions.
It was noted, at the same time, that implementation of principles of sustainable development and optimization of use of the resources extracted from the natural

MAREK DEGÓRSKI 68
environment may constitute a very important factor of economic development. Such activities lead, in particular, to appearance of new investment projects, fre-quently supported with external sources, to establishment of new jobs, to develop-ment of technical infrastructure, etc. They also produce very significant social ef-fects, since they develop in the societies the awareness of individual responsibility for the common good, constituted by the natural environment.
The purpose of the present paper is to assess the influence exerted by the solu-tions related to environmental management, which are conforming to the principles of sustainable development, on the system of the socio-economic environment. The analysis of these relations on the example of Poland, and determination how in the years 2000–2005 investments into protection of the most valuable resources of the environment and into the improvement of their quality contributed to economic and social activation of the regions, especially those encompassed by the assistance from the European Union in the frameworks of the Cohesion Fund and the Com-petitiveness Programme, financed out of the European Regional Development Fund (ERDF). The paper aims also at the determination of the interdependence between the increase of the investment outlays into environmental protection and the improvement of economic attractiveness of the areas encompassed by the pro-ecological activity.
Multi-functionality of the natural environment and the socio-economic system
In contemporary world, with the growing pro-ecological consciousness of the so-cieties of many countries, especially the highly developed ones, the role of the natural environment, as an integral part of the mega-system of geographical envi-ronment, which encompasses the socio-economic and the natural systems, being mutually the subject and the surrounding of the respective systems, is being in-creasingly recognised (Degórski, 2005). The multi-functionality of the natural en-vironment, and, in particular, its role in formation of the human quality of life, is noted. Given the fact that the respective functions are not only of generally natural and ecological (non-economic) character, but display also the socio-economic as-pect (Łaguna, 2004; Łaguna–Witkowska-Dąbrowska, 2005), including, in par-ticular, the support from the natural and mineral resources, absorption of pollutant emissions and waste accumulation, or habitat and landscape properties for human relaxation (Figure 1), they are increasingly perceived as the elements of develop-ment of individual regions, countries, etc.
This kind of approach causes that the improvement of the living standards of the population is seen no longer only in the perspective of the economic and social

ENVIRONMENTAL CONDITIONS AS A DRIVING FORCE OF REGIONAL … 69
development, but also of the care for the natural environmental resources, as ex-pressed through the optimisation of use and management of their potential. This is implemented with the use of the concept of sustainable development, this imple-mentation requiring a number of logistic and economic activities. These activities are very often, in turn, an activating factor for the economic development of given country, since they require new investment projects, enabling production of the pro-ecological equipment, construction or modernisation of infrastructure associ-ated with sewage and waste-water economy, solid waste management, or applica-tion of new solutions in power generation or transport. Hence, these activities con-stitute the stimuli for such sectors of economy as construction, trade, transport and service.
Figure 1 Environmental functions
Source: Own elaboration.
The need for such activities and their cost intensity is best seen in those coun-tries, where the delay in the introduction of principles of sustainable development is especially serious. A striking example in this sense is provided by the countries of the Central and Eastern Europe, which, prior to accession, had been character-ised by a very liberal policy with respect to the care for the quality of the natural environment, particularly with respect to minimisation of the negative effects of the human impact on the functioning of the natural system. It was only the inclusion of
Quality of life for society
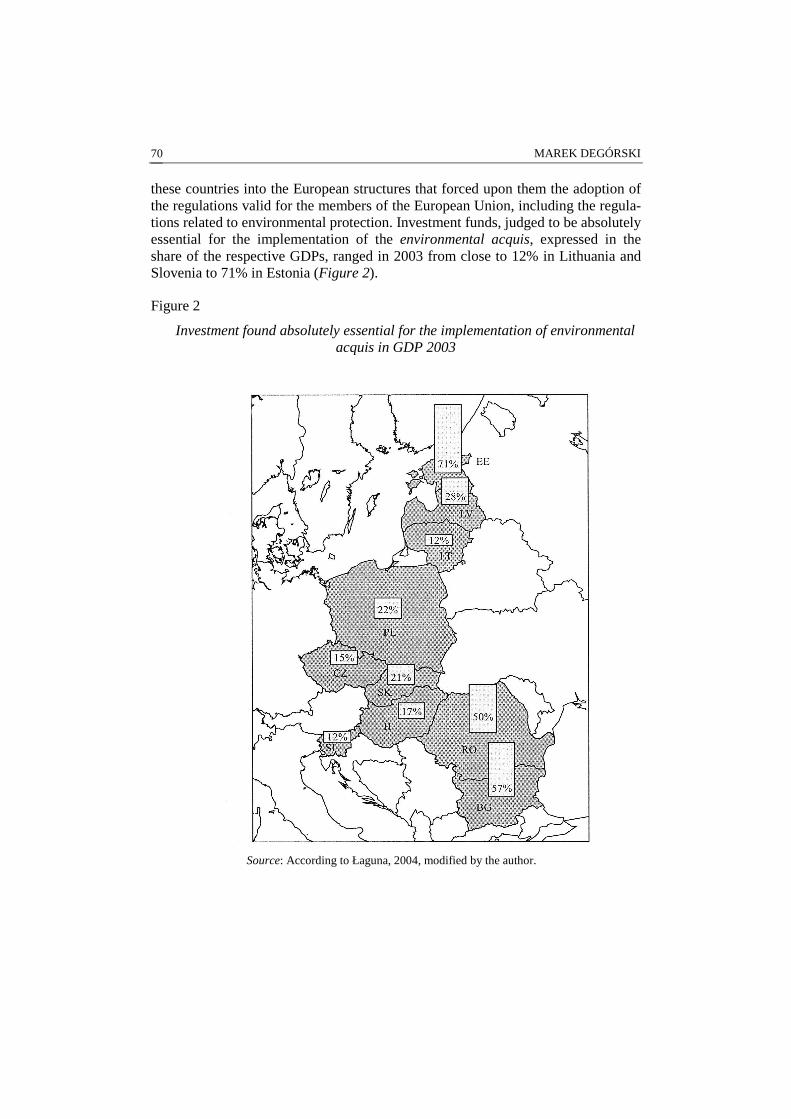
MAREK DEGÓRSKI 70
these countries into the European structures that forced upon them the adoption of the regulations valid for the members of the European Union, including the regula-tions related to environmental protection. Investment funds, judged to be absolutely essential for the implementation of the environmental acquis, expressed in the share of the respective GDPs, ranged in 2003 from close to 12% in Lithuania and Slovenia to 71% in Estonia (Figure 2).
Figure 2
Investment found absolutely essential for the implementation of environmental acquis in GDP 2003
Source: According to Łaguna, 2004, modified by the author.

ENVIRONMENTAL CONDITIONS AS A DRIVING FORCE OF REGIONAL … 71
In addition, these activities require constant monitoring, which, on the one hand, includes the controlling functions with respect to the principles of realisation of the obligations, adopted by the state, resulting from the environmental acquis, while, on the other hand, is subject itself to the audit, including the module of the evalua-tion indicators used (Borys, 2005). The correctly and properly conducted monitor-ing activities, yielding an increasingly good recognition of the processes and phe-nomena, taking place in the system of geographical environment, aid also in the development of the environmental-social concepts, and, in particular, in construc-tion of the economic-ecological models.
Economic-ecological models
The concept of the socio-ecological system is still undergoing verification, and continuing studies are carried out on the flexibility of the system with respect to external factors (Carpenter et al., 2005) and determination of the directions of ac-tion, meant to optimise the use and protection of natural environmental resources (Barrenda and Georgantzis, 2000), as well as generation of development of the multifunctional landscape (Degórski, 2003). Socio-ecological models are being developed (Nijkamp, 1987; Domański, 2004), linking technical and procedural solutions having been applied for years in the single-discipline models (ecological and economic), internalizing the mutual relations between the economic and natu-ral processes, taking place in the environment.
The primary method of model integration is selection and linkage of the single-discipline models for the purpose of construction of multiple-discipline models. Another approach to the development of the integrated models consists in holistic modelling. Instead of linking the detailed models into the increasingly complex formulas, in the holistic models efforts are made to construct one model, encom-passing the respective whole. The ecological-economic constructs are becoming more and more numerous and spread out, forming an important branch of model-ling, to which, in particular, application-oriented implementation of the sustainable development concept essentially contributed. Among the most frequently applied models one should mention input-output, extended, environmental quality and energy policy models.
Input-output models
Input-output models, being effective tools for describing regions and regional systems, used before for determining flows between branches, nowadays account for the input-output coefficients expressing the flows of goods between the econ-omy and the natural environment, that is – between the economic system and the ecological system. One of the basic objectives of application of these models is to
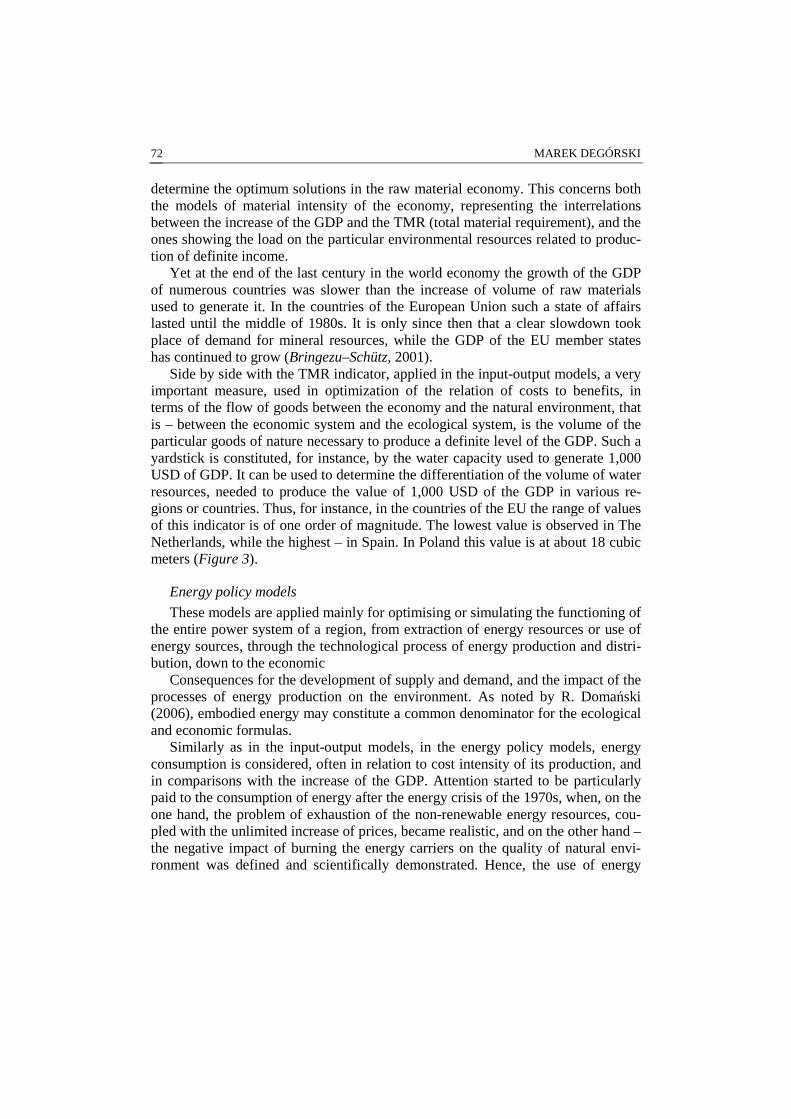
MAREK DEGÓRSKI 72
determine the optimum solutions in the raw material economy. This concerns both the models of material intensity of the economy, representing the interrelations between the increase of the GDP and the TMR (total material requirement), and the ones showing the load on the particular environmental resources related to produc-tion of definite income.
Yet at the end of the last century in the world economy the growth of the GDP of numerous countries was slower than the increase of volume of raw materials used to generate it. In the countries of the European Union such a state of affairs lasted until the middle of 1980s. It is only since then that a clear slowdown took place of demand for mineral resources, while the GDP of the EU member states has continued to grow (Bringezu–Schütz, 2001).
Side by side with the TMR indicator, applied in the input-output models, a very important measure, used in optimization of the relation of costs to benefits, in terms of the flow of goods between the economy and the natural environment, that is – between the economic system and the ecological system, is the volume of the particular goods of nature necessary to produce a definite level of the GDP. Such a yardstick is constituted, for instance, by the water capacity used to generate 1,000 USD of GDP. It can be used to determine the differentiation of the volume of water resources, needed to produce the value of 1,000 USD of the GDP in various re-gions or countries. Thus, for instance, in the countries of the EU the range of values of this indicator is of one order of magnitude. The lowest value is observed in The Netherlands, while the highest – in Spain. In Poland this value is at about 18 cubic meters (Figure 3).
Energy policy models
These models are applied mainly for optimising or simulating the functioning of the entire power system of a region, from extraction of energy resources or use of energy sources, through the technological process of energy production and distri-bution, down to the economic
Consequences for the development of supply and demand, and the impact of the processes of energy production on the environment. As noted by R. Domański (2006), embodied energy may constitute a common denominator for the ecological and economic formulas.
Similarly as in the input-output models, in the energy policy models, energy consumption is considered, often in relation to cost intensity of its production, and in comparisons with the increase of the GDP. Attention started to be particularly paid to the consumption of energy after the energy crisis of the 1970s, when, on the one hand, the problem of exhaustion of the non-renewable energy resources, cou-pled with the unlimited increase of prices, became realistic, and on the other hand – the negative impact of burning the energy carriers on the quality of natural envi-ronment was defined and scientifically demonstrated. Hence, the use of energy
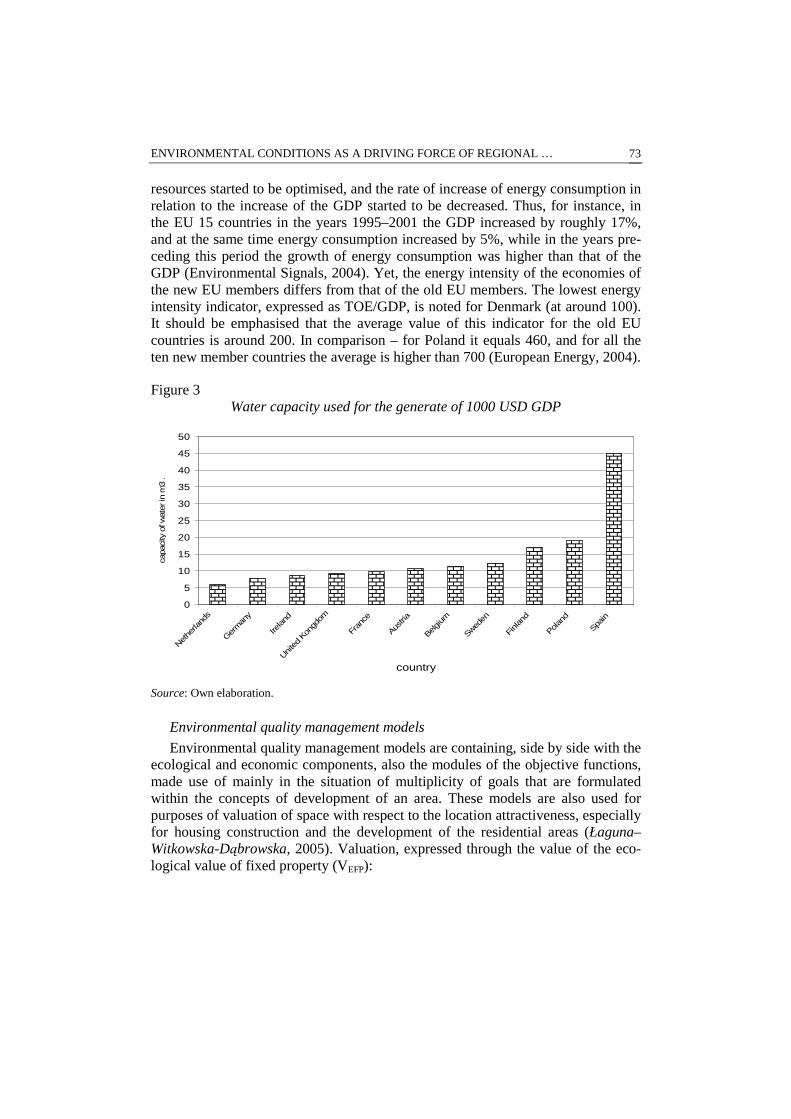
ENVIRONMENTAL CONDITIONS AS A DRIVING FORCE OF REGIONAL … 73
resources started to be optimised, and the rate of increase of energy consumption in relation to the increase of the GDP started to be decreased. Thus, for instance, in the EU 15 countries in the years 1995–2001 the GDP increased by roughly 17%, and at the same time energy consumption increased by 5%, while in the years pre-ceding this period the growth of energy consumption was higher than that of the GDP (Environmental Signals, 2004). Yet, the energy intensity of the economies of the new EU members differs from that of the old EU members. The lowest energy intensity indicator, expressed as TOE/GDP, is noted for Denmark (at around 100). It should be emphasised that the average value of this indicator for the old EU countries is around 200. In comparison – for Poland it equals 460, and for all the ten new member countries the average is higher than 700 (European Energy, 2004).
Figure 3 Water capacity used for the generate of 1000 USD GDP
0
5
10
15
20
25
30
35
40
45
50
Nethe
rland
s
Ger
man
y
Ireland
United Kon
gdom
Fran
ce
Austria
Belgium
Sweden
Finlan
d
Polan
d
Spain
country
capa
city
of w
ater
in m
3 .
Source: Own elaboration.
Environmental quality management models
Environmental quality management models are containing, side by side with the ecological and economic components, also the modules of the objective functions, made use of mainly in the situation of multiplicity of goals that are formulated within the concepts of development of an area. These models are also used for purposes of valuation of space with respect to the location attractiveness, especially for housing construction and the development of the residential areas (Łaguna–Witkowska-Dąbrowska, 2005). Valuation, expressed through the value of the eco-logical value of fixed property (VEFP):
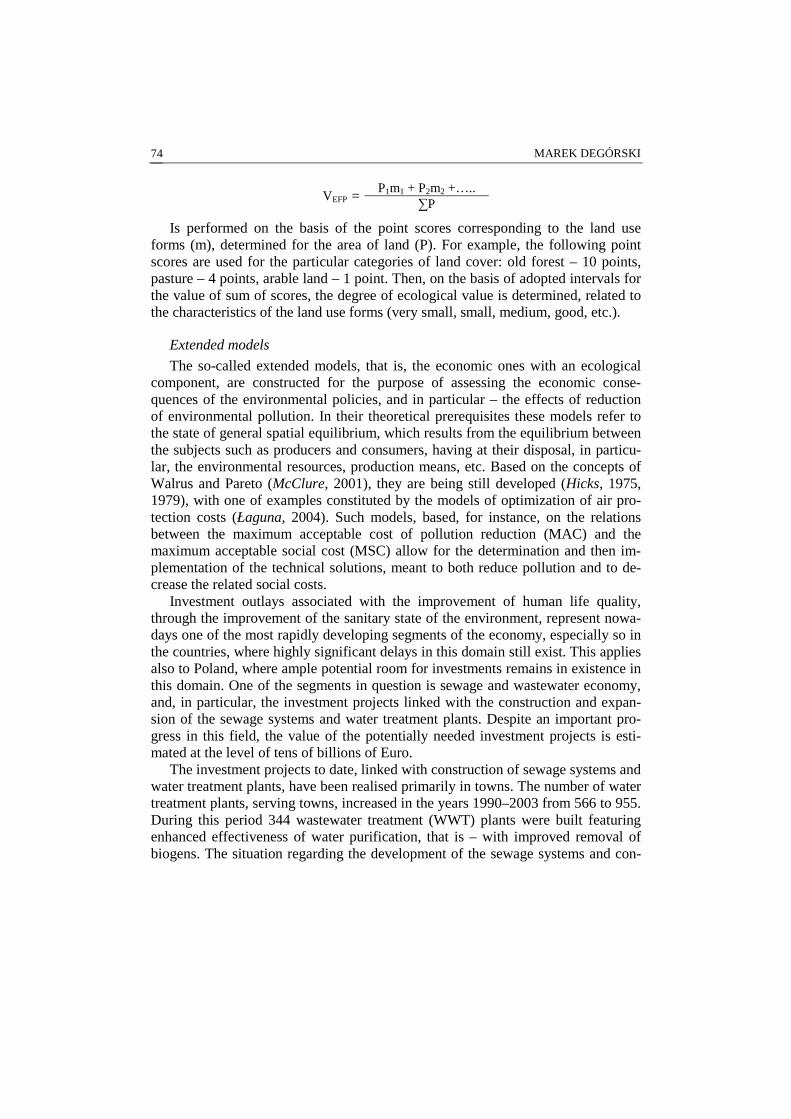
MAREK DEGÓRSKI 74
VEFP = P1m1 + P2m2 +…..
∑P
Is performed on the basis of the point scores corresponding to the land use forms (m), determined for the area of land (P). For example, the following point scores are used for the particular categories of land cover: old forest – 10 points, pasture – 4 points, arable land – 1 point. Then, on the basis of adopted intervals for the value of sum of scores, the degree of ecological value is determined, related to the characteristics of the land use forms (very small, small, medium, good, etc.).
Extended models
The so-called extended models, that is, the economic ones with an ecological component, are constructed for the purpose of assessing the economic conse-quences of the environmental policies, and in particular – the effects of reduction of environmental pollution. In their theoretical prerequisites these models refer to the state of general spatial equilibrium, which results from the equilibrium between the subjects such as producers and consumers, having at their disposal, in particu-lar, the environmental resources, production means, etc. Based on the concepts of Walrus and Pareto (McClure, 2001), they are being still developed (Hicks, 1975, 1979), with one of examples constituted by the models of optimization of air pro-tection costs (Łaguna, 2004). Such models, based, for instance, on the relations between the maximum acceptable cost of pollution reduction (MAC) and the maximum acceptable social cost (MSC) allow for the determination and then im-plementation of the technical solutions, meant to both reduce pollution and to de-crease the related social costs.
Investment outlays associated with the improvement of human life quality, through the improvement of the sanitary state of the environment, represent nowa-days one of the most rapidly developing segments of the economy, especially so in the countries, where highly significant delays in this domain still exist. This applies also to Poland, where ample potential room for investments remains in existence in this domain. One of the segments in question is sewage and wastewater economy, and, in particular, the investment projects linked with the construction and expan-sion of the sewage systems and water treatment plants. Despite an important pro-gress in this field, the value of the potentially needed investment projects is esti-mated at the level of tens of billions of Euro.
The investment projects to date, linked with construction of sewage systems and water treatment plants, have been realised primarily in towns. The number of water treatment plants, serving towns, increased in the years 1990–2003 from 566 to 955. During this period 344 wastewater treatment (WWT) plants were built featuring enhanced effectiveness of water purification, that is – with improved removal of biogens. The situation regarding the development of the sewage systems and con-

ENVIRONMENTAL CONDITIONS AS A DRIVING FORCE OF REGIONAL … 75
struction of the WWT plants is much worse within the rural areas, where only 16.5% of the inhabitants are served by the WWT plants (compared to 84.2% for towns). The lowest shares of the inhabitants, serviced by the WWT plants occur in the central and eastern parts of the country (Figure 4).
Figure 4 People served by sewage treatment plant in Poland
Source: According to Węcławowicz et al. 2006.

MAREK DEGÓRSKI 76
An instrument, which can be made use of for the purposes of improving quality of life on the rural areas through realisation of pro-ecological investment projects or programs of protection of the most valuable fragments of the environment, is constituted by the Agricultural Funds, especially on the areas characterised by an intensive farming economy (Meyer, 2005). European Commission planned the funding of such programs for rural areas in 2007–2013 at the level of 77.66 billion €, with additional 10.23 billion € meant for Bulgaria and Romania.
The largest beneficiary of the means, directed by the European Commission for the development of rural areas (77,66 billion euro), will be Poland, whose share will amount to more than 13 billion € (Figure 5), which constitutes more than 17% of all the EU means devoted to the development of rural areas (Figure 6). A part of these means will be directed to realization of the so-called agricultural-environ-mental programs, whose task it is to optimise the functioning of the natural envi-ronment on rural areas. The more particular examples include, inter alias, the im-plementation of the Ramsar Convention on Wetlands (United Kingdom), develop-ment of wind energy (Scotland), development of agro-environmental schemes (Austria), or NATURA 2000 wildlife habitat protection programme (Germany, Poland).
Figure 5 Rural funding shares conform by European Commission for 2007–2013
0
2 000 000 000
4 000 000 000
6 000 000 000
8 000 000 000
10 000 000 000
12 000 000 000
14 000 000 000
Belgium
Czech
Repu
blic
Denm
ark
Germ
any
Estonia
Greec
eSpa
in
Franc
e
Irelan
dIta
ly
Cypru
s
Latvi
a
Lithua
nia Lux
Hungar
yMalt
a NL
Austria
Poland
Portu
gal
Sloven
ia
Slovak
ia
Finlan
d
Sweden UK
country
Eur
o
Source: Own elaboration.

ENVIRONMENTAL CONDITIONS AS A DRIVING FORCE OF REGIONAL … 77
Figure 6
The percentage participation of each states in EU rural funding for 2007–2013
0.0
2.0
4.0
6.0
8.0
10.0
12.0
14.0
16.0
18.0
Belgiu
m
Czech
Rep
ublic
Denm
ark
Germ
any
Eston
ia
Gre
ece
Spain
Franc
e
Irelan
dIta
ly
Cypru
s
Latvi
a
Lith
uania Lu
x
Hunga
ry
Malt
a NL
Austri
a
Poland
Portu
gal
Slove
nia
Slovak
ia
Finlan
d
Sweden UK
country
%
Source: Own elaboration.
Cohesion through competitiveness
One of the instruments, enabling verification and application of ecological-eco-nomic models, is constituted by the operational actions, implementing the multiple option results from the ecological-economic models. The cost of optimisation of the social development with the use of natural resources and the economic basis is covered most often from own means of a given country, although it is increasingly often supported from the international funds, which results from the increase of awareness of many societies that the openness of the system of natural environment precludes any boundaries, and that it is the common good shared by all the citizens of the globe. In case of the new EU member countries such a role is played by the Cohesion Fund and the Competitiveness Programs, financed from the European Regional Development Fund (ERDF). It is owing to the support from these sources that the investments made into protection of the most valuable environmental re-sources and improvement of their quality, contributed to economic and social acti-vation of the respective regions. Oftentimes, regions, according to the principles of competitiveness, try to achieve increasingly good effects of implementation of the

MAREK DEGÓRSKI 78
sustainable development precepts and to attain better environmental conditions for social development.
Poland, being a country having taken advantage of the EU assistance funds al-ready during preparation for accession, gained an even broader access to the EU means after having joined the European structures. The number of projects in-creased (Figure 7), along with the outlays into their realisation, including the pro-portion of the contribution from the regional development funds (Figure 8). In the years 2000–2005 altogether 86 projects were implemented in Poland, with joint outlays on them equal 4.49 billion €. Poland obtained from the means of the so-called Cohesion Fund of the EU 2.83 billion €. Unit value of individual projects was significantly differentiated. The project with the highest value of means di-rected to its realisation was the third stage of water supply and treatment system in Warsaw – 405.54 million €, funded by the Cohesion Fund of the EU in 248.06 million EU.
Figure 7 Number of project supported by Cohesion Fund of the EU
0
5
10
15
20
25
2000 2001 2002 2003 2004 2005
Source: Own elaboration.

ENVIRONMENTAL CONDITIONS AS A DRIVING FORCE OF REGIONAL … 79
Figure 8
Total value of the regional development projects realized in Poland, including the proportion of the contribution from the Cohesion Funds of EU
0
200
400
600
800
1000
1200
1400
2000 2001 2002 2003 2004 2005
years
mln
Eur
o
Value of project Funded by Cohesion Funds of EU Source: Own elaboration.
Conclusion
In the contemporary world natural environment constitutes a very important ele-ment of the entire geographical mega-system, and its qualities and resources are an economically measurable element of the economy, which is often the driving force of regional development. Hence, using the assets of nature in the policies of re-gional development is highly promising for the future, in view of the directions of development of the economies of numerous countries, referring to the concept of sustainable development.
On the basis of the results presented it can therefore be stated that:
− environment is playing a very important role in socio-economic development − the economic-ecological models are very useful for estimation of sustainable
development on local and regional levels − cohesion through competitiveness is a very important instrument in regional
development.

MAREK DEGÓRSKI 80
References
Barrenda, I.–Georgantzis, N. 2000: The interaction between economies and the natural space, [in:] N. Georgantzis and . Brenda Tarrazona editors, Spatial Economics and Ecosystems. The interaction between economics and the natural environment. WIT PRESS, Southampton, Boston, 1–8.
Berbeka K., 2005, Konsekwencje wdraŜania dyrektyw ekologicznych UE dla konsumpcji gospodarstw domowych w Polsce, Wyd. AE w Krakowie, Kraków.
Borys, T. 2005: Indicators for sustainable development – Polish experiences, Wydawnictwo Ekonomia i Środowisko, Warszawa-Białystok.
Bringezu, S. – Schütz, H. 2001: Total material requirement of the European Union, Technical Report, 55, European Environment Agency, Copenhagen.
Brodniewicz, E.–Poskrobko, B. 2003: Nakłady na ochronę środowiska. Metodyka i wyniki badań. Wydawnictwo Ekonomia i Środowisko, Białystok.
Carpenter, S.–Westley, F.–Turner, M. 2005: Surrogates for resilience of social-ecological systems. Ecosystems. 8. 941–944.
Degórski, M. 2003: Some aspects of multifunctional landscape character in the interdisciplinary envi-ronmental study. [w:] Katharina Helming and Huberd Wiggering editors, Sustainable develop-ment of Multifunctional Landscapes, Springer–Verlag, Berlin, Heidelberg, New York, p. 53–65.
Degórski, M. 2005: Środowisko przyrodnicze a środowisko geograficzne, [w:] W. Maik, K. Rembowska, A. Suliborski red., Geografia jako nauka o przestrzeni, środowisku i krajobrazie. Podstawowe Idee i Koncepcje w Geografii. 1. p. 116–129.
Domański, R. 2004: Geografia ekonomiczna, ujecie dynamiczne, PWN, Warszawa. Domański, R. 2006: Gospodarka przestrzenna, podstawy teoretyczne, PWN, Warszawa. Environmental Signals, 2004: A European Environment Agency update on selected issue, European
Environment Agency, Copenhagen. European Energy, 2004: European Union energy & transport in figures: European Community, 2003.
Luxembourg. Hicks, J. 1979: The Formation of an Economist, Banca Nazionale del Lavoro Quarterly Review. Hicks, J. 1975: The Scope and Status of Welfare Economics, Oxford University Press. Holling, C., 1973, Resilience and stability of ecological systems. Annual Review of Ecology and
Systematics. 4. p. 1–23. Łaguna, T. 2004: Ekonomiczne podstawy zarządzania środowiskiem i zasobami naturalnymi,
Ekonomiczne i ekologiczne aspekty gospodarki przestrzennej, Olsztyn, 176. Łaguna, T.–Witkowska-Dabrowska, M. 2005: Ekonomiczne podstawy zarządzania środowiskiem i
zasobami naturalnymi, Wydaw. Ekonomia i Środowisko, Białystok. McLure, M. 2001: Pareto, Economics and Society The mechanical analogy. Routledge Studies in the
History of Economics, Library Binding, Routledge, London–New York. Meadows, D. 1973: Granice wzrostu, PWE, Warszawa. Mesarovic, M.–Pestel, E. 1977: Ludzkość w punkcie zwrotnym, PWE, Warszawa. Meyer, B. 2005, Sustainable land use in intensively used agricultural regions,Landscape Europe,
Information Press, Oxford. Nijkamp, P. 1987: Economic modelling, shortcomings and perspectives, [w:] L. Braat i W. Lierop,
Economic-ecological modelling, Nort-Holland, Amsterdam. Pearce, D.–Tuner, R. 1990: Economics of Natural Resources and the Environment, Harvester
Whesatsheaf, New York–London–Sydney–Tokyo. WCED, 1987: Sustainable Development, Brundtland Report. World Commission on Environment
and Development. Węcławowicz, G.–Bański, J.–Degórski, M.–Komornicki, T.–Korcelli, P.–Śleszyński P. 2006:
Przestrzenne Zagospodarowanie Polski na początku XXI wieku. IGiPZ PAN, Monografie, 6, Warszawa.

REFLECTIONS ON APPROACHES TO (REGIONAL) ECONOMIC DEVELOPMENT OF SLOVAKIA 1
VLADIMÍR SZÉKELY
Introduction
Slovakia is characterised not only by differences between urban and rural areas but also by spatial dichotomy between the west and east, as well as the centre and pe-riphery of the country. These differences sometimes exceed the acceptable limits and call for an efficient regional policy based on a widely elaborated theoretical knowledge of causes, manifestations and possible ways to reduce the unwanted level of spatial differentiation. In principle, there are two kinds of theoretical con-ceptions of regional development: those based on the conviction that regional dis-parities diminish under the effect of development (convergent conceptions based on the theory of regional balance) and those that lean on the assumption that re-gional disparities increase under the effect of development – divergent conception or the theory of regional imbalance.
Approaches to the (regional) economic development of Slovakia in this study are reviewed from the point of view of the National Strategic Reference Frame-work 2007–2013 (hereafter NSRF, website of the Ministry of Construction and Regional Development of the SR www.build.gov.sk). However, only some key points of this material are analysed and scrutinized in the light of theoretical con-ceptions concerning the regional development.
It is necessary to bear in mind that a kind of eclectic period in regional policy where several theoretical conceptions meet, is talked about. Eclectic period is the product of a distinct opinion plurality concerning the issue of regional develop-ment. This plurality of opinion though has one common denominator: that concep-tions as a rule agree in emphasizing the importance of human initiative and human resources for the regional development and its stimulation. Support to the opening of small and medium firms, support to dissemination of technical innovations, de-centralizing measures in public administration, support to local initiatives, deregu-lating measures, networking of actors at the regional manufacturing or consumer markets, programmes caring after foreign investors (Blažek–Uhlíř, 2002) are the currently preferred. The NSFR is also evaluated in an electing way.
1This paper was prepared under the Project No. č. 2/6038/26 “Economic performance and competitiveness of localities and regions” financially supported by the VEGA Grant Agency.
VLADIMÍR SZÉKELY 82
Economic performance and competitiveness of localities and regions
One of the strategic aims of the economic and social development of the SR until 2013 is a distinct increase of competitiveness and performance of regions and con-sequently the Slovak economy with the due respect to sustainability. Let me reflect upon the term regional competitiveness that (just like the term sustainable devel-opment) is according to theoreticians of regional development one of the least defi-nite ones (see for instance Kitson et al 2004). Likewise, representation of the re-gional economic performance by the GDP per inhabitant is also generally consid-ered outdated and it is normally replaced by other appropriate measures. On the other side, in an effort to capture and express the socio-economic situation in a more comprehensive manner, other synthesising indicators, which contain along with the indispensable economic dimension also a social dimension and/or envi-ronmental dimension (for instance, the human development index) are searched.
With regard to regional development of Slovakia and identification of regional disparities in economic performance one thing has to be mentioned. The question how to delimit suitable regional units that would represent functional relationships in space is a problematic one not only in Slovakia but also in many other European states. Analyses focused on identification of regional disparities in Slovakia are as rule linked to the region, which is the product of the territorial/administrative divi-sion. Bezák (2001) believes that the territorial/administrative units cannot take over the function of spatial or regional units because instead of scientific criteria ac-cording to which the territorial/administrative division is made, other unscientific (mainly political) reasons are respected. Based on his analysis, he reports that “as far as the number of administrative regions, selection of their centres and outlining of regional boundaries are concerned, there are serious disproportions between the present regional structure and the new territorial/administrative division of Slovakia”. Although one can agree with this assertion, the practical life has shown, that the regional statistics bound to administrative units quite distinctly determine the regional analysis. Study of literature and official governmental documents lead to the conclusion that in spite of its rationale the problem pointed at by Bezák is being overlooked at all levels. It also is the reason why the position of administra-tive region Bratislava is erroneously emphasized. This position is the result of in-correct collection of statistical data and of its spatial delimitation and consequently incompatibility with other spatial units of the NUTS III level. Unfortunately, the issue of forming functional regions to which also the regional statistics would be naturally bound remains unsolved.
Economic performance can be explored from many aspects while the use of se-lected indicators leads to different results. Categories like wages, growth of wages, GDP or its growth, number of employees, growth of employment, number of un-

REFLECTIONS ON APPROACHES TO (REGIONAL) ECONOMIC DEVELOPMENT… 83
employed, unemployment rate or its development, etc. are used as indicators which in synthesised form represent the interaction of the determinants of local and re-gional competitiveness. Each of selected indicators is more or less spatially differ-entiated. The fundamental question for the basic research and the decision-making sphere at varied hierarchic levels is why the localities (above all those of urban type) and regions differ in their economic performance. Why one region or locality, now seen as a significant source of external effects, is more successful than the other.
The basic elements of the regional competitive advantage are: production capi-tal (high-performing production of regional economy), human capital (quality and qualifications of labour forces), socio-institutional capital (the extent, depth and orientation of social networks and institutional forms), cultural capital (range and quality of cultural opportunities and assets), infrastructural capital (scale and qual-ity of public infrastructure) and the capital inherent to society’s knowledge and creativity in interaction with the aim to increase the regional productivity and liv-ing standard (Kitson et al. 2004).
Economic performance is connected with productivity, which as many authors believe, decisively controls the living standard of population in towns and regions. Materials forming the contemporary regional policy in Great Britain report that as much as about 60% of differences existing in regional GDP values per inhabitant are due to differences in productivity. Five “drivers” of productivity were identi-fied: skills, investment, innovation, enterprise and competition. Authors of materi-als among which representatives of economic sciences dominate, believe that the improvement of regional economic performance requires work with these five “drivers”. This approach is absolutely new in the regional policy of Great Britain and the geographic community has subjected it to certain revision (Fothergill, 2005). Total ignoring of physical environment, which undoubtedly influences lo-cation of production activities and concentration of population, has been subject of most criticisms. (The NSFR does not mention the factor of physical-geographical differentiation of Slovakia in connection with the economic performance and com-petitiveness in regions in spite its evident impact relevance).
A distinctly increased interest in study of regions (subregions or localities) and their competitive advantages is now observed due to formation of higher territorial units and establishment of regional (local) self-governments in Slovakia. Improved competitiveness of less developed regions in official materials of the European Commission seems to be the indispensable condition of social cohesion. Various ratings of spatial units based on selected indicators of economic performance are prepared. Spatial units are compared and subsequently their order is compiled. The order serves to identification of absolute and relative positions of spatial units in the framework of a higher hierarchic system. Each spatial unit in an effort to attract people and capital amidst strong competitive environment is striving to be included

VLADIMÍR SZÉKELY 84
among “winners”. But the number of “losers” is always higher as number of “win-ners”. Attractive investments, which ensure new jobs, economic growth, prosper-ity and increased living standard of local and regional populations, are only going to a small number of localities attractive for potential migrants. It is a paradox that no univocal opinion concerning interpretation and measurement of the concept “regional competitiveness” exists at the theoretical level and in studies involved with the basic research. It is generally considered as a complex and questionable term.
Science parks as tools for improvement of regional competitiveness (?)
The aim „ to increase considerably the competitiveness and performance of Slovak economy by the year 2013 while paying respect to sustainable development“ will be pursued by means of three strategic priorities: 1) Infrastructure and regional accessibility, 2) Innovation, informatization and knowledge society, 3) Human resources and education. The strategic priority “innovation, informatization and knowledge economy” includes at least two specific priorities and three operational priorities (2.1 Support to competitiveness of firms and services by innovations, 2.1.1 Innovation and technology transfers, 2.1.2 Support to common services for entrepreneurs, and 2.3 Research and development, 2.3.3 Support of cooperation between R&D institutions and business sphere and knowledge or technology trans-fer into practice) where support to science parks as tool for reaching the objectives of economic and social development of the SR is both explicitly or implicitly men-tioned.
The concept of science parks (SP) appeared for the first time by the end of the 1950s in the USA. The principal argument for their establishing was to fulfill aspirations of economically thinking academic workers who were aware of the commercial potential both of developed technologies and research results. The proximity of universities as the natural sources of inventve thinking and concentration of highly quialified labour was one of the decisive location factors in estabilishment of the SPs (Vedovello, 1997).
Terminological heterogeneity in denoting the investigated phenomenon on the one side and the idea what SP represents (see for instance Lazzeroni 1995, or Sto-rey, Tether 1998) on the other in individual studies is evident at the first glance. Shearmur a Doloreux (2000) point to the problem of defining the SP saying that definition of SP is rather unclear as in its description various terms are used: re-search and technological parks, technopoles (term used in Francophone area) and technopolis (term used for instance in Japan). As no universal definition of SP ex-

REFLECTIONS ON APPROACHES TO (REGIONAL) ECONOMIC DEVELOPMENT… 85
ists, the use of different terms for spatial concentration of producers of high-tech-nology products and services in parks and provision of opportunities for institu-tional cooperation between universities and industry is only natural.
From the 1950s until now, the meaning and tasks of SP has been changing. While at the beginning until about the 1980s, the priority of SPs was revaluating of scientific research and support to transfer of research achievements to industries, the SPs of today are tools (or they should be) of local and regional economic de-velopment supporting innovation and the subsequent increase in competitiveness of companies and regions.
As Massey et al. 1992 assert (see Shearmur–Doloreux, 2000), objectives of SPs can be classified into three main groups: as) objectives associated with economic development b) objectives associated with transfer of technologies, and c) objectives associated with local (or regional) benefits (Table 1).
It is generally known, that SPs provide or should provide numerous advantages and supporting services tailored for smooth functioning of above all small inde-pendent technology-based firms. Their presence in SP is desirable so that the park administrators strive for offering them attractive conditions.
However, it seems that in some cases the scope and quality of services provided are not necessarily decisive for the location or relocation decisions of firms. Re-sults of empirical research prove it. For instance, Westhead and Batstone (1998) studied the perception of positives in independent technology-based firms that were supposed to emerge as results of their location in SP. The conclusion was that the decision to locate the firm in a SP was determined above all by the generally adopted image of high prestige ascribed to such location as a result of shrewd and purposeful promotion of parks in entrepreneur circles. Shearmur and Doloreux (2000) even report that numerous new and small technology-based firms that lacked complete information for an economically rational location decision and wanted to seat in a SP were even prepared to pay a surplus to the rent, in order to improve their technological and commercial reputation.
The reason is that this “improvement” was perceived as automatic with mere lo-cation of the firm in such park. Both authors are convinced (like Lazzeroni 1995) that the “local SP” often becomes a showcase for the regional economic develop-ment while promotion and financial support to the park by the local institutions is again the reflection of an effort to create a favourable image of the particular com-mune in the eyes of a potential investors. Location of the firm in such “local SP” is definitely the question of prestige. It is the reason why Shearmur a Doloreux be-lieve that SPs can easily become glorified parks, which attract firms simply be-cause they are sites of prestige properties.

VLADIMÍR SZÉKELY 86
Table 1 Objectives of SPs
Economic development
− Stimulate the formation of start-up new-technology-based firms (NTBFs) − Encourage the growth of existing NTBFs − Commercialise academic research − Foster the technologies of the future − Counter the regional imbalance of R&D capability, investment, innovation − Attract inward investment, mobile R&D
Transfer of technology
− Encourage spin-off started by academics − Encourage and facilitate links between higher education institutes and industry − Facilitate technology transfer from academic institution to firms on park − Increase the “relevance” to industry of the research and higher education institutes − Give academic institutions access to leading-edge commercial R&D − Increase the appreciation of industry’s needs by academics − Stimulate science-based technological innovation
Local benefits
− Create employment and consultancy opportunities for academic staff and students − Create synergy between firms − Create new jobs for the region − Improve the performance of the local economy − Stimulate a shift in perceptions − Build confidence − Engender an entrepreneurial culture − Generate income for academic institutions − Improve the image of academic institutions in the eyes of central government
Source: Shearmur, Doloreux, 2000, p. 1067 (adapted from Massey et al. 1992).
Those who doubt about the real impact of SP on generation of synergy effects be-tween the scientific institutions and industrial firms and on their effect on local (regional) development lean on several empirical studies. For instance, Bakouros et al. (2002) analysed operation of three SPs in economically less developed Greece through relationships between universities and industry. Authors wanted to find out whether the widely used term “high-tech fantasies” is also adequate for the Greek SPs. (the term “high-tech fantasies” is associated with the study of British geogra-phers led by D. Massey who pointed to the limited possibilities of SPs in support the technology transfer and creation of important synergy effect among firms lo-cated in parks and also between firms and academic centres (universities)). The
REFLECTIONS ON APPROACHES TO (REGIONAL) ECONOMIC DEVELOPMENT… 87
questionnaire survey revealed that the relationships between firms and local uni-versities are above all informal (personal contacts, access to specialized literature, to equipment, to results reached in research, attendance to seminars, conferences and training programs). More developed formal relations (common research or contracts, agreements about consultations, analysis and testing in academic centres) have been successfully established only in one park while in other two parks for-mal relations have been only introduced. It is interesting that the synergy among companies in individual parks is in form of commercial transaction or social links while research discovered the total absence of scientific/research links in the three parks confirming the assumptions of British geographers.
Absence of links does not have to be necessarily a general one. For instance, the research of companies located in the Western Australian Technology Park car-ried out by Phillimore (1999) confirms it. It is remarkable that in spite of quoting the studies pointing to unused opportunities of cooperation, he obtained (while he also pinpointed qualitative and quantitative reserves in networking companies and scientific institutions) quite different results from those of Bakouros et al. (2002).
What kind of SP should be established in Slovakia? The survey of literature concerned with different specific forms and operations of SPs shows that no uni-versal model of park capable to fulfil the established objectives exists just like there are no universal predictions of its impact on formation and improvement of regional (local) structure and labour market or on establishment and increase of competitiveness and prosperity of industrial companies. It seems that the specific success depends on the concrete environment, rate of engagement of people con-cerned with high business sensibility and the particular time. It is supposed that taking into account the specific features of Slovakia, the most rational environment for the establishment of a SP is the agglomeration of Bratislava with its scien-tific/research base appropriate for copying the British and American models where the principal initiative is that of universities cooperating with the business sphere and local and regional self-governments.
Conclusion
The detailed analysis of NSRF inevitably leads to the conviction that the ambition of the SR is to realize the “high road” developmental strategy in close future, aim of which is the competitiveness based on high rate of innovation, cooperation, de-veloped networks and the supporting institutions. It is the strategy typical for the highly developed states; the SR does not belong to as yet. On the other side, there also exists the “low road” developmental strategy leaning on comparative advan-tages in form of competitive prices, low wages and standard employment. This strategy is typical for less and moderately developed states. The past economic and

VLADIMÍR SZÉKELY 88
social development of the SR suggests that precisely this type of strategy may dominate in Slovakia in the nearest future in spite of declared ambitions to change from the “low-road“ to “high-road”. Such a change is, after Paulov (1999), a highly demanding matter requiring long-term concentrated and consistent efforts.
References
Bakouros, Y. L.–Mardas, D. C.–Varsakelis, N. C. 2002: Science park, a high tech fantasy?: An analysis of the science parks of Greece. Technovation, 22, 123–128.
Bezák, A. 2001: O regionálnych trhoch práce, nových krajoch a tokoch nezamestnaných. Geografický časopis. 53. 295–305.
Blažek, J.–Uhlíř, D. 2002: Teorie regionálního rozvoje – nástin, kritika, klasifikace. Univerzita Karlova v Praze, Nakladatelství Karolinum, Praha, 211 pp.
Fothergill, S. 2005: A new regional policy for Britain. Regional Studies. 39. 659–667. Kitson, M.–Martin, R.–Tyler, P. 2004: Regional competitiveness: An elusive yet key concept?
Regional Studies. 38. 991–999. Lazzeroni, M. 1995: Science parks in Western Europe: can the model be replicated in Central-Eastern
European countries? Geographia Polonica. 66. 147–159. Ministerstvo výstavby a regionálneho rozvoja Slovenskej republiky (2006). Národný strategický
referenčný rámec 2007–2013. Bratislava. (http://www.build.gov.sk/index.php). Paulov, J. 1999: K jednej koncepcii regionálneho rozvoja a regionálnej politiky. Geografické
informácie 6. Nitra (Univerzita Konštantína Filozofa). 13–22. Phillimore, J. 1999: Beyond the linear view of innovation in science park evaluation: an analysis of
Western Australian Technology Park. Technovation, 19, 673–680. Shearmur, R.–Doloreux, D. 2000: Science parks: actors or reactors? Canadian science parks in their
urban context. Environment and Planning A. 32. 1065–1082. Storey, D. J.–Tether, B. S. 1998: Public policy measures to support new technology-based firms in
the European Union. Research Policy. 26. 1037–1057. Vedovello, C. 1997: Science parks and university-industry interaction: geographical proximity
between the agents as a driving force. Technovation. 17. 491–502. Westhead, P.–Batstone, S. 1998: Independent technogy-based firms: the perceived benefits of
a science park location. Urban Studies. 35. 2197–2219.

EXTERNAL BORDER OF THE EUROPEAN UNION – PERMEABILITY, CO-OPERATION, PERSPECTIVES
TOMASZ KOMORNICKI
Introduction
The existence of a boundary (the barrier effect) disturbs the magnitude of goods or passenger flows (as well as the flow of information and innovation diffusion), which is expected on the basis of the gravity models of trade (conform to the nor-mal resistance from distance). The regression line, representing the intensity of interaction along distance, breaks down and drops at the distance corresponding to a political frontier. It was shown that this breakdown persists also on the bounda-ries featuring very high degree of permeability (e.g. on the internal boundaries of the European Union, Rietveld P, 2001), and even between some administrative units of a lower order (Lowe–Moryadas, 1975).
After the Union enlargement in 2004 the number and the length of the border segments between the European Union and the third countries (not associated and waiting for accession) increased abruptly. Until then such a situation had existed only on the thinly populated areas of Scandinavia. Now the boundary with Russia, Belarus’, Ukraine, Moldova, Turkey, Albania, Macedonia, Serbia and Croatia crosses the entire continent from the Baltic Sea down to the Black Sea and sur-round the former Yugoslavia. This process brings about polarisation of the Euro-pean border regime systems. To an increasing degree the weakly formalised bor-ders (or the practically nonexistent ones) start to dominate in a pronounced manner inside the Union, and the highly formalised ones (with the visa requirement for the direct neighbours being the rule) on the outer fringes of the Union.
The purpose of the present report is to assess the effects from the strengthening of the function of border segments, which became an outer boundary of the Euro-pean Union. These effects will be analysed on the example of the Polish eastern boundary. Analysis will be performed for the international economic linkages, and precisely – for the intensity and the structure of international trade of the border regions, as well as transboundary flows of persons and goods.1 Four Polish prov- 1The paper is partly based on the results of ESPON 1.4.4. Project (Study on Feasibility on Flows Analysis). The Project was leaded by Spiekermann & Wegener Urban and Regional Research (S&W; Dortmund) with two partners: Institute of Geography and Spatial Organization Polish Academy of Sciences (IGSO OAS: Warsaw) and Transportation and Territory (TRT; Torino).

TOMASZ KOMORNICKI 90
inces adjacent to the eastern boundary will be treated as the border regions (the province of Warmińsko-mazurskie – bordering upon the Kaliningrad district of Russia; province of Podlaskie – bordering upon Belarus’; province of Lubelskie – border with Belarus’ and Ukraine; and the Podkarpackie province – border with Ukraine).
The database used in the paper are matrices for the years 2000 and 2005 cover-ing 379 “poviats” (counties – LAU 2) versus all European countries. Figures com-prising the amount of import and export are given for each relation and are ex-pressed in US dollars based on information from SAD (Single Administrative Document) and INTRASTAT. The SAD forms constitute a complete basis encom-passing the entire trade with the countries outside of the European Union. The ITRASTAT system is founded on the reporting from the companies conducting foreign trade. In accordance with the information obtained in the Polish Ministry of Finance, in Polish conditions the system includes 90% of the entire trade with the remaining 24 member countries of the Union. This brings about certain constraints in terms of comparability of the data from the years 2000 and 2005. In 2000 the entire Polish trade was registered on the basis of SAD. In the case of border traffic the main data source was is the Polish Border Guard database. It contains the num-ber of passengers and heavy goods vehicles and distinguishes for passenger trans-port between Polish citizens and foreigners crossing all Polish border crossings. The data allow to analyse the dynamics of cross-border movements as it covers the years 1990 to 2005.
On the basis of the dynamic analysis of economic linkages the conclusions have been formulated both concerning the observed spatial consequences of the broadening of the European Union for the areas situated at its outer border, and related to the perspectives in this respect.
Eastern Poland in the system of international economic linkages
The analysis of the spatial distribution of international economic linkages shows the extent, to which individual regions, and even towns, have become the elements of the European economic space. The image obtained is therefore a kind of meas-ure of the true spatial economic integration. Consideration of dynamics with re-spect to the dispersion of international trade connections among smaller centres may be treated as an indirect measure of the effect of cohesion policy (ESPON 1.4.4. Final report, www.espon.eu). In addition, the shares of particular partners in the export of local administrative units allow, in particular, for the delimitation of the zones of strong interactions with the neighbouring countries. Thereby, they become the measure of the local integration potential of the border regions. Identi-fication of the main directions of the socio-economic connections of regions has, as

EXTERNAL BORDER OF THE EUROPEAN UNION – PERMEABILITY… 91
well, a concrete application value. Their knowledge may be helpful in the conduct of policies related to transport, education and promotion (territorial marketing), and also in the field of use of the European assistance means. The spatially referenced economic interactions may be to some extent identified with demand for transport infrastructure.
In the year 2000 Poland was characterised by a very uneven regional breakdown when it comes to exports (see Figure 1). These mainly derived from Warsaw and the western part of the country, in which almost all poviats (counties) participated in trade. In contrast, in eastern Poland, trade was concentrated almost uniquely within the largest centres. The main areas of the absolute concentration of exports nationwide were: (a) the Warsaw agglomeration, (b) certain urban areas in Upper Silesia, (c) the Legnica-Głogów copper-mining district, (d) other large urban and industrial agglomerations, above all that of Poznań, and (e) selected smaller centres in which modern industrial plants are located (mainly with foreign capital playing a role). An even larger concentration is to be noted for imports.
There was a stronger export orientation of industry in western and northwestern Poland, and, to a somewhat lesser degree, also in southeastern Poland. It can be supposed, as well, that the low level of export in the East was linked with the gen-erally lower production level, while in some regions of central Poland it was the effect of production mainly for the domestic market (Komornicki, 2003).
The regional distribution of the main export centres in the year 2005 (after the enlargement of the European Union) remained almost unchanged (Figure 1). A distinct diffusion of the export activity into the more peripheral areas could be ob-served, though, especially in central and southeastern Poland. A very distinct in-crease of export was noted in the areas of functioning of the special economic zones (particularly so for the zones of Wałbrzych, Mielec and Gliwice (Figure 2). The global value of export decreased only in few counties. The increase, however, was generally somewhat higher in the eastern half of the country, and relatively lower on the areas, which had already before had strong international economic connections.
In case of import the analogous phenomenon of de-concentration appeared to a much lower degree. The increase was proportional in the biggest import centres. There was a slight reduction in this context of the role of Poznań, while the signifi-cance of the Tri-City (Gdańsk–Sopot–Gdynia), Wrocław and Cracow increased. Again, some of the special economic zones (first of all the one of Wałbrzych) turned out to be perceptible. In several dozen peripheral counties the value of im-ports decreased (Figure 3). This value increased very intensively in Lower Silesia, and in the eastern regions of Lubelskie and Podlaskie. Both in the case of export and of import North-western Poland turned out to be the region featuring a rela-tively weaker dynamics. This significance of international trade for this region was high already in 2000.

TOMASZ KOMORNICKI 92
Figure 1
Polish export in 2000 and 2005
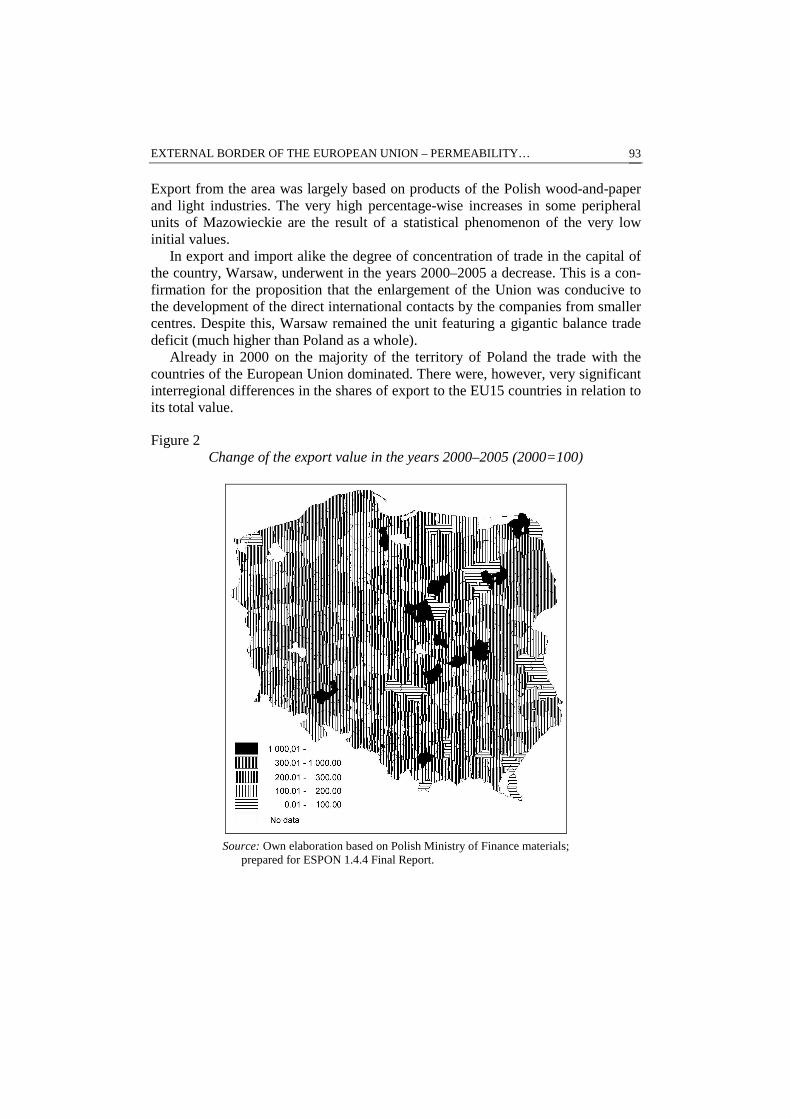
EXTERNAL BORDER OF THE EUROPEAN UNION – PERMEABILITY… 93
Export from the area was largely based on products of the Polish wood-and-paper and light industries. The very high percentage-wise increases in some peripheral units of Mazowieckie are the result of a statistical phenomenon of the very low initial values.
In export and import alike the degree of concentration of trade in the capital of the country, Warsaw, underwent in the years 2000–2005 a decrease. This is a con-firmation for the proposition that the enlargement of the Union was conducive to the development of the direct international contacts by the companies from smaller centres. Despite this, Warsaw remained the unit featuring a gigantic balance trade deficit (much higher than Poland as a whole).
Already in 2000 on the majority of the territory of Poland the trade with the countries of the European Union dominated. There were, however, very significant interregional differences in the shares of export to the EU15 countries in relation to its total value.
Figure 2 Change of the export value in the years 2000–2005 (2000=100)
Source: Own elaboration based on Polish Ministry of Finance materials;
prepared for ESPON 1.4.4 Final Report.

TOMASZ KOMORNICKI 94
Figure 3 Change of the import value in the years 2000–2005 (2000=100)
Source: Own elaboration based on Polish Ministry of Finance materials;
prepared for ESPON 1.4.4 Final Report.
The importance of the Union in exports decreased gradually towards the East (dropping to below 50% to the East of Vistula and to even less than 25% within the eastern borderland), to the advantage of the increased share of export to the coun-tries of the former USSR. The spatial differentiation of the shares of the European Union in the value of imported goods was, on the other hand, much smaller. This share was generally high also in eastern Poland, except for the border counties. In 2005 there was a distinct increase of the significance of export connections with the European Union in eastern Poland.
This took place both owing to the general increase of the export value, and ow-ing to the enlargement of the Union itself (some eastern regions concentrated trade with such countries as Lithuania, Slovakia and Hungary, now EU member coun-tries). The increase of exports to the EU countries was in relative terms the highest in the East. At the same time, western Poland opened up to a greater extent to trade

EXTERNAL BORDER OF THE EUROPEAN UNION – PERMEABILITY… 95
with the third countries. Thereby, a partial evening out of the disproportions in the trade structure between the eastern and the western halves of the country took place.
Yet in 2000 the four analyzed eastern provinces were the location of very strong concentration of export to the directly neighboring countries. This applied, in a particular manner, to the export to Ukraine, which was concentrated in the Lubelskie and Podkarpackie provinces. The reasons for such a state of things should be sought in the lower quality requirements from the side of the Ukrainian or Belorussian market. Numerous small businessmen from eastern Poland could not stand the challenge of the European Union market competition, while their not always quite modern products can still be sold in the East. A part of the effect ought also to be attributed to the location in the vicinity of the border of the com-panies dealing with re-exporting of goods having been imported to Poland before (Ukraine imports from Poland, in particular, coffee and bananas). The real signifi-cance of the trade with Ukraine, Belarus and Russia was even bigger within the confines of the borderland in view of the still functioning unregistered trade.
In the years 2000–2005 there has been, however, a decrease of export to Ukraine exactly from the area of the borderland (the provinces of Lublin and Pod-karpackie voivodship). Introduction of visas for the eastern neighbouring countries in October 2003 could have constituted also a factor limiting the local contacts of the smallest businesses. On the other hand, though, there was a very strong increase on the remaining areas, first of all in western Poland (Lower Silesia, Wielkopolska) and partly in northern Poland. In many units there located the value of export in-creased there more than ten times over (e.g. in Gliwice, Olsztyn and in the counties near Wrocław). The increase exceeded 500% also in Warsaw, Opole and Gdynia.
In the year 2000 the territory of the eastern border provinces of Poland ac-counted for only 10.4% of total Polish exports (of which 4% originated from the Podkarpackie province). The share of the same provinces in the value of imports was at the mere 4.8%. These ratios did not correspond to the share of the provinces in question in terms of population. Thus, the value of exports per capita was on this area among the lowest in Poland (only 338 USD in Podlaskie and 342 USD in Lubelskie provinces, while the average for the country was 817 USD). Situation was similar in case of imports (only 245 USD per capita in the Lubelskie province – compared to 1265 USD for the country as a whole – the lowest value among all provinces). The share of EU15 in export value was there also among the lowest in Poland and amounted to just 53% in the province of Podlaskie, and to 54.7% in Lubelskie province (70.1% for Poland as a whole). The most important trade part-ner was Germany, but its share in the volume of trade was distinctly lower than in the case of other regions. In terms of imports the share of the European Union was, except for the province of Podlaskie, higher than on the average in the country. This, however, was a typical situation for the majority of provinces, to which the

TOMASZ KOMORNICKI 96
raw materials imported from other directions would not come (this being especially visible for fuels).
In the period 2000–2005 the value of export from the four provinces analysed increased more than threefold, from 2.3 billion USD to more than 7.3 billion USD. Simultaneously, though, the share of this area in the total value of exports dropped to 8.5%. Hence, the dynamics of increase was lower than on the average in Poland. In the case of imports, despite the increase of the absolute value, from 2.3 to 4.8 billion USD, the share of the four provinces in total imports remained constant, at 4.8%. The share of export towards the territory of the European Union increased mainly owing to the Union’s extension, yet in all the analysed provinces – except for Warmińsko-mazurskie – it remained lower than the national average. The pro-portion of goods exported to the “old” member countries increased in Podlaskie and Warmińsko-mazurskie, but it clearly dropped in Lublin and Subcarpathian provinces. The overall significance of the Union in export remained distinctly lower than on the average in the country, although the difference was already much smaller than in 2000. In the group of the western European countries Germany preserved its domination and a close to 20% share in export. The significance of Italy decreased somewhat, while position of France was maintained. There was, however, an abrupt drop in the role of Ukraine. Only in the province of Lubelskie there was a drop from close to 20% in the year 2000 to just 7.7% in 2005. Export from this province to the immediate neighbour decreased even in absolute numbers (from 135 to 119 million USD). At the same time, in the very province, there was a surprisingly high increase of export to Belarus’, from the mere 18 million USD in 2000 to 70 million in 2005.
The share of the European Union in import decreased, and this even with con-sideration of imports from the new member countries (except for Warmińsko-ma-zurskie). For the area of the EU from before 2004 the decrease amounted to close to 12 percentage points in the Lubelskie province, and to as much as 24 percentage points in the Podkarpackie province.
Border traffic
In the period 1990–1997 the passenger cross-border traffic (in both directions) in-creased in Poland from 84.2 million to 273.9 million persons (Komornicki, 1999). This increase was followed by a stagnation, and in the years 2000 and 2001 a de-crease was observed. The traffic was dominated by the persons doing their shop-ping in Poland. In 2003 altogether 181 million persons crossed the borders in both directions. In 2004, though, there was anew an increase, associated with the acces-sion to the European Union. This increase took place across all the border segments except for those with Russia and Belarus’. On the majority of the border segments

EXTERNAL BORDER OF THE EUROPEAN UNION – PERMEABILITY… 97
it is the foreigners that cross the borders predominantly. The difference in these terms is decidedly the most pronounced on the local Polish-German border cross-ings (neighbouring upon the bazaars, like Łęknica), and also on the borders with Belarus’ and Ukraine. There are border crossings on the eastern borders, where the share of Polish citizens in crossing the boundary does not exceed 5%. Poles domi-nate, on the other hand, among those registered at the airports and on the Czech and Slovak borders.
The analysis of the intensity of traffic in the period of 24 months (September 2002 – August 2004) allows concluding that there is a characteristic seasonal cycle with a distinct summer maximum and a drop in the winter months (see Figure 4). This cycle was disturbed by a breakdown associated with introduction of visas on October 1, 2003. The delay, after which the fluctuations of traffic returned to the earlier rhythm was, however, quite short. Already in December 2003, the intensity of border traffic corresponded to the level from the preceding year. This was partly due to the increase in the travels of Polish citizens (occurring exactly just after the introduction of visas – perhaps denoting the temporary takeover of a part of trade activity from the Ukrainians).
In 2005 there was a dramatic increase in the share of Polish citizens in the bor-der traffic. This should be first of all linked with the increase of the fuel prices in Poland, which motivated the inhabitants of the border regions to fuelling their ve-hicles in Ukraine. Another factor may be constituted by the more rigorous proce-dures, applied by the Polish Border Guards with respect to the citizens of Ukraine. Even though they may have a visa they happen to be returned away from the bor-der due to the suspicion of having the intention of taking up an illegal job in Po-land. Such situations had as a rule not been taking place in the preceding years.
The dynamic increase of the intensity of HGV traffic lasted over the entire dec-ade and continues nowadays. In 1980 all of the Polish borders were crossed in both directions by altogether 295,000 HGV, by 1990 this number increased to 1.1 mil-lion, and by 2003 to close to 6.2 million. During the entire decade the dominating role was played by the lorry traffic across the Polish-German border. On the east-ern side after 1998 the border crossing in Kukuryki was no longer the one most loaded with cargo traffic (see Figure 5). Currently, the decisively biggest intensity of truck traffic is observed in Budzisko on the Lithuanian border. The role of the Polish-Ukrainian crossings has relatively increased in these terms, as well, espe-cially of the crossing point in Dorohusk (Warsaw–Kiev highway).
The traffic of trucks across the Polish eastern border had been increasing inces-santly since the collapse of the Soviet Union (the years 1990–1992) until the year 1997. In the years 1998–1999 there was a short-lived breakdown, associated with the so-called Russian crisis, and then further rapid intensification. The breakdown of the year 1998 was clearly smaller on the Ukrainian than on the Belarusian bor-der. The period of regress was, on the other hand, much longer for the vehicles

TOMASZ KOMORNICKI 98
with Polish registration plates than for the foreign registrations (Ukrainian, but also Russian, Romanian and Bulgarian in the transit traffic). The number of Polish trucks crossing the Ukrainian border exceeded only in 2002 the level from 1996. After 2002, however, the increase in this group was more dynamic than for the foreign trucks. It should be remembered, though, that the distinction into the vehi-cles with Polish and foreign registration is not fully precise. In practice, namely a vehicle registered in one country may belong to a company from another country, and the driver may be the citizen of yet another country.
The dynamics of traffic growth (especially on the Ukrainian border) exceeded the dynamics of foreign trade, which is an evidence of both high share of transit traffic, and of the gradual increase of the share taken in Polish foreign trade by the road transport. On the eastern border, after 1998, the crossing in Kukuryki ceased to be the most intensively used one in cargo traffic. Currently, cargo traffic is de-cidedly more intensive at the crossing in Budzisko on the Lithuanian border.
Figure 4 Passenger traffic at the Polish Eastern border
(September 2002 – August 2004)
0
200000
400000
600000
800000
1000000
1200000
1400000
wrz-02
paź-02
lis-02
gru-02
sty-03
lut-03
mar-03
kwi-03
maj-03
cze-03
lip-03
sie-03
wrz-03
paź-03
lis-03
gru-03
sty-04
lut-04
mar-04
kwi-04
maj-04
cze-04
lip-04
sie-04
Russian Lithuanian Belarusian Ukrainian
Source: Author’s elaboration based on the unpublished Border Guard materials; prepared for Espon 1.4.4., Final Report, 2007

EXTERNAL BORDER OF THE EUROPEAN UNION – PERMEABILITY… 99
Figure 5 HGV border traffic by main transport corridors
in the years 1990 and 2004
TOMASZ KOMORNICKI 100
There was also a relative increase of the role, in this respect, of the Polish–Ukrain-ian border crossings, especially the one in Dorohusk. The direction Dorohusk–Lublin–Warsaw–Berlin has been in the years 1995–2004 the main direction of the Ukrainian transit to Western Europe. After 2004 the traffic of trucks in Dorohusk stabilised. The increase of the traffic of heavy goods vehicles in the years 2004–2005 took place first of all at the border crossing of Korczowa along the direction of E–40 route (Dresden–Cracow–L’viv). In the previous years the biggest goods flows were observed along the direction of Kiev-Warsaw-Berlin. The change may be caused by a relative advance of the construction of the Polish motorway A–4 (the segment between Cracow and Bolesławiec, some 40 km from the German border).
Summing up, it should be stated that the cross-border traffic of trucks in eastern Poland is to a large extent the transit traffic. Yet, there exists an interrelation be-tween the setting of the transit roads and the location of towns conducting trade with Ukraine and Belarus’. This concerns first of all the towns (counties) situated directly at the border crossing, namely – Przemyśl, Chełm and Tomaszów Lubelski on the Ukrainian direction and Biała Podlaska on the Belarusian.
In the period of 24 months, here analysed in detail (September 2002 – August 2004), HGV traffic was subject to standard seasonal oscillations with a clear peak at the end of the calendar years and even more pronounced minimum in January. The influence of the introduction of visas for Ukrainians on the intensity of traffic is not perceptible. The spring increase in 2004 was observed earlier than in the preceding year, which allows to assume that either the accession of Poland to the European Union had no influence on the magnitude of traffic, or this impact could be positive. In these terms the situation is different from the one observed on the Belarusian border, where a decrease of traffic was observed in May 2004.
Summary
Altogether, it can be admitted that the international economic links of the eastern border areas, two years after the extension of the European Union, are character-ised by the following properties:
− Lower than the national average intensity of the official economic connec-tions,
− Relatively high, although decreasing, diversification of the foreign partners, − High increase and moderate de-concentration of the trade activity after the
accession of Poland to the European Union, − Strong, although quickly decreasing concentration of export connections with
Ukraine (Lubelskie and Podkarpackie provinces),
EXTERNAL BORDER OF THE EUROPEAN UNION – PERMEABILITY… 101
− Average and even more quickly decreasing concentration of connections with Belarus’ and Russia (Podlaskie, Warmińsko-mazurskie),
− Increasing trade significance of the EU partners from other new member countries,
− Slowly increasing role of eastern partners in import, − Concentration of connections with intensity exceeding the national average in
only few centres, − Marginal share in foreign trade of the counties situated directly at the border
(except for the units surrounding the cargo border crossings), − Increasing significance of the transit location with respect to Lithuania and
Ukraine, and a stable role in this context with respect to Belarus’ and Russia.
The analysis conducted leads also to the general conclusion that the effects of accession to the European Union were unequivocally positive for the economies of the provinces studied. This is demonstrated by the intensification of export to the so-called “demanding markets” with simultaneous slowdown of the upward ten-dency in the domain of the share in import from Western Europe. At the same time, however, comparison with other regions of the country proves that the potential associated with accession has been used in the East to a relatively smaller degree. The beneficiaries of the advantages accruing from the accession have become mainly the large enterprises, existing already before on the European market. The effect of creation of new connections has not appeared in the small and medium enterprises, located in the counties having earlier weak international connections.
The analysed provinces of Eastern Poland play to an increasing degree the su-pra-regional and international functions. Their development requires, therefore, better infrastructural connections with central Poland and farther – with the inside of the European Union. Still, in the provincial development strategies and in other planning documents the development opportunities are seen primarily in the ser-vicing of transit and in local transboundary co-operation. The external costs of the heavy road traffic in transit (environmental and linked with the consequences of road accidents) nullify, namely, to a large extent, the profits connected with ser-vicing of such traffic (Węcławowicz and others 2006). Lower significance ought also be attached to the currently frequently repeated postulate of opening up new border crossings with the eastern neighbours. It is more important to try to improve the system of customs and border controls. Without shortening of these procedures construction of the consecutive border crossings shall not decrease the function of the eastern boundary as a spatial barrier. The experience to date teaches, as well, that opening up of new crossings does not secure smooth traffic flow, because, similarly as the already existing ones, they get blocked owing to the struggle with the alcohol smuggling and due to the border procedures of the neighbouring coun-tries. In case of overcoming of the formal barriers (elimination of smuggling and

TOMASZ KOMORNICKI 102
border corruption) it would be possible to put to work the local crossings in the tourist regions (Forest of BiałowieŜa, Bieszczady Mts., Vistula Lagoon).
Within the eastern border-adjacent areas the export ties with the direct neighbours have undergone a decrease. In the country-wide setting this was com-pensated for by the new connections of the companies located deeper inside Po-land. Within the territory of the direct borderland this may, however, constitute a threat to the small businesses (the negative effect of the enlargement of the Euro-pean Union). Local contacts of the smallest businesses may have been effectively limited by the introduction of visas for the eastern neighbour countries.
In the coming years it should be expected that the situation in the field of bor-der traffic across the eastern border would remain stable. One should not expect a mass increase of tourism in the eastern direction, while the number of persons crossing the boundary in connection with petty trade will remain at the level simi-lar to the present one due to the border procedures of the neighbouring countries (including corruption-related activities – sale of places in queues). Accession of Poland to the Schengen agreement will also be a factor limiting traffic increase in the East, resulting, beyond doubt, in the more stringent visa regulations for the citizens of Ukraine, Russia and Belarus’.
After 2013, in the case of positive political and market transformations in East-ern Europe, more important transformations may take place in the structure of the Polish-Ukrainian and Polish-Belarusian traffic. It cannot be excluded that the visa obligation would then be abolished (entry without a visa into the territory of the entire Union). Situation at the eastern border should then become similar to that in the 1990s along the border with Germany (Poland playing the role of Germany). Lower prices of products and services, given the simultaneous improvement of standards in trade, and increase of safety, may bring about mass travels for shop-ping (not only of alcohol and tobacco products) of the citizens of relatively poorer Polish eastern border regions. This would cause demand for a high number of local border crossings. In case the eastern neighbours do not adopt the market oriented and the pro-European policies, one can expect further stagnation, or even a de-crease of the intensity of cross-border traffic.
References
ESPON 1.4.4, Final Report, 2006, www.espo.eu. Komornicki, T. 1999: Granice Polski. Analiza zmian przenikalności w latach 1990–1996 [Boundaries
of Poland. Analysis of changes in permeability in the years 1990–1996; in Polish]. Geopolitical Studies vol. 5. IGiPZ PAN, Warszawa, 348 pp.
Komornicki, T. 2003: Przestrzenne zróŜnicowanie międzynarodowych powiązań społeczno-gospodarczych w Polsce [The spatial differentiation to international social and economical

EXTERNAL BORDER OF THE EUROPEAN UNION – PERMEABILITY… 103
linkages in Poland]. Prace Geograficzne. 190. IGiPZ PAN. Warszawa. 255 p. [in Polish, summary in English].
Lowe, J. C.–Moryadas, S. 1975: The Geography of Movement, Houghton Mifflin Company. Boston. 333 p.
Rietveld, P. 2001: Obstacles to openness of border regions in Europe. In: Geenhuizen, M.–Ratti, R. (ed.): Gaining Advantage from Open Borders. An active space approach to regional development. Ashgate Publishing. pp. 79–96.
Węcławowicz, G.–Bański, J.–Degórski M.–Komornicki, T.–Korcelli, P.–Śleszyński, P. 2006: Przestrzenne Zagospodarowanie Polski na początku XXI wieku [Spatial organization of Polandat the begining of the 21st century], IGiPZ PAN. Warszawa. 212 p.

POLISH ENTERPRISES IN TRANSITION BETWEEN STATE INTERVENTION, FOREIGN DIRECT INVESTMENTS AND DOMESTIC CAPITAL
GIANCARLO COTELLA
Introduction: Economic system in transformation between post-fordism and post-socialism
The transformation of the economic system occurred in Europe in the last part of the twentieth-century, correspond to a new techno-economic paradigm, i.e. accu-mulation regime, exemplified by the adjective post-Fordist. This transformation, inaugurated by the restructuring that followed the oil crisis (crisis of Fordisim and structural re-adjustment) is commonly associated with the so-called globalization, i.e. a process in which the traditional system of goods’ exchange became progres-sively more and more integrated in a world system of production, rich of new strong geographical selectivity, but able to create a global optimal geographical dimension of the organization of markets and enterprises.
The changes occurring in post-socialist countries after 1989 has been often as-sumed to result almost entirely from the shift from the centrally planned economy system supported by a mono-party regime to a market economy introduced in a democratic political system, attributing an evident post-socialist flavour to the process itself. However, following Gorzelak (1995), it is also possible to substanti-ate the thesis that the decline of traditional industries which began to happen in Central Eastern European Countries (CEECs) after 1990 could be assimilated to a delayed repetition of the industrial restructuring which has begun in the west in early 1960s and was accelerated during the 1970s. Thus, one may look at the post-socialist transformation as a shift from fordist to post-fordist organization of eco-nomic, social and political life, that was not possible in a system separated from the global markets by economical and political barriers and therefore not strongly ex-posed to international competition.
The truth lies somewhere in between, as post-socialist transformation presents both many post-fordist features as well as several peculiar elements that cannot be noticed elsewhere. In 1990s, when the process was at its start, the reform has been compared “with the building of a new house on old, crumbled foundations, without a detailed plan and with only one third of the materials available” (Paul, 1995), helping us to understand the atmosphere of uncertainty characterising the political and decisional stage of the first years of the transition, where no blueprint could be looked at in order to shift from “plan” to “market”.

POLISH ENTERPRISES IN TRANSITION BETWEEN STATE INTERVENTION … 105
The present paper aims to shed some light over the above-described process, analysing the transformation of Polish enterprises’ system, as it evolved from the peculiar pre–1989 socialist model towards the present market-friendly scenario. The first part of the text describes how the application of the theoretical principles of soviet-inspired centrally planned economy led to the consolidation of a typical industrial structure. The second part tries to read the interrelation of post-fordist and post-socialist features characterising the transformation process. After a brief presentation of the general patterns of transition, the focus will shift to the privati-zation process, and to the exploration of the different agencies structuring the emerging model, from foreign investments to newborn domestic capitalist, in the light of a framework where the state, the general assumption of a passive role guar-anteeing more market freedom notwithstanding, pursues a strongly active neolib-eral approach and shaped Polish reality in favour of the international capital. The conclusive chapter will summarize the outcomes of the paper, trying to re-conduct the analyzed process to its social and territorial implication.
Polish organization of production under socialism
Before 1800, Polish settlement systems were constituted by some hundred cities, mainly presenting an economy based on agriculture and rural activities. Nine-teenth-century constituted a period of high-pace changes for Polish production system, when a sort of proto-industrial culture, mainly generated by the diffusion of the new technologies developed in England, began to spread throughout the country. The industrialization of the Polish territory throughout the nineteenth-century was very uneven and lead to a general differentiation between more indus-trialized western region and less industrialized eastern areas. The south and western regions where characterised by the concentration of most of the manufactory and mining activities (Silesia in particular). Also Wielkopolska developed a fair num-ber of relatively strong medium and small industrial centres specialized in manu-facturing and strong machinery production.
The situation radically changed after the end of WWII, when Poland entered the sphere of Soviet influence, and its economic development became subjected to communist ideology and political goals derived ad hoc in close connection with the reality of the Soviet hegemony. The adopted centralized economic model was based on the development of heavy industries in order to foster rapid economic growth1 (Enyedi, 1990). The majority of the new state investments, centrally deter- 1Following French and Hamilton (1983), the main goals of central economic planning were (1) the reduction of the gap between urban and rural areas; (2) the reduction of the socio-economic development differences between regions; (3) to avoid as much as possible

GIANCARLO COTELLA 106
mined within the COMECON framework, were mainly focused on the develop-ment of a large state-owned production system, and resulted in a high level of em-ployment in the industrial sector, especially in such branches of heavy industry as mining and steel. The guidelines regulating economic development were based upon long-term economic plans, taking for granted the determination in advance of levels of demand for given goods and services, the money supply, the inflation, the demand for labour, the distribution of productive capacity and the location and structure of investment, as well as all the most important indicators, elements and phenomena relating to socioeconomic life (Sleszynski, 2006).
In order to make the country self-sustaining in the production of strategic goods, and to urbanize a society still presenting strong rural flavour, a huge number of factories were localized throughout the country, only in part following the pre-war industrial localization pattern (i.e. interesting the main industrial centres developed in nineteenth-century), and mainly next to medium and small towns and in rural areas (often favouring the establishment of new towns).
Many government policies supported such a process of change, both advantag-ing new industrial workers and disfavouring rural ones (e.g. forbidding the subdivi-sion of agricultural activities). The described political choices radically modified the urban structure of the nation, favouring a prodigious growth of many small and medium centres that therefore became highly economic-dependent from the indus-trial plants in their proximities.
After the initial successes in the transformation of the extensive growth model of the 1950s and 1960s (in the period 1950–1969 Polish GDP grew of the 250%, mainly due to a 8,5% yearly increment in the industrial production. Conti 1985) into an intensive growth model based on rationalization and savings, during the second half of the 1970s growth figures began to decrease, while the economic restructuring showed to be slower than expected, leading to what Kornai (1980) labelled “an economy of shortage”. The technological obsolescence of polish facto-ries and their excessive dimensions ensured that industries were mainly uncompe-titive due to their material-, labour- and energy-intensive character (Sleszynski, 2006), and consequently incapacitating the economic system. This forced Polish government to take out huge loans with western countries to keep an acceptable level of industrial output and employment, in order to maintain social order and control. However the economic inefficient Polish state-enterprises were less and less capable to play the increasingly global competition game, and to meet the population’s growing demand. Such a shortage situation ended up with a wave of protest and strikes in which the factor of economic dissatisfaction combined with
economic and social contact with western nations; (4) the organization of a centralized economic development that left few room for market influence; (5) the creation of the basis for a future socialist society by education and propaganda.

POLISH ENTERPRISES IN TRANSITION BETWEEN STATE INTERVENTION … 107
the desire for independence. The several revolts that took place all around Poland and the emergence of Solidarnosc as a strong social and political actor led to the epilogue of the communist control over Poland, and to the first free parliamentary election of the 4th June 1989.
When examining the evolution of Polish production system in the period be-tween WWII and 1989, two sets of consideration can be made. The first concerns the role assumed by the state: the evolution of polish production system has been strongly state-driven, with the state trying to pursue in practice socialist theoretical objectives and therefore favouring the creation of the so-called socialist society. Such a goal presupposed the adoption of an integrated approach to social economi-cal and territorial development, and the state to assume the double role of driver of economic and territorial development and of provider of welfare services to the population. The second set of consideration concerns the role of the state enter-prises at the different scales. In line with the strong hierarchical flavour character-ising the system, the central level was the dominant one, as it was the level where all economic goals were agreed upon (Sykora, 1999). Nevertheless, this didn’t mean that the role played by the state enterprises at the local level was weak. On the contrary the enterprises, despite a weak horizontal integration, interacted in a strongly integrated vertical way, and nevertheless the continuous decisional de-pendence from the central level, constituted a crucial factor providing local com-munities with several welfare and socioeconomic services (They had their own shops, schools, sports teams, medical care, helped during construction of infra-structure and during the harvest, etc.).
These two elements, the strong influence of the state in the industrial develop-ment (and therefore in the creation of a particular economic structure) and a wel-fare system mainly implemented through the state apparatus will be used as inter-pretative lens to read the changes characterising the new structure flourishing in Poland through the transition period.
Macroeconomic reform and general patterns of transition throughout the 1990s
At the beginning of the 1990s, the weak policy priority given by polish government to pivotal themes like planning, regional and local policies, social services and housing, etc. (Sykora, 1999) have often been assumed as the litmus test of a transi-tion characterised by a sort of withdrawal of the state, in a scenario where the dis-mantling of the old structure has been rather fast and its substitution happened in a slower and much more complex way. Nevertheless, the collapse of the old commu-nist structure did not constitute a stop to the influence of the state on economic and development issues: only the mechanism changed (Paul, 1995; Shields, 2004).

GIANCARLO COTELLA 108
Even though central economic planning was reduced considerably, and the mono-political power of the communist party has been replaced by democratic structures, the state didn’t play a neutral role in the reform, for it has been the main responsi-ble for bringing in market-friendly forms of governance that constitute now the main feature of Polish reality.
In the new Polish transition scenario, instead of the state-driven top-down ar-rangement peculiar of the previous system, the state began to play a role of coordi-nation of the actions of the different agencies involved and, apart from the official discourse of a “powerless state”, remained the crucially important political actor (see part 6), and strongly contributed to the dismantling of the welfare/development state and to the creation of a friendly operational environment for foreign capital to massively colonize the new economic system through the privatization of former state-owned sectors, leaving few place for local private capital to develop and op-erate (see part 5).
Poland began its social and political transformation with the burden of its socialist heritage. Whereas obsolete production structures (41% of the Polish GDP in 1989 was still created by state owned heavy industry. Gorzelak 1996), underde-veloped technical infrastructure (in 1989 there were 82 telephones for 1000 people, and 69 km of roads for 100kmq. Szul/Mync 1997) and closeness of the economy could be mentioned as main negative characteristics, a well educated labour force, high level of social security and strong development of social infrastructure were the strong assets characterising the legacy of the previous historical period.
Soon after the overthrow of communism, the introduction of market economy took shape, without any blueprint to refer to. The shared opinion on the edge of the 1990s supported the idea of a fast embrace of the new economic model: Poland started therefore a so-called shock therapy – a drastic anti-inflationary program combined with a fast liberalization of the economy (Brada, 1993), underestimating social costs and resulting in a deep recession and a breakdown of several branches of the economy (Parysek, 1993), that suffered a major drop in the output levels (in the state owned sector), dramatically growing unemployment and strong inflation pressure (Table 1).
The recovering process was slow, as in 1989–92 the official GDP decline for Poland was -15%, and only in the beginning of 1993 it was possible to see the first signs of economic regrowth. One of the main worries of the different governments was the creation of economic and legal conditions to attract foreign investors. Po-land represented a large potential market, and Polish government worked hard to create the institutional framework for foreign and domestic capital to operate as soon as possible. In the period 1990–1992 foreign capital invested in Poland amounted respectively to 374 millions, 694 millions, 1300 millions US dollars. Such an acceleration has been the result of several factors, among them being the stabilisation of the general political and economical situation, the changing attitude

POLISH ENTERPRISES IN TRANSITION BETWEEN STATE INTERVENTION … 109
of foreign investors towards CEECs and, most important, the introduction of more favourable rules and conditions for foreign investors (few or no restriction for for-eign capital, the possibility to repatriate all profits, the introduction of several tax relief’s opportunities).
Table 1
Economic development trends in Poland, 1989–1997 (Previous year=100)
Categories 1989 1990 1991 1992 1993 1994 1995 1996 1997
GDP 100.2 88.4 93.0 102.6 103.8 105.2 106.5 106.1 106.9 Industrial production 99.5 75.5 92.0 102.8 106.8 112.1 109.9 108.3 110.8 Agricultural pro-
duction 111.0 99.7 106.8 87.7 108.8 89.2 117.8 99.1 101.7
Exports 100.2 113.7 97.6 97.4 98.9 118.3 116.7 109.7 113.7 Imports 101.5 82.1 137.8 113.9 118.5 113.4 120.3 128.0 122.0 Foreign Investments 73.3 809.0 185.0 233.0 253.0 109.3 195.0 142.0 109.0 Fixed capital for-
mation 97.9 89.4 95.6 102.3 102.9 109.2 126.0 120.3 120.2
Inflation 351.0 686.0 171.1 142.4 134.6 130.7 126.8 119.8 113.3 Unemployment rate / 6.3 11.8 13.6 13.7 16.0 14.9 13.2 10.5 Consumption / 6.3 11.8 13.6 13.7 16.0 14.9 13.2 10.5
Source: Roczniki Statystyczne – Statistical Yearbooks, 1990–1998.
The process of economic restructuring has proceeded, although not as fast as as-sumed, through all the 1990s, and presented two different dimensions:
− the collapse of several enterprises, which has not always reflected the real economic situation and growth potential, but often has been the result of ex-ternal conditions (as the collapse of traditional markets);
− the growth of old firms and fast establishing of new economic units, mostly in progressive economic sectors, mainly due to foreign investments.
A constant decline in agriculture has been replaced by a very high growth of the share of tertiary activities, reflecting a sort of rationalization of the overall eco-nomical structures (Table 2).
Transformation effects on the labour market were dramatic, with pauperization and unemployment hitting wide strata of the population. The decrease in the num-ber of jobs due to the economic recession manifested itself from the very beginning of the transformation period. The total number of lost jobs in Poland in the period 1990–1993 amounted to over 2 millions, and in 1994 the unemployment rate reached 16% of the economically active population. The economic reform resulted

GIANCARLO COTELLA 110
in greater social polarization not guaranteeing a maintenance of their standards of living to most of the workers, mainly due to the growing polarization of incomes and in the precariousness of jobs.2 Moreover, state subsidies for several social ser-vices, such as recreation, childcare, etc., have been withdrawn almost entirely (with the social insurance system and pension system reform started in 1996 and con-cluded in 1998. Gorzelak, 1998). This led to a shift from a granted supply of social infrastructure and social services, to the privatisation of those services and the growing impossibility to benefit from them due to the high costs.
It is evident how the scenario just described has been characterised by a strongly growth oriented transformation. Investment efforts and replacement of old and obsolete fixed assets of low technical standards by new equipment was the basic assumption behind these scenarios. The text will now go on to analyse the effect of such a shock-approach on the process of privatization of Polish enter-prises.
Table 2 Creation of the GDP in Poland, 1989–1996
Sectors 1989 1990 1991 1992 1993 1994 1995 1996
Industry 41,0 43,6 39,2 39,6 33,4 32,2 28,9 27,1 Construction 9,6 9,5 10,9 11,2 6,6 5,7 5,2 5,3 Agriculture 12,2 7,3 8,4 7,3 6,6 6,2 6,6 6,0 Other 37,2 39,6 41,5 41,9 53,4 55,9 59,3 61,6
Source: Roczniki Statystyczne – Statistical Yearbooks, 1990–1996.
Polish enterpries’ privatisation in the new market economy
Several fundamental changes began to affect Polish enterprises after 1989. As de-scribed above, to the considerable decline in the industrial output in the first years of the shock therapy (33% in the period 1989–1991) followed a fast growth of the production, due to the raise of domestic consumption and growing exports, and thanks to the fundamental transfer of ownership and the connected far-reaching structural and qualitative changes taking place in the entire sector.
The highest growth interested computer, plastic and rubber factories, electronic and electrical machinery, motor vehicles and precision instruments. Analogously to post-fordist transformations interesting Western Europe, the structure of Polish
2If compared with the socialist period, when the society was characterised by strong egalitarianism, income differentiations grew exponentially, with the richest 20% of households having an income per capita 6 time higher than the poorer 20% (Gorzelak, 1998).

POLISH ENTERPRISES IN TRANSITION BETWEEN STATE INTERVENTION … 111
industry moved towards an increased share of medium- and high-technology and basic consumer goods at the expense of raw materials and simple semi-finished goods dominant under communism (Domanski, 2006). The centrality of privatiza-tion to the transition is instead a post-socialist peculiarity, and focused on the effi-ciency gains of the adjustments to capitalism, as privatization was assumed to pro-vide efficiency through private propriety and competition, motivating economic performance. Therefore privatization was supposed to reform not only the man-agement of enterprises, but the economy as a whole, due to the relationship be-tween private propriety and market efficiency (Kornai, 1990; Estrin, 1994).3
The struggle around the privatization bill lasted 10 months, mainly due to dis-agreement on its basic principles. The government wanted to implement a British-style privatization, with the sale of state-enterprises by the state organs through public offering. Part of the Solidarnosc establishment opposed the plan, preferring “employee share ownership privatization” (Kowalik, 1991). The support of Jeffrey Sachs was crucial to defeat this position and to break the reached legislative stale-mate. The government, and in particular the Minister of Privatization Janusz Lewandowski, with the help of World Bank and International Monetary Fund and World Bank (that made their structural adjustment loan conditional on the adoption of the bill), rejected the “employee share ownership privatization” model in order to facilitate the concentration of capital. The legislation finally passed by the Sejm in July 1990 was ultimately ambivalent regarding the decision-making and pro-gramme design of privatization. The system implemented entailed a two-tier sys-tem with the state deciding the overall direction of privatization and the level of revenue expected on annual basis (Shields, 2004).
Two main forms of privatization have been adopted: by liquidation and the so-called capital privatization. There are two types of Privatization by liquidation (Gorzelak 1998):
− Liquidation on the basis of the Article 19 of the Law on State Enterprises (1981). Under this procedure the existence of state-owned enterprises as a le-gal entity is terminated if it is in difficult economical conditions. In this case, the propriety of such an enterprise may be sold or leased, usually in parts;
− On the basis of Article 37 of the Law on Privatization of State Enterprises (1990). In this case a state-owned enterprise is liquidated, by selling or leas-ing, to a buyer.
3As stated by Schusselbauer (1999), “Privatization should result in a new private and institutional ownership structure replacing the old sclerotic state-administered system with his low efficiency pressure and distorted market and price signals. There is little doubt that private ownership leads to an incentive system in which the costs of production are minimised according to the relative price structure and the output structure is oriented towards market signals given by the preference structure”.

GIANCARLO COTELLA 112
Capital Privatization, based on Article 5 and 6 of the Law on Privatization of State Enterprises. A state enterprise becomes a company wholly owned by the State Treasury and than issues shares. If over than 50% of the shares are sold to private owner(s), the enterprise is considered to be privatized. In many cases the shares are offered at the Warsaw stock Exchange.
Also a sort of Voucher-type Privatization was introduced in Poland in 1996, un-der the so-called National Investments Funds Program. The State Treasury became owner of 512 state enterprises, managed by 15 National Investment Funds (NIF). Coupons issued by these funds covered the value of the enterprises and where made available to each adult citizen at a price of 8$. By the end of 1998 the cou-pons unsold were turned into share and managed by the NIFs.
The privatization process has gone through ups and downs. The peak in the pace of changes in the ownership structure came in the second half of 1991. By 1997 some two-thirds of the original number of 8441 state-owned enterprises at the end of 1990 had begun the process of ownership transformation. In every fourth state enterprises this process was completed. Up to the end of 2004, some 7165 state enterprises had been privatized (including 1852 through closure), constituting the 85% of the entire amount.
Nevertheless, none of the contending approaches to privatization has been par-ticularly successful. Building domestic capitalism has proved a hardly solvable problem for all Central and Eastern European states. Ownership changes have not brought with them significant amount of investments, and privatization has not succeeded in immediately creating domestic agents of capital.4
In a transition path dominated by the believe that only with an appropriate level of investment it would have been possible to reach high growth rates in the long run (Gorzelak, 1996), the scarcity of domestic capitals in Poland at the turn of 1989 strongly slowed down the process. Therefore the crucial factor to successfully pur-sue the wished scenario was the establishment of the framework of rules necessary to guarantee to foreign capital to play a strong role within the scenario itself. Sev-eral incentives had to be developed in order to attract foreign capitals to enter pol-ish privatization process. The presence of a big share of foreign capital resulted in the establishment of a sort of vicious circle that contributed to inhibit the rapid development of domestic capitals, with the former starting to gain control of Polish market. In quantitative terms, of the combined earnings of the top 500 polish firms in 1999, 30,8 percent was constituted by foreign capital, against 19,8 percents of domestic one (the rest still being State-owned enterprises). In 2000 foreign capital
4Restructuring has been disappointing, so much that the UN World Economic and Social Survey states that “however different the speed and depth of economic reform, one key problem was common … In none of [the Central and Eastern European countries] have economic agents conformed to the model that the policy makers had in mind as their goal when they launched the reforms” (UN 1995: 163).

POLISH ENTERPRISES IN TRANSITION BETWEEN STATE INTERVENTION … 113
had reached the 35.6 percent, while domestic one just 21.3 (Rzeczpospolita, 2001). This fractions are the dominant structures articulating the process of capital accu-mulation in Poland, and will be further explored in the following paragraph.
Foreign direct investment in the polish “capitalism without capitalists”
Immediately after the beginning of the transition period, with the end of the state control over the market, a growing number of western enterprises started to relo-cate their businesses in the ex-socialist nations. Favoured by the specific legal framework appositely created by the government, foreign investment played a cru-cial role in the privatization of state-enterprise apparatuses, proceeding at growing pace after 1989.
The entrance of foreign capital on Polish markets could be divided into three different time periods:
− Before 1989: economic relation with international capital existed before 1989. Since the 1970s, several Western enterprises tried to penetrate the iron curtain and to locate part of the production in CEECs, in order to have access to a new share of market, taking advantage of Polish government consensus on the benefit of Foreign Direct Investments. Several franchising and licens-ing agreements followed larger firms operating in the region (e.g. ZPT Kra-kow produced Marlboro under licence since 1973). The equivalent of a chamber of commerce, InterPolCom, was set up in 1977 to facilitate foreign direct investments, that in 1986 amounted at $100 million (Sklair, 2001). Nevertheless several attempts of “opening up” (e.g. Gierek’s import-led growth strategy of the 1970s), the socialist structure inhibited a massive colonization of the economy, limiting foreign intervention to the creation of small businesses, and permitting large production only under franchising or licensing agreement (Shields, 2004).
− 1989–1991/2: this period was characterised by prudent industrial investment, mainly operated by mixed groups, aiming at testing the characteristics and the stability of the new market together with the financial atmosphere, the real possibility to re-export profits, the potential delivery market, the political stability, the cost and quality of the labour force (Michlak, 1993; Buckley–Ghauri, 1994). The role of the state have been crucial in this process, as it undertook the organizational reforms necessary for a proper functioning of the new economic model. Among them are worth a mention: lifting the limit on the size of private firms, elimination of legal limitation hindering private entrepreneurship, elimination of 49% limit of foreign participation in joint

GIANCARLO COTELLA 114
ventures, establishment of the Ministry of Ownership and Transformation (dealing with privatization), opening of the Warsaw stock exchange (in 1991), reorganization of a former institution giving obligatory concession for foreign investments into the Polish Agency for Foreign Investments, with the specific task to promote Poland among foreign investors and facilitate their intervention with financial deregulation (Szul–Mync, 1997).
− A second period, after 1993, witnessed the jump into the stage of multina-tional enterprises and the number of investments saw an exponential growth together with a complex diversification of the investment fields (Blazyka, 2001). The state has not been passive in this process, enhancing legislation aiming to the provision of generous incentive like tax holidays and tariff and quota protection in accordance with Prawo celne z 1989 (Costum Law of 1989) and Prawo z 1991 roku o spolkach z obcym udzialem (1991 Law on companies with foreign participation). Due to the exponential reduction of bureaucracy and to the increasing legal protection for FDI, particular sectors of the economy were gradually transformed from state-owned monopolies to transnational capital monopolies, in a process where privatization, instead of bringing about competition and demonopolization, perpetuated and exacer-bated market domination and concentration. (e.g. Fiat and General Motors dominated the auto sector after negotiating state protection from competing imports. Gowan, 1995).
Foreign capital began to enter practically all sectors and branches, its most visi-ble presences being in car industry, trading, food industry, furniture, electronics, and since the second half of the 1990s also in banking and financial services, now the main direction of investment (Szleszynski, 2006).
In the beginning of the transformation (see Table 3), the main amount of foreign capital invested in Poland was coming from USA and international organization (i.e. the IMF, the World Bank, etc.), and the situation lasted until the end of the 1990s. Nevertheless the striking poor presence of European capital in the early period, the share of foreign investment in Poland will invert in favour of European capital on the edge of 2000, and as of the end of 2004, 74% of all investments in Poland had come from EU15, with France, Germany and the Nederland on top (Szleszynski, 2006). The total amount of foreign capital inflowing to Poland con-tinued to growth exponentially until now during the whole transition period (see Table 4).
As showed, during the 1990s, the main aim of polish legislation was to elimi-nate constraints to foreign investment, considered an essential element for eco-nomic recovery (Fischer, 2000). Nevertheless, while contributing to revitalize through privatization a great number of declining state enterprises, several negative effect are often associated to foreign investments (Paul, 1995; Shields, 2004), as

POLISH ENTERPRISES IN TRANSITION BETWEEN STATE INTERVENTION … 115
the main share of profits they generate is re-exported outside national borders and does not contribute to positively affect national development, and foreign-pro-moted activities are usually easily to be relocated once the economic context is no longer favourable.5
Table 3 The biggest foreign investments in Poland by countries
Country 1991–1993 Capital invested M $
Country 1995 Capital invested M $
USA 1050 USA 1702 International org. 245 International org. 871 Italy 220 Germany 512 The Netherlands 210 Italy 378 Germany 203 The Netherlands 353 Austria 195 UK 319 France 180 France 275 Sweden 80 Austria 246 UK 78 Sweden 140 Switzerland 40 Switzerland 121
Source: List of major investors in Poland. Polish Agency for foreign investments. Rzeczpospolita 22 April 1995.
Table 4 Inflow of foreign capital in Poland, 1976–2005
Year M $ Year M $ Year M $
1976 6 1986 16 1996 4498 1977 65 197 12 1997 4905 1978 25 1988 15 1998 6365 1979 30 1989 11 1999 7270 1980 10 1990 89 2000 9343 1981 18 1991 291 2001 5714 1982 14 1992 678 2002 4131 1983 16 1993 1715 2003 4589 1984 28 1994 1875 2004 12873 1985 15 1995 3659 2005 7724
Source: Central Statistic Office.
5Furthermore, foreign investments proved to be highly spatially selective, since they hardly targeted decline areas, and interested mainly those already affected by economic growth, leading to a worsening of spatial polarization effects (Cotella, 2007).

GIANCARLO COTELLA 116
Coming to explore the development of domestic capital, whereas in Western Europe large-propriety owners created the institutions of the market economy, in Poland and other CEECs one of the main aims of transition was to promote private ownership through mass privatization. Following Eyal et al. (1997) it is possible to notice, that whenever the process of transition has been characterised by the rapid creation of the legal and institutional framework necessary for a market economy to work, this led to a scenario where the existence of new market institution com-bines with a relatively scarce presence of national propriety owners. The resulting model is a sort of “Capitalism without capitalists”, characterised, rather than by a real capitalists class, by a complex network of cross-ownership, self ownership and ineffective small shareholding via investments funds connected with state-owned banks (Stark, 1996), with a new “power elite” controlling the command positions of political and economic institutions. Therefore, a new “Polish bourgeoisie” in an economic sense remains unfulfilled in a scenario where the only distinct owners are the state and foreign capital (Eyal et al. 1997).
Even if a first wave of national capitalists emerged during the 1980s, when Polish government favoured first attempts of privatization and the creation of small businesses, partnership with foreign capital was often the main condition of the emergence of new economic subjects, as almost no capital was present to under-take private investment on polish territory. The introduction of free-market proc-esses stimulated the rapid development of domestic private entrepreneurship, with a million businesses registered in 1991, a second million achieved by June 1993 and a third by December 1999 (Sleszynski, 2006). Nevertheless the 3.6 million firms in existent in Poland by the end of 2004, most of them are small activities frequent family-owned, and very few are large enterprises. The main role in the economy of the country is played instead by the largest firms (the first 500 firms in terms of income account for around the 60% of the national total), most of which depend from foreign capitals. The conditions provided by the state, favourable to foreign investment due to continuous deregulation, in fact constituted a strong in-hibition for the formation of a solid national entrepreneurial class. Where it did happen, the relatively young formation and the limited financial capital, most of the time leads to an unfair competition with the foreign counterpart on international markets, as well with foreign investors on their own territory.
The Crucial Role of the State
In the majority of studies concerning Central and Eastern Europe, the international influences has seldom been considered as a main driving force, while it is evident how the international scenario has been crucial, as Poland had to promote its own

POLISH ENTERPRISES IN TRANSITION BETWEEN STATE INTERVENTION … 117
economic development inside a complex international scenario influenced by in-ternational multi-lateral institutions (Shields, 2004).
As underlined by Piazolo (2000), Polish transition had a strong European fla-vour, as accession into the EU was always linked to political conditionality in the establishment of a functioning market economy. Also the International Monetary Fund (IMF) contributed to influence the macroeconomic reform, guaranteeing credits and loans that created the necessary economic stability for commercial in-stitutions and foreign investments to operate (therefore constituting a sort of van-guard of the capitalist economy). When it was time to take the hard measures in the period of transition, Polish government often used IMF and EU Accession Treaty as a cover excuse to undertake the most controversial steps (Szul–Mynk, 1997). But, as Rodrik (1989) affirms, to embark reforms formally agreed with the EU or the IMF in order to enhance their credibility, also strongly reduced the scope of governmental manoeuvring and flexibility in arbitrary changing the policies. Thus, it can be said that the main directions of Polish development have necessarily been embedded in a wider international system, in an era characterised by international agents overcoming permeable national borders and configuring the material basis for political processes (Rosenau, 2000).
Within the described internationally influenced framework, the transition proc-ess transforming Polish economic system from centrally-planned to market ori-ented, has been often explained as characterized by a withdrawal of the state from economic intervention. Although this argumentation has been very often raised to counteract the proposition of a more regulation-oriented transition, the followed path presented a high degree of state intervention. As Shields (2004: 133) affirms, “one of the ironies of transition is that despite the collapse of state socialism the role of the state has not necessarily diminished, instead the nature of state interven-tion has changed”: occurring in the context of contemporary capitalist world order, the government approach to the transition has been strongly influenced by several international forces, and reconstituted in favour of international capitals.
Particular state apparatuses assumed the role of the leader in the sphere of pro-duction and finances, like agencies directly connected to the national economy, such as Ministry of finances, progressively began to influence the role of the Min-istries of industry, labour, housing, and progressively subordinated their needs to the one of international economic forces.
The minimal state philosophy adopted in Poland, characterised by a laissez-faire rhetoric hiding strong government interventions in favour of capital, nation-ally found a strong justification in the resurged cultural beliefs in self-reliance and individualism, caused by 45 years of attempt to impose uniformity (Sykora, 1999). The slogan “the less government the better” was used in order to support abolition of taxes on foreign capital, to phase out Social Security systems in favour of pri-

GIANCARLO COTELLA 118
vate retirement and to promote the privatization of historically public welfare sec-tors.
The increased power of capital was not necessary removed power from the state. It is the nature of state intervention that has changed, intervening in this in-tensification process and taking care of the interests of the international capital in order to benefit from further investment and reach faster overall economic growth.
Examining the economic and the political as distinct moments part of the same totality, it is possible to understand how such a neoliberal economic project has been preformed through the harmonization of fiscal, monetary, industrial and commercial policies in order to fully enable the functioning of international capi-tals. Public intervention played a very important role in this process (as it appears clear analysing the legal and institutional reforms described in part 5), as political and economic leaders did not consider public involvement itself to be inappropri-ate, but rather specifically social services-oriented ones to be unwanted.6
Conclusion
The elements described above show how the process of economic restructuring occurred in Poland during the transition period has been a complex process, pre-senting both the features of a post-fordist transformation as well as a strong post-socialist flavour. Capitalism did not fall on Poland fully formed from the sky in 1989, rather the state has been the architect of a specific type of transition, estab-lishing new “rules of the game” and embedding Polish economy into a wider inter-national scenario. Two main dimensions of such an approach can be underlined: on the one hand the enforcement of logics and laws of capital accumulation by the provision of the necessary stability for the new market economic model to work. On the other hand the dismantling of the welfare system developed under the pre-vious historical period that contributed to impose the cost of transition on labour.
In the socialist period, nevertheless the long term objectives of overall economic growth, and in spite the rigid top-down structure and the weak horizontal integra-tion among sectors, the society was the object of a complex system of service de-livery and redistribution operated by both state apparatuses and state enterprises. Even though the original theoretic objective to diminish the gap between urban and rural areas and between the levels of development of the different regional realities
6In this direction moved the already introduced reforms of the pension, as well as the lack of corrective measures to fight constantly increasing social and spatial polarization. Unemployment is still one of the major emergence: peaked at 16% in 1994, it dropped to around 10% in 1997, due to the stabilization of the economic situation after the negative effects of the firsts years of the shock therapy. Since then it has been raising steadily towards the 20% of 2001, the worst situation since WWII.

POLISH ENTERPRISES IN TRANSITION BETWEEN STATE INTERVENTION … 119
was soon given up as economically unrealistic, the decentralization of industrial production and the creation of a strong welfare system contribute to the achieve-ment of a sort of social and spatial re-equilibrium.
In the new transitional scenario, the state reorganized its role from leader of the economic development and provider of the benefit deriving from the economic growth in form of redistributive policies, to designer of the rules for new players to play the game and to guarantee national economic growth inside the broader global scenario.
Such a transition path adopted by the state, aiming at the production of the ideal conditions for international capital to operate and to perpetuate itself within the new context, did not produce equal development possibilities at the local level. The transition process proved to be strongly spatially selective and only those centres that were able to attract capital fluxes, mainly foreign, and to offer valid guaranties to private investors, ended up with benefits. This situation led to two contradictory phenomena: on the one hand the consolidation of new “pulling” regions, on the other hand the inertial resistance to any transformation of the regions characterized by structural inertias (cf. among others: Paul, 1995; Bachler et al. 2000; Gorzelak et al. 2001).
The new role played by the state could be seen as Janus-faced, strongly inter-vening in favour of capital but following a laissez-faire rhetoric when is referring to its role as a “redistributors of benefits” to the society. This attitude results in a substantial subordination of national and local interests to the international dimen-sion, and degenerates in growing phenomena of both social and spatial polariza-tion.
In conclusion, nevertheless many of the conditions that negatively influence Poland’s economic development potentialities nowadays could be imputed to the heritage left by the socialist system, it is evident how today’s growing spatial and social disequilibria are also direct consequence of the adopted transition model. The increase of goods and services available notwithstanding, escalating job inse-curity, decreasing in real wages hitting weak social categories, growing unem-ployment, lowering of employment conditions are the real flavours of a transition path that has as a main result the pauperization of the weak classes. Whereas inter-national capital, new managerial elites and financial advisors are the winners of the transition, local communities, working class and socially weak groups have been definitely the losers, as their interests are more and more unheard in a governance system strongly entwined in the broader international scenario.

GIANCARLO COTELLA 120
References
Bachtler, John–Downes, Ruth–Gorzelak, Grzegorz 2000: Transition, Cohesion and Regional Policy in Central and Eastern Europe. Aldershot: Ashgate.
Blazyca, George 2001: Poland’s place in the International Economy. In: Blazyca, George/Rapacki, Riszard (eds.) Poland into the New Millennium. Cheltenham: Edward Elgar.
Brada, Jozef C. 1993: The Transformation from communism to capitalism: how far? How fast? In: Post Soviet Affairs 2, 87–111.
Buckley, Peter J.–Ghauri, Pervez N. 1994: The economies of change in Eastern and Central Europe – its impact on international business. London: Academic Press.
Central Statistical Office: http://www.stat.gov.pl/english/index.htm. Conti, Sergio 1985: Il Modello Sovietico, Pianificazione territoriale e sviluppo economico in URSS e
nei paesi dell’est europeo. Milano: Franco Angeli. Cotella, Giancarlo 2007: Central and Eastern Europe in the Global Market Scenario: Evolution of the
System of Governance in Poland from Socialism to Capitalism. In: Journal fur Entwicklungspolitik. Vienna. Forthcoming.
Domanski, Boleslaw 2006: Manifacturing, Mining and Energy Supply. In: Degorski, Marek (ed.) Natural and Human Environment of Poland. Warsaw: Polish Academy of Science, 233–244.
Enyedi, Gyorgy 1990: New Basis for Regional and Urban Policies in East-Central Europe. Pecs, Centre for Regional Studies of Hungarian Academy of Sciences.
Estrin, Saul (eds.) 1994: Privatization in Central and Eastern Europe: Key Issues in the Realignment of Central and Eastern Europe. Harlow: Longman.
Eyal, G.–Szeleny, I.–Townsley, E. 1997: The Theory of Post-Communist managerialism. In: New Left Review, 222, 60–92.
Fischer, P. 2000: Foreign Direct Investment In Russia: A Strategy for Industrial Recovery. London: Macmillan.
French, Richard–Hamilton, Ian (eds.) (1983): La città socialista, Struttura spaziale e politica urbana. Milano: Franco Angeli.
Gorzelak, Grzegorz 1995: Transformacja Systemowa a Restructuryzacja Regionalna (Systemic Transformation and Regional Restructuring). Warsaw: EUROREG-UNESCO Chair.
Gorzelak, Grzegorz 1996: The Regional Dimension of Transformation in Central Europe. London: Jessica Kingsley Pubblisher.
Gorzelak, Grzegorz 1998: Regional and Local Potential for Transformation in Poland. Warsaw:Euroreg.
Gorzelak, Grzegorz–Ehrlich, Eva–Faltan, Lubomir–Illner, Michal (eds.) 2001: Central Europe in Transition, Towards EU Membership. Warsaw: Regional Studies Association, Polish Section.
Gowan, Peter 1995: Neo-Liberal Theory and Practices from Eastern Europe. In: New Left Review 213, 3–60.
Kornai, János 1980: Economics of shortage. Amsterdam. Kornai, János 1990: The Road to a Free Economy. New York: Norton & Co. Kowalik, Tadeusz 1991: Marketization and Privatization: the Polish Case. In: Socialist Register. 259–
78. Lipton, D.–Sachs, J. 1990: Creating a Market Economy in Eastern Europe: The Case of Poland. In:
Brookings Paper on Economic Activity No. 1, Washington: Brookings Institution. Michalak, Wieslaw Z. 1993: Foreign direct investments and joint ventures in East Central Europe: a
geographical perspective. In: Environment and Planning 25, 1573–1593. Parysek, Jerzy J. 1993: Unemployment – a socially painful stage in the transition from a centrally
planned to a market economy: the case of Poland. In: European Planning Studies 2, 231–241. Paul, Leo 1995: Regional development in Central and Eastern Europe: the role of inherited structures,
external forces and local initiatives. In: European Spatial Research and Policy 2 (2), 19–41.
POLISH ENTERPRISES IN TRANSITION BETWEEN STATE INTERVENTION … 121
Piazolo, Daniel 2000: The Significance of EU Integration for Transition Countries. In: Petrakos, George–Maier, Gunther–Gorzelak, Grzegorz (eds.): Integration and Transition in Europe. London: Routledge, 200–216.
Rocznik Statystyczny (Statistical Yearbok) (1990–1998). Warszawa: GUS. Rodrik, David 1989: Credibility of Trade Reform – A Policy Maker’s Guide. In: The World Economy
12, 1–16. Rosenau, James N. 2000: Change, Complexity, and Governance in a Globalizing Space. In: Jon Pierre
(ed.): Debating Governance: Authority, Steering and Democracy. Oxford: Oxford University Press. 167–200.
Rzeczpospolita 1995: The prospect according to the estimates of the institute for Market Economy Research. 22 April.
Rzeczpospolita 2001. May 8 2001. Schusselbauer, Gherard 1999: Privatization and Restructuring in Economies in Transition: Theory
and Evidence Revisited. In: Europe-Asia Studies. 51 (1), 65–83. Shields, Stuart 2004: Global Restructuring and the Polish State: transition, transformation or
transnationalization? In: Review of International and Political Economy 11 (1), 132–155. Sklair, Leslie 2001: The Transnational Capitalist Class. Oxford, Blackwell. Sleszynki, Przemyslaw 2006: Socio-economic Development. In: Degorski, Marek (ed.) Natural and
Human Environment of Poland. Warsaw: Polish Academy of Science, 109–124. Stark, D. 1996: Recombinant Propriety in East European Capitalism. In: American Journal of
Sociology, 101 (4), 993–1027. Sykora, Ludek 1999: Local and regional planning and policy in East Central European transitional
countries: In: Hampl, Martin (eds) Geography of societal transformation in the Czech Republic. Prague: Charles University, Department of social Geography and regional Development, 153–179.
Szul, Roman–Mync, Agnieszka 1997: The path towards the European Integration. The case of Poland. In: European Spatial Research and Policy 4 (1), 5–36.
United Nations 1995: World Economy and Social Survey. UN: New York.

CARPATHIAN EUROREGION AS AN INSTRUMENT OF UKRAINE’S EUROINTEGRATION STRATEGY
SVITLANA MYTRYAYEVA
Preamble
One of the main current principles of establishing a United Europe is “Europe of regions”. According to this, the basic element of the European Union as a State formation consists in separate regions, the state-members of the EU, meeting the determined criteria and, in general, being all sufficient. That is why, emphasis in the sphere of eternal co-operation should gradually shift to the level of regions.
In practice solution of numerous issues directly regarding separate territorial entities is more rational, efficient and strategic on a regional level.
At present there is a set of institutional and functional instruments of deciding issues in the sphere of external relations on an interregional level. Some of them are universal, while others are one-track.
Among the principal instruments of border and transboundary interregional co-operation the following stand out:
1 Euroregions – organizations of border (transboundary) interregional (intermunicipal) co-operation aiming at establishing and strengthening good neighbourly relations as well as addressing common problems singled out by the constitutional documents regulating the territories of three and more states.
2 Bilateral organizations – organizations of border interregional (intermunici-pal) co-operation, set up to establish and strengthen good neighbourly rela-tions as well as address common problems singled out by the constitutional documents regulating the territories of three and more states.
3 Agreements on co-operation in definite spheres between bordering and not bordering territories that provide for the establishment of institutions of co-ordinating actions.
4 Agreements on co-operation in definite spheres between bordering and not bordering territories that do not provide for the establishment of institutions of coordinating actions.
A Euroregion is the most universal institute among the above-mentioned insti-tutes, which has a considerable potential.

CARPATHIAN EUROREGION AS AN INSTRUMENT OF UKRAINE’S… 123
In Central Europe such organizations started to appear in the 90ies of last centu-ries. Euroregions were among the first, founded on the borders of Poland, Germany and Czechoslovakia, on the borders of Hungary, Austria, Slovenia and Croatia, on the cross-border of Hungary, Slovakia, Ukraine, Romania and Poland.
The main objective set before Central European Euroregions was to harmonise relations among the neighbourly countries and reduce a negative effect of the bor-der with the consideration of the fact that it was not always conditioned by ethical and historical factors.
Besides, the Euroregion had to become an institutional instrument-facilitating co-operation in various spheres of social life, which would satisfy the interests of the parties participating in it.
Thus, Euroregions must become an instrument of external policy of some sover-eign countries, which aspire to establish and maintain good neighbourly relations emerging on a regional (municipal) level.
We must mention that certain Euroregions, as a rule, on a municipal level (e.g. Nisa, Pro Europa Viadrina), established without any support and custody of the national governments (mainly, the Polish and German border), were after a less lofty goal, for instance, to solve some local problems in the defined fields (tourism, ecology, communal infrastructure development). Nevertheless, their cooperation, in general, had a positive, though not direct, effect on the goals mentioned above.
We can claim for the time being that the main objective to harmonise the rela-tions among the neighbourly territories, citizens populating them and governments of these territories predominantly has been achieved by the greater part of the functioning Euroregions. Thus, for example, due to the activity within the frame-work of the Euroregions, the implicitly unsafe territories of the Eastern Carpathi-ans, at the watershed of the Tisza river (the area where the “Carpathian Euroregion is in operation), the Sudeten mountains (the area of the Euroregion Nisa’s activity), etc, were not turned into zones of conflict.
Positive experience of the activity of the Euroregions can be also proved by the fact that today the setting up of the Euroregions in Southern Eastern Europe, on the Balkans is underway through the intermediary of and under the shelter of such respectable organizations as the Council of Europe, the Pact of Stability and others. At the conference “Polish experience in cross-border cooperation” which took place in the city of Rzeszow (Poland) on December 6–8, 2001, the representatives of different international organizations and diplomatic missions of separate coun-tries stressed on an exceptionally positive experience of the Euroregional coopera-tion and on a great role of the similar institutes in a solution of good neighbourly relations harmonization. The representatives of a number of Southern and Eastern European states attended the conference as well, who, according to the organisers, might include the experience of the Euroregional activity in Central Europe into their tooling of external policy.

SVITLANA MYTRYAYEVA 124
Some of the advantages of the Euroregions’ activity should be mentioned here:
− a relatively high level of organization in their activity – existence of statutory documents, the structural formation of the governing and labour bodies;
− strong established links between the governing institutions and autonomous regions, their participants;
− a considerable volume of information about border and transboundary cooperation, cooperation with international organizations, the general state of affairs in various fields of the social life of neighbouring countries;
− finding contact points in transbounary and border cooperation, problem monitoring and search of the ways of their solution;
− political and material support on the part of the European organizations; − creation of the structures that contribute to the development of border (trans-
boundary) cooperation.
However, there is a number of other goals which have not yet been achieved in the result of the Euroregions’ activity or have not yet been set at all. Considering a great organizational potential, the current relations and experience in addressing specific problems, it possible to view the Euroregions as the universal instruments of border (transboundary) cooperation.
By this, it is reasonable to separate the objectives of their activity into the main two directions:
− continuation of carrying out external policy tasks within the European uniting process;
− economization of the Euroregions’ goals, putting forward new tasks in the sphere of external policy and regional development.
− Proceeding from an opportunity to set such strategic aims, the Euroregions must fulfil the following tasks:
− supporting and deepening good neighbourly relations among bordering territorial entities;
− taking advantage of the labour bodies of the Euroregions as the centres of collecting information about the activity of the state bodies and economic agents of certain countries, international organizations, processes taking place in Europe, about the ways of resolving problems in some fields of life activ-ity, of experience analysis and models of its use in modern circumstances;
− transforming the Euroregions into information and methodical centres of bor-der and transboundary cooperation that facilitate a search of partners, estab-lishment of relations among them;
− taking into view available information and relations, using the Euroregions as intermediary structures in attraction of investments and donor potential into the country;
CARPATHIAN EUROREGION AS AN INSTRUMENT OF UKRAINE’S… 125
− using the Euroregions and their labour bodies as structures that create a posi-tive image of a country and its territorial entities as well;
− using lobbying opportunities of the Euroregions, first of all, those that con-cern the European structures;
− turning the Euroregions into organisers and partners of various international projects, considering their potential and experience in a solution of numerous issues in the field of border (transboundary) cooperation.
It comes as natural that the list mentioned above is open, it could be carried on depending on the tasks the external policy will face with time. Generally speaking, a Euroregion is a viable and rather efficient instrument of an external policy, which is able to adapt and change under the conditions of a definite situation, change an objective and manners of actions, thus, coming of use in the right circumstances in the achievement of strategic tasks of any country, particularly, of Ukraine, being one of the instruments of its European integration strategy.
On the history of the issue
Transboundary cooperation among neighbourly countries on the level of regional and local governments is considered to be one of the most significant issues of the current agenda in Europe. At present more than 30 Euroregions are functioning in Europe, which have become part and parcel of the European integration and con-flict solution. The “Carpathian Euroregion” (CE) is the only Euroregion in Europe including the bordering territories of the five post-communist countries on different economic levels with heterogeneous ethnic, religious and cultural structures. That is why, from the moment of its existence there arose a problem of creating a system of mutual interests and cooperation with the aim of minimization and avoidance of a potential tension, misunderstanding among the peoples populating these territo-ries.
Significance of a Euroregion rises during the process of the EU extension and entering a number of states – EU members into its composition. By the way, it has become a contact area of the EU eastern border. This area can turn into a source of tension or into a source of stability. Therefore, taking into account the concept of “Europe of regions”, based first and foremost on safety and stability, it is in the interests of the CE and the EU to facilitate the process of vigorous activity and extension of the “Carpathian Euroregion”.
The model of the “Carpathian Euroregion” was developed in theory with the assistance of the experts from the Institute of Research East – West (the former name Institute of East-West), who promptly voiced that numerous local initiatives of transboundary cooperation are not supported and understood by the national

SVITLANA MYTRYAYEVA 126
governments. This problem remained on the fringes of the interests of the EU structures. At the same time there emerged a threat of a new “iron curtain” between the countries of Central Europe and the former republics of the Soviet Union. For this reason, at the international conference “Regions in international cooperation” held in Mihalovtse (Slovakia) in November 1991, a concept and priorities of inter-action of bordering administrative and territorial entities of the regional level of Poland, Slovakia, Hungary and Ukraine were set (1).
The conference in Nyíregyháza (Hungary) in May 1992 became the next im-portant organization stage. The attending representatives of the Institute of Re-search mentioned above proposed to join the Ukrainian, Hungarian and Polish ini-tiatives with the aim of setting up the “Carpathian Euroregion”. There was estab-lished a committee which would prepare all the constitutional instruments of the union – Agreement and Statute – during the session of the representatives of the regions involved which took place in June in the same year in Uzhgorod.
On February 14, 1993 the Ministers of Foreign Affairs of Hungary, Poland and Ukraine ratified a declaration in the city of Debrecen (Hungary), which claimed that the “establishment of the “Carpathian Euroregion” would greatly contribute to strengthening of friendship and prospering of the countries of the present region as well as guarantee active application of the principles the Act of the Conference on the issues of Safety and Cooperation in Europe (Helsinki, 1975), the Charter of Paris for a new Europe (Paris, 1990) and other instruments. The creation of the “Carpathian Euroregion” will direct the efforts of the Council of Europe and the European Union into the sphere of regional cooperation development”. That date is considered to be the day of the official registration of the international association the “Carpathian Euroregion”. The representatives from the regions of Ukraine, Poland and Hungary, signing the program and statutory documents, became the founders of this international Association.
The territories belonging to the “Carpathian Euroregion” are still at the periph-ery of their countries from a social and an economic point of view. The greater part of them suffers from the problems connected with the environment, an inconsistent infrastructure, unemployment, economic cooperation problems, unequal accessi-bility to various EU funds.
Information concerning the size of the territories belonging to the CE and the population living on these territories can be found in the table.
On February 14, 1993 the Hungarian, Polish, Slovakian and the Ukrainian par-ties signed a basic agreement on the “Carpathian Euroregion”. The international association the “Carpathian Euroregion” was defined as a consultative and coordi-nating body directed at the expansion of transboundary cooperation of its members as was provided by the Project of the European Convention on transboundary co-operation among the geographical communities and authorities No 106 of the Council of Europe.

CARPATHIAN EUROREGION AS AN INSTRUMENT OF UKRAINE’S… 127
The Association was provided to be aimed at:
− organization and coordination of the activity in supporting economic, scien-tific, ecological, cultural and educational cooperation among its members;
− development of separate projects on border cooperation among its members in the sphere of mutual interests;
− facilitation of contacts among the peoples of the regions-members of the Association, in particular, contacts among experts in various branches;
− support of good neighbourly relations among its members; − support of the regional development of all its members; − determination of the potential areas for a multilateral border cooperation of
its members.
The existence of an associated transboundary association of local and regional communities, whose interests are presented by the government bodies as well as local self-administration offered the following opportunities:
− common exploitation of energy resources; − common policy making in the sphere of environmental protection; − increase of a foreign capital flow; − working out of regional development programs; − production of competitive goods, facilitation of local initiative implementa-
tion (3); − development of transportation links on the territory of the “Carpathian
Euroregion”, overcoming the problems of an insufficiently developed infra-structure;
− development of a modern economic structure of the region; − harmonious development of man’s activity; − development of the health protection system, social and cultural protection
system; − diversification of tourism; − strengthening of the European and Atlantic cooperation (4).
However, for absence of a strategic approach to the vision of the development prospects of the “Carpathian Euroregion” within the ten years of its existence the greater part of opportunities rising after its formation in 1993 were not taken.

SVITLANA MYTRYAYEVA 128
System problems of the CE after the EU expansion
The entrance of the countries of Central and Eastern Europe to the EU on May 1, 2004 had a great impact on the role and place of the “Carpathian Euroregion” in the field of cooperation between Ukraine and its Western neighbours and the Euro-pean Union in general. From a geopolitical point of view, the status of the “Carpa-thian Euroregion” has undergone changes.
If before the EU expansion the “Carpathian Euroregion” took a somewhat nar-rowed and local function of the organization of transboundary integration of border administrative and territorial entities of the states of the Carpathian states basin, after the entrance of Poland Slovakia and Hungary into the EU it assumed quite a different role of a higher organizational form of transboundary cooperation on the new Eastern borders of the European Union with closest neighbours, Ukraine in particular. The Euroregional cooperation development in this way has transformed into an integral part of the EU general Western strategy and has become a matter not only of the states-participants of the Euroregion bordering on Ukraine but also a matter of the European community in general.
Such geopolitical changes have become a positive push to the development and improvement of cooperation within the EU framework. The Euroregion’s status, higher than it used to be, is an actual reaching by the Euroregion the level of the relations system between Ukraine and the EU, but not only the bilateral interstate relations between Ukraine and its neighbours; it also conditions the lengthy exis-tence of the “Carpathian Euroregion”.
Therefore, in the author’s opinion, “the dramatic forecast” of the possible clos-ing down of the transboundary cooperation through the “Carpathian Euroregion” after the entrance of some Central European states to the EU are groundless. On the contrary, both the states-members and the EU in general are insisting on the expan-sion of the Euroregional cooperation with Ukraine. Generally speaking, trans-boundary cooperation is considered by them as one of the most perspective direc-tions of interaction with the Ukrainian state aimed at admitting it to the general European integration processes. Accordingly, Ukraine regards the development of transboundary and Euroregional relations in the Western direction as an additional essential “integration bridge” for its approaching the EU.
There are a number of advantages facilitating the further functioning of the “Carpathian Euroregion”. The attitude to the Euroregion and to transboundary co-operation of the central governing bodies of these countries as well as those of Ukraine has changed. The problems of functioning of the Carpathian and other Euroregions have reached the general state and interstate level. The “Carpathian Euroregion” has gained general European recognition.
It could be claimed that the “Carpathian Euroregion” has formed as trans-boundary integrity. In the author’s opinion, the factors of a system character have

CARPATHIAN EUROREGION AS AN INSTRUMENT OF UKRAINE’S… 129
been detaining the development of cooperation within the framework of the “Car-pathian Euroregion” till present time the most obvious among them being a consid-erably different level of reform processes in the countries, bordering administrative and territorial entities in the composition of the Euroregion. On the one hand, Po-land and Hungary left their neighbours far behind in their paces and depth of so-cial, political and economic reforms. In 1999 they became the NATO members. At the end of the 90ies Slovakia also quickened system transformations and promoted the Euroregion cooperation. Thanks to these purposeful actions it managed to catch up with Poland and Hungary with its reforms and enter together with them into the EU on May 1, 2004. On the other hand, Romania and Ukraine did not justify re-forming expectations. Nevertheless, Romania has an opportunity to join the Euro-pean Union in 2007 while Ukraine will still remain beyond the EU boundaries. That is, a gap in system reforms is going to have an undesirable effect especially in the field of cooperation within the “Carpathian Euroregion” between Western Ukrainian regions and its foreign partners.
System differences regard first of all the spheres of economic transboundary cooperation. The market regional economy and the regional agriculture that was not gradually reformed because of the administrative interference have a lot of interconnected elements in common. This base makes it almost impossible to cre-ate an ideal system of economic interrelations, which would lead to the formation of an integral in an agricultural respect international transboundary region.
On the other hand, differences in reforms did not allow to realize within the framework of the “Carpathian Euroregion” a binding requirement of the general European institutions concerning transboundary, Euroregional cooperation, par-ticularly, concept coordination of the social and economic development of the bor-dering territories.
At present it can be stated that the development of the “Carpathian Euroregion” is going through a critical moment after the EU expansion. It is the time when they should shift from a political and declarative economic Euroregional cooperation to the priorities of economic cooperation and realization of specific mutual agricul-tural transboundary projects. This is shown, for example, by an appearance of new institutional forms of transboundary cooperation, which are being used to minimize the challenges connected with the EU expansion. By the way, these new instru-ments are emerging on the both sides of the Eastern EU border and are being im-plemented by the local governing bodies, particularly, in Transcarpathia during the realization of the “Europe of regions” motto.

SVITLANA MYTRYAYEVA 130
What is it about?
“The strategy of transboundary cooperation development in the Carpathian region “Carpathians 2003–2011 (October, 2003) has been initiated by the Transcarpathian regional state administration as well as the Transcarpathian regional council and supported by the regional governing bodies of the bordering regions of Ukraine, Poland, Slovakia, Hungary and Romania. The basic ideas of the Programme of Ukraine’s integration to the European Union in the field of bordering policy lie in the foundation of the Development Strategy.
Analyzing a specific character of the bordering territories (sector, political and territorial), the Development Strategy consists of the preferred strategic pro-grammes of the development of these territories (infrastructure, economy, envi-ronment, nature and country development, tourism, social and cultural integration), which is sure to smooth possible negative results of the EU expansion in a short-term period.
Another programme – “Nyíregyháza initiative” (October, 2003) – has been ini-tiated by the Ministry of Foreign Affairs of the Hungarian Republic as well as the local authorities of Szabolcs-Szatmár-Bereg region as an instrument of practical realization of the New Policy of the EU Neighbourhood. The main objective of the Initiative is to strengthen the links between the local and the regional bodies on the both sides of the EU Eastern borders.
Recently active cooperation under the programme “Interregio” has span up. Signed a couple of years ago, it had a formal character only. At present eleven common projects in humanitarian and economic spheres have been prepared. It is planned to set up transboundary territories of environmental protection and land-scape the Tisza water gap and protect it. The issue of a further cooperation of the bordering regions was discussed during a working meeting in February 2004 of the heads of Szabolcs-Szatmár-Bereg region (Hungary) and Satu-Mare region (Roma-nia).
We cannot but mention the “Concept of the common development of the Ukraine’s and Hungary’s bordering territories” approved by the Transcarpathian Regional body in June 2003. Its strategic objective was to exploit to the full the opportunities of transboundary cooperation between the two countries in order to improve the conditions of the social and economic life of the people on the both sides of the border.
The Programme of the strategic development of the “Carpathian Euroregion” is also of utter significance. It was prepared by professor Istvan Suli-Zakar (the Uni-versity of Debrecen) (5), and deliberated at one of the last sessions of the “Carpa-thian Euroregion’s” Council. It consists of regional and local programmes of the strategic development of the bordering territories in the EU composition.

CARPATHIAN EUROREGION AS AN INSTRUMENT OF UKRAINE’S… 131
A successful model of regional cooperation under the new conditions will be-come an indicator in our common relations and demonstrate our capability to take an active part in the development of new (transboundary) relations over the com-mon borders of the expanded EU. Common challenges should lead to common actions and suggestions.
Propositions
Proceeding from the mentioned above, a conclusion can be made that there are at least three ways of making contribution to the development of transboundary coop-eration after the EU expansion under the conditions of joining the efforts of the regional structures of Ukraine and its Western neighbours.
Firstly, there is an opportunity for the regional structures and bodies to put the most important issues of transboundary cooperation on the agenda;
Secondly, on the basis of such an agenda there is an opportunity to find an influ-ence lever on the central governments of the states – the expanded EU members-tobe to make them raise some issues on the EU level.
Thirdly, the regions may become active participants of various common trans-boundary projects if they apply for them.
In addition, the regions should play a visible role in the EU expansion but pre-dominantly in the sphere of additional efforts and measures aimed to support ac-tions taken by the states and the authority of the European Union.
New programmes of the neighbourhood: opportunities for the CE
According to the experts’ estimates, the bordering regions of Ukraine are most susceptible to the changes that have arisen and are still to arise in future in the process of the EU expansion to the east. Therefore, transboundary cooperation as a form of cooperation between the bordering regions of Ukraine and the eastern re-gions of its Central European neighbours requires to be profoundly renewed and transformed so that they could adapt to the new conditions determined by the EU expansion.
At present it is possible to rely on the positive changes as the European policy of neighbourhood offers an instrument, which should give an impetus to trans-boundary cooperation. Moreover, this instrument can in prospect be spread to all the regions of Ukraine that will promote interregional cooperation in general.
The programmes of Neighbourhood are expected to function on the whole ter-ritory of the countries bordering on the European Union. Such an expansion of the

SVITLANA MYTRYAYEVA 132
programme will become possible only in 2007 when the Programmes of Neighbourhood will gain a separate status and a budget. But till 2007 these pro-grammes will be in operation only on the territory of the bordering regions on the both sides of the border, particularly, to the east of the EU – the regions of Ukraine, Russian, Byelorussia and Moldova which are subject to the TACIS programme on transboundary cooperation (TACIS CBC). In Ukraine these are the following re-gions: Volynska, Lvivska, Transcarpathia, Ivano-Frankivska, Chernivetska and Odeska. In 2002 the Council on the matters of cooperation Ukraine – the EU sin-gled out one of the main priorities of further cooperation between the European Union and Ukraine – transboundary and interregional cooperation.
The fact that the mechanism of financing the transboundary projects under the TACIS CBC existing scheme is still in force in Ukraine shows the “transitory” status of the Programme of Neighbourhood till 2007. During the years of 2004–2006 about 20 million Euros were allocated to the Ukrainian partners involved in the projects directed at the strengthening of transboundary and transnational coop-eration between the expanded EU and its new neighbour Ukraine within the framework of the programmes mentioned above. The new EU members – Slova-kia, Poland and Hungary are financed under the projects INTERREG, while Ro-mania (prior to its entrance into the EU in 2007) will be financed through the pro-gramme PHARE (6).
In July 2004 the common Working groups (Task Force) comprising the repre-sentatives of Ukraine and its Central European neighbours together with the EU experts completed and submitted for consideration to Brussels the projects of the Common programme documents of such Programmes of Neighbourhood: “Poland–Ukraine–Byelorussia”, “Hungary–Slovakia–Ukraine”, “Romania–Ukraine”.
The Commission has singled out the following general priorities for the Pro-grammes of Neighbourhood:
− facilitating economic and social development in the bordering regions; − implementing common actions aimed at a solution of common challenges in
such spheres as environmental and health protection and combating organ-ised crime;
− maintaining border efficiency and safety; − contributing to the organisation and conducting local social activities.
Further on, the Working groups set general and specific objectives, priorities and tasks within the framework of a separate Programme of Neighbourhood. During the session in May 2004 in Odesa the EU Commission offered to exclude from the Programme of Neighbourhood “Romania-Ukraine” the preferred objec-tives and measures concerning the development of transboundary transportation infrastructure for lack of funds so that later these measures should be included into the following EU infrastructure programmes. However, all the regions on the both

CARPATHIAN EUROREGION AS AN INSTRUMENT OF UKRAINE’S… 133
sides of the border declined their suggestion and offered to preserve them at least on the level of technology and economy as otherwise it would be only possible to preserve the cultural heritage under this Programme of Neighbourhood.
The main problems that the Ukrainian side faces regarding the further imple-mentation of the Programmes of Neighbourhood are absence of funds for their development and for further working out of specific project proposals as well as maladjustment of the mechanisms of the simultaneous co-financing of transbound-ary projects at the cost of the EU programmes, national and regional budget outlays and extra budgetary funds.
In accordance with the EU requirements the Law of Ukraine “On transbound-ary cooperation” provides two main kinds of the projects and programmes of trans-boundary cooperation: joint and national. Under the final provisions of the men-tioned above Law the State Budget of Ukraine of 2005 must allocate funds and determine mechanisms of co-financing the chosen projects on the part of Ukraine.
On the part of the European Union there is also work conducted to process the mechanisms of co-financing of the “matching” transboundary projects at the ex-pense of the programmes INTERREG III in Poland, Slovakia, Hungary, PHARE in Romania, TACIS CBC in Ukraine. At the same time a part of the joint transbound-ary projects of the mentioned above Programmes of Neighbourhood are expected to integrate to the so-called “Initiative CADSES” (Central European, Adriatic, Danube and Southern Eastern European areas) which include the territory of the “Carpathian Euroregion”, the Euroregions of the “Higher Prut” and the “Lower Danube”.
It can be forecasted that the matching of the Programmes of Neighbourhood and, mainly, have the mechanisms of the further co-financing of transboundary projects is going to be delayed. Nevertheless, the actual financing of the specific projects will start in 2005.
But the most significant conclusion lies in the fact that we at last have started understanding transboundary cooperation not only as the arrangement of the bor-ders, customs-offices, etc but also as cooperation and interaction of the regions. The concept is filled with a new meaning, and, accordingly, new tasks are set. This leads to new responsibilities and obligations. Thus, further strengthening of the borders, constructing of new modern transfers and modernisation of the already functioning ones, developing the bordering infrastructure and other matters have been included into the agenda.
Today Ukraine and other adjacent territories should actively take advantage of the “Carpathian Euroregion” as a functioning instrument of the development of the bordering regions and European integration on their way to “Europe of regions”.
The Ukrainian bordering territories enter into the four Euroregions at the same time: the “Carpathian Euroregion”, the greatest one, unites the territories of Poland, Slovakia, Romania, Hungary as well as Transcarpathia, Lvivska, Ivano-Frankivska
SVITLANA MYTRYAYEVA 134
and Chernivetska regions of Ukraine; the “Lower Danube” includes Romania, Moldova, Odeska region; the “Bug” covers Poland, Byelorussia and Volynska region; the recently established “Higher Prut” unites the territories of Romania, Moldova and Chernivetska region. The Prime Minister of Poland L.Miller men-tioned in his speech at the last economic forum in Lviv that “we must use the EU expansion for the development of this part of Europe so that it would not turn into a great depressive region in future”.
So far the mentioned Euroregions have not lived up to the set objectives. It is understandable as the structures are functioning exclusively on a community pro-ject basis. It could seem at first sight that the “Carpathian Euroregion” that has existed for more than ten years already is well known in Europe as successful and extensive. It has been involved in numerous European programmes. But if we look at the Ukrainian regions the most active region (particularly, financially) is Tran-scarpathia, which is in a traditional close contact with Hungary and Romania. But lately Ivano-Frankivska and Chernivetska regions have picked up with Chernivet-ska facing the “Higher Prut”. This cannot be said about Lvivska region despite its powerful potential. It is cooperating more or less actively with Polish regions on a bilateral level. From the point of view of the European community if a bordering territory (region) enters the European structures together with its administration and financial provision it is dealt with at the same high level as with the local gov-erning bodies. In such a way, the Euroregions become the subjects of international activity.
The anomaly lies in the fact that the European and other structures are ready to finance useful and interesting programmes, but, according to some experts, serious and efficient programmes are ignored. For instance, the “Carpathian Euroregion” has spent during the last years 1 million USA dollars on an integration programme and employment for the Romanies, 120,000 dollars on establishment and develop-ment of enterprising, 500,000 dollars on communication systems development. Ukraine has virtually received nothing besides this. However, when Poland and Hungary as the EU members apply for thirty-forty projects, Ukraine applies for two or three only.
The bordering countries on the both sides of the EU eastern border have not lost the previously established relations and understanding of the mutual problems, which were of a bilateral nature. The following step within the Euroregion is to reach the general European level. In order to do this in such Euroregions it is nec-essary to set up serious executive structures, which would have their action, pro-grammes, a methodological basis (7) and a legal status.
The role of the bordering territories of the “Carpathian Euroregion” in interna-tional cooperation is of great significance from a political and territorial point of view. This Euroregion is regarded as an area of immediate interaction of the economies of Ukraine, Poland, Slovakia, Romania and Hungary. In a result of the

CARPATHIAN EUROREGION AS AN INSTRUMENT OF UKRAINE’S… 135
EU expansion to the East in 2004 the bordering regions of Poland, Slovakia and Hungary gained the status of contacting areas of partner interaction of the coun-tries-neighbours with a considerably different geopolitical status: Ukraine – an out of the bloc nuclear-free state-member of the CIS; Poland, Slovakia and Hungary – states-members of the EU and NATO, Romania – a member of another group of candidates for the entrance to the EU and NATO.
Therefore, the bordering regions of Poland, Slovakia and Hungary have been on new external borders of the EU with Ukraine since 2004. Only the states and their bordering regions through their mutual projects, particularly, in an economic sphere and using a Euroregions as an instrument are able to reduce to a minimum the possible negative consequences of the dividing lines in Europe of interstate and interregional cooperation between Ukraine and Hungary, Ukraine and Poland, Ukraine and Slovakia, Ukraine and Romania. That is why, transboundary coopera-tion, particularly in the “Carpathian Euroregion”, cannot be effective without the guidance and coordination of branch and territorial projects. Harmonious develop-ment of the bordering regions is possible only through the joint development pro-grammes and “matching” branch projects. Transcarpathia has made its first suc-cessful steps in this direction actively using the Euroregions as an integration in-strument.
Thus, the EU expansion process in 2004–2007 may come to a standstill on the Western border. Nevertheless, Ukraine feels its effect, is actively preparing for a new neighbour and does not lose hope of making its European dream come true. Generalisation and usage of a positive experience of the modern stage of European integration on a regional level should contribute to the realisation of practical tasks of Ukraine’s entrance into European political, economic and legal space. Much depends on Ukraine only whether it remains an EU neighbour, a privileged one, or it moves ahead and deepens relations with this powerful European organisation.
Conclusion
At present we can state the fact that the Carpathian region is one of the most stable regions in respect of safe peaceful co-existence in Europe. Despite the fact that the borders of the five states have their points of coincidence here sometimes made without considering ethnic principles. These states have their own political, eco-nomic and cultural interests in the region. The stability factor in the “Carpathian Euroregion” is undoubtedly a credit of the activity of the national governments of the autonomous bodies and a respective model of a tolerant behaviour of the population of the bordering territories.

SVITLANA MYTRYAYEVA 136
In spite of the fact that the “Carpathian Euroregion” carries out its main mission it now faces one of the most important tasks of becoming an efficient instrument of Ukraine’s European integration.
The gained experience of setting up such associations as the “Carpathian Eu-roregion” in Western Europe proves the fact that it takes a long time to achieve an efficient level of functioning for the similar structures, harmonisation of the par-ticipants’ interests, development of mechanisms of transboundary cooperation and of finding influence levers on the level of the national governments with the aim of establishing a favourable legal environment. As for Ukraine the bordering territo-ries make up a certain “area of research” to study different situations where it is possible to predict the consequences of the entrance of the Euroregional institutions partners to the European Union and, thus, to introduce changes to the tactics and strategy of European integration.
References
Baranyi, Béla–Balcsók, István–Dancs, László 2002: Lehetıségek és esélyek a “keleti végeken”. Pécs, MTA Regionális Kutatások Központja. pp. 110–140. (Kézirat).
Euroregion 1993–1998 Five Years of Dialogue and Co-operation, 1998. – P. 90. Strategic Development Programme for the Carpathian Euroregion Interregional Association.
Nyíregyháza, 2004. Nosareva L. The economic forum in Lviv: From the alliance of countries to the alliance of regions //
Dzerkalo tyzhnya. – 2002. – № 39 (414). – 12_18 October. Süli-Zakar, István 2004: Strategic Development Programme for the Carpathian Euroregion
Interregional Association. Nyíregyháza, p. 8. Süli-Zakar, István. The Carpathian Euroregion in the Europe of Regions // Carpathian The Carpathian Euroregion Project: Institute for East-West Studies. – Atlanta–Bardejov–Debrecen–
Krosno–Lviv–Uzhgorod, 1994. – 9 p. Zilahy J. Carpathian Euroregion // Carpathian Euroregion 1993–1998 Five Years of Dialogue and Co-
operation, 1998. – p. 21.

UKRAINIAN MINORITY IN CENTRAL AND EASTERN EUROPEAN COUNTRIES: ETHNIC, NATIONAL
OR EUROPEAN IDENTITY?
ANZHELIKA KLAYZNER
Since new EU member states, particularly Central and Eastern Europe (CEE) countries – Ukraine’s neighbours – reach a new stage of their development the European communities’ unification naturally changes their inner structures. These changes are characterized by intensification of civil society formation process and development of democratic basis which are typical for highly developed European states.
Thus, for the future European society and particularly for Central and Eastern European countries – neighbors of Ukraine, the solving of theoretical and practical problems concerning ethnic minorities is of particular importance, especially for minimizing the threats and risks existing in this sphere. According to European standards, minorities’ rights require constant elaboration of political decisions and practical instruments, taking into account multicultural aspects of the present day situation and assisting minorities’ self-definition. The most important component of these processes has been waves of migration and the growth of local, regional, ethnic, religious movements.
As far as Ukrainian minorities in the CEE countries are concerned the formation of Ukraine as an independent state and its international cooperation in ethnic prob-lems solving gives the possibility to foreign Ukrainians fully realize their minority rights. However, the process of foreign Ukrainians assimilation increasingly devel-ops.
The assimilation of Ukrainian population in the CEE countries is caused by ex-ternal (dispersal residing, international marriages, segmentation of minority, nega-tive historical stereotypes, economical, educational, mass-media problems, etc.) and internal factors. The latter includes low level of both ethnic self-awareness and group consolidation: needless to say, the formation, stability and change of identity should be regarded as a result of person’s decision. As the tights with the core of Ukrainian ethnos are week the inner motivation for keeping the Ukrainian minority as a single ethnic society weakens. The factors of surroundings, citizenship and orientation on the residence state become dominative. As a result, the minority self-identification is foisted by political and social surroundings.

ANZHELIKA KLAYZNER 138
The results of the recent population censuses in the countries concerned are ex-amples of national identification of Ukrainian minority. The analysis of these cen-suses, as compared to churches and non-governmental organizations statistical data, shows significant disparity of Ukrainian population amount.
Beneath the examples of some population censuses as well as churches and other statistical and/or non-governmental organizations data are given:
1 In the beginning of the 90s the Ukrainians in Poland have been concerned to number 300–350 thousands: in 1993 Parliament Research Administration of Republic of Poland stated that there were 250–350 thousands of Ukrainians in the state.1 In 1997 the Group on Minorities Rights counted even 350–500 thousands of Ukrainians.2 At the same time, according to the estimates of the Orthodox and Greek-Catholic churches, the Ukrainian parishioners amount to average several hundreds of thousands.3 However the national population census gave the number of 27,172 thousands of ethnic Ukrainians and 5,6 thousands of Lemkos (ethnographic group of Ukrainians).4
2 Since the government of the Slovak Republic recognized the Rusyns as a separate nationality the assimilation of Ukrainian population in this country increased while the number of Rusyns rose: According to the Slovak Repub-lic national population census data in 1991 Rusyns numbered 17197 persons, Ukrainians – 13281, while in 2001 року в Словаччині Rusyns numbered 24201 persons, Ukrainians – 10814.5
3 According to the Hungarian population census in 1990, 674 Ukrainians and Rusyns have lived in Hungary.6 However the Association of Ukrainian Cul-ture to Hungary states Ukrainians in this country to number from 3000 to 6000 persons.7 The last national population census data contains 5070 Ukrainians and 1090 Rusyns in the Hungarian Republic.8
1S. Lodzinski. Poland’s Policy towards National Minorities 1989–1993. – Warsaw, 1994. 2World Directory of Minorities/ By Minority Rights Group. London. 3М.Стріха. Польща: українське “вікно в Європу” чи європейський мур перед Азією? // Критика-Коментарі, 7 листопада 2002 р.// http://www.krytyka.kiev.ua/
4Ethnic ahd National Minorities in Poland http://www.mswia.gov.pl/eng_mn_narod_1_list.html. 5Population and Housing Census 2001. Statistical Office of the Slovak Republic http://www.statistics.sk/webdata/english/struk_a/census.htm.
6Контакти між людьми та питання етнічних меншин у відносинах між Україною та Угорщиною. / Розширення Європейського Союзу: вплив на відносини України з центрально-європейськими сусідами / Інститут регіональних та євро інтеграційних досліджень “ЄвроРегіо Україна”. – К., 2004.
7Хортяні Я. Із своєї дороги не зійдемо! // http://www.ukrajinci.hu/kisebbseg_tabl.htm. 8Hungary National and Ethnic Groups http://www.magyarorszag.hu/angol/orszaginfo/orszag/ etnikum/nemzetisegek_a.html.

UKRAINIAN MINORITY IN CENTRAL AND EASTERN EUROPEAN COUNTRIES… 139
4 The Ukrainian minority in Romania, in accordance with the last population census in 1992, numbers more than 67 thousands of persons.9 At the same time the Union of Ukrainians in Romania consider that the real number is approximately 250 thousands.10
There are many reasons of such a disparity like way of population census pro-viding, segmentation of Ukrainian minority, although the main reason consists in the following: there is a tendency of concealment the real ethnicity and the unwill-ingness of Ukrainians to confess in common with the state being far from European model. While the possibility to identify themselves as the citizens of democratic European state and full members of high developed Europe seems to be a great temptation.
From this relational perspective, citizens of CEE states – EU members who at the same time are the ethnic minority representatives (in this case – Ukrainian one) cannot identify themselves with separate local, national or regional identity any longer. There occurs the whole system of several levels of identities:
− Level of ethnic-cultural identity, − Level of local identity, − Level of national identity, − Level of regional identity,
Each national identity abides in continued interaction with other national groups and united European Union in general. Thus, the intertwining of European and national components in collective identities occurs. Moreover, identity no longer defined exclusively in reference to the nation or region but exhibit a variety of co-existing local-regional, ethnic-cultural and supranational communities alongside the national one.
Thus, we become the witnesses of the process of European identity formation. This identity comprises all levels of identities and, in essence, it becomes suprana-tional. As far as foreign Ukrainians are concerned, this process, like anywhere in Europe, is irreversible. However it can be slowed down in the presence of at least two components – “mother” state’s vigorous economical basis and the willingness of minority itself to preserve its national and cultural originality.
Membership in the European Union heralds a very difficult dilemma for Ukrainians in the CEE countries. This has to do with the consequences of those countries’ membership for their border regime with Ukraine. Since CEE states
9Ethnic Minority Briefs www.divers.ro.
10Контакти між людьми та питання етнічних меншин у відносинах між Україною та Румунією. / Розширення Європейського Союзу: вплив на відносини України з центрально-європейськими сусідами / Інститут регіональних та євро інтеграційних досліджень “ЄвроРегіо Україна”. – К., 2004.

ANZHELIKA KLAYZNER 140
joined the EU, they joined its border regime. The Ukrainian diaspora in the coun-tries mentioned has been separated from Ukraine by the eastern border of the European Union and visa regime. In this sense, the diaspora status of Ukrainians in CEE states became even sharper.
Membership in the EU will thus place Ukrainian minority in a very special po-sition. On the one hand, Ukrainians who are citizens of the CEE states will have access to the right to travel and work freely within the EU, and the opportunity to resolve complicated questions of personal identity within the attractive framework of European integration. On the other hand, the very availability of these solutions further separates Ukrainians in the CEE – members of the EU from Ukrainians in Ukraine. The question will then become whether or not the Ukrainian diaspora can encourage their states to prevent the separation of Ukraine from the main current of European political life. Whether Ukrainians on the other side of Ukraine see Europe as a means to escape Ukrainian questions, or as a way to repose them, is thus the question for the future.

LOCAL COURSES

ANZHELIKA KLAYZNER 142

TRADITIONAL INDUSTRIAL AREAS OF LARGE CITIES IN THE POST-SOCIALIST ERA
– THE CASE OF BUDAPEST AND WARSAW
ÉVA EDIT KISS
Introduction
In the development of post-socialist cities 1989 was a radical turning point as rele-vant reforms have begun in all fields of life. Enormous changes have taken place in economy, especially in industry, which have had a great impact on the extent of industrial areas and their (re)utilization. The main purposes of this study are to demonstrate the spatial consequences of the changes taken place in the industry of the Hungarian capital city, Budapest and – where it is possible – to compare them with those experienced in the Polish capital, Warsaw. The main issue is what kind of similarities and differences can be observed in the traditional industrial areas of the two post-socialist cities. The study is primarily based upon the results of the surveys carried out in the industrial areas of Budapest in the past decade. (This research was supported by OTKA, project number: T046014.) However, those experiences and impressions gained on a short study-tour in Warsaw in 2006 have been also used up. As the Polish experiences are based upon only observation, this is why parantheses are used in the title of the paper.
The transformation of industrial areas of post-socialist cities began much later than in developed western cities, and accelerated after 1989, when radical political turnabout opened the way for economic and social reforms. Since then, numerous studies have been published on Eastern European economic restructuring, on how the socialist industry and industrial areas of cities have been transformed, and on the kind of challenges cities have had to face (Gritsai, 1997a; Kiss, 1993; Korcelli, 1995; Korec, 1997; Misztal, 1997). Compared with developed western cities, those in the East face a much more difficult situation, because they had to cope simulta-neously with the increasing pressure of globalisation, and with structural changes in all spheres of life. The other relevant difference between Eastern and Western cities is that the former need to restructure industry as a whole and each individual firm simultaneously. In the west only a small proportion of enterprises or of a par-ticular sector need renewing at any given time (Hillman, 1992). For these reasons, the transformation in this part of Europe has claimed much higher economic and social costs, and takes longer, particularly in certain parts of the region.

ÉVA EDIT KISS 144
The changes were the most advanced in the capital cities, which are the most innovative areas of the countries and display the most immediate responses to challenges (Gritsai, 1997b; Sleszynski, 2005). These were the major reasons for having chosen Budapest and Warsaw, which are very dynamically developing cit-ies of East Central Europe. Budapest and Warsaw are not only the political, social, cultural, financial and transport centres, but they are also very important industrial centres of the country. Although last decades have witnessed a decline in the sig-nificance of their industry for the economic life of the city (Table 1).
The study consists of three short parts. First, I demonstrate, very briefly, the major phases of the development of industry in each city. Then, I summarise the most important changes in the extent and function of industrial areas of the two cities. Finally, before conclusions, major types of redevelopment of old industrial areas are introduced.
Table 1 Some basic indicators of Budapest and Warsaw, 2005
Denomination Budapest Warsaw
Number of population 1,698,106 1697,596 Number of all enterprises 354,052 300,784 Share of industrial enterprises of all enterprises (%) 4.9 9.3 Number of economic organisations in industry 17,537 27,938
of which in mining and quarring 107 93 in manufacturing 17,227 27,696 in electricity, gas and water supply 203 149
Number of industrial employees 116,768 162,100 of which in manufacturing 107,377 134,300 of which in machinery industry 38,019 11,700 in chemical industry 18,345 … in manufacture of other non-metallic products 2,545 5,700 in manufacture of wood and paper products, printing and reproduction of recorded media
6,728 25,600*
in manufacture of food products and bevarages 14,229 34,800 in manufacture of textiles, leather products 17,009 4,000 in manufacturing n. e.c. 3,544 …
Share of industrial employees of all employees (%) 15.2 18.8 Number of unemployed 37,700 57,955 Unemployment rate (%) 4.7 5.6 Number of all enterprises with foreign interest 14,147 14,306
of which in industry 965 …
… no data. *Without the number of employees in manufacture of wood and paper products. Source: Statistical Yearbook of Budapest, 2005., Statistical Review Warsaw, 2006.

TRADITIONAL INDUSTRIAL AREAS OF LARGE CITIES IN THE POST-SOCIALIST… 145
Development of industrial areas before 1989
The formation of industrial areas of Budapest began more than 140 years ago, when the industrialisation started. The location of industry was influenced by sev-eral factors, such as natural endowments, prices of land, location of residential areas, transport possibilities, the spatial pattern of public utilities and different town-planning measures (Bernát–Viszkei, 1972). Location and spatial distribution of each branch also began to develop at that time.
By the beginning of the twentieth century, Budapest had become a modern city with large and significant industrial areas, which formed a crescent around the city centre. Most of them are found on the left side of the city (as Budapest is divided into two parts, Buda and Pest, by the river Danube). Later this location considera-bly determined the urban structure, the land use and the urban landscape of the city.
Neither between World Wars, not after World War II. did any significant change not take place in this pattern of industrial areas, because new industrial areas did not emerge between the World Wars, only existing ones developed fur-ther, and because most companies were rebuilt on the former sites after 1945 (Preisich, 1969).
The industrialisation and the development of industrial areas of Warsaw also started at the end of the XIX. century. Before World War I. industry was concen-trated in the city centre, mostly in the western bank of the River Vistula (as War-saw is also divided into two parts by a river), where the structure of industry was more multicoloured. At the same time on the eastern bank of the river, mostly ma-chinery industry dominated. In 1938 more than 224,000 people worked for the industry of Warsaw (Misztal, 1997). Between 1938 and 1945 about 85% of the industry of Warsaw was destroyed except for the industry located on the eastern bank of the river. Thus, after 1945 almost the whole industry had to be redevel-oped.
During the socialist era the industry of both cities developed very fast. Lots of new firms were established, the number of employees increased and the industrial areas continued to expand. The soviet influence on the industrialisation and struc-ture of industry was particularly strong in case of Warsaw, which had to follow the model of Russian capital, Moscow (Misztal, 1997). Its branch structure was pri-marily characterised by branches producing means of production. In the Polish capital mainly machinery industry, metallurgy, construction developed the fastest, while in Budapest machinery, chemical, food and textile industries. In the former one the number of industrial employees increased from 44,000 in 1946 up to 304,000 in 1975 and in the latter one from 348,886 to 544,971.
Due to the fast industrialisation the extent of industrial areas also increased. In 1960 they accounted for 3600ha (6.8%) of Budapest’s area, and in 1986 for 4538ha (8.6%). In contrast, in Warsaw the industry occupied 2300ha (4,5%) in

ÉVA EDIT KISS 146
1985, which was ten times larger than in 1938, when the number of industrial em-ployees was about 50% lower (Misztal, 1997).
The industrial areas of Budapest formed three main districts: the Northern dis-trict, the Eastern-southeastern district and the Southern district (Bernát–Viszkei, 1972). As more and more firms were established in these areas during the socialist era, they became increasingly crowded and polluted, and there was no more space for any further expansion. For these reasons, their situation within the city became the source of a lot of tension during the socialist period, which partly persists even today (Figure 1).
Warsaw had to face similar problems, because of the irrational, extensive utili-zation of industrial areas. In Warsaw about 80% of all industrial areas were con-centrated in the ten large industrial zones. Most of them are located in the western bank of the River Vistula. In a certain sense they are scattered around the city cen-tre, and this spatial pattern and associated large non-utilised areas have proved major obstacles to the forming a rational urban structure (Misztal, 1997; Pot-rykowska, 1995) (Figure 2).
Figure 1 Industrial districts of Budapest in the beginning of 1990s
Source: Based on the source edited by the author (Szakági tanulmányok 1992).

TRADITIONAL INDUSTRIAL AREAS OF LARGE CITIES IN THE POST-SOCIALIST… 147
Figure 2 Main industrial zones of Warsaw in the second half of 1990s
Source: Misztal S. 1997.
Major trends in industrial areas after 1989
After the change in the political system in 1989 radial changes (organisational, structural renewal) began in the industry of both cities. Besides this, some other factors (e.g. privatisation, foreign direct investment, lack of space, increasing envi-ronment protection, impacts of globalisation, acceleration of tertiarisation) have also contributed, to a different degree, to the changes in traditional industrial areas, which have progressed differentially in time and space. In a certain sense they are the natural consequences of the evolution of industrial firms and areas (Chapman–Walker, 1988).

ÉVA EDIT KISS 148
The pace and the measure of change are quite different in each quarters of Bu-dapest and Warsaw since industrial areas and industrial firms are in different phases of transformation or development. This can be traced back to numerous factors e.g. size and location of industrial areas or establishments, the branch structure and the size of the firms which are in the same industrial district. In part, these are also those elements that influence the fate of each firm and area in a cer-tain region. There will be such areas in the future too, which will remain almost without change and there will be such areas too, where the industry will renew, but such ones will also occur where the industry will disappear and other functions replace them, even more new industrial regions can come into being.
In case of Budapest, during the almost last two decades, basically, two parallel, but opposite processes can be observed in the industrial areas. One of them is the vanishing and functional transformation of industrial areas while the other one refers to their entire or partial renewal. The former is rather typical of the northern, northeastern parts of the city, whereas the south, southeastern parts are character-ised by the latter one. However, it is also doubtless that these trends can occur in the neighbouring industrial areas or within one industrial area. Changes of last years show as if this ‘north-south division’ followed by a ‘radial’ functional trans-formation depends on the distance from the city centre. This means, in fact, that functional change is more frequent in the industrial areas which are closer to the centre and have favourable location from other points of view, whereas the indus-trial renewal is much more typical of industrial areas with more ‘peripheral’ and distant location. Deindustrialization, rehabilitation of industry and/or reindustriali-zation takes place simultaneously, but these processes manifest themselves differ-ently by industrial districts (Kiss, 2002) (Figure 3).
The functional transformation has begun the earliest in the northern and north-eastern industrial areas of the city, and here it proceeds at a lively pace. Walking along the main road of the northern district, where both sides of the street once used to be flanked by different factories and workshops, today’s visitor is faced by a completely different picture. Only a few old industrial plants are operating mostly on the right side of the road. On the left side, closer to the Danube, the changes are more striking. The industrial function is being replaced and today is dominated mostly by tertiary functions (e.g. commercial, repairing, service and storing func-tions). Deindustrialization is most advanced here, which is also manifested in the highest number of closed-down firms between 1990 and 1995. A considerable vol-ume of investment in the non-producing sector in this region also confirmed this process (Kiss, 1993).
The rapid functional change in this part of Budapest and the relatively fast dein-dustrialization are also due to the fact that the inner city is getting crowded in-creasingly and is expanding mainly absorbing areas to be found not so far from the city centre and within an easy reach by transport. These industrial areas are very

TRADITIONAL INDUSTRIAL AREAS OF LARGE CITIES IN THE POST-SOCIALIST… 149
suitable to expand to, so the City penetrates into the former industrial districts along “feelers”, i.e. along the more important main roads while also transforming its surroundings to a more or less extent. Due to this process and to the reinforce-ment of City-functions, centre of Budapest is going to be similar to those of west-ern cities (Kluczka, 1996). It was a general experience in Warsaw too, that func-tional change and the decrease of industrial areas have progressed faster in those industrial areas, which were located relatively close to the city centre.
The change in function and expansion of the central business district can also be observed in the southern, southeastern parts of Budapest, primarily along the River Danube. Here the transformation, however, is progressing much slower than in the north.
Figure 3 Industrial areas of Budapest in 2006
Source: Own elaboration.

ÉVA EDIT KISS 150
Basically, the main trend in this region is the rehabilitation of industry and old industrial areas. As a consequence the industry must be reckoned with in the long run. This fact is confirmed by the lower rate of closures of industrial firms between 1990–1995, and on the other industrial investments of greater size than in other parts of the city (Kiss, 1993). Statistical data for the years of the past two decades show that about 60–65% of the sum invested have been spent on purchasing ma-chinery and equipment in the industry of Budapest, primarily imported from devel-oped countries to raise the technical level, and in a wider sense, to reduce the lag.
During the past decade, owing basically, to the former processes the quality of the built environment in the traditional industrial areas has also changed for the better. Rapid and spectacular changes can be observed mostly in those firms where the owners (investors) were partly or fully foreign. In spite of the fact, that some new industrial buildings and halls were established in these old industrial areas, they, in fact have not affected the spatial structure of the industry, because this renewal process is primarily affected the existing traditional industrial areas. Be-cause of the high prices of building sites and lack of space, not the capital is the primary target of ‘greenfield industrial investments’. Taken as a whole, in this re-gion there have been changes overwhelmingly ‘within factory gates’, within the area of industrial firms which cannot be seen well by the public, and which do not have any relevant effect on the spatial structure of industry. This is why they can-not contribute significantly to the transformation of the urban structure either.
Due to the changes mentioned above the extent of industrial areas in Budapest has decreased very considerably during the past two decades, especially in the sec-ond half of the 1990s. According to the survey carried out in 1998, the decrease was particularly spectacular between 1995 and 1998. Since then the decrease of old industrial areas have been continued. The latest survey carried out in 2006 has also proved this. Industrial areas of Budapest have further shrivelled, and nowa-days they occupy only a few per cents of the area of the city. Deindustrialisation and functional transformation are closely connected, and they are the most ad-vanced in the northern part of the city.
In the Polish capital similar trends can be observed as in Budapest. The former industrial areas have been shrivelled and split up. The most often commercial and service functions appear on their place. Functional change has also taken place faster in the industrial areas located close to the city centre. In Warsaw, owing to the changes taken place in its industry, the extent of its industrial areas has also decreased in the last two decades, but the decrease was not so spectacular as in Budapest. Within Warsaw the decrease of the extent of traditional industrial areas was especially fast in the western part of the city. It seems that industry will mainly remain in the eastern part of Warsaw and in the periphery of the western part, where the Ursus factory and the Steel factory (in Mlociny) are located. The reutili-zation of old and big industrial areas makes more difficult that very often they are

TRADITIONAL INDUSTRIAL AREAS OF LARGE CITIES IN THE POST-SOCIALIST… 151
polluted. And to clean them is very costly, as a consequence it is very hard to find such investors who are willing to do that. In fact, the transformation of the indus-trial areas is a spontaneous process in Warsaw (Figure 4).
Figure 4 Industrial areas of Warsaw in 2004
Source: Sleszynski P. 2005
(Re)utilization of industrial areas
Derelict and/or redundant industrial areas and buildings have or are (re)utilized in quite different ways in both cities, which, however, show lots of similarities. The way of reutilization depends on the intricate relationship of different factors (size and location of the given industrial area, the number of firms accommodated and their sectoral structure, circle of owners and the volume of changes in the utiliza-

ÉVA EDIT KISS 152
tion of buildings and/or areas within each firm). Basically, there are two main types of reutilization or redevelopment:
1.original industrial functions remains partly or wholly, where change do not or hardly take place, at least in their outlook. The case of “Élgép” is the best example for this type. During the socialist era ”Élgép” was a big state company, but after 1989 in order to survive the organisational and structural changes, it has let out or sold its redundant buildings and areas, which were occupied by new, mostly smaller enterprises. It is also worth mentioning that these kind of ‘living together’ are not free from tension and problems, because of different (e.g. unregulated own-ership) reasons (Figure 5).
Figure 5
At the main entrance of „Élgép” located in the southern industrial district of Budapest some name-plates indicate the „new lodgers”
Source: Own elaboration.
2.original industrial function disappears partly or wholly, and new mostly non-industrial (commercial, administrative, office, residential etc.) activities appear. As there is no possibility to introduce all the possible ways of (re)utilization of tradi-tional industrial areas, therefore only two main subtypes will be mentioned:
– functional change in an old industrial building: after renovation, reconstruc-tion or repainting old industrial buildings are reutilized for non-industrial pur-poses, mostly for commercial and service functions. In Budapest the building of a former screw-factory located in the northern district has been reutilized in such a

TRADITIONAL INDUSTRIAL AREAS OF LARGE CITIES IN THE POST-SOCIALIST… 153
way. At the same time in Warsaw mostly office functions have appeared in old industrial buildings located relatively close to the city centre. Lots of financial es-tablishments have occupied the renewed industrial buildings e.g. in Wola, along the street ‘Kasprzaka’ (Figure 6).
Figure 6 A special way of reutilization
(the original structure of old industrial buildings are kept and hey are covered by modern glass-walls)
Source: Own elaboration.
Functional change in an old industrial area: former industrial areas are reutilized for different non-industrial purposes. In the Hungarian capital old industrial areas are reutilized very often for commercial and service functions. These are brown-field investments while in Warsaw shopping malls were generally established as greenfield investments, because there were much freer areas than in Budapest. In Budapest Duna Plaza is the best example. It was established on the place of a for-mer shipyard (Figure 7).
In the 1990s mainly commercial and office functions have dominated, but later, from the turn of millennium other functions (e.g. residential, storing and logistics) have come to the front. For example: in Poland over 120 office buildings have been constructed, many of them in Warsaw, since 1989. Thus, Warsaw has become the largest market of commercial office space in Central Europe by the beginning of the 21st century (Weclawowicz, 2004). Last years, however, the reutilization for residential purposes became more and more common in both cities. In 2005 in Warsaw 2,755 dwellings have been built while in Budapest 12,303. It is also fre-

ÉVA EDIT KISS 154
quent that one homogeneous industrial area is reutilized for different purposes. Consequently, it will become an area with mixed, non-industrial functions.
Figure 7 The first shopping and entertainment center of Budapest called Duna Plaza was
opened in 1996
Source: Own elaboration.
Conclusions
After 1989 relevant changes have taken place in the extent and function of former industrial areas in post-socialist cities. The functional transformation, however, is not so fast in Warsaw as in Budapest. This can be basically explained by the fact that in Warsaw there were and still are freer and/or unbuilt areas and because of this the transformation of industrial areas was not so urgent as in case of Budapest, where the lack of space was a very important factor. In Budapest the former com-pact and homogeneous industrial belt has become more heterogeneous and not so compact as it was before 1990. The decrease of the traditional industrial areas and their functional transformation will continue in the future too, although their pace will slow down.
It is also obvious that Budapest has not followed a new unique way. The main processes in the industrial areas of Budapest have shown clear similarities to the changes of the industrial areas in west-European cities, though in the case of the

TRADITIONAL INDUSTRIAL AREAS OF LARGE CITIES IN THE POST-SOCIALIST… 155
Hungarian capital this happened much later. At the same time similarities to the other East Central European cities (e.g. to Warsaw) can be revealed as well. Thus, the cities, which are developing in different parts of Europe are becoming more and more similar to each other (Weclawowicz, 1992).
The reutilization of the traditional industrial areas completely transform their surroundings and the former industrial landscape. Furthermore the whole urban landscape, atmosphere and image of the district have been transformed. Even more the structure of the local society has also changed.
References
Bernát, T.–Viszkei, M. (eds.) 1972: Budapest társadalmának és gazdaságának 100 éve [100 years of social and economic development of Budapest]) Budapest, Közgazdasági és Jogi Könyvkiadó. 278 p.
Chapman, K.–Walker, D. 1988: Industrial location. Principles and policies. Oxford, Basil Blackwell Ltd. 305 p.
Gritsai, O. 1997a: The economic restructuring of Moscow in the international context. GeoJournal. 42. 4. pp. 341–347.
Gritsai, O. 1997b: Busniess services and restructuring of urban space in Moscow. GeoJournal. 42. 4. pp. 365–376.
Hillman, A. L. 1992: Enterprise restructuring in the transition from Hungarian market socialism. In Hillman, A. L.–Milanovic, B. (eds.): The transition from socialism in Eastern Europe. Domestic restructuring and foreign trade. Washington, World Bank. pp. 179–196.
Kiss, É. 1993: A budapesti ipar szervezeti felépítése és néhány jellemzıje [Organizational pattern and some characteritics of industry in Budapest.] Földrajzi Értesítı. 42. 1–4. pp. 225–242.
Kiss, É. 2002: Restructuring in the industrial areas of Budapest in the period of transition. Urban Studies. Vol. 39. 1. pp. 69–84.
Kluczka, G. 1996: A budapesti belváros átalakuló funkciói [Transforming functions of the inner city of Budapest]. In Dövényi, Z. (ed.): Tér-Gazdaság-Társadalom. Budapest, MTA Földrajztudo-mányi Kutatóintézet. pp. 19–29.
Korec, P. 1997: New tendencies of manufacturing development in Bratislava. In Kovács, Z.– Wiebner, R. (eds.): Processe und Perspektivender Stadtenwicklung in Ostmitteleuropa. Passau, L.I.S. Verlag. pp. 145–156.
Korcelli, P. 1995. Urban restructuring in East-Central Europe: selected questions. Geographia Polonica. 66. pp. 7–12.
Misztal, S. 1997. Deindustrialization of Warsaw and redevelopment problems of derelict industrial areas. In Kovács, Z.–Wiebner, R. (eds.): Processe und Perspektivender Stadtenwicklung in Ostmitteleuropa. Passau, L.I.S. Verlag. pp. 189–205.
Preisich, G. 1969. Budapest városépítésének története. Budapest, Mőszaki Könyvkiadó. 310 p. Potrykowska, A. 1995. Restructuralization, deindustrialization and unemployment in Poland: case
study of Warsaw. Geographia Polonica, 64. pp. 19–36. Sleszynski, P. 2005. The changes of Warsaw’s functional structure after 1989. In Czapiewski, K.–
Komornicki, T. (eds.): Proceedings. Warsaw Regional Forum, IGiPZPAN. pp. 63–72. Weclawowicz, G. 1992: A városok térbeni-társadalmi szerkezete Kelet-Közép-Európában. Tér és
Társadalom. Vol. 6. 3–4. pp. 215–225. Weclawowicz, G. 2004: Poland. In Van Kempen, R. –Vermeulen, M.–Baan, A. eds. Urban issues
and urban polices in the new EU countries. Ashgate Publishers, Rotterdam. pp. 61–77.

CITY AFTER TRANSFORMATION IN POLAND
KAROLINA RUMI ŃSKA
Introduction
The special issue is the de-industrialisation process, which is related to the political change, economic decline. After 1989 majority of the big state-owned companies were liquidated. Poland’s industries have been undergoing massive restructuring for same years. The restructuring of traditional sectors is accompanied by neces-sary ownership changes, which makes the process more difficult. The feature of restructuring of the economy was its asymmetry with the dominance of job losses over job creation. New jobs have been created mainly in the private sector and services. Without work creation in other sectors to compensate for the job decline in industry it has negative effects such as a dramatic growth in unemployment.
The growth of social disparities is the most visible social phenomenon related to economic transformation in post-socialist countries. The economic transformation has shared unequally regions, cities and also social groups within cities. The unem-ployment is the most crucial problem in Polish cities, which the rate raised from zero in 1989 to 14,9% in 2006. This is the main factor, which causes the growth in levels of poverty and social exclusion.
Evidently the poverty area has existed all the time in urban space even under communism. However the poverty has been partly the hidden phenomenon. All people had guaranteed employment and regular pensions from the state in the communist period. Besides there were persons living in poverty. Nevertheless the group of poor has been marginal. Thus the state has been able to deal with them. Currently those who have been poor tend toward to be “the new poor”. The new poverty areas have appeared beside already existing poverty areas. The poverty involves unemployed, unskilled workers, rural population and even part of the lower level intelligentsia. Among the jobless the dominant group are the long term unemployed (Węcławowicz, 2006).
The poverty has grown among those who have been already poor. But the eco-nomic changes have also pushed many other people into poverty. There is mis-match between various definitions of poverty and these who live in very low qual-ity housing. These people are part of group so called “the new poor” as well. Their incomes have declined to the point where they cannot afford to meet daily needs but they often live in housing of adequate quality. Unlike ”the old poor”, “the new poor” do not live in easily recognizable neighbourhoods or enclaves. They can be

CITY AFTER TRANSFORMATION IN POLAND 157
found in any neighbourhood or apartment block. This issue is very common in any parts of world like for instance South America as well (Minujin, 1995).
Therefore the housing is social problem too. Intra-urban differentiation in hous-ing quality is growing during the transformation period. On the one hand it is due to lack of rehabilitation of “old” public buildings. On the other hand it is due to improvement of quality of estates, which were built after 1990. The rent has in-creased in dwellings and the state subsidies have decreased because of the rent reform. Another problem is the lack of clear legislation. Also shortage of a model of good practice for cooperation between private and public sector. Consequently many households are in arrears with rent (Węcławowicz, 2005).
Poverty as evident social problem
So-called “real existing socialism’ has contributed to an image of Poland as a country devoid of such social problems as poverty, social inequality. The aims of the Communism has included bringing social injustice to an end, removing ine-qualities in society, and promoting upward mobility among the lower classes too.
At present the poverty can be seen everywhere. It became visible phenomenon in public places. So the homeless occupying railway stations and the number of beggars increasing as well. The elderly roaming the streets trying to find anything usable in trash containers (Tarkowska, 1999).
There are many approaches to defining and identifying poverty in the literature. The author of this paper refers to recipients of social assistance because the public support establishes poverty as a social phenomenon of exclusion. Only individuals assisted by special assistance programmes are considered the poor. However iden-tification of the poor with social assistance has some strong limitations. The prob-lem of using this method is connected with the difficulty of comparisons over time due to reforms in social assistance systems. The income threshold entitling to so-cial assistance allowances has been explicitly defined in the law on social assis-tance since 1996.
Poverty was often related to family dysfunction, serious illness and old age in the communism period. Poverty has not appeared among employees, which have guaranteed subsistence, however modest and uniform. Certain social groups have appeared to be disproportionately affected soon after the emergence of open unem-ployment in Poland. They included young people, unskilled workers and residents of small towns and villages. The problem of youth unemployment is more inten-sive in Poland because the labour supply inflows are very high. Generally the young is the segment most exposed to the risk of unemployment. Women are the second group strongly affected by unemployment, in spite of their higher level of education. These people can life working in a niche in the informal sector of the

KAROLINA RUMI ŃSKA 158
economy. The poverty contributes substantially to a growth in spatial polarisation and has impact on spatial segregation (Węcławowicz, 2004).
Social problems remain related to the structural backwardness of the economy in Poland. The restructuring process of the economy has intensified in the second half of the 1990s. It has brought many difficulties in living conditions, especially for these groups most strongly hit by the changes. A large number of threats, po-tentially affecting young people, emerged on the labour market at the same time.
Polish poverty is characterised by different features. The first one is connected with the lack of jobs. Also it is the most important challenge facing economic and social policy. The second feature results from the lack of effectively operating so-cial policy towards families with children. The third trait is formed by marginalised individuals and groups. This requires plenty of work to bring them back into work and social life (Beblo–Golinowska et al. 2002).
The case of Radom
Urban population is vulnerable to market conditions. This is the main reason why, as a group, they have been hit by the process of transformation. The labour status is the crucial factor for explaining social problems in a city (Amis, 1995).
Radom is special case. Forces of communism have slowed economic growth down the city. The revolutionary labour class has concentrated in Radom. There-fore the riots have taken place there in 1970s and 1980s. Consistently the city has been punished by communist authority. Radom is located in the Mazovia Region. The city has around 230,000 inhabitants. It has been a typical industrial city. Cur-rently Radom suffering the effects of closure of state plants. The city has been the poorest city in the category of big cities (larger than 200,000 inhabitants) during the post-war period.
The high rate of unemployment is continued from the first years of transforma-tion. Thus development of the city is the particularly worrying. The official unem-ployment rate have attained 25.3% in November 2006 (11.8% in Mazovia Region and for the country as a whole 14,8%). High unemployment entails many negative social phenomena such as poverty, homelessness, crime, violence, and social ten-sions. The dominant group among the jobless are the long-term unemployed, who have lost entitlement to unemployment allowance (around 83.8% of all unem-ployed have not any allowance entitlement). Persons, which are out of work for more than 12 months, make up 71% of the unemployed. The low level of education is characteristic of the unemployed. Also the lack of qualifications makes finding work more difficult.
The pauperisation of city inhabitants causes increasing of social problems. A lot of people cannot manage basic needs and daily problems. Therefore the number of
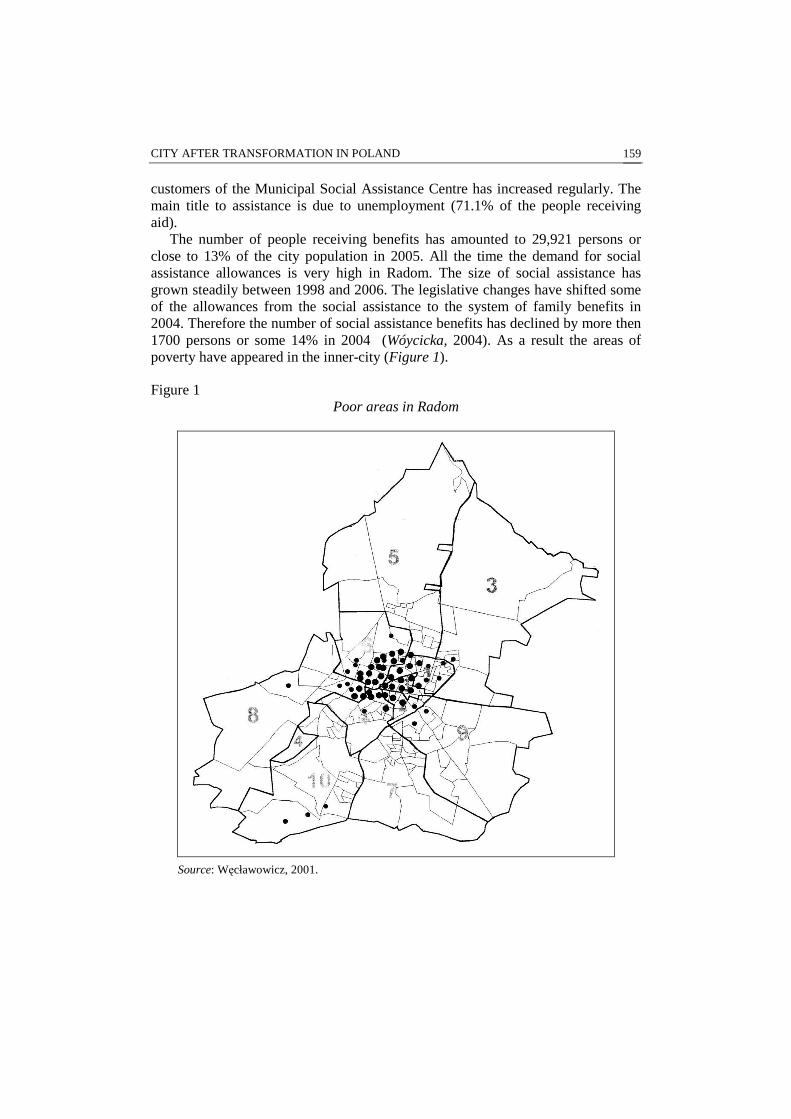
CITY AFTER TRANSFORMATION IN POLAND 159
customers of the Municipal Social Assistance Centre has increased regularly. The main title to assistance is due to unemployment (71.1% of the people receiving aid).
The number of people receiving benefits has amounted to 29,921 persons or close to 13% of the city population in 2005. All the time the demand for social assistance allowances is very high in Radom. The size of social assistance has grown steadily between 1998 and 2006. The legislative changes have shifted some of the allowances from the social assistance to the system of family benefits in 2004. Therefore the number of social assistance benefits has declined by more then 1700 persons or some 14% in 2004 (Wóycicka, 2004). As a result the areas of poverty have appeared in the inner-city (Figure 1).
Figure 1 Poor areas in Radom
Source: Węcławowicz, 2001.

KAROLINA RUMI ŃSKA 160
Conclusion
The crucial issue is increase of social problems during the market transformation. The changes on the labour market have brought the drastic growth in poverty, pri-marily because of joblessness. So the high unemployment is the result of restruc-turing processes in state-owned enterprises. The losers can be classified into “the old poor” or “the new poor”. The poverty have concerned almost all social class. Thus the unemployed, some unskilled workers, and the elderly people live in pov-erty. There are two reasons for poverty: namely, system error or personality trait. The first reason especially influences the elderly. Whereas the second one influ-ences the unemployed and underpaid employees.
Cities have become too expensive to live for many people. This situation con-tributes to a growth in social polarisation. It brings about creation of poverty areas. Currently socio-spatial structure of the city is not only the result of the last years. But it is an effect of the communism period as well. On one hand economic changes have brought out existing areas of poverty in the inner city. On the other hand the new areas of poverty are forming in the urban periphery (Węcławowicz, 2001).
References
Amis, P. 2005: Making sense of urban poverty. Environment and Urbanization, vol. 7, no. 1, pp. 145–158.
Beblo, M.–Golinowska, S.–Lauer, Ch.–Piętka, K.–Sowa, A. 2002: Poverty dynamice in Poland. Selected quantitative analyses. Center for social and Economic Research, Warsaw.
Minujin, A. 1995: Squeezed: the middleclass in Latin America. Environment and Urbanization, vol. 7, no. 2, pp. 195–206.
Tarkowska, E. 1999: Social history of poverty in Central Europe. The Polish case rural poverty on former state farms. SOCO Project Paper, no. 69, Vienna.
Węcławowicz, G. 2006: Urban issues in Poland. in: M. Degórski (ed.) Natural and human environment of Poland. Warsaw, Institute of Geography and Spatial Organization of Polish Academy of Sciences, Polish Geographical Society.
Węcławowicz, G. 2005: Poland. In R. van Kempen, M. Vermeulen, A. Baan (ed.): Urban issues and urban policies in the new EU countries, Aldershot: Ashgate, pp. 61–77.
Węcławowicz, G. 2004: Where the grass is greener in Poland. Regional and intra-urban inequalities. In R. Lee, D. M. Smith (ed.): Geographies and moralities. London, Blackwell. pp. 62–77.
Węcławowicz, G. 2001: Przestrzeń ubóstwa – nowy czy stary wymiar zróŜnicowania społeczno-przestrzennego w miastach Polski. Przegląd Geograficzny, t. 73, z. 4, pp. 451–475.
Wóycicka, I. 2004: Poland. The implementation of the National Action Plan of Social Inclusion at regional and local level. Warsaw, The Gdańsk Institute for Market Economics.

TECHNICAL INFRASTRUCTURE IN THE DWELLINGS IN POLAND AND HUNGARY AT THE BEGINNING
OF THE 21ST CENTURY
KONRAD CZAPIEWSKI
Introduction
Availability of infrastructure on definite areas conditions in a significant manner the course of economic processes and shapes the living conditions of the inhabi-tants. Thus, for instance, Ostrowski (1998, 11) maintains that technical and social infrastructure “exerts a strong influence not only on the improvement of the living conditions of the population, but also, indirectly, increases the attractiveness of the respective areas for the domestic and foreign investors”. Similarly, Heffner (2001, 119) proposes that “expansion of the local infrastructural installations leads to the decrease of costs borne by the investors locating their economic activity on the rural areas and to the improvement of living conditions, which is also conducive to new economic undertakings”. Technical infrastructure has a particularly high sig-nificance in the development of rural areas, since it is on these areas that until now large interregional differences are observed, as well as along the line town-country-side. Zgliński (2001, 85) emphasises the necessity of “catching up for the historical delays in the development of technical and social infrastructure in the countryside for creation of conditions for the economic and civilizational development of the rural areas”. Pięcek and Tryfan (1999, 7) perceive the problem in the same man-ner, as they write that “the necessary condition for the improvement of the living standard of the rural population is the development of infrastructure, understood as the system of installations and institutions forming the foundations for the func-tioning of the economy on a given area”. Even though the quotations here provided refer mainly to Polish conditions, similar processes and statements remain valid for the situation in Hungary.
The paper compares the spatial differentiation of the equipment of dwellings with the basic elements of technical infrastructure in Poland and in Hungary. The analyses were conducted on the lowest administrative level – NUTS 5 (gmina in Poland and település in Hungary). All the data used in the study originate from the

KONRAD CZAPIEWSKI 162
main statistical offices, in case of Poland for the year 2003, and in case of Hungary – for 2001.1
Equipment of the dwellings with technical infrastructure was described using five features: water supply system, flush toilet, bathroom, central heating and gas supply network.
General information on technical infrastructure in Poland and in Hungary
During the 1990s in both Poland and Hungary a significant improvement took place in the equipment of dwellings with basic elements of technical infrastructure. This change is particularly perceptible on the rural areas, which during more than 40 years of the socialist system were specially neglected with this respect (Czapiewski, 2004; Kovács, 2001). One of the basic reasons of the transformations having taken place is certainly the increase of the decision-related independence of the authorities of the lowest administrative units (Gorzelak–Jałowiecki, 1998; Pálné Kovács, 2001; Swianiewicz, 2004).
The shares of the dwellings having access to water supply, and the water closet, are in Poland and in Hungary similar, around 93% and 86%, respectively. Bigger differences can be observed for the three other elements accounted for in the analy-sis (Table 1). In Hungary, a bigger share of dwellings is equipped with gas supply and a bathroom. On the other hand, in Poland ¾ of dwellings have central heating, while in Hungary – only half of them.
All the five infrastructure elements accounted for in the analysis display high degree of correlation among themselves. Both in Poland and in Hungary the linear correlation coefficients between four of the respective variables (excluding gas supply) take values, r from the interval 0.7–0.9, while the correlation coefficients of access to gas supply network with the other four variables belong to the interval 0.4–0.5.
Table 1
Percentage shares of dwellings equipped with the basic elements of infrastructure
Water supply Flush toilet Bathroom Central heating Gas supply
Poland 95.0 87.3 86.1 77.1 55.4 Hungary 90.6 84.9 95.4 52.9 68.3
Source: Central Statistical Office of Poland and Hungarian Central Statistical Office.
1The author would like to thank Bálint Koós for the Hungarian data.

TECHNICAL INFRASTRUCTURE IN THE DWELLINGS IN POLAND… 163
Spatial differentiation of the availability of infr astructure in Poland and Hungary2
Water supply
In the western part of Poland one notices an almost complete saturation with access to water supply networks, which is largely due to the historical past of these areas (Fig. 1). Before the World War II this area belonged to Germany, and then, in the socialist period the state ownership dominated in agriculture. Both these elements were decisive for the more common access to water supply networks on these ar-eas. Besides, this indicator attains higher values in the intensively urbanised areas of Upper Silesia and the capital city of Warsaw, together with its suburban zone. In case of Hungary the highest level of equipment of the dwellings with tap water is noted in the north-western part of the country – starting with the border region with Austria (Western Transdanubia), through the surroundings of the Lake Balaton (Central Transdanubia), and ending with Budapest and its suburban zone (Central Hungary). The presence of infrastructure is much worse in the poorer regions of the country – first of all in its south-eastern part. These areas feature high degree of rurality (Csatári, 2005) and high significance of farming in local economy and in the employment structure.
Flush toilets
The spatial differentiation of the shares of dwellings equipped with flush toilet is a natural consequence of the spatial differentiation of the share of dwellings con-nected to the water supply networks. According to Kovács (2004) the coefficient of the presence of the flush toilet in the dwellings is a good measure for showing the increase of regional disparities in the settlement system and describes well, in qualitative terms, the state of housing. Very high value of this indicator in the north-eastern part of Hungary illustrates the highly intensive process of modernisa-tion of the dwelling stock in these regions, while low values of the indicator in other regions of the country demonstrates large delays in this respect (Kovács, 2004). In the case of Poland modernisation of dwellings took place to a large extent on the eastern territories of the country, with, however, low rate of sewage system access remaining a significant problem there. The municipal self-governmental authorities invested during the 1990s first of all into the improvement of water supply network, but currently, an increase in investment into sewage systems is
2When comparing the spatial differentiation of the availability of basic elements of technical infrastructure in the dwellings in Poland and Hungary, the same scale of differentiation was applied in constructing the choropleth map. The scale of the map itself for Hungary is 1.5 times bigger than for Poland.
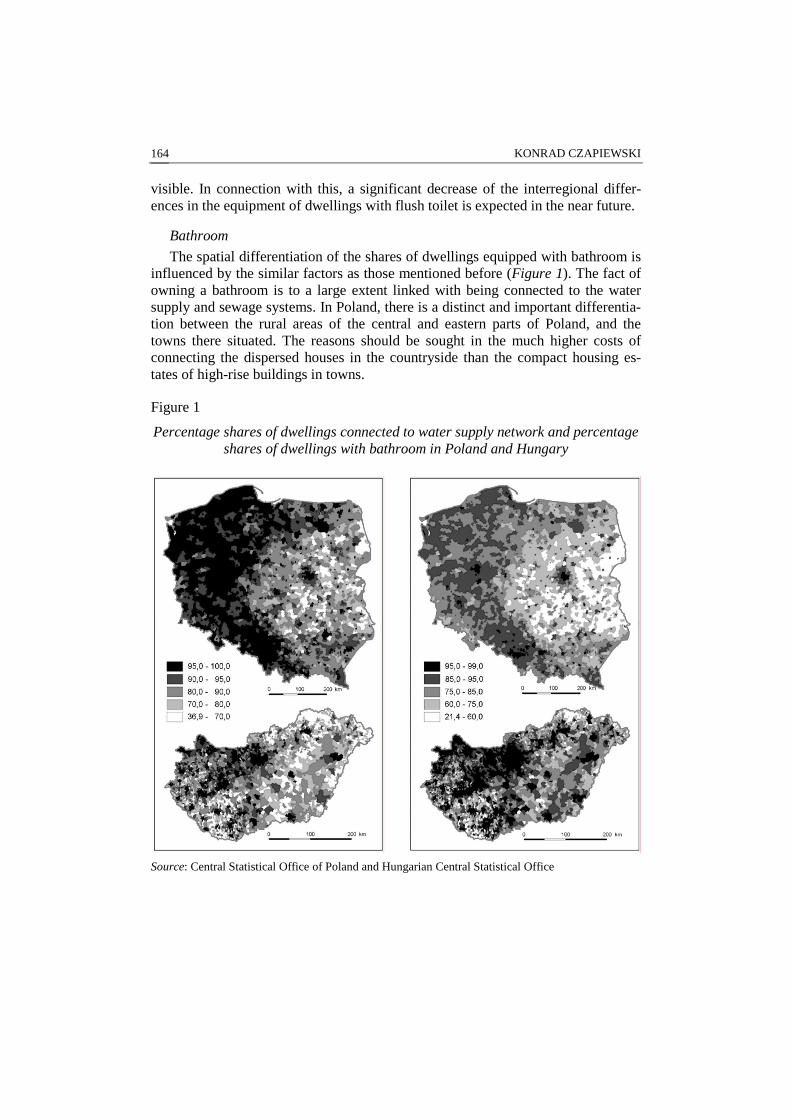
KONRAD CZAPIEWSKI 164
visible. In connection with this, a significant decrease of the interregional differ-ences in the equipment of dwellings with flush toilet is expected in the near future.
Bathroom
The spatial differentiation of the shares of dwellings equipped with bathroom is influenced by the similar factors as those mentioned before (Figure 1). The fact of owning a bathroom is to a large extent linked with being connected to the water supply and sewage systems. In Poland, there is a distinct and important differentia-tion between the rural areas of the central and eastern parts of Poland, and the towns there situated. The reasons should be sought in the much higher costs of connecting the dispersed houses in the countryside than the compact housing es-tates of high-rise buildings in towns.
Figure 1
Percentage shares of dwellings connected to water supply network and percentage shares of dwellings with bathroom in Poland and Hungary
Source: Central Statistical Office of Poland and Hungarian Central Statistical Office

TECHNICAL INFRASTRUCTURE IN THE DWELLINGS IN POLAND… 165
Thus, unit costs borne in the case of projects in the countryside are much higher than in towns and pay back in a much longer time period. In Hungary, a particu-larly high share of dwellings with a bathroom is observed within the metropolitan area of Budapest and in the area of very intensive tourist penetration around the Lake Balaton. On the other hand, in Ormánság – one of the poorest regions of Hungary, located to the South of Pécs – very low values of the indicator in question are noted.
Central heating
Dwellings in Poland are much more frequently connected to central heating systems than this is the case with Hungary (Figure 2). This results from several characteristics of the settlement network and the structure of housing in the two countries. The settlement network in Hungary is much sparser than in Poland and a very characteristic element of the Hungarian landscape is constituted by the single isolated farms (tonyo). In an obvious manner, this makes impossible connecting such buildings to the central heating network and causes that the farm owners con-struct, instead, individual heating systems. On the other hand, in Poland, due to collectivisation of farming, in the western and northern parts of the country the settlements of the State Farms appeared in the form of clusters of several two-and three-storey housing blocks heated by their own boiler houses. The domination of the private farming in eastern Poland was expressed by the much lower values of the indicator in question over these areas. Towns in both countries are character-ised by the decidedly highest values of percentage shares of dwellings connected to the central heating networks.
Gas supply
Spatial differentiation of the percentage shares of dwellings equipped with gas supply installations shows the biggest distinction with respect to the remaining four, previously described, elements of technical infrastructure. Despite the fact that the number of customers of gas networks in Poland on the rural areas increased during the 1990s by almost the factor of two and a half, it still remains a very low level. Currently, only 5% of inhabitants of rural areas in Poland use gas supplied from the networks. Their highest percentage share is observed in south-eastern Poland (the region of Małopolska), and is associated with the important deposits of natural gas situated at the foothills of the Carpathians3 (Figure 2). Besides, it is common that apartments in towns are connected to the gas supply networks, this fact being largely due to the previously mentioned issue of installation costs. In the case of Hungary one notices that the general level of access to the gas supply net-
3It is exactly in this area that in the middle of the 19th century Polish scholar Ignacy Łukasiewicz opened up the first oil rig in the world.

KONRAD CZAPIEWSKI 166
works is much higher than in Poland. Only in the south-western part of the country lower values of this indicator are observed. In Poland, there are 40% of the admin-istrative units considered, in which there is no access to gas supply networks, while in Hungary this concerns only 20% of municipalities.
Figure 2 Percentage shares of dwellings with central heating and percentage shares
of dwellings connected to gas supply network in Poland and Hungary
Source: Central Statistical Office of Poland and Hungarian Central Statistical Office.
Summary and conclusions
The spatial differentiation of the equipment with infrastructure in Poland and in Hungary displays a high degree of correlation with the level of economic develop-ment in these countries. In Poland, the highest level of economic development is observed in large cities and their respective agglomerations (Warsaw, Poznań, Cra-

TECHNICAL INFRASTRUCTURE IN THE DWELLINGS IN POLAND… 167
cow, Lodz, Tri-city, towns of Upper Silesia). The areas, featuring the highest de-velopment indicator values are usually surrounded by a ring of slightly less devel-oped municipalities, and farther away the areas characterised by the lowest level of economic development are situated (Bański, 2005). Towns concentrate nowadays the biggest development potential and fulfil, or rather should fulfil, the exogenous functions for the surrounding areas. Such a situation, though, does not always take place. In the case of large urban agglomerations one can indicate the suburban zones, generated by them, displaying high potential. Yet, smaller units, and first of all towns located in the eastern part of the country, are not strong enough to stimu-late growth within the neighbouring areas. The areas with well developed tourist function feature a high development potential, as well, like the seacoast belt, the lake districts, and some of the mountain areas in the South of the country (Czapiewski–Janc, 2006). In the case of Hungary the level of development in the eastern and southern parts of the country remains significantly below the national average. Except for a couple of areas, which are more urbanised, poor transport-wise accessibility, long-term unemployment and domination of farming in local economy bring about serious social and economic conflicts. The most developed areas, which, in addition, strengthened their position during the 1990s, are, in gen-eral, those in the north-western Hungary, and in particular – the suburban zone of Budapest and the surroundings of the Lake Balaton (Csatári, 2005; Nagy, 2005). The inhabitants of the north-western Hungary gain also highest incomes from their work. This situation is associated with the qualitative aspects of employment – in the North the inhabitants hold largely posts in the highly specialised companies, while in the South they find employment in farming and in trade (Kovács, 2004).
Strong interdependence between the values of the indicator of equipment of dwellings with the basic elements of technical infrastructure and the indicators determining the level of socio-economic development, is linked with the functional structure of the territories of Poland and Hungary. Eastern regions of both countries have agricultural character, which finds a reflection in the lower incomes of the inhabitants and the incapacity of making the necessary infrastructure investments in own dwellings, as well as in the lower revenues of the self-governmental bodies, which, in turn, entails the shortage of means for the expansion of the municipal infrastructural installations. Besides, the results obtained are simultaneously asso-ciated with the settlement structures of the two countries, the age structure, and the high percentage share of the Roma minority in eastern Hungary. On the other hand, the contemporary processes, which change in a significant manner the image of spatial differentiation with respect to the equipment in infrastructure at the begin-ning of the 21st century, include the programmes of the European Union. They allow for the reduction of the own contribution of the self-governmental bodies in the construction of infrastructural installations. Yet, in the nearest future, the level of socio-economic development will continue to influence in a significant degree

KONRAD CZAPIEWSKI 168
the level of equipment with infrastructural installations. This will remain particu-larly true for these elements of infrastructure, which have not been very common on the rural areas of Poland and Hungary until now, such as central heating and gas supply networks.
References
Bański, J. 2005: Sukces gospodarczy na obszarach wiejskich [Economic success in rural areas; in Polish]. In Głębocki, B.– Kaczmarek, U. (eds.): Obszary sukcesu na polskiej wsi, Studia Obszarów Wiejskich, 8, PTG, IGiPZ PAN, Warszawa, 9–20.
Csatári, B. 205: Major changes in the Hungarian micro-regions. In Floriańczyk, Z.–Czapiewski, K. (eds.): Rural Development Capacity in Carpathian Europe. Warsaw, European Rural Development Network. 79–94. p. (Rural Areas and Development, 3.).
Czapiewski, K. 2004: Zmiany warunków Ŝycia ludności wiejskiej [Changes in living conditions of the rural population; in Polish]. In Bański, J. (eds.): Polska przestrzeń wiejska: procesy i perspektywy, Studia Obszarów Wiejskich, 6, PTG, IGiPZ PAN, Warszawa, 89–111.
Czapiewski, K.–Janc, K. 2006: Development potential of Polish regions, Проблеми на Географията (Problems of Geography), 1–2, 91–104.
Gorzelak G.–Jałowiecki B. (eds.) 1998: Koniunktura gospodarcza i mobilizacja społeczna w gminach (Business conditions and social mobilisation in communes; in Polish) Studia Regionalne i Lokalne. 25(58). UW, Warszawa.
Heffner, K. 2001: Transformacja układów osadniczych wsi a wielofunkcyjny rozwój obszarów wiejskich [Transformation of the settlement patterns of the countryside and the multi-functional development of rural areas; in Polish]. In Bukraba, I.–Rylska, A. Rosner (eds.): Wieś i rolnictwo na przełomie wieków. Warszawa, IRWiR PAN. 109–132.
Kovács, T. 2001: Rural Development in Hungary. Pécs, Centre for Regional Studies. 43 p. (Discussion Papers, 34.).
Kovács, Z. 2004: Socio-economic transition and regional differentiation in Hungary. Földrajzi Értesítı [Geographical Bulletin], LIII, 1–2, 33–49.
Nagy, G. 2005: Changes in the position of Hungarian regions in the country’s economic field of gravity. In: Barta, Gy.–G. Fekete, É.–Kukorelli Szörényiné, I.–Timár, J. (eds.): Hungarian Spaces and Places: Patterns of Transition. Pécs, Centre for Regional Studies. 124–142. p.
Ostrowski, L. 1998: Społeczna i techniczna infrastruktura na terenach wiejskich oraz źródła jej finansowania w świetle ankiety IERiGś z 1996 roku (Social and technical infrastructure on rural areas and the sources of its financing in the light of the IAFE survey of 1996; in Polish) IERiGś, Warszawa.
Pálné Kovács, I. 2001: Regional Development and Governance in Hungary. Pécs, Centre for Regional Studies. 41 p. (Discussion Papers, 35.).
Pięcek, B.–Tryfan, B. 1999: Wstęp [Introduction; in Polish]. In: Pięcek, B. (ed.): Wpływ infrastruktury wiejskiej na stopę Ŝyciową mieszkańców. Warszawa, IRWiR PAN. 7–12.
Swianiewicz, P. (ed.) 2004: Local Government Borrowing: Risks and Rewards. Budapest, Open Society Institute.
Zgliński, W. 2001: Wizje, koncepcje, strategie rozwoju obszarów wiejskich i rolnictwa w Polsce (Visions, concepts, strategies of development for the rural areas and agriculture in Poland; in Polish) [in:] J. Bański (ed.) Wieś i rolnictwo u progu Unii Europejskiej, Studia Obszarów Wiejskich, 1, PTG, IGiPZ PAN, Warszawa, 85–98.
SOCIAL AND ECONOMIC CHANGES IN BLAGOEVGRAD IN CONNECTION WITH THE
INTEGRATION OF BULGARIA’S TO EU
ALEKSANDRA RAVNACHKA
This research aims to demonstrate, analyze and assess the socio-economic changes in Blagoevgrad municipality in connection with Bulgaria's integration to the EU.
The municipality of Blagoevgrad is located in Southwest Bulgaria and occupies an area of 628 km2. According to the regional scheme of the country, the munici-pality includes the town of Blagoevgrad and its adjacent 25 villages. The town of Blagoevgrad is situated of 100 km south of the capital city of Sofia and proximity by the Republic Macedonia and Greece. The geographical location of the munici-pality favours its development. The demographic factors have a considerable im-pact on the development of Blagoevgrad municipality. Until 1998 its population was growing but since then it has been slowly decreasing. During 1992–2001 the average annual population drop was by -0.05%. The main causes for this decline are a low birth rate, high death rate, migration, etc. In 2005 the inhabitants of the municipality were 77,183 (data source: GRAO) which constituted 23.2% of the district's population and 1.0% of the country's population (Table 1, Figure 1).
Most of the municipality’s population lives in the town of Blagoevgrad. The share of urban population in the municipality is 91.2% and has the rural population – 8.7%. For comparison sake the ratio urban: rural population in the whole district is 57.2%: 42.8%. In the district center (the town of Blagoevgrad) is concentrated 40.4% of the district’s urban population. Great differences can be observed in the urbanization processes in the individual settlements, which had negative results: depopulation of numerous villages, deterioration of the population age structure, etc. The rural population in Blagoevgrad municipality has been declining since the mid–1950s. The same applies to most of the villages in the Blagoevgrad district. The prognoses are that with Bulgaria's accession to the EU and with the develop-ment of the rural and ecological tourism, the population in the villages will increase (Figure 2).
Generally, the demographic processes in Blagoevgrad municipality have the following characteristics:
1 Preservation of the total number of population, increase of the urban and de-crease of the rural population;

ALEKSANDRA RAVNACHKA 170
2 Favorable reproduction potential of the population in the district town (The share of young people is high – over 22 per cent) and degraded reproduction parameters and population aging in the villages;
3 Development of population of Blagoevgrad with high labour potential, high educational and qualification level in the town of Blagoevgrad.
The integration of Bulgaria with the European structures is accompanied with difficult and continuous transition to market economy. A number of socio-eco-nomic changes have taken place all over the country and in Blagoevgrad munici-pality in particular, which have led to a considerable decrease in the number of employed persons and to the increase of unemployment. The employment in Bla-goevgrad municipality began to drop in the beginning of the 1990s and reached its climax in 1990–1995. In 2003 the employed persons are about a 40–50 per cent less than that in 1990.
Owing to the different economic development rates, to the economic reforms and to the work force changes, substantial transformations occurred in the em-ployment by economic sectors and forms of ownership. The restructuring of the ownership in the sphere of economy and the establishment of the private sector raised the share of the employed in the latter (Geography of Bulgaria…, 2002). In 2003 the private sector provided jobs for about 63.9per cent of all the employed people while the public one – for 36.1per cent (Figure 3).
Table 1
Population by municipalities in Blagoevgrad District 1985–2003
Municipalities 1985 1992 1995 1996 1997 1998 1999 2000 2001 2003
Bansco 15,442 14,600 14,071 14,032 14,010 13,769 13,574 13,472 13,988 13,394
Belitsa 9,757 10,110 9,956 10,007 9,915 9,861 9,783 9,748 9,748 9,539 Blagoevgrad 72,681 78,810 81,357 81,011 81,114 80,882 80,094 79,312 78,467 77,346
Gotse Delchev 32,110 33,074 32,796 32,963 33,144 32,894 32,716 32,745 32,784 32,136 Garmen 14,636 15,014 15,063 15,185 14,832 14,764 14,697 14,620 15,114 14,705 Kresna 7,108 6,947 6,867 6,837 6,758 6,651 6,568 6,432 6,284 5,948
Petrich 57,483 57,829 57,709 57,775 57,477 57,223 56,955 57,490 58,086 57,450 Razlog 24,211 23,508 22,999 22,888 22,821 22,608 22,331 22,218 22,197 21,652 Sandanski 45,143 45,097 44,634 44,668 44,347 43,746 43,407 43,442 43,403 42,475
Satovcha 16,851 18,350 18,309 18,392 18,385 18,366 18,277 18,265 18,032 17,576 Simitli 16,722 16,840 16,766 16,771 16,800 16,623 16,488 16,353 16,173 15,531 Strumiani 8,719 7,957 7,624 7,722 7,629 7,412 7,261 7,038 6,881 6,564
Hadjidimovo 12,219 12,147 12,053 12,064 11,956 12,044 11,966 11,870 11,037 10,551 Yakoruda 11,113 11,354 11,204 11,195 11,139 11,064 11,021 10,914 11,176 10,771
Source: GRAO, DSRD of a District with Blagoevgrad as its Administrative Center during 2005–2015.

SOCIAL AND ECONOMIC CHANGES IN BLAGOEVGRAD IN CONNECTION … 171
Figure 1
Dynamics of Population in Blagoevgrad Municipality 1985–2005
68000
70000
72000
74000
76000
78000
80000
82000
84000
1985 1992 1995 1996 1997 1998 1999 2000 2001 2003 2005
Population
Source: GRAO; OSRR.
Figure 2
Share of urban and rural population in Blagoevgrad Municipality
91,5 90,9 91,2
8,5 9,1 8,7
0
10
20
30
40
50
60
70
80
90
100
1999 2001 2005
Urban Population Rural Population
Source: GRAO;

ALEKSANDRA RAVNACHKA 172
Figure 3 The Structure of Employment by Form of Ownership
2000 2003
Source: GRAO; OSRR.
The structure of the employed is changing: the number of people, working in primary sector is going down whereas in manufacturing industries and service sector it is going up. This is also due to the development and high share of labour intensive branches in the economic sector – food industry, textile, apparel and shoe industry, etc. second comes the service sector. The trend towards an increase of the number and share of employed persons in the small and very small enterprises and towards their decrease in the big ones, which is common for the whole country, can be observed in Blagoevgrad municipality as well (Ilieva–Roukova, 2005).
The number of newly created jobs is still insufficient but in comparison with other municipalities and with the national average figure, the unemployed persons who apply for one vacancy are fewer in Blagoevgrad municipality (the unemploy-ment coefficient is 7.14% as of 31 December, 2004).
Standard of living, incomes, poverty
On the average, the level of incomes and poverty in Blagoevgrad municipality is similar to that throughout the country. The 1992–1997 periods is characterized by a steady decline of incomes, followed by a slight rise, which, however, does not af-fect considerably the purchasing power of the people. The municipality of Blago-evgrad is not amidst the poor ones. The social policy, recently carried out by the municipality, has resulted in:

SOCIAL AND ECONOMIC CHANGES IN BLAGOEVGRAD IN CONNECTION … 173
− increase of the purchasing power of the people; − slow income equalization in the state-owned and private sector; − development and operation of a new pension system; − Growing importance of the programs for employment encouragement.
Due to the economic crisis, which took place in the 1990s, and the resulting from it privatization, restructuring etc., substantial changes occurred in the produc-tion volume, forms of ownership and branch structure of industry in the municipal-ity. ‘This is the period when the production drop was most marked and when most of the plants in the sphere of machine building, metalworking and electrical indus-tries were privatized. A lot of firms were established in light industry, owing to which significant part of the output was produced by the private sector’ (M. Ilieva, Geography of Bulgaria 2002).
The manufacture of food, beverages and tobacco participates with the highest share in the industrial structure of the municipality. Very important for the devel-opment of this economic branch are the abundant raw materials and the great con-sumption closely associated with the demands of plenty of students and tourists. The small and medium-sized firms constitute 60% of the total number. Prevailing is the private ownership.
Most significant for the economy of the municipality is the manufacture of to-bacco. The largest and the most modern tobacco plant are built in Blagoevgrad, which produces 40% of the total output. The other manufactures (mainly of meat, meat products and alcoholic drinks) are concentrated in small and medium-sized enterprises. (District Strategy for Regional Development of a district with Blagoev-grad as its Administrative Center during 2005–2015).
Recently the manufacture of wearing apparel and knitwear has gained in im-portance for the economy of Blagoevgrad municipality. Various articles are pro-duced – ladies and men's ready-made clothes, shirts, overalls, woolen knitwear, cotton fabrics, etc. This branch is remarkable for the participation of foreign in-vestors in it (Greek, German, French) having established either their own firms or set up joint ventures in the municipality. Many of these firms are competitive and export-oriented (‘Stroumatex’ JSC, ‘Milena’ Crafts' Cooperative, ‘Balkantex’, etc.). The development of wearing apparel manufacture is stimulated by small in-vestments, cheap work force and low labour qualification at the very appointment of the employees. Therefore, the branch is very mobile and with uncertain perspec-tives for development within the municipality limits. Most of the Greek workshops perform assembly production activities, which are temporary and can be removed from the region. Hence, an alternative to this type of production has to be found in the future (District Strategy for Regional Development of a district with Blagoev-grad as its Administrative Center during 2005–2015).

ALEKSANDRA RAVNACHKA 174
The manufacture of castings, metal articles and machinery is concentrated in about ten firms mainly in the district town. A persistent downward trend can be observed in the manufacture of electrical machines and high-precision equipment. In the 1980s this branch made an impressive progress but in the 1990s experienced a deep crisis. This is caused basically by the reduction of markets, the lack of in-vestments, etc.
The manufacture of wood, wood products and furniture is based on the local raw materials and has good perspectives. There are about 15 wood processing en-terprises. Most of them are small and are either affiliates of foreign companies or export their production to Greece, Turkey, Germany and some other countries. Most of the enterprises have been recently established and afford opportunities for alternative employment because of the closure of the enterprises where the new entrepreneurs have worked before. The main problem this industrial branch faces is, on the one hand, the insufficient quantities of timber (the forests cover 45% of the municipality’s area) and on the other, the illegal export of timber.
The tertiary sector is the second important economic sector in the municipality. In compliance with the growing and development the economy, the business and finance services, credits and insurance become more intensive. ‘A big contribution to the development of service sector has the town of Blagoevgrad where are lo-cated all state municipal administrative bodies, higher schools, health, transport, trade and financial establishments. Predominant in this sector are trade, communi-cations, tourism and finance-and credit institutions’ (Boris Kolev, Geography of Bulgaria 2002).
Two types of transport are developed in Blagoevgrad – railway and motor ones. The transport network density of the municipality (290.3 km per 1000 km2) is higher than that of the district (267.7 km per 1000 km2) and slightly lower than the national one (333 km per 1000 km2). The municipality is cut through by the inter-national motorway E–79, (Blagoevgrad-Simitli-Koulata) which plays a significant role in the district town's development (Table 2).
The railway Sofia-Blagoevgrad-Koulata is electrified and guarantees fast and high-quality service of the passenger and freight traffic. The socio-economic changes during the transition period substantially affected the transport activities.
The present-day characteristics of the social infrastructure in the region are a consequence of a continuous development and restructuring. The trade network is in very good shape. It is concentrated in the town of Blagoevgrad where are located over 90% of the trade establishments in the municipality. Some big Bulgarian and foreign supermarket chains such as Technomarket, Metro, etc., operate here. The market infrastructure incorporates a lot of institutions, (banks, insurance compa-nies, stock markets) which directly serve the municipality's economy.
The educational infrastructure in the municipality takes shape on the basis of the current requirements and demands of society. It functions due to the relatively

SOCIAL AND ECONOMIC CHANGES IN BLAGOEVGRAD IN CONNECTION … 175
good material equipment, the availability of professionals and children. With its two universities (the Southwestern and the American) and three colleges Blagoev-grad has become an important center of higher education. The location of universi-ties and vocational schools of national and regional importance encourage the de-velopment not only of the municipality, but also of the whole district. Nevertheless, the socio-economic and demographic changes (the reform in education, the de-clining birth rate, etc.) will make an impact on the future development of educa-tion.
Table 2 Density of Road Network (1000 kv.km)
Territorial Units І class ІІ class ІІІ class Total
Bulgaria 27.1 34.5 107.1 333 Blagoevgrad District 13,50 24 63 267.7 Municipality in Blagoevgrad District Blagoevgrad 22 – 77 290.3 Bansco – 65 5 158.4 Belitsa – 34 50 417.4 Gotse Delchev – 70 53 214.5 Garmen – – 100 230.6 Kresna 32 – 12 164.7 Petrich 18 – 116 473.8 Razlog – 63 7 146.6 Sandanski 20 – 80 277.5 Satovcha – – 113 207.1 Simitli 41 39 11 211.6 Strumiani 28 – 121 424.8 Hadjidimovo – 48 112 267.9 Iakoruda – 74 – 169.6
Source: DSRD of a District with Blagoevgrad as its Administrative Center during 2005–2015.
The health network is unevenly distributed. It is most dense in the town of Bla-goevgrad. It is most dense in the town of Blagoevgrad where there are 5 hospital establishments. In comparison with 1999, the health establishments, that are func-tioning, have not decreased in number but by contrast, their beds have (by 10percent). The health service in the municipality encounters problems, which are common throughout the country and are related to the on-going health reform. The reduced medical staff influences the health insurance of the population (District Strategy for Regional Development of a district with Blagoevgrad as its Adminis-trative Center during 2005–2015).

ALEKSANDRA RAVNACHKA 176
Blagoevgrad has well-developed network of cultural institutions (a drama thea-ter, a puppet theater, Ensemble “Pirin”, a historical museum, etc.) which stimulates the tourism. The inadequate financial resources in the last 10 years adversely af-fected the development of culture in the municipality.
In Blagoevgrad municipality there are splendid opportunities for the develop-ment of different types of tourism (cultural-cognitive, mountain-recreational, con-gress tourism, eco-tourism, etc.), which can rely on the favourable natural condi-tions and on the rich cultural heritage. A mountain resort of national importance is ‘Bodrost’. The congress tourism makes a success in the town. At present, the pos-sibilities for the development of cognitive tourism are not explored to the fullest extent yet.
The technical infrastructure in Blagoevgrad municipality is in a relatively good shape. A lot of reconstructions took place in the last 5 years, owing to which it was upgraded. The problem of water supply in the municipality has been successfully solved. The water supply network is well developed but it needs from a renewing.
The municipality is cut through by the main gas pipe to Greece which follows the natural infrastructure corridor along the Strouma River. A project about Blago-evgrad gasification is being implemented now which is a great advantage for the municipality as the utilization of natural gas has undoubted economic and ecologi-cal effectiveness. (District Strategy for Regional Development of a district with Blagoevgrad as its Administrative Center during 2005–2015).
The reforms that are going on all over the country adversely affect the agrarian sector. In all settlements of Blagoevgrad municipality (except for the town of Bla-goevgrad) the areas under crops, the number of farm animals and the farm produce are decreasing. This sector is the main source of incomes in the villages and its decline encourages the development of natural economy and the out-migration of working age population because there is no alternative for employment and earn-ings. The agrarian sector is financed both by the municipal and state budget through the State Fund “Agriculture” and the “Tobacco” Fund. But the allocation of funds by the state is a difficult process as the relationships between producers and creditors are not clearly defined. Thus, these funds are not used to promote the development of agriculture (District Strategy for Regional Development of a Dis-trict with Blagoevgrad as its Administrative Center during 2005–2015).
The favorable geographical location of Blagoevgrad municipality is an impor-tant prerequisite for its progress. After Bulgaria' integration with the EU a lot of positive changes are expected in the socio-economic structure of the municipality.

SOCIAL AND ECONOMIC CHANGES IN BLAGOEVGRAD IN CONNECTION … 177
References
Ilieva M.–Roukova, P.–Ravnachka A. 2005: The Labour Market in the Planning Regions Bourdering on the European Union. In: The European Future of Bulgaria and the Population Development, Sofia, 2005.
Kolev B. 2002: The South Western Region. In: Geography of Bulgaria. Publ. House ForKom, Sofia, pp. 722–733.
Roukova P.–Ilieva, M. 2002: Economic activity of the population. In: Geography of Bulgaria. Sofia, Publ. House ForKom. pp. 479.
District Strategy for Regional Development of a District with Blagoevgrad as its Administrative Center during 2005–2015. http://www.bl.government.bg/bl/persp.html.
Statistical Yearbook 2003. National Statistical Institute, Sofia 2004. Statistical Yearbook 2004. National Statistical Institute, Sofia 2005. Statistical Yearbook 2005. National Statistical Institute, Sofia 2006. Strategic Plan for the Development of Blagoevgrad Municipality until 2015. http://www.blgmun.com.

THE IMPACT OF TECHNICAL INFRASTRUCTURE ON ENTREPRENEURSHIP ACTIVITY – EXAMPLE
OF RURAL AREAS IN POLAND
DARIUSZ ŚWIĄTEK
The question of whether infrastructure stock affects private sector growth remains unanswered, although the notion that the provision of public capital has an impact on the economic activity of private sector was explored in literature for many years (Mead, 1952; Hansen, 1965). The large discussion about the impact of infrastruc-ture equipment or investment on economic growth was initiated by David As-chauer at the end of the 1980’s and the beginning of the 1990’s (1989a, 1989b, 1989c, 1990), when he proved that the decrease of productivity that took place in the US in 1970’s was preceded by a slow down of infrastructure investment. Much of the studies that followed Aschauer’s papers have focused on the influence of a rise of infrastructure stocks or aggregate public capital1 on private sector output and productivity. Douglas Holtz-Eakin (1988, 1992) confirmed that aggregate public capital has significant impact on private sector productivity and similar con-clusions were reached by Alicia Munnell’s (1990, 1992).
Further studies showed that growth of infrastructure stock enhance output and productivity of the companies, by decreasing their costs, stimulating technological innovation and increasing productivity of other factors of production (Lee and Anas 1992, Suarez-Villa and Hasnath 1993). Alternative explanation for the influ-ence of infrastructure on firms’ activity was given by Rafael Flores de Frutos and Pedro Pereira (1993). They assumed that public capital is an endogenous variable in the macro growth system, proving that it is driven positively by output of private companies and negatively by their employment changes. Similarly to Aschauer (1989a), they found high return rates of the public capital (Flores de Frutos and Pereira 1993). Although other studies state the positive dependency between infra-structure stock and firms founding (Eberts 1991), differences among cases has been demonstrated. The variation depends on size of firm, type of infrastructure stock and the development stage of the country. Eberts’ evidence shows much stronger relation in case of small companies then larger firms. David Canning and Marianne Fay (1993) found in their study of 96 countries that rate of return of transport net-works in developed and industrializing countries is high to normal and moderate in underdeveloped countries. 1Aggregate public capital – sum of public capitals.
THE IMPACT OF TECHNICAL INFRASTRUCTURE ON ENTREPRENEURSHIP… 179
Also agricultural production is affected by infrastructure stocks prove numerous studies (Ahmed–Hossain, 1990; Antle, 1983, 1984; Binswanger–Khandker–Rozenzweig, 1993; Pradhan–Ratha–Sarma, 1990). However, the connection be-tween existing infrastructure and enterprises (or wider speaking productivity) is also criticized. This critical approach, nonetheless, will be here limited to few au-thors (e.g. Henry Aaron (1990), Charles Schultze (1990), Dale Jorgenson (1991), John Tatom (1991, 1993) or Edward Gramlich (1994)) as, literature analysis is not main goal of this paper.
This paper aims at checking if entrepreneurship is driven by infrastructure stock in rural areas2 in Poland by calculating correlation between those two variables. The dependent variable is the number of enterprises (per 1000 inhabitants) and the independent the infrastructure stock (in various units according to the kind of infra-structure). Such choice was made on basis of review of several documents of local policy in Poland, where presence of infrastructural stock is expected to change entrepreneurship activity.
The character of available data makes difficult to measure long run dependency between those two variables, mainly due to the lack of data before 1990 and to the various spatial approaches in collecting data employed during transformation pe-riod. Therefore, this paper focuses on one particular year (2002) and aggregates data on the communes’ level. The infrastructural as well as entrepreneurship data cover whole area of rural Poland (2171 communes) and were collected by the Pol-ish National Statistical Office.
The infrastructure data gives measures of technical stocks (e.g.: water pipelines, sewage systems, gas, electric and telephone networks and sewage plants) and were collected during National Census in 2002. The data on firm formation is from the Statistical Office Database REGON (the National Official Business Register), which is the most representative database for entrepreneurial activity in Poland. The basic unit of data contains information on company name and location, num-ber of employees, character of activity, date of establishment, and branches. The REGON database collects information for whole Poland however, it contains in-formation solely of companies with more than nine employees. Though the above-mentioned restriction it can be consider as the most valuable polish enterprises database.
To proceed with the assessment of spatial differentiation of infrastructure stock in rural areas in Poland, the first step is the calculation of the synthetic index sug-gested by Parysek and Wojtasiewicz (1979) for evaluating spatial differentiation of socio-economic issues. For index construction purposes, seven features were se-lected from various characteristics of communal infrastructure stock in rural areas
2Rural areas, according to the Polish Statistical Office, are all areas located outside of the city or town borders.

DARIUSZ ŚWIĄTEK 180
in Poland: rate of flats with water pipeline connection (1), rate of flats with sewage system connection (2), rate of flats connected to gas network (3), rate of flats with electricity of medium voltage 380 V (4), rate of household with fixed phone line (5), density of hard roads (6), and rate of households served by sewage plants (7).
Linear dependency test (Pearson) between those characteristics revealed strong correlation level (r = 0.8) between two of them: rate of flats with sewage system connection (2) and rate of households served by sewage plants (7). The latter was higher correlated also with other infrastructural characteristics and thus skipped in further analysis. The remaining features were processed according to equation:
j
jijij S
yyy
−=′
where:
ijy′ – value of j feature for i unit
ijy – standardized value of j feature for i unit
jy – average value of j feature
Sj – standard deviation of j feature
Following, the average value of normalized features for each rural commune was counted according to equation:
∑=
′=p
jijs y
pW
1
1
where j =1,2,3,…,p
sW - synthetic index of infrastructure equipment
ijy′ - standardised value of j feature for i unit
p - number of features The above calculations generate values for synthetic index that form series of
data, which are divided into three groups according to the suggestion of Paryskek and Wojtasiewicz (1979):
Class I: W < (x – ½ Sx) Class II: (x – ½ Sx) ≤ W ≤ (x + ½ Sx) Class III: W > (x + ½ Sx)

THE IMPACT OF TECHNICAL INFRASTRUCTURE ON ENTREPRENEURSHIP… 181
Figure 1 Technical Infrastructure Index in rural communes in Poland 2002
Source: Author’s own elaboration based on the Polish National Census 2002.
The synthetic index of infrastructure equipment shows a distinct division of polish communes into two groups: units located in eastern part of the country which are poorer equipped with technical infrastructure on the one hand and com-munes located in western part of Poland which are strongly differentiate but gener-ally better equipped with infrastructure stocks on the other hand. This phenomenon can be partly explained by historical determinants: like inheriting German infra-structure stock after the WWII in west part of Poland (Siemiński, 1992; Pięcek, 2001; Świątek, 2003, 2004). There are few groups of rural communes with higher number of infrastructure stock index can be observed: a) communes located in vicinity of large cities like Poznań, Kraków, Bielsko Biała, and Sielsian agglom-eration, and; b) communes that are under strong influence of middle size towns and c) communes where former state farms were located (Dzun, 2005).
Rural communes with high and average infrastructure index create spatial shape similar to spatial layout of areas with high values of the synthetic index of national economy created in 60’s by the polish geographer Stanisław Leszczyki. The index was created based on three groups of indicators: value of fixed capital assets, na-tional income generated and national income per capita (Leszczycki, 1964). Leszczycki’s index revealed areas with high living standard, characterised by in-

DARIUSZ ŚWIĄTEK 182
dustrial development above the national average, rich in mineral deposits and com-plemented by intensive agriculture (former voievodships Wrocławskie and Opol-skie). These communes together create an area shaped as a ‘L’ letter, which corre-spond with the shape created by the communes with higher infrastructure index calculated with data of 40 years later. Therefore, it shows us that spatial divisions present in Poland’s space after the WWII still exist.
The Figure 1 illustrates a classification of infrastructure of polish communes, that can be divided in three groups: Congested (with index higher then -0.16), In-termediate (index between -0.16 and -0.51) and Lagging (index lower then -0.51), following the division proposed by Hansen (1965), who theorized that the impact of new investments on regional development would vary according to the level of socio-economic activity in the region. As Hansen explained Congested regions can be characterised with high level of economic activity in comparison to infrastruc-ture provision, Intermediate regions have high potential but deficit of infrastructure and finally Lagging regions can be characterised as areas with scarcity of human and physical potential and lack of attractions for infrastructural investments (Han-sen, 1965).
Figure 2
Number of companies per 1000 inhabitants of rural communes in Poland 2002
Source: Author’s own elaboration based on the REGON’s database.

THE IMPACT OF TECHNICAL INFRASTRUCTURE ON ENTREPRENEURSHIP… 183
During the period of transformation from central planning to market driven economy started in 1989, entrepreneurship in Poland rose significantly. Changes in law regulations reduced to minimum the administrative requirements for opening new companies, and thus resulting in quick increase of enterprises’ number. Poland had 624,4 thus registered firms in 1989, while in 2002 this number rose to 2 261,9 thus. The most significant increase of entrepreneurial activity was noticed at the beginning of transformation period (years 1989–1992), when quantity of registered companies rose 227,2% (Kamińska, 2006).
Increase of private activity in rural areas was observed especially in communes located in the neighbourhood or within the borders of the Special Economic Zones;3 as well as in communes that beneficiated by international aid programs (like PHARE); areas with potential for tourism and spa; and communes located in the fringe of large cities. The latter group gathered 13% of all private companies in rural areas in 2002. It is worth noting that all above mentioned communes had ex-tra source of founds that allowed them not only to support entrepreneurship in di-rect and indirect ways but also to promote general development in their area.
The highest concentration of private firms in rural Poland was in the north-western part of the country (voievodships: Wielkopolskie, Kujawsko-Pomorskie, Pomorskie and Zachodniopomorskie), which had on average over than 58 compa-nies per 1000 inhabitants. The leading position was reached by communes with potential for tourism (like seashore, Mazury lake district or mountain communes) as well as those located in vicinity of large cities (like Poznań, Budgoszcz, Gdańsk). On the other hand, the smallest number of companies per 1000 inhabi-tants was registered in the eastern part of Poland (Lubelskie, Podkarpackie, Pod-laskie voievodship), where even large cities do not seem to generate high entrepre-neurial activity (e.g. Lublin, Rzeszów).
Hence, to check how technical infrastructure stock (measured by the infra-structure index) influence non-agricultural economic activity (measured by the number of companies registered per 1000 people) in rural areas in Poland, we must analyse the result of the correlation analysis, which can be seen in Figure 3.
The correlation indicates moderate association between entrepreneurship and in-frastructure index with a correlation coefficient of 0.270 and sinusoidal fit where y=68.739+19.725*cos (1.483x–2.387). The moderate association between analysed variables means that the influence of technical infrastructure can not be considered as a crucial for ‘new firm birth’. This level of dependency was confirmed also by analysis of Canning and Fay (1993) for developing countries.
One of the reasons of the discovered lack of strong dependency can be found in generally short history of technical infrastructure investments in rural areas. During
3Special Economic Zone are areas created to stimulate the economic activity in underprivileged regions (e.g. diverse kinds of tax exemption).

DARIUSZ ŚWIĄTEK 184
the communism, technical infrastructure in the country was developed only to short extend. Therefore infrastructure as a factor that stimulates entrepreneurship is a relatively new phenomenon and associations between infrastructure and firms birth are still not very widespread. Additionally, only a medium level of association between analysed variables is obtained due to the fact that infrastructure in rural Poland is build mainly to satisfy needs of residents of the region and not to provide services or to attract entrepreneurial activity. However one can expect that this aspect of infrastructure investments will be more significant in the future.
Figure 3
The correlation between technical infrastructure index (X Axis) and number of registered companies per 1000 people (Y Axis) in 2002
Y Axis – Enterprises per 1000 inhabitants X Axis – Index of technical infrastructure Sinusoidal fit: y = 68.739+19.725*cos (1.483x–2.387). Source: Own elaboration.

THE IMPACT OF TECHNICAL INFRASTRUCTURE ON ENTREPRENEURSHIP… 185
A separate problem requiring further analysis is the direction of causation be-tween infrastructure and entrepreneurship in rural areas. However, the goal of the present study is to analyse only if ‘firm birth is driven by infrastructure stock’, a statement frequently taken for granted in local policy making in Poland. Thus, the causation problem between the above mentioned variables was omitted in this pa-per, which is based on the assumption that infrastructure is independent variable that may influence or not entrepreneurial behaviour. Considering the results of the undertaken analysis is recommended that the line of reasoning of dependency be-tween infrastructure and entrepreneurship should be more cautiously applied, espe-cially concerning the low level of infrastructure development experienced in Po-land. Nonetheless, bearing in mind the theory of circular causation (Myrdal, 1957) the more developed commune is, the bigger its development will be and therefore the possibility of infrastructure driving entrepreneurial behaviour should be strongly considered.
References
Aaron, H. J. 1990: Why is infrastructure important?, Discussion. In: A. Munnell (Ed.), Is there a shortfall in public capital investment? Proceedings of a conference sponsored by the Federal Reserve Bank of Boston, Federal Reserve Bank of Boston, Boston.
Ahmed, R.–Hossain, M. 1990: Development impact of rural infrastructure in Bangladesh, International Food Policy Research Institute, Washington DC.
Antle, J. M. 1983: Infrastructure and aggregate agricultural productivity: International evidence. Economic Development and Cultural Change, 31(3), pp. 609–619.
Antle, J. M. 1984: Human capital, infrastructure and the productivity of Indian rice farmers, Journal of Development Economics, 14, 163–181.
Aschauer, D. A. 1989a: Is Public Expenditure Productive?, Journal of Monetary Economics, 23 (2), pp. 177–200.
Aschauer, D. A. 1989b: Public Investment and Productivity Growth, Economic Perspectives, 13(5), pp. 17–25.
Aschauer, D. A. 1989c: Does Public Capital Crowd Out Private Capital? Journal of Monetary Economics, 24(2). pp. 171–188.
Aschauer, D.A., 1990, Why Is Infrastructure Important? In Is There a Shortfall in Public Capital Investment? Proceedings of a Conference (A Munnell, Ed.). Boston: Federal Reserve Bank.
Binswanger, H.P., Khandker, S.R., and Rosenzweig, M.R., 1993, How infrastructure and financial institutions affect agricultural output and investment in India, Journal of Development Economics, 41, pp.331–366.
Burek, R., 1984, Infrastruktura gospodarcza a towarowość rolnictwa (na przykładzie województwa kieleckiego), Dokumentacja Geograficzna, 6, IGiPZ PAN, Warszawa.
Canning, D., and Fay, M., 1993, The Effect of Transportation Networks on Economic Growth, Columbia University Press.
Dzun W., 2005, Państwowe gospodarstwa rolne w procesie przemian systemowych w Polsce, IRWiR PAN, Warszawa.
Eberts, R.W., 1991, Some empirical evidence on the linkage between public infrastructure and local economic development. In: H. W. Herzog and A.M. Schlottmann (Eds.), Industry location and public policy, University of Tennessee Press, Knoxville, pp. 83–96.
DARIUSZ ŚWIĄTEK 186
Flores de Frutos, R., and Pereira, A., 1993, Public Capital and Aggregate Growth in the United States: Is Public Capital Productive?, University of California at San Diego Discussion Paper, 93 (131).
Gramlich, E.M., 1994, Infrastructure Investment: A Review Essay, Journal of Economic Literature, 32 (3), pp. 1176–1196.
Hansen, N.M., 1965, The structure and determinants of local public investment expenditures. Review of Economics and Statistics, 45, pp. 150–162.
Holtz-Eatkin, D., 1988, Private Output, Government Capital, and the Infrastructure Crisis, Discussion Paper No. 394, Columbia University.
Holtz-Eatkin, D., 1992, Public Sector Capital and the Productivity Puzzle, National Bureau of Economic Research Working Paper No. 4144.
Jorgenson, D., 1991, Fragile Statistical Foundations: The Macroeconomics of Public Infrastructure Investment, American Enterprise Institute Discussion Paper.
Kamińska, W., 2006, Pozarolnicza indywidualna działalność gospodarcza w Polsce w latach 1988–2003, Prace Geograficzne 203, IGiPZ PAN, Warszawa.
Lee, K.S. and Anas, A., 1992, Impact of infrastructure deficiencies on Nigerian manufacturing: Private alternatives and policy options, Staff Discussion Paper, Report INU 98, Washington DC, World Bank.
Leszczyki S., 1964, Syntetyczne wskaźniki dla określenia przestrzennej gospodarki narodowej Polski, in: Z badań nad problematyką przestrzenną przemysłu Polski, Biuletyn KPZK, z. 32, s.7–24.
Mead, J.E., 1952, External Economies and Diseconomies in a Competitive Situation, Economic Journal, 62, pp. 54–67.
Munnell, A.H., 1990, Why Has Productivity Declined? Productivity and Public Investment, New England Economic Review, Federal Reserve Bank of Boston, pp. 3–22.
Munnell, A.H., 1992, Policy Watch: Infrastructure Investment and Economic Growth, Journal of Economic Perspectives, vol. 6, no. 4, pp. 189–198.
Myrdall, G., 1957, Economic Theory and Under-Developed Regions, University Paperbacks, Methuen, London.
Parysek J.J., Wojtasiewicz L., 1979, Metody analizy regionalne i metody planowania regionalnego, Studia KPZK PAN, Tom LXIX.
Pięcek, B., 2001, Wpływ infrastruktury na warunki Ŝycia ludności wiejskiej i procesy demograficzne, Wieś i rolnictwo na przełomie wieków (ed. Bukraby-Rylska I. and Rosner A.), IRWiR PAN, Warszawa.
Pradhan, B.K., Ratha, D.K., and Sarma, A., 1990, Complementarity between public and private investment in India, Journal of Development Economics, 33, pp. 101–116.
Schulze, Ch.L., 1990, The Federal Budget and the Nation’s Economic Health, In: Setting national priorities: Policies for the nineties. H.J. Aaron (Ed.), Brookings Institution, Washington, pp. 19–64.
Siemiński, J. L. 1992: ZróŜnicowania infrastruktury obszarów wiejskich, IRWiR PAN, Warszawa. Suarez-Villa, L. – Hasnath, S. A. 1993: The effect of infrastructure on investment: Innovative
capacity and the dynamics of public construction investment. Technological Forecast and Social Change, 44, pp. 333–358.
Świątek, D., 2003, ZróŜnicowanie sieci infrastruktury technicznej na obszarach wiejskich woj. mazowieckiego, Problemy zagospodarowania terenów wiejskich w Polsce (ed. A. Stasiak) Biuletyn KPZK PAN, 207, pp. 111–120.
Świątek, D., 2004, Developement of technical infrastructure in Poland, Problems of Geography, 3–4, pp. 56–74.
Tatom, J. A., 1991, Public Capital and Private Sector Performance, Federal Reserve Bank of St. Louis Review, Federal Reserve Bank of St. Louis, St. Louis, pp. 3–15.
Tatom, J.A., 1993, Paved With Good Intentions: The Mythical National Infrastructure Crisis, Policy Analysis, Cato Institute.

REGIONAL PROBLEMS OF SCATTERED FARMS IN THE HOMOKHÁTSÁG AREA IN HUNGARY
ANDRÁS DONÁT KOVÁCS
Introduction
The sinking of the groundwater level in the Homokhátság area in the Danube-Tisza Interfluve and the related negative ecological, economic and social processes result in one of the most complex and most urgent environmental problems in Hungary.
The conflict of the region is extremely complex. The unfavourable hydrological changes did not only cause the drying-up of the wells and the desiccation of the lakes but also resulted in the breaking down of the ecological balance of the areas concerned, the regression of the local economy and the deterioration of the general living conditions.
It is to be regretted that no solution was found for the comprehensive treatment of these problems so far. The chief loser of the negative processes taking place in the region is the special feature of the settlement structure of the Great Plain: the world of the scattered farms.
The disadvantages of the scattered farms and rural areas and the lagging behind of the settlements in the Homokhátság area on the national level – reflected by the socio-economic development – further intensified in the past few years. The sub-sistence of the local population became unpredictable and the world of the scat-tered farms got into distress.
The landscape characteristics and values of the scattered farms – in brief
The scattered farms of the Homokhátság area in the Danube-Tisza Interfluve, in fact, occupy the remnants of the former alluvial fans of the Ancient Danube. The surface of the area is characterised by sand sheet plains, jointed rows of sand dunes and their formations divided by erosional-deflational depressions which were for-merly filled by temporary saline lakes and marshlands.
The most substantial natural resources can be found on the areas of the Kiskunság National Park established in 1975. The Park includes grassy and wet habitats, forests, pusztas, meadows and lawns used for agricultural purposes with a large number of considerable rare/protected species. The geomorphological forma-

ANDRÁS DONÁT KOVÁCS 188
tions are of outstanding importance, too: sand dune formations, diverse terrain and soil types and their combinations. Two-thirds of the area of the National Park is a Biosphere Reserve, and the saline lakes and the Lake Kolon are declared Ramsar Wetland habitats of international importance.
The cultural values of the area including 104 settlements are also unique (Table 1). The scattered farms themselves represent special values together with the tradi-tional farming activities including the farming methods maintaining the genome of the primordial Hungarian domestic animals. The milieu of the scattered farms does not only make the landscape unique but has a significant role in the conservation of the natural values, the functioning of the economy and the retention of the local community as well.
Table 1
Settlements of Homokhátság and the number of inhabitants on scattered farms
County Number of settlements Number of inhabitants on scattered farms
Bács-Kiskun 61 58,992 Csongrád 22 25,110 Pest 21 15,917 Total 104 100,019
Source: Hungarian Central Statistical Office.
Environmental conflicts – natural environment
Several international and national climatic and hydrographical researches reported changes in the climate of the Carpathian Basin in the past few years. According to the Hungarian experts and authorities, it would be an exaggeration to talk about a semi-desert state but the signs of the land turning into steppes are already definitely apparent. As a consequence of the durative dry periods of the past decades, the character of the pusztas in the Danube-Tisza Interfluve really changed: the saline habitats started to decay and there has been no water for years in certain lakes. Though there is a short rainy period in the beginning of the warm season but there has been sparsely any precipitation from July for years. Resulting from the longer and longer dry periods, the sinking of the groundwater level became global accom-panied by nitrification and the gradual decay of the topsoil. Certain reviews say that the groundwater level in the region lowered by two or three meters on average in the past ten years and thus the slow desiccation is perpetual (Figure 1).
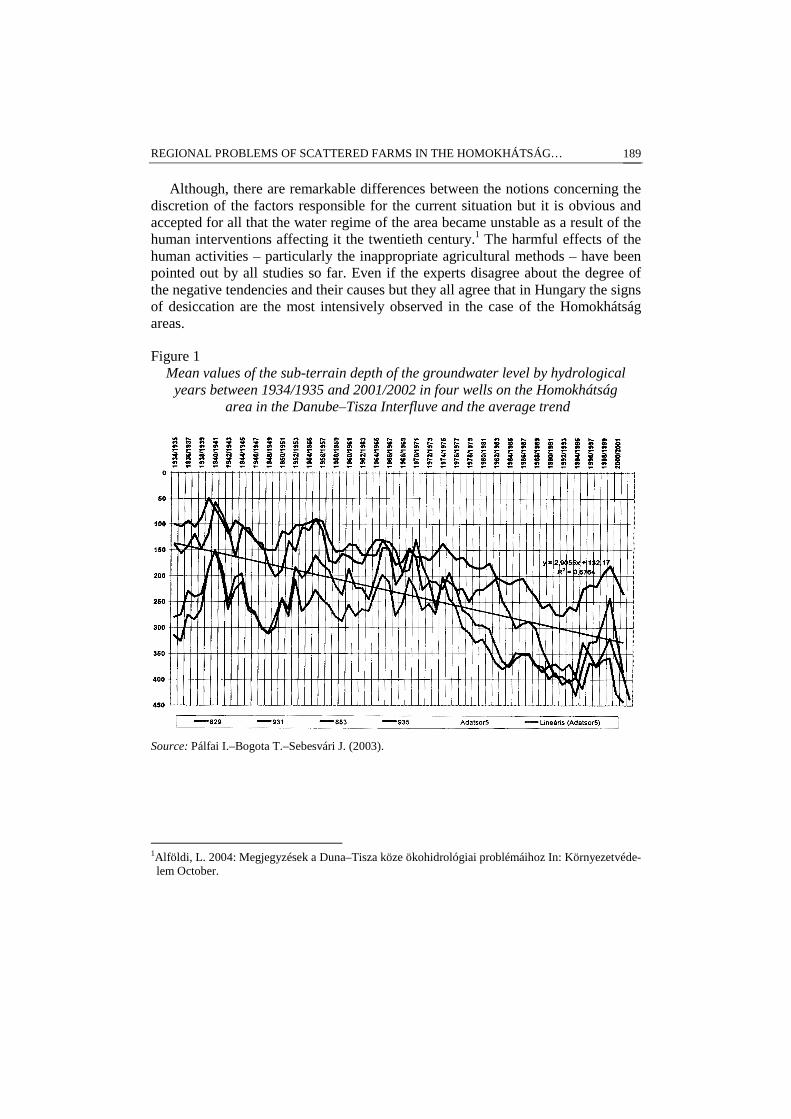
REGIONAL PROBLEMS OF SCATTERED FARMS IN THE HOMOKHÁTSÁG… 189
Although, there are remarkable differences between the notions concerning the discretion of the factors responsible for the current situation but it is obvious and accepted for all that the water regime of the area became unstable as a result of the human interventions affecting it the twentieth century.1 The harmful effects of the human activities – particularly the inappropriate agricultural methods – have been pointed out by all studies so far. Even if the experts disagree about the degree of the negative tendencies and their causes but they all agree that in Hungary the signs of desiccation are the most intensively observed in the case of the Homokhátság areas.
Figure 1 Mean values of the sub-terrain depth of the groundwater level by hydrological
years between 1934/1935 and 2001/2002 in four wells on the Homokhátság area in the Danube–Tisza Interfluve and the average trend
Source: Pálfai I.–Bogota T.–Sebesvári J. (2003).
1Alföldi, L. 2004: Megjegyzések a Duna–Tisza köze ökohidrológiai problémáihoz In: Környezetvéde-lem October.

ANDRÁS DONÁT KOVÁCS 190
Environmental conflicts – built environment
It may be generally established with respect to the built environment of the settle-ments of the area and the buildings of the world of scattered farms that they are rather miscellaneous, many of them are in a deteriorated and dilapidated state. Sta-tistics say that 55.6% of the approximately 52 thousand dwelling-houses in the outskirts in the Homokhátság were built before 1945, another 17.6% in the fol-lowing one and a half decade and only hardly more than one-quarter between 1960 and 2001. Two-fifths of the külterületi houses (40.3%) are below 60 m2 with one or two rooms. Almost 25% of the registered dwelling stocks in the outskirts are either temporarily inhabited or uninhabited. Based on the data of the census in 2001, wa-ter supply in the households is available only in less than half of the dwelling-houses in the peripheries (45.5%) and only one-third of them (33.3%) are equipped with flush toilets. Where the closet is available there are other basic conveniences, as well; where there is no closet, however, it is not only a technical-infrastructural deficiency but there are several other related social problems, too. Approximately 10–12% of the farms have no electricity supplies and 3–4% of the permanently habited farms do not have electricity. The ratio of houses in the peripheries con-nected to the sewerage network is also very low. Only 1378 of the houses in the peripheries are equipped with public sewers. Most of these can be found in the environs of Kecskemét, Kiskunfélegyháza and other middle-sized towns and they primarily function as homes.2
Chief conflicts of the social environment
The outskirts of the scattered farms involved in the research are perhaps the most typical with respect to the accumulated disadvantageous peripheral situation, the peculiarities of poverty and the characteristics of environmental degradation. Al-though, there are sparsely some sustainable farms and scattered settlement parts in the peripheries functioning in a relative harmony with their environment, which created long-term and favourable, conditions for living but on the whole more and more conflict factors appear. The farm zones bear most of the determining marks of the peripheral character. The farm areas characterised by low economic com-petitiveness, high unemployment rate and great migration loss, institutional supply below the average and population living on declining living standard roughly coin-cide with the districts of settlements having less developed environmental infra-structure.
The peripheral situation conveys real problems: chronic shortage of capital, acute employment crisis, social troubles. Most of the farms are located in microre-
2CSO database on peripheries.

REGIONAL PROBLEMS OF SCATTERED FARMS IN THE HOMOKHÁTSÁG… 191
gions with a foredoomed “marginal situation” lagging behind in the economic competition accompanied by aged inhabitants, depopulation, decline in the public standards of living and drastic deterioration of the state of the natural and built environment. The regional disparities and the accumulation of the disadvantageous situation might become stable and the farm settlements and the farms themselves will be less and less able to move from their current state.
Ways out
The scattered farms in the Homokhátság area are characterised by anachronistic and imperfectly constructed infrastructure, low economic competitive power, high unemployment rate, great migration loss, institutional supply below the average, and consequently declining living standards. Unfortunately, there are plenty of signs supporting that the socio-economic processes do not facilitate the closing-up of the Homokhátság area to the more developed regions. If the existing regional differences continue growing then the areas in question may loose their population. This process may have an influence on the entire country since the termination of the special landscape sustaining, economic and cultural functions characterising the scattered settlements may result in a regional environmental crisis. The support for the specific Hungarian settlement form and the help for the communities living in the outskirts are important for the entire society since those who live on the farms work on extensive areas and manage the environment. The conservation of the scattered farms in the Homokhátság, therefore, is a significant national task and the sustaining of the traditional farming methods and the peculiar landscape values are “vital matters” for thousands of families on the area of the Great Plain.
For the sake of the liquidation of the current situation and the safekeeping of the farms in the future, a new light must be thrown upon the changes affecting the con-ditions of the scattered farms. The environmental conflicts of the farms cannot be studied exclusively in the classic system of environmental protection focusing on infrastructure. The rehabilitation of the scattered farms on the Great Plain – fol-lowing modern European style integrated rural development solutions – requires joint measures. The farms are the structural and functional components of the land-scapes and settlement environmental complex systems whose sustainability is the function of several factors.
The ecological reconstruction of the area has become compelling due to the earlier developed water management problems and the still weltering deterioration of state. In addition to the further study of the liable causes and the role of the hu-man interventions, immediate action is needed to change the land use structure, to increase water retrenchment, and to provide more intensive support for the endeav-ours to present water supply. This requires incessant analysis, monitoring and

ANDRÁS DONÁT KOVÁCS 192
Figure 2
The most important factors of sustainability of Homokhátság from local and global aspects
Source: Edited by the author.
REGIONAL PROBLEMS OF SCATTERED FARMS IN THE HOMOKHÁTSÁG… 193
management of all human active components affecting the state of the water sup-ply. When searching for the environmental-strategic breakouts, the comprehensive modernisation of the technical infrastructure, the development of the public light-ing, road network in the peripheries, gas, telephone and sewage networks and the management of the communal waste must be given priority.
The settlements of the area need a joint long-term environmental, infrastruc-tural, agricultural and sylvicultural strategy for the more balanced development and the intensification of the environmental security. Thus, another precondition for the more effective action is the local and regional co-operation through which the set-tlements (taking into consideration the capabilities and the limits) “may share” the environmental management duties. The environment-conform solutions of the ag-riculture may become rewarding within the framework of the co-operations. Be-sides the above listed developments, of course, a modern programme with a social approach is also needed. The self-governments must join the EU and national pro-grammes (e.g. LEADER) and they should fully exploit the supports. This necessi-tates the improvement of the standard of the preparedness and attainments of the inhabitants and self-governments. The environmental-conscious behaviour on an improving social level could form the basis of the local and regional environmental culture.
The authors assume that the region – as it had been outlined above – can only proceed towards sustainability through the closing-up of the scattered farms. Aus-picious living conditions and a live economy could be created for the inhabitants partly by relying on the natural potentials, traditions and local knowledge and partly by exploiting the EU support systems through the modernisation of the inner resources of the Danube-Tisza Interfluve. This calls for the support of the full con-struction of the environmental infrastructures, the spread of the environment-con-form solutions in the agriculture, the harmonisation of nature conservation and tourism and the creation of an environment-conscious behaviour on all levels.
The conservation of the landscape values and the development of the settle-ments, the support of the agricultural production fitting the supporting-ability of the landscape and the creation of the related investment and service activities is a token of the future for the scattered farms and the entire area.
References
Farkas, J. Zs.–Kovács A. D. 2006: A homokhátsági tanyás térségek vizsgálata [Research of scattered farms of the Homokhátság area] Gazdálkodás. 50. 1. 72–80. p.
Pálfai, I.–Bogota, T.–Sebesvári, J. 2003: Vízháztartási változások a Duna–Tisza közi Homokhátságon [Hidrological changes in Danube–Tisza Interfluve]. In Magyar Hidrológiai Társaság XXI. Országos Vándorgyőlés CD, Szolnok.
http://www.alfoldinfo.hu/tanyakutatas/.

COUNTRY VISIONS IN EAST CENTRAL EUROPE
BÁLINT CSATÁRI
Introduction
A number of recent things have spurred me to write this lecture. One was the arri-val of a book entitled “Country Visions” at our library, the most recent UK volume of “rural studies”, edited by Paul Cloke. I found the distance in terms of atti-tude/perception and the way of thinking between our rural areas in East Central Europe and the spirit of the studies included in this book much greater than I did two and a half decades ago, when I published a review of “Key Settlements in Ru-ral Areas” by the same author in the Geographical Bulletin. The study that I liked the most examined changes in the perception of the countryside in children’s books published after World War II. ‘Indeed’, I thought to myself, ‘in a place where 75% of the population are urbanites, this might be an important issue for the general social perception of rural development and play an important role in forging the socio-economic solidarity required for the long-term sustainability of the country-side’.
The second thing came roughly a week later, when a lady journalist from a popular Internet-based magazine in Budapest called me. She sounded like someone who had never been to the Great Plain. Asking about the scattered farms in the area lying between the Rivers Danube and Tisza, she asked the following question in a tone that could not have been more natural, ‘And would you mind telling me if they still lead a life like that described by Zsigmond Móricz in his short story “The Little Orphan Girl” around 1930?’ Móricz, who was often regarded as a disciple of Reymont, the Polish Nobel laureate, did, indeed, write quintessentially about the peasantry and the countryside in the Hungary of the 1930s. But so many things have happened in East Central Europe since that time. The title of the above UK book may remind us of the fact that we are not quite familiar with the “country visions” which the generation that grew up surrounded by the state socialist propa-ganda extolling villages capable of large-scale agricultural production might have today, one and a half decades after the start of the transition. Not to mention their children growing up...
An even more shocking thing than the latter one was the guidelines on rural de-velopment ‘prescribed’ by Brussels for the new 2007–2013 period, which I downloaded the other day and compared with the Hungarian Government’s draft

COUNTRY VISIONS IN EAST CENTRAL EUROPE 195
documents on rural areas yet to be approved. The distance that I sensed figuratively was even greater here than in the case of the book.
Thus, there are a great number of professional, scientific and social issues that arise concerning rural areas and their future in both East Central Europe and Hun-gary.
Questions
− What is the likely cause of this concrete and figurative sense of distance? − What are the most important and the general rural problems that are common to East
Central Europe as a whole today? − Is there a possibility other than religiously following the road that took developed
Europe half a century to go along in order to stabilise its own rural areas?
We should, though, mention at this point that agricultural production will never be as heavily subsidised here in the rural zones of the recently acceded countries as it was in both Western and Southern Europe.
− Are there any general and truly adaptable models, or are we simply perform-ing experiments?
− Are we fully aware of the fact that responses of any merit to global chal-lenges can only be provided locally?
− Are we also fully aware of the fact that truly useful knowledge should be pro-vided to the rural societies capable of reviving themselves in order that they and their local communities can respond to current and future challenges?
The countryside, spheres of the countryside and the trends therein
Many have provided a definition of the rural space (e.g. an index of rurality) in order to channel, through the definition of these special areas, major activities and programmes aimed at their development.
However, there has been no truly good definition of ‘rurality’ as a sentiment, mindset or a way of life in the post-communist countries, even though – as the Bruntland Report on sustainability points out – a working definition would also be crucial to the protection of the environment, the production of wholesome and quality food, water management, clean air, landscape heritage and moral support for the local population. Here in the large region, the countryside has almost in-variably remained the symbol of backwardness, a lack of progress and a periphery that lags behind other areas economically and socially. Curiously enough, this per-ception lingers even when actual data on the given area do not justify such a per-ception. Hence, it is worth giving a thought or two to the most common problems of the post-socialist countryside of today.

BÁLINT CSATÁRI 196
Without a doubt, rural landscape and rural nature have a high environmental value. Apparently, hundreds of Dutch and German owners of farms in the Great Hungarian Plain, who use such farms – these one-time scattered homesteads – as their second home, are clearly aware of this. The reason for this is that in devel-oped Europe the rural landscape and rural resources have been gaining in impor-tance for decades now, which is partly the result of a deliberate rural policy pur-sued there. In our region, although nature protection overall has nothing to be ashamed of compared to that in Western Europe, stringent protection measures are rarely welcomed by the local societies or the farmers affected.
Firstly, because restrictive regulations laid down exclusively on the basis of landscape protection as a priority do not consider local societies to be part of the landscape, and ignore the wisdom contained in the saying, “Animals are only part of the landscape, while man not only constitutes part of it, but also shapes it”.
Secondly, there are no resources, or a determination to tackle the numerous tasks related to landscape protection in a manner that commands sufficient social support. What can be read on the relationship of Hungary and the European Land-scape Convention, available on the website of the relevant ministry, is highly illus-trative: “Tasks related to the Convention: Hungary has already fulfilled some1 of the tasks set in the Convention, since the protection of the landscape is regulated by law, and strategies on the landscape also address the issues of landscape protection, management and planning. The training of professionals responsible for the evaluation and operation of landscapes also has long-standing traditions. Both the population and local stakeholders are involved in decision-making mechanisms (e.g. public debates for the members of local communities, one-to-one meetings with members of the public)”. Unfortunately, from this it also follows that the amount of EU funds for agrarian environment protection granted to assisted areas is far below what is needed and available in terms of both proportion and territorial distribution. The NATURA 2000 project, too, has only been promulgated provi-sionally rather than officially.
Another major issue is the relationship between agriculture and rural develop-ment. Agrarian activity performed to a high standard and adjusted to the diversity of rural characteristics is a necessary, but inadequate condition for the future sur-vival of these areas. Envisaged changes in the European system of agrarian aid in the near future are likely to severely affect agricultural businesses, which have had an interest in the concentration of production and which now operate as large es-tates. Furthermore, a different system will not be conducive either to maintaining production in rural spaces with fewer advantageous agrarian features. Agrarian aid and development (the so-called EU CAP Pillar I) prioritising almost exclusively farms engaged in competitive market production over family farms that bring di-
1Highlighted in bold by the author.

COUNTRY VISIONS IN EAST CENTRAL EUROPE 197
versity, sustain the landscape, protect the agrarian environment and are in business partly for social reasons, are wrong, because – among other things – they do not take into account the damage done through the decay of the neglected rural envi-ronment.
In Hungary, the costs of labour lost to days spent on sick leave and those of medical treatment needed because of the severe allergic diseases caused by rag-weed (the Hungarian name ‘parlagfő’ [‘parlag’ means ‘fallow’, ‘uncultivated land’] aptly refers to the fact that it grows in uncultivated fields and orchards)2 are many times over the budget appropriation that the government earmarks for ragweed control or for the support of small-size family farms that contribute to the preser-vation of the landscape. Typically, this problem is the vestige of post-socialist sec-toral planning rather than area-based planning. Communication is non-existent between health care, nature protection and agricultural management groups. Rural areas are unable to act independently, as they were gradually dissuaded from doing so over the past decades – another after-effect of post-socialism.
Curiously, though, what is today an issue of large-scale versus small-scale pro-duction ceased to be a problem in the final decades of state socialism. Now it is the case once again. Small-size, partially self-sufficient family farms, which used to be household allotments linked to large-scale farming, operated in the 1980s in a manner that would today be expected from the new generation of production and sales co-operatives. However, the re-establishment of these new forms of co-op-eration is much harder than the preservation of the older forms would have been. The reason for this is that it would entail finding a solution to at least some of the related community, welfare and social problems (e.g. elderly care, financial support for schools and, at least partial, development of rural infrastructure). What was called the agricultural co-operatives movement found solutions to such problems on, one could say, a daily basis. The relatively strong solidarity and community of the Hungarian rural societies were both reflected in what was called the Hungarian model of socialist large-scale farming, which was, undoubtedly, tailored to their specific circumstances. When the model was no longer used, these functions either became fragmented or weakened.3 Thus, farms engaged in large-scale production based solely on a market basis and entrepreneurs4 do not support the countryside or the locality, or only do so in exceptional circumstances.
What is completely unprecedented in the history of the countryside and what is an important factor in terms of local awareness/consciousness is that farmers in
2Approximately 2.5 million persons suffer from allergies in Hungary, the primary cause of which is ragweed. Ragweed is one of the most common types of weed in Hungary, covering an area of approximately 5 million hectares, with 700,000 hectares heavily infected.
3Paul Cloke pointed this out in a report on his journey in rural Hungary at the time of the political changeover.
4Not infrequently, they are referred to as ‘green barons’.

BÁLINT CSATÁRI 198
outer areas of villages often do not seem to know who owns the adjoining culti-vated land. They used to: it belonged to them, a fellow farmer in the village or the landlord. Today it may easily belong to the grandchild of a farmer who fled the village in 1949 and now lives in the capital city, has not been seen ever since by his fellow farmers who stayed on, and it is often the case that the grandchild leases out the land under a share-cropping agreement to an agricultural business registered two villages further off. It is safe to say that, in addition to the spatial separation of land ownership from land cultivation, the frequent comparing, for political reasons, of farms engaged in competitive market production with family farms that are in business for social reasons gives rise to the most severe of conflicts.
A third set of major problems associated with the town and the country relation-ship and, partly, as a result of such a relationship, is in area and rural policy. The new system of borough councils that evolved in the rural regions of East Central Europe after the political changeover, in the era of transition provided perhaps too much legal leeway for some areas without being able to give anything in return for the state socialist town and country relationships that quickly fell apart. It is not only the scarcity of funds that lies at the heart of the problems, but also the ‘help-lessness’ of rural societies, ageing, long-term unemployment, a dysfunctional sys-tem of institutions that are increasingly difficult to operate and poor accessibility due to poor transport infrastructure. These social conflicts were further aggravated by those who fled the town for the country; since – be they the nouveau riche or town-dwellers who lost their jobs – they added to income differences and the re-sultant tension.
Basically, the conditions, in terms of public administration, area management, the efficient operation of area supply systems as well as the planning and organisa-tional foundations of area and rural development, for implementing the new EU recommendations that stress the town and country relationship are missing in East Central Europe. It is no wonder, then, that often even senior officials in rural areas are at a loss as to how to interpret these recommendations. They do not know what to make of the ‘synergy’ between regional, social and rural policies or the ‘com-plex and integrated’ territorial interaction between such policies when such policies do not function themselves. Be it the ‘synergy’ or the ‘complex and integrated’ approach, it is no different from what used to be called ‘common sense’. Only such sense is no longer common.5
5The translator’s note: ‘józan paraszti ész’ (‘good common sense’ or ‘horse sense’ in English) contains a derivative of the word ‘peasant’. The author here made a pun in his final sentence. This pun is, unfortunately, almost untranslatable. I found the way I rendered it in English to be the closest approximation of the author’s original intention.

COUNTRY VISIONS IN EAST CENTRAL EUROPE 199
Possible visions for the countryside
In conclusion, the way the rather intricate, diffuse and diverse rural conflicts out-lined in this paper can be resolved in the future is quite a challenging issue. To begin with, is it possible to project various scenarios for the develop-ment/transformation of these regions at all? Can one really propose any ‘visions’?
One vision is obvious enough. Changes in the rural landscape in East Central Europe occur with a lag of several decades after their counterparts in Western Europe. In essence, there will be three types of rural space: (1) a suburban rural area under strong urban influence, undergoing agglomeration; (2) a rural area under a more moderate urban influence, producing marketable agricultural products and capable of revival; and (3) a peripheral, ageing rural area that lags behind other areas and faces depopulation, hardly capable of revival. (In the third case, the situation may be further aggravated by diverse ethnic problems.)
The delay in following trends poses two serious threats, especially to space types (1) and (2). Under the market economy conditions that have evolved recently, changes in the rural space and the manner it is utilised in, often without any re-strictions, occupy the rural space more intensely than is desirable; they ‘devour’ it, destroy the landscape and mercilessly exploit the environment.
Another major vision is about the shared future of agriculture and the country-side. That is, at one end of the spectrum (A) there is a competitive, high tech-based, heavily subsidised agricultural sector, which plays an increasingly minor part in providing a living for the economically active rural population; at the other end (B) there is the “low tech”-type, extensive or intensive bio-farming with landscape preservation and agrarian environment protection as its priority. The question is how they correlate in space and time and in terms of active employment and in their ability to provide a living. Quite recently, a third possibility (C) has also arisen, which envisages the countryside as an alternative energy supplier (energy grass, bio-diesel, bio-ethanol, bio-mass), but alas the ability of such a rural area to provide a living is hardly likely to be any stronger than that for type (A) agricul-ture.
Finally, in order that the visions offered by the third major scenario can be turned into reality, the resources and the natural and cultural heritage of the rural areas need to rise in prestige. Version (I) envisages the sustainable revival of areas having a fundamentally rural nature, with long-standing traditions of tourism, where the preservation of the post-material heritage of the countryside will come to take centre stage. Version (II) is based on ‘authentic’ rural tourism offering new local values; one that does not consider the local population to be some unwanted distraction in a sanctuary; rather, it asserts that it is a social group preserv-ing/salvaging heritage, which serves the public good and which, by their very ex-istence in such places, creates irreplaceable values. In this respect, Version (III)
BÁLINT CSATÁRI 200
could be a diversification of the economic activities pursued in the areas suitable for such activities. This could mean mobile places of work and, in some cases, the development of local services with sophisticated methods, which could also strengthen hierarchically structured civil communities.
And if, – based on the possible and necessary spatial variations of the basic ver-sions of the above-mentioned visions of development – the environmental, eco-nomic, social and settlement rehabilitation of the rural spaces in East Central Europe takes place, relying on new local ‘in situ’ knowledge and being capable of creating new harmonies, we will then also be able to write essays on what “Coun-try Visions” is actually about.
We could, for instance, write essays on ‘rurality and animality’, ‘psycho-geographies of rural space’, or ‘spiritual embodiment and sacred rural landscape’. Or are they the very topics that we ought to be studying now?
References
Cloke, P. (ed.) 2003: Country visions. Pearson. Harlow. p. 343. Csatári, B. 2005: Spatial conflicts in rural areas of Hungary In.: T. Komornicki and K. Czapiewski,
ed. Central and Eastern Europe: Changing spatial patterns of human activity. Warsaw pp. 33–39. Banski, J. 1999: Problem areas in Polish agriculture, Prace Geograficzne Nr. 172. Wroclaw. pp.124–
128.

The Discussion Papers series of the Centre for Regional Studies of the Hungarian Academy of Sciences was launched in 1986 to publish summaries of research findings on regional and urban development.
The series has 5 or 6 issues a year. It will be of interest to geographers, economists, sociologists, experts of law and political sciences, historians and everybody else who is, in one way or another, engaged in the research of spatial aspects of socio-economic development and planning.
The series is published by the Centre for Regional Studies. Individual copies are available on request at the Centre.
Postal address
Centre for Regional Studies of the Hungarian Academy of Sciences P.O. Box 199, 7601 PÉCS, HUNGARY
Phone: (36–72) 523 800 Fax: (36–72) 523 803
www.rkk.hu http://www.dti.rkk.hu/kiadv/discussion.html
Director general
Gyula HORVÁTH
Editor
Zoltán GÁL [email protected]

BÁLINT CSATÁRI
202
202
Papers published in the Discussion Papers series
DISCUSSION PAPERS /SPECIALS
BENKİNÉ LODNER, Dorottya (ed.) (1988): Environmental Control and Policy: Proceedings of the Hungarian–Polish Seminar in the Theoretical Problems of Environmental Control and Policy
OROSZ, Éva (ed.) (1988): Spatial Organisation and Regional Development Papers of the 6th Polish–Hungarian geographical Seminar
DURÓ, Annamária (ed.) (1993): Spatial Research and the Social–Political Changes: Papers of the 7th Polish–Hungarian Seminar
DURÓ, Annamária (ed.) (1999): Spatial Research in Support of the European Integration. Proceedings of the 11th Polish–Hungarian Geographical Seminar (Mátraháza, Hungary 17–22 September, 1998)
GÁL, Zoltán (ed.) (2001): Role of the Regions in the Enlarging European Union HORVÁTH, Gyula (ed.) (2002): Regional Challenges of the Transition in Bulgaria and Hungary KOVÁCS, András Donát (ed.) (2004): New Aspects of Regional Transformation and the Urban-
Rural Relationship BARANYI, Béla (ed.) (2005): Hungarian–Romanian and Hungarian–Ukrainian border regions as
areas of co-operation along the external borders of Europe
DISCUSSION PAPERS
No. 1 OROSZ, Éva (1986): Critical Issues in the Development of Hungarian Public Health with Special Regard to Spatial Differences
No. 2 ENYEDI, György – ZENTAI, Viola (1986): Environmental Policy in Hungary No. 3 HAJDÚ, Zoltán (1987): Administrative Division and Administrative Geography in
Hungary No. 4 SIKOS T., Tamás (1987): Investigations of Social Infrastructure in Rural Settlements of
Borsod County No. 5 HORVÁTH, Gyula (1987): Development of the Regional Management of the Economy
in East-Central Europe No. 6 PÁLNÉ KOVÁCS, Ilona (1988): Chance of Local Independence in Hungary No. 7 FARAGÓ, László – HRUBI, László (1988): Development Possibilities of Backward
Areas in Hungary No. 8 SZÖRÉNYINÉ KUKORELLI, Irén (1990): Role of the Accessibility in Development
and Functioning of Settlements No. 9 ENYEDI, György (1990): New Basis for Regional and Urban Policies in East-Central
Europe No. 10 RECHNITZER, János (1990): Regional Spread of Computer Technology in Hungary No. 11 SIKOS T., Tamás (1992): Types of Social Infrastructure in Hungary (to be not
published) No. 12 HORVÁTH, Gyula – HRUBI, László (1992): Restructuring and Regional Policy in
Hungary

COUNTRY VISIONS IN EAST CENTRAL EUROPE
203
203
No. 13 ERDİSI, Ferenc (1992): Transportation Effects on Spatial Structure of Hungary No. 14 PÁLNÉ KOVÁCS, Ilona (1992): The Basic Political and Structural Problems in the
Workings of Local Governments in Hungary No. 15 PFEIL, Edit (1992): Local Governments and System Change. The Case of a Regional
Centre No. 16 HORVÁTH, Gyula (1992): Culture and Urban Development (The Case of Pécs) No. 17 HAJDÚ, Zoltán (1993): Settlement Network Development Policy in Hungary in the
Period of State Socialism (1949–1985) No. 18 KOVÁCS, Teréz (1993): Borderland Situation as It Is Seen by a Sociologist No. 19 HRUBI, L. – KRAFTNÉ SOMOGYI, Gabriella (eds.) (1994): Small and medium-sized
firms and the role of private industry in Hungary No. 20 BENKİNÉ Lodner, Dorottya (1995): The Legal-Administrative Questions of
Environmental Protection in the Republic of Hungary No. 21 ENYEDI, György (1998): Transformation in Central European Postsocialist Cities No. 22 HAJDÚ, Zoltán (1998): Changes in the Politico-Geographical Position of Hungary in
the 20th Century No. 23 HORVÁTH, Gyula (1998): Regional and Cohesion Policy in Hungary No. 24 BUDAY-SÁNTHA, Attila (1998): Sustainable Agricultural Development in the Region
of the Lake Balaton No. 25 LADOS, Mihály (1998): Future Perspective for Local Government Finance in Hungary No. 26 NAGY, Erika (1999): Fall and Revival of City Centre Retailing: Planning an Urban
Function in Leicester, Britain No. 27 BELUSZKY, Pál (1999): The Hungarian Urban Network at the End of the Second
Millennium No. 28 RÁCZ, Lajos (1999): Climate History of Hungary Since the 16th Century: Past, Present
and Future No. 29 RAVE, Simone (1999): Regional Development in Hungary and Its Preparation for the
Structural Funds No. 30 BARTA, Györgyi (1999): Industrial Restructuring in the Budapest Agglomeration No. 31 BARANYI, Béla–BALCSÓK, István–DANCS, László–MEZİ, Barna (1999):
Borderland Situation and Peripherality in the North-Eastern Part of the Great Hungarian Plain
No. 32 RECHNITZER, János (2000): The Features of the Transition of Hungary’s Regional System
No. 33 MURÁNYI, István–PÉTER, Judit–SZARVÁK, Tibor–SZOBOSZLAI, Zsolt (2000): Civil Organisations and Regional Identity in the South Hungarian Great Plain
No. 34 KOVÁCS, Teréz (2001): Rural Development in Hungary No. 35 PÁLNÉ, Kovács Ilona (2001): Regional Development and Governance in Hungary No. 36 NAGY, Imre (2001): Cross-Border Co-operation in the Border Region of the Southern
Great Plain of Hungary No. 37 BELUSZKY, Pál (2002): The Spatial Differences of Modernisation in Hungary at the
Beginning of the 20th Century No. 38 BARANYI, Béla (2002): Before Schengen – Ready for Schengen. Euroregional
Organisations and New Interregional Formations at the Eastern Borders of Hungary

BÁLINT CSATÁRI
204
204
No. 39 KERESZTÉLY, Krisztina (2002): The Role of the State in the Urban Development of Budapest
No. 40 HORVÁTH, Gyula (2002): Report on the Research Results of the Centre for Regional Studies of the Hungarian Academy of Sciences
No. 41 SZIRMAI, Viktoria – A. GERGELY, András – BARÁTH, Gabriella–MOLNÁR, Balázs – SZÉPVÖLGYI, Ákos (2003): The City and its Environment: Competition and/or Co-operation? (A Hungarian Case Study)
No. 42 CSATÁRI, Bálint–KANALAS, Imre–NAGY, Gábor –SZARVÁK, Tibor (2004): Regions in Information Society – a Hungarian Case-Study
No. 43 FARAGÓ, László (2004): The General Theory of Public (Spatial) Planning (The Social Technique for Creating the Future)
No. 44 HAJDÚ, Zoltán (2004): Carpathian Basin and the Development of the Hungarian Landscape Theory Until 1948
No. 45 GÁL, Zoltán (2004): Spatial Development and the Expanding European Integration of the Hungarian Banking System
No. 46 BELUSZKY, Pál – GYİRI, Róbert (2005): The Hungarian Urban Network in the Beginning of the 20th Century
No. 47 G. FEKETE, Éva (2005): Long-term Unemployment and Its Alleviation in Rural Areas No. 48 SOMLYÓDYNÉ PFEIL, Edit (2006): Changes in The Organisational Framework of
Cooperation Within Urban Areas in Hungary No. 49 MEZEI, István (2006): Chances of Hungarian–Slovak Cross-Border Relations No. 50 RECHNITZER, János – SMAHÓ, Melinda (2006): Regional Characteristics of Human
Resources in Hungary During the Transition No. 51 BARTA, Györgyi – BELUSZKY, Pál – CZIRFUSZ, Márton – GYİRI, Róbert –
KUKELY, György (2006): Rehabilitating the Brownfield Zones of Budapest No. 52 GROSZ, András (2006): Clusterisation Processes in the Hungarian Automotive
Industry No. 53 FEKETE, G. Éva – HARGITAI, Judit – JÁSZ, Krisztina – SZARVÁK, Tibor –
SZOBOSZLAI, Zsolt (2006): Idealistic Vision or Reality? Life-long learning among Romany ethnic groups
No. 54 BARTA, Györgyi (ed.) (2006): Hungary – the New Border of the European Union No. 55 GÁL, Zoltán (2006): Banking Functions of the Hungarian Urban Network in the Early
20th Century. No. 56 SZÖRÉNYINÉ, Kukorelli Irén (2006): Relation Analysis in Rural Space – A Research
Method for Exploring the Spatial Structure in Hungary No. 57 MAUREL, Marie-Claude – PÓLA, Péter (2007): Local System and Spatial Change –
The Case of Bóly in South Transdanubia No. 58 SZIRMAI, Viktória (2007): The Social Characteristics of Hungarian Historic
City Centres