regional water security and public health implications in the bengal delta
DESCRIPTION
Dr Ali Shafqat Akanda, Tufts University, USA --- Regional water security and public health implications in the Bengal Delta ---Water security, human development and governance -- Explores the impacts and interactions of economic, demographic and hydrological change for human development at multiple scales. Historical and regional analysis from the household to the river basin levels offers insight about the institutional reforms and governance capacity needed to improve and track health and welfare outcomes for vulnerable groups.TRANSCRIPT

Water Security and Public Health Implications for Bengal Delta
Ali Shafqat Akanda*
Antarpreet S Jutla
Shafiqul Islam

Objective
Understanding water security in Bengal Delta
Quantity, Quality and Ecosystems
Societal and Public Health Implications
Identify hydroclimatic and environmental drivers
that contribute to water-borne transmission
Identify, understand, and quantify population
vulnerability to these large scale drivers
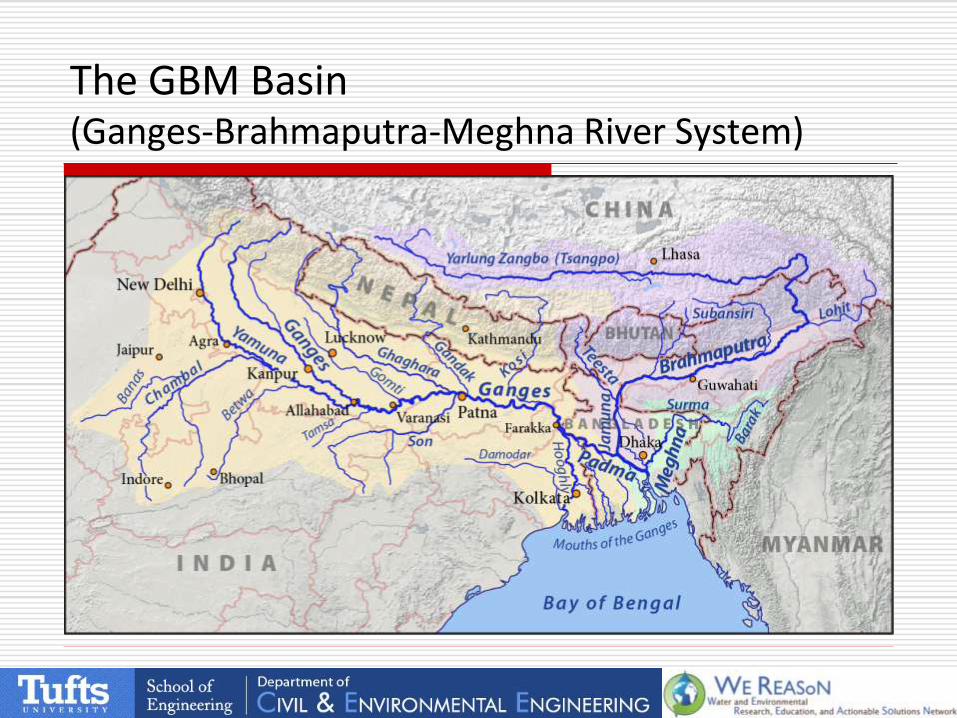
The GBM Basin (Ganges-Brahmaputra-Meghna River System)

‘Native homeland’ of cholera
Cholera outbreaks 1890-1945 Pascual et al., 2002

The Bengal Delta (over 200 million)

Brahmaputra Streamflow Hydrographs 1960-2000
0
10000
20000
30000
40000
50000
60000
Jan Feb Mar Apr May Jun Jul Aug Sep Oct Nov Dec
60s
70s
80s
90s
Clim
Highly Seasonal Hydrology
Ganges Streamflow Hydrographs 1940-2000
0
10000
20000
30000
40000
50000
60000
Jan Feb Mar Apr May Jun Jul Aug Sep Oct Nov Dec
40s
50s
60s
70s
80s
90s
Clim
0
10000
20000
30000
40000
50000
60000
70000
80000
90000
Jan Feb Mar Apr May Jun Jul Aug Sep Oct Nov Dec
m3/s
ec
Ganges
Brahmaputra
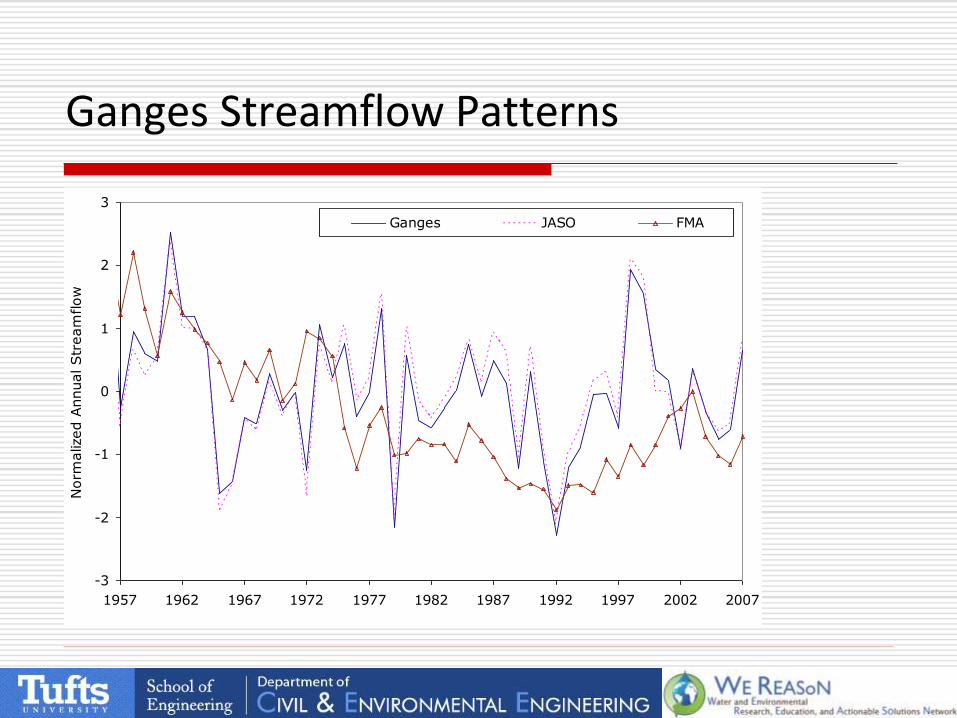
Ganges Streamflow Patterns
-3
-2
-1
0
1
2
3
1957 1962 1967 1972 1977 1982 1987 1992 1997 2002 2007
Norm
alized A
nnual Str
eam
flow
Ganges JASO FMA
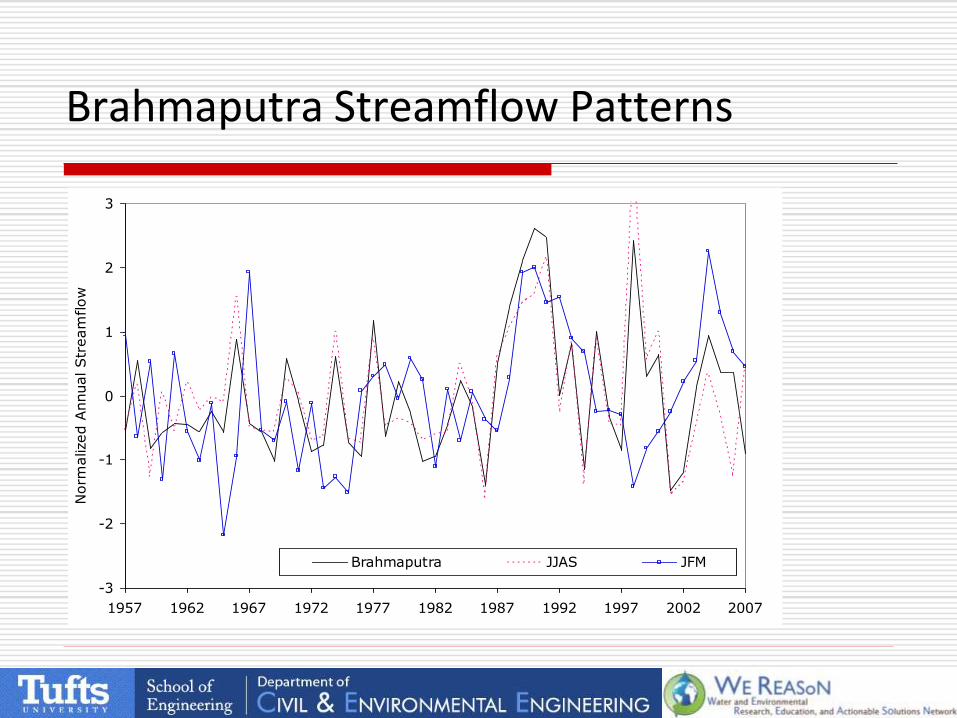
Brahmaputra Streamflow Patterns
-3
-2
-1
0
1
2
3
1957 1962 1967 1972 1977 1982 1987 1992 1997 2002 2007
Norm
alized A
nnual Str
eam
flow
Brahmaputra JJAS JFM

0
10000
20000
30000
40000
50000
60000
70000
80000
90000
Jan Feb Mar Apr May Jun Jul Aug Sep Oct Nov Dec
m3/s
ecGanges
Brahmaputra
Spring Onslaught of Drought

0
10000
20000
30000
40000
50000
60000
70000
80000
90000
Jan Feb Mar Apr May Jun Jul Aug Sep Oct Nov Dec
m3/s
ec
Ganges
Brahmaputra
Then comes the Floods …
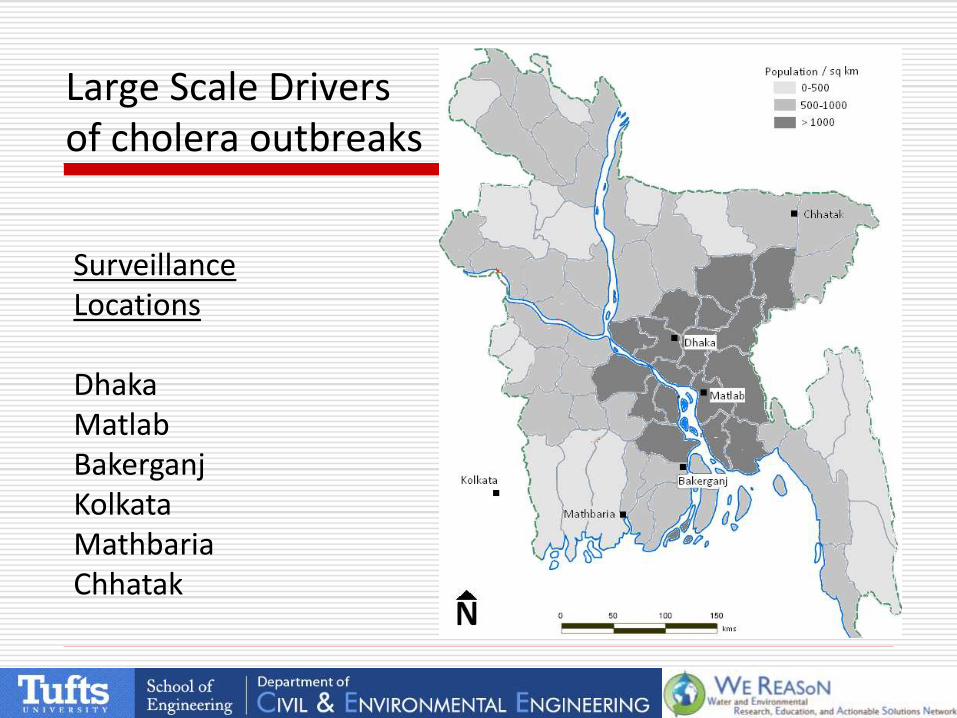
Large Scale Drivers of cholera outbreaks
Surveillance Locations Dhaka Matlab Bakerganj Kolkata Mathbaria Chhatak
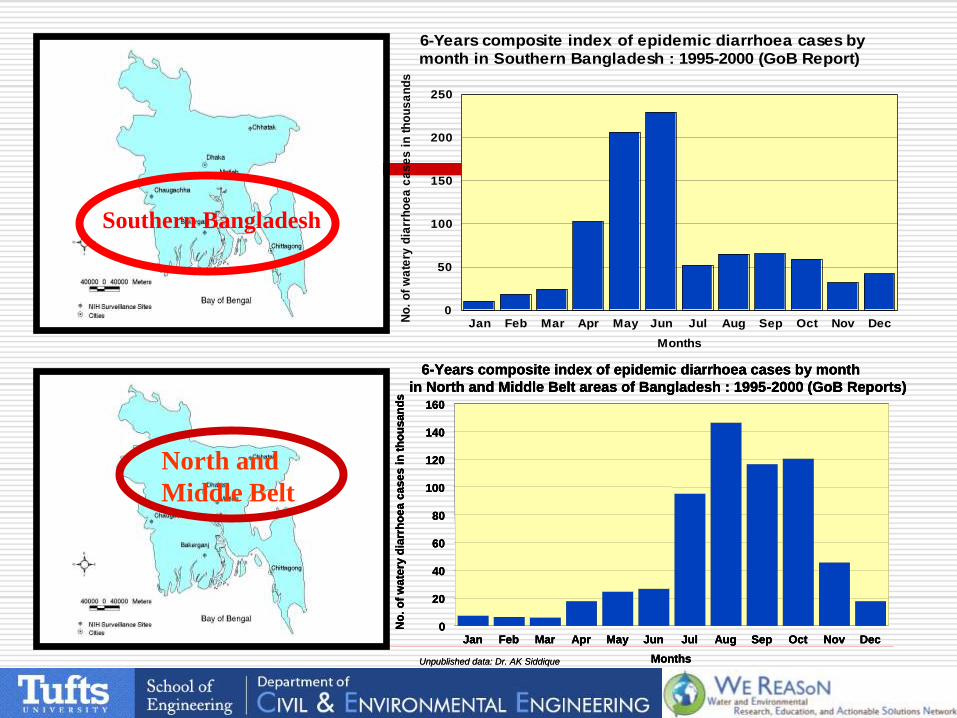
North and
Middle Belt
6-Years composite index of epidemic diarrhoea cases by month
in North and Middle Belt areas of Bangladesh : 1995-2000 (GoB Reports)
Jan Feb Mar Apr May Jun Jul Aug Sep Oct Nov Dec
Months
0
20
40
60
80
100
120
140
160N
o.
of
wa
tery
dia
rrh
oe
ac
as
es i
n t
ho
us
an
ds
Unpublished data: Dr. AK Siddique
6-Years composite index of epidemic diarrhoea cases by month
in North and Middle Belt areas of Bangladesh : 1995-2000 (GoB Reports)
Jan Feb Mar Apr May Jun Jul Aug Sep Oct Nov Dec
Months
0
20
40
60
80
100
120
140
160N
o.
of
wa
tery
dia
rrh
oe
ac
as
es i
n t
ho
us
an
ds
6-Years composite index of epidemic diarrhoea cases by month
in North and Middle Belt areas of Bangladesh : 1995-2000 (GoB Reports)
Jan Feb Mar Apr May Jun Jul Aug Sep Oct Nov Dec
Months
0
20
40
60
80
100
120
140
160N
o.
of
wa
tery
dia
rrh
oe
ac
as
es i
n t
ho
us
an
ds
Unpublished data: Dr. AK Siddique
Southern Bangladesh
6-Years composite index of epidemic diarrhoea cases by
month in Southern Bangladesh : 1995-2000 (GoB Report)
Jan Feb Mar Apr May Jun Jul Aug Sep Oct Nov Dec
Months
0
50
100
150
200
250
No
. o
f w
ate
ry d
iarr
ho
ea
ca
se
s i
n t
ho
us
an
ds
0
0.2
0.4
0.6
0.8
1
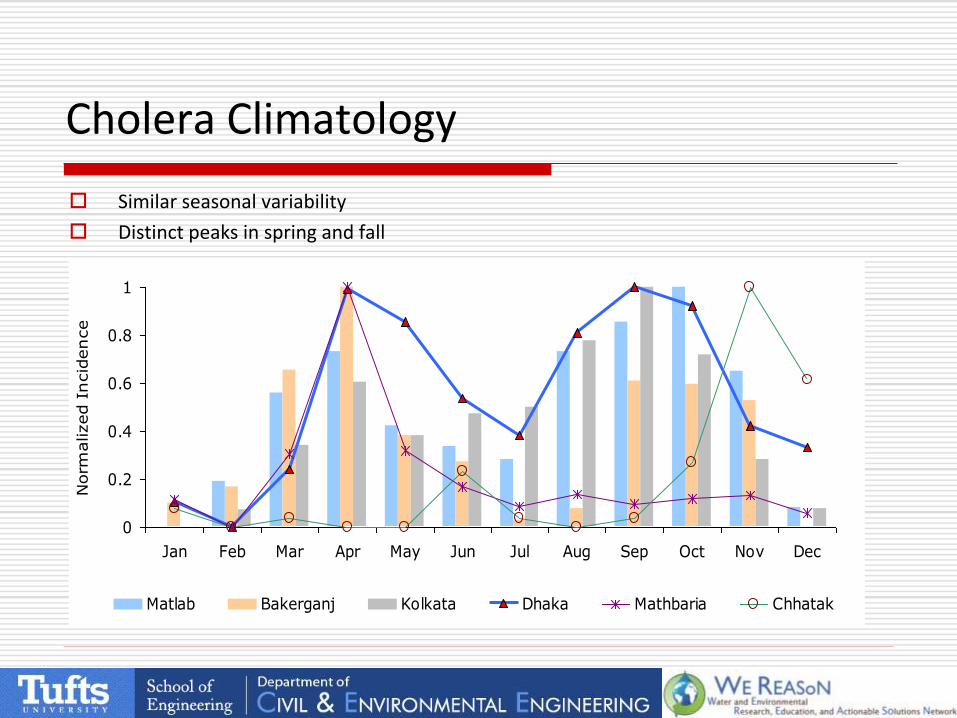
Jan Feb Mar Apr May Jun Jul Aug Sep Oct Nov Dec
Norm
alized I
ncid
ence
Matlab Bakerganj Kolkata Dhaka Mathbaria Chhatak
Cholera Climatology
Similar seasonal variability
Distinct peaks in spring and fall
Is there a spatial signature / consistency in the seasonal outbreaks among the surveillance locations?
Are the seasonal outbreaks in different locations related to or independent of each other?
What is the role of estuarine salinity and inland flood inundation on seasonal cholera outbreaks?
Do we see a consistent signature of the large scale hydroclimatic processes on cholera outbreaks in all locations?
Research Questions

Focus on Seasonality
0
10000
20000
30000
40000
50000
60000
70000
80000
90000
Jan Feb Mar Apr May Jun Jul Aug Sep Oct Nov Dec
m3/s
ec
Ganges
Brahmaputra
Seasonal peaks are seen in spring and early winter
Early outbreak coincides with spring low flow season
Higher cholera incidence is seen after monsoon
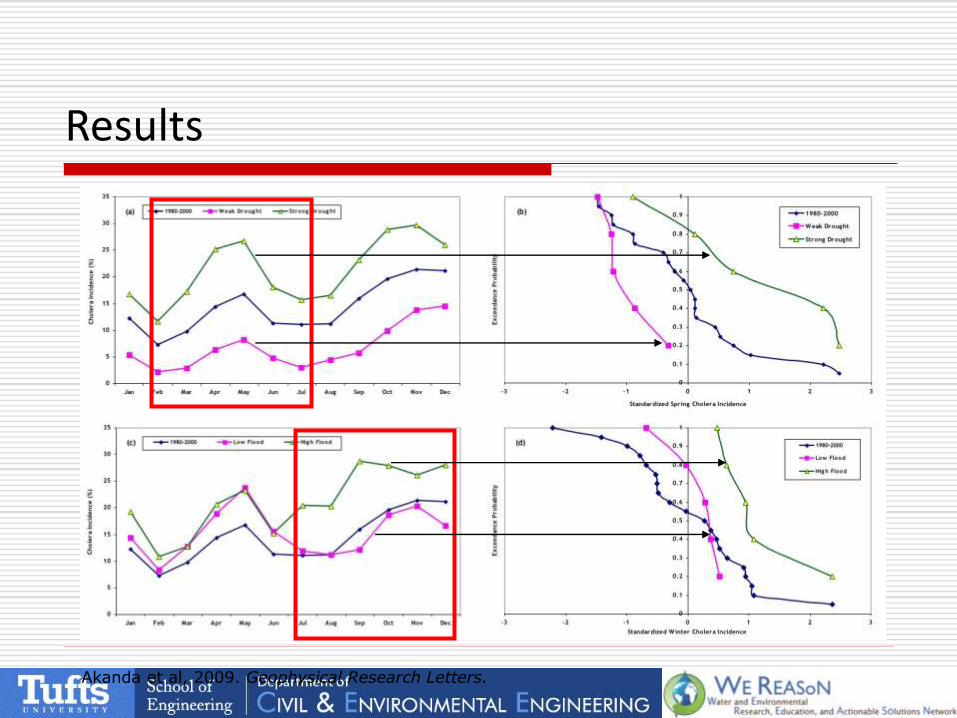
Akanda et al, 2009. Geophysical Research Letters.
Results

Seasonal Flow vs Disease Incidence
-2.5
-1.5
-0.5
0.5
1.5
2.5
-2.5 -1.5 -0.5 0.5 1.5 2.5
Seasonal Low Flow Anomaly
Sprin
g I
ncid
ence A
nom
aly
Dhaka
Matlab
Bakerganj
Kolkata
Linear
(Dhaka)Linear
(Matlab)Linear
(Kolkata)Linear
(Bakerganj)
-2.5
-1.5
-0.5
0.5
1.5
2.5
-2.5 -1.5 -0.5 0.5 1.5 2.5
Seasonal High Flow Anomaly
Fall In
cid
ence A
nom
aly
Bakerganj
Kolkata
Dhaka
Matlab
Linear
(Dhaka)Linear
(Matlab)Linear
(Kolkata)Linear
(Bakerganj)
Akanda et al, 2011b. Epidemiology (submitted)
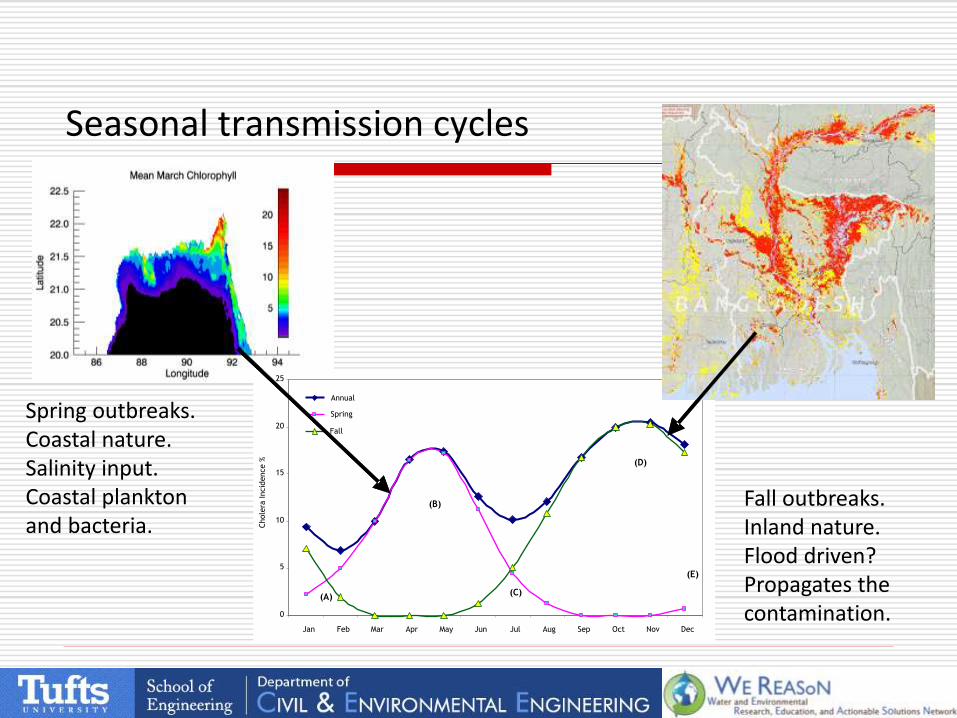
Seasonal transmission cycles
Spring outbreaks. Coastal nature. Salinity input. Coastal plankton and bacteria.
Fall outbreaks. Inland nature. Flood driven? Propagates the contamination. 0
5
10
15
20
25
Jan Feb Mar Apr May Jun Jul Aug Sep Oct Nov Dec
Chole
ra Incid
ence %
Annual
Spring
Fall
(B)
(C)
(D)
(E)
(A)
0
5
10
15
20
25
Jan Feb Mar Apr May Jun Jul Aug Sep Oct Nov Dec
Chole
ra Incid
ence %
Annual
Spring
Fall
(B)
(C)
(D)
(E)
(A)
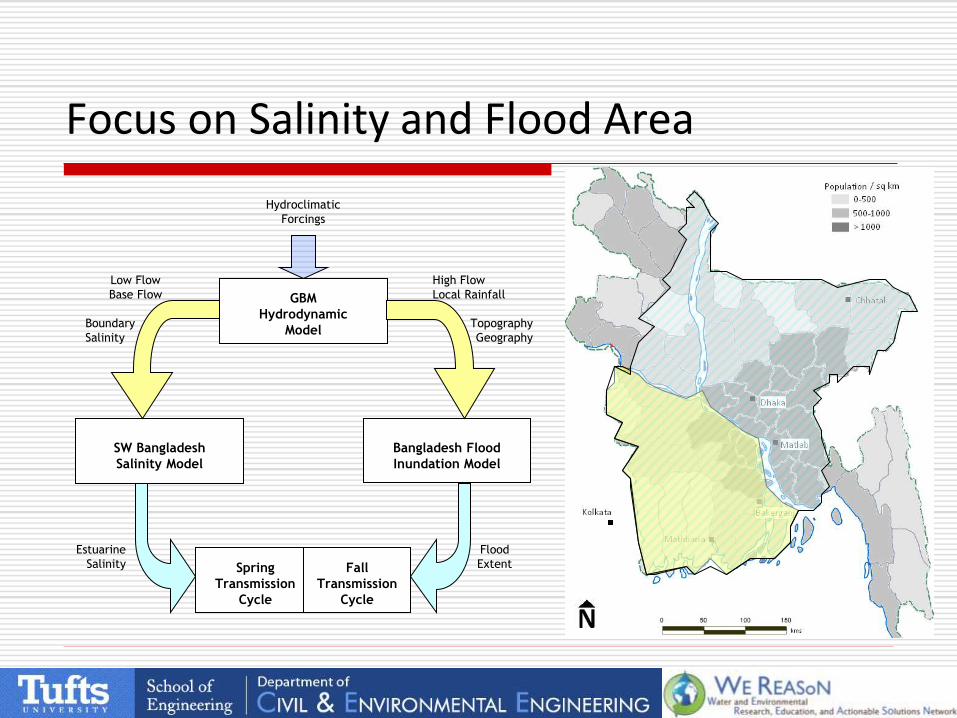
Focus on Salinity and Flood Area
GBM
Hydrodynamic
Model
SW Bangladesh
Salinity Model
Bangladesh Flood
Inundation Model
Hydroclimatic
Forcings
Spring
Transmission
Cycle
Fall
Transmission
Cycle
High Flow
Local Rainfall
Topography
Geography
Low Flow
Base Flow
Boundary
Salinity
Estuarine
Salinity
Flood
Extent

Salinity Intrusion during dry season Has distinct spatial and temporal signature
Based on monthly average of 1988-2007 simulation results
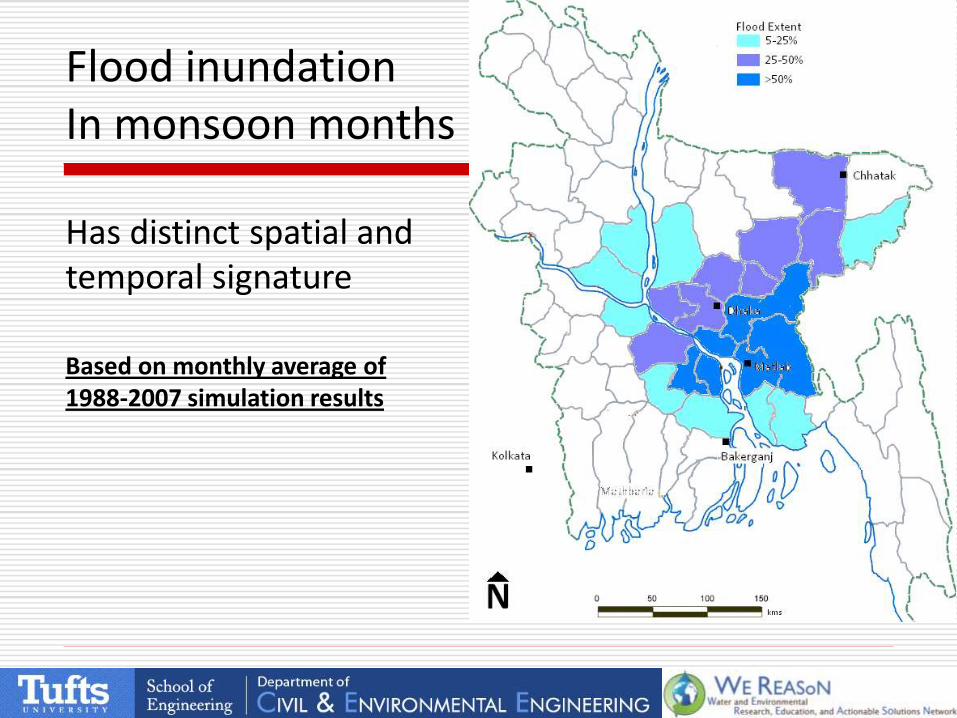
Flood inundation In monsoon months Has distinct spatial and temporal signature
Based on monthly average of 1988-2007 simulation results

Large Scale Vulnerability
Surveillance Locations Dhaka Matlab Bakerganj Kolkata Mathbaria Chhatak
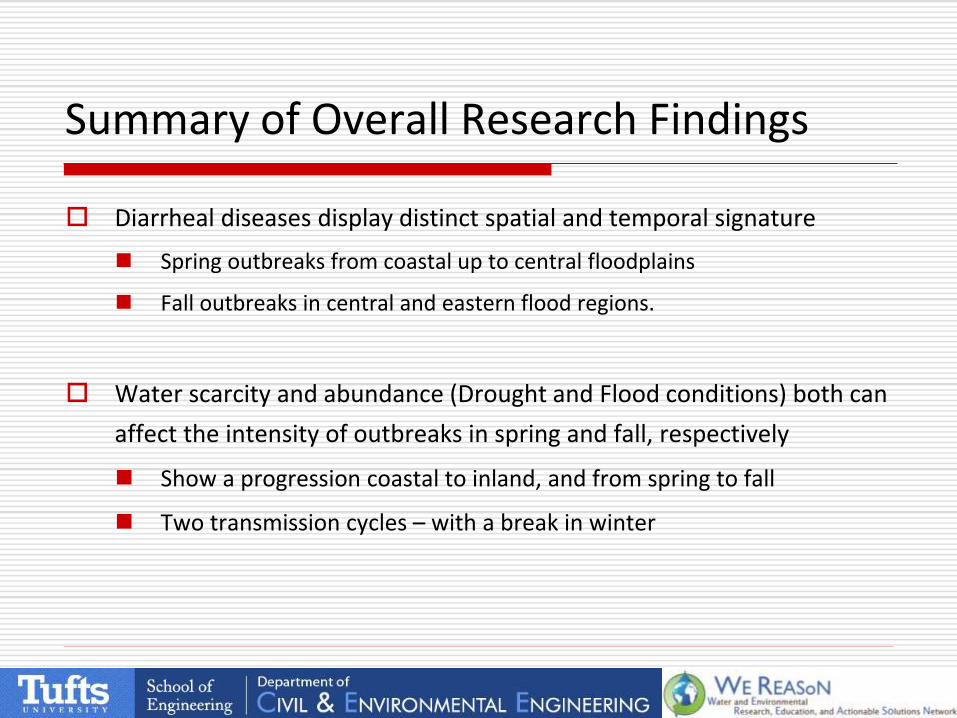
Summary of Overall Research Findings
Diarrheal diseases display distinct spatial and temporal signature
Spring outbreaks from coastal up to central floodplains
Fall outbreaks in central and eastern flood regions.
Water scarcity and abundance (Drought and Flood conditions) both can
affect the intensity of outbreaks in spring and fall, respectively
Show a progression coastal to inland, and from spring to fall
Two transmission cycles – with a break in winter
Implications of Research Findings
Large sections of the population (rural, peri-urban, and urban) remain
vulnerable to large scale mechanisms over large geographic regions
Population vulnerability to cholera and other diarrheal outbreaks are
severely underestimated and outside public health response system
Water security assessments for Bengal Delta need to incorporate the
public health implications that impact about 200 million people

Thank you!!!
Questions?
Comments??
Suggestions???