regional training workshop on human … 2_public... · 26 th –29 th march 2018 outline 1)...
TRANSCRIPT

26th – 29th March 2018
REGIONAL TRAINING WORKSHOP ON HUMAN SETTLEMENT INDICATORS
Esther Njiru
Global Urban Observatory
Research and Capacity Development Branch
26th – 29th March 2018
Bangkok, Thailand
Module 2: Public
Transport

26th – 29th March 2018
Outline
1) Background
2) Concepts and definitions of the indicator
3) Strategies for collecting and validating data
4) Computation of the data collected and the methodology defined
5) Discussions and explorations of participants views
26th – 29th March 2018
SDGs and Goal 11
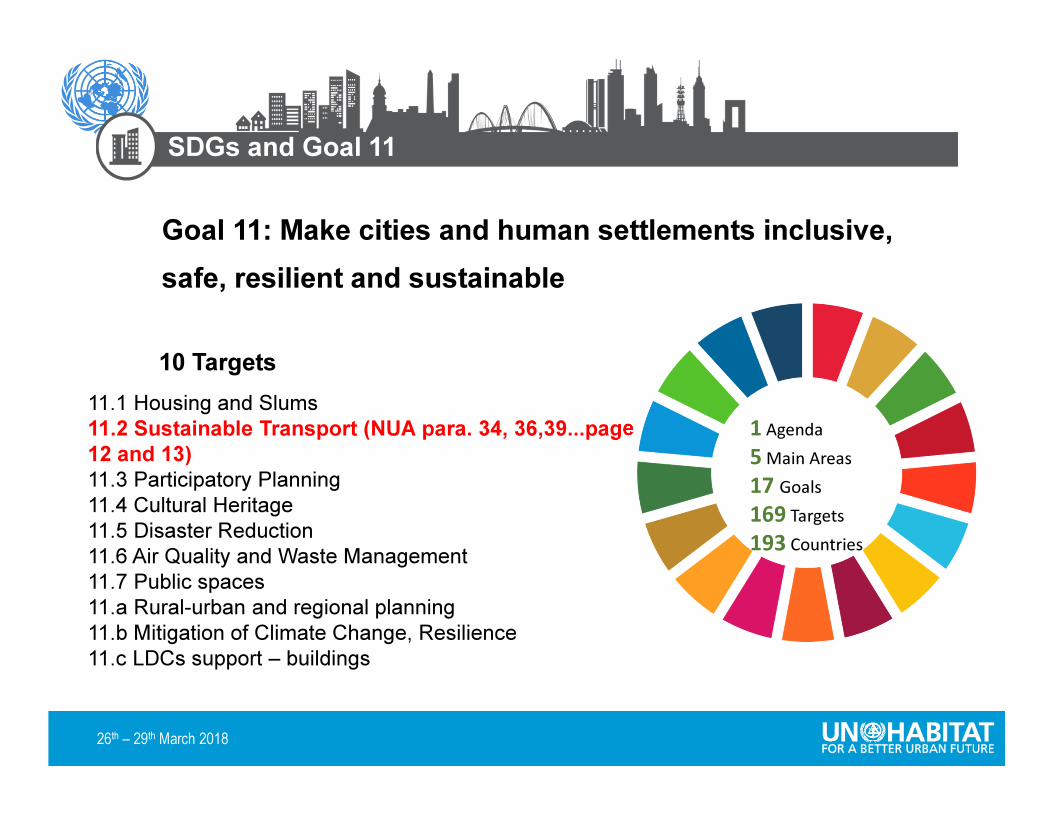
Goal 11: Make cities and human settlements inclusive,
safe, resilient and sustainable
10 Targets
11.1 Housing and Slums
11.2 Sustainable Transport (NUA para. 34, 36,39...page
12 and 13)
11.3 Participatory Planning
11.4 Cultural Heritage
11.5 Disaster Reduction
11.6 Air Quality and Waste Management
11.7 Public spaces
11.a Rural-urban and regional planning
11.b Mitigation of Climate Change, Resilience
11.c LDCs support – buildings
1 Agenda
5 Main Areas
17 Goals
169 Targets
193 Countries

26th – 29th March 2018
Module 2 Overview
By 2030, provide access to safe, affordable, accessible and sustainable transport systems for all, improving road safety, notably by expanding public transport, with special attention to the needs of those in vulnerable situations, women, and children, persons with disabilities and older persons.
IND
ICA
TO
R 1
1.2
.1
TA
RG
ET 1
1.2
Proportion of the population that has convenient
access to public transport by sex, age and persons with
disabilities

26th – 29th March 2018
Transport Target emphasizes on:
► Sustainable Mobility: satisfying the
needs of the current generation
without compromising the ability to
satisfy the needs of future generations
► Accessibility and Inclusiveness
Every decision on transport infrastructure
determines:
►Cityscape for decades
►Long-term influence on the mobility
behavior of residents
►Urban sustainability, productivity, safety
Monitoring Public Transport

26th – 29th March 2018
Monitoring and Reporting Process
NSOs/relevant
sectors
NSOs+
Custodian
Agency and
partners
Custodian
Agency and
partners
NSOs=city/Nation
al level
UN-Habitat and
UNSD=Regional
and Global levels

26th – 29th March 2018
Concepts and definitions as per the current metadata
How many of the transport systems in your cities/towns are
meeting the above requirements?
26th – 29th March 2018
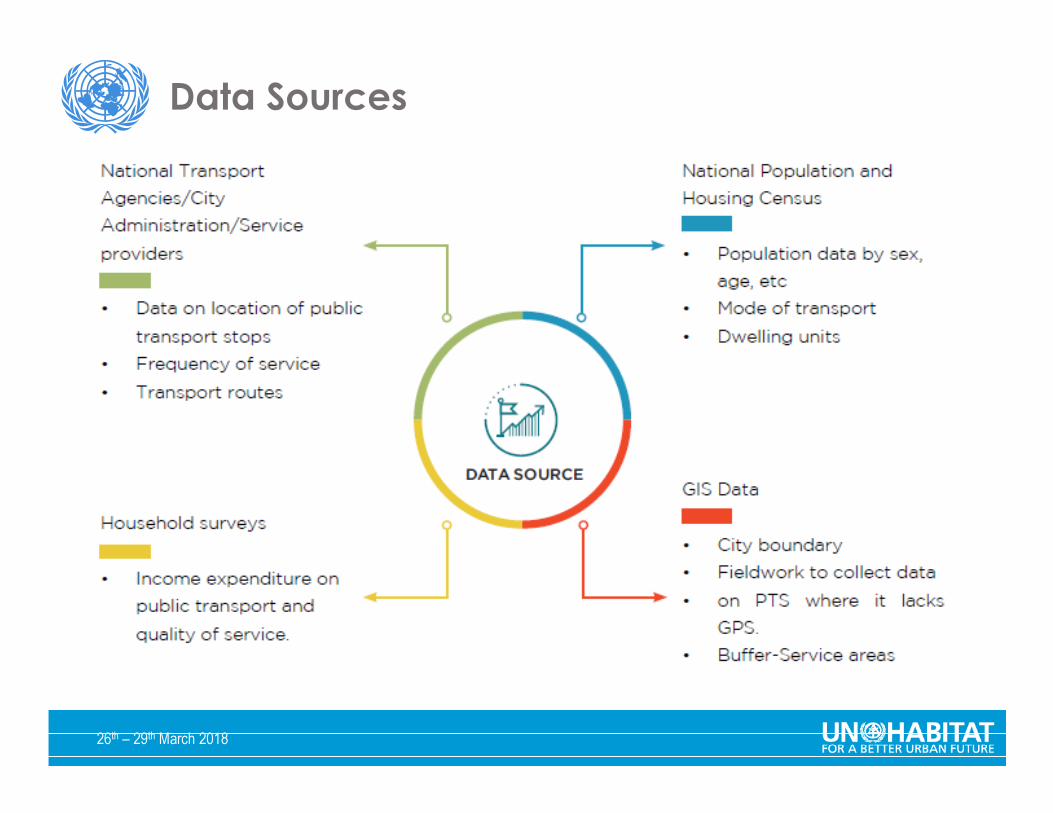
Data Sources

26th – 29th March 2018
1
Spatial Analysis
to delimit the
built-up area of
the urban
agglomeration
2
Inventory of
public transport
stops in the city/
service area
5
Estimation of
urban area with
access to public
transport/ out of
total population
Methodology
3
Buffer Analysis of
0.5 km public stop
(“service area”)
4
Overlay of socio-
demographic data
5
Estimation of
urban area with
access to public
transport/ out of
total population
26th – 29th March 2018
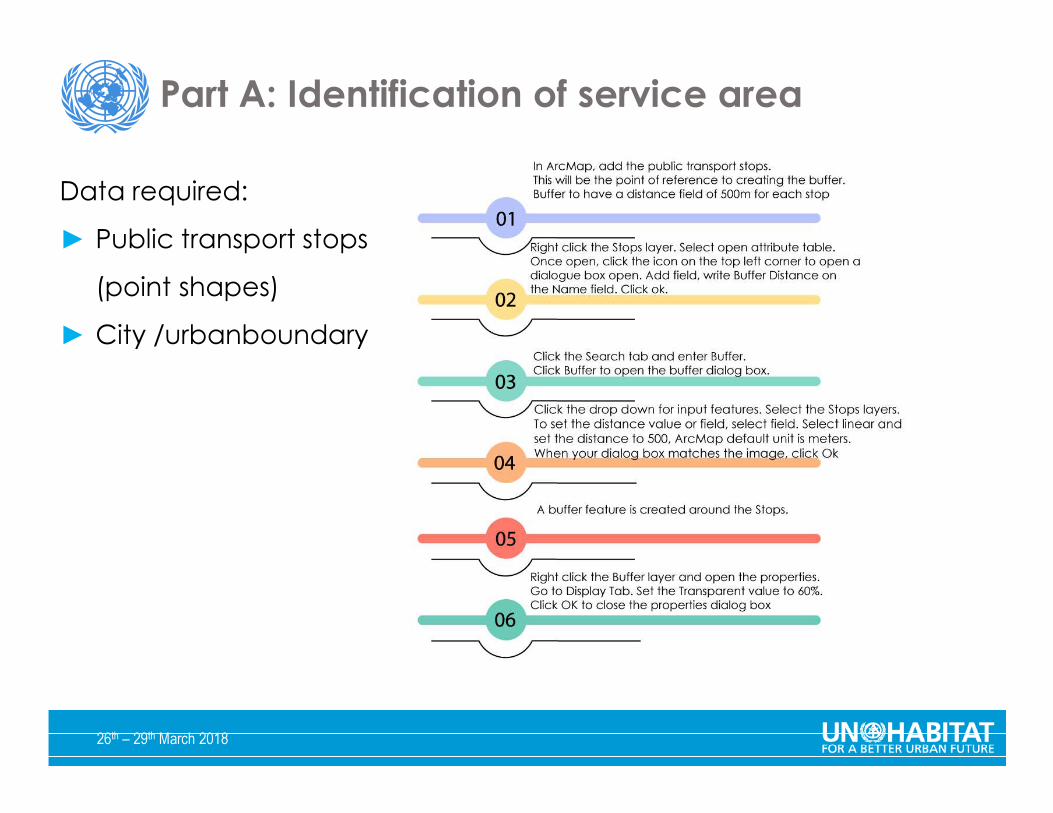
Part A: Identification of service area
Data required:
► Public transport stops
(point shapes)
► City /urbanboundary
26th – 29th March 2018
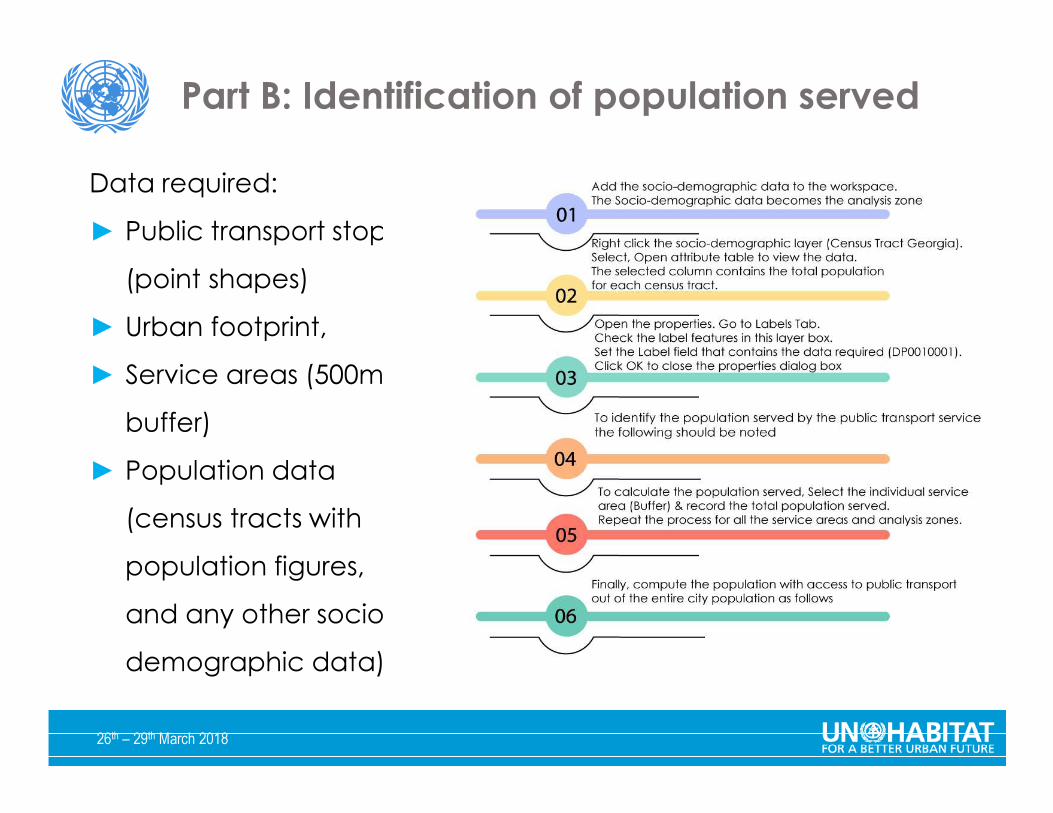
Part B: Identification of population served
Data required:
► Public transport stops
(point shapes)
► Urban footprint,
► Service areas (500m
buffer)
► Population data
(census tracts with
population figures,
and any other socio-
demographic data).

26th – 29th March 2018
% ���ℎ ������ �� ���� � ���� � = 100��������� ���ℎ ���������� ������ �� ���� � ���� �
���� ��������
Population with access to public transport out of the entire city
population computed as
Computation of the Indicator
To identify the population served the following is observed;The service area-(buffer) (denoted as i) intersects, either fully or partially, with
more than one analysis zone j ( j=1…..n). The population served by the public
transport service in buffer i, Pi, is thus equal to the sum of the population in each of the intersecting areas, Pij . Hence
�� = �����
���
Where, Pij is estimated based on the amount of interaction between service buffer i and analysis zone j.
In estimating Pij we will assume that the population is uniformly distributed within the analysis zones.

26th – 29th March 2018
The total population served by Union Bus
terminal buffer is
i= Union Bus terminal
Pij= 5795+3648
Total 9443
Service
Buffer
Population Served
TotalIntersect
1
Intersect
2
Intersect
3
Intersect
4
Intersect
5
Intersect
6
1 2376 3574 2000 2802 10,752
2 3574 4052 5361 4433 2444 19,864
3 1590 3991 3228 2434 11,243
4 3176 3187 3228 3991 13,582
5 5795 3648 9,443
6 5361 5795 11,156
7 5795 2275 3552 3648 15,270
8 4774 3007 4232 12,013
9 3975 4379 5051 13,405
10 3200 4561 3486 11,247
11 5177 3932 3975 13,084
12 5022 5371 7712 18,105
Total Population with convenient access to public transport 159,164
Total Population with convenient access to public transport= 159, 164
County Population= 691,893/km2
% ���ℎ ������ �� ���� � ���� �=
159,164
691,893�100
% ���ℎ ������ �� ���� � ���� � = 23%

26th – 29th March 2018
General Observations
Limitations
• Convenience measured as distance does not illustrate quality of PT
1413-15 December
Gaborone, Botswana
You might be 0.5 km away from the nearest bus stop, but…

26th – 29th March 2018
Convenient access?
Accessibility for customers with special needs
(physically, visually, hearing impaired, temporary
mobility constraints, elderly, children, people in
vulnerable situations)
Affordability for the urban poor
Frequency of service during peak travel time
Safety concerns at bus stop
26th – 29th March 2018
Limitations
• Factors such as affordability, safety & universal accessibility may influence the usage of public means of transport.
• Disaggregation difficult
• Poor connection of- to the sustainable notion of transport
• Access to opportunities might be more informative

26th – 29th March 2018
Indicator review
The transport community believes that the current definition excludes some factors…
EGM held on
19-20 Oct 2017 in
Berlin

26th – 29th March 2018
Definition of Public Transport (Inter-agency Expert Group on SDG Indicators, UN Statistics)
“It excludes informal, unregulated
modes of transport (paratransit),
motorcycle taxis, three-wheelers,
etc.”
“The access to public transport is
considered convenient when an
officially recognized stop is
accessible within a distance of 0.5
km.”
Does that mean that Dar es Salaam can report …
… while Nairobi can not…?
Formal vs. Informal Public Transport
As per the current definition:

26th – 29th March 2018
• The EGM made the following proposals currently under review ………

26th – 29th March 2018
a) Service Area
Buffer: Proximity Network analysis: walking distance
(based on street network)
• Realistically configure the street network to recognize the
presence of any barriers to PT.
Proposal
• Longer distances for faster modes:1 km
Cycling Access: 2 km

26th – 29th March 2018
Public Transit Access; An example
Log in from the ArcGIS Maps ribbon to Unlock Map.

26th – 29th March 2018
• Alternatives definitions of convenient access: To include longer distance for reaching faster transit modes (1-2km)
• Use of travel time to additionally measure convenient access to places of opportunity such as workplaces, schools, hospitals etc
• Obstacles to reaching stations: distance to stations could be adjusted taking into account factors that create obstacles.
• Transit system performance: Address the performance parameters such as frequency, capacity, safety/security etc.
• Affordability: Measured as the % of household income of lowest quintile of population spent on transport.
• Modal shift to sustainable transport: Modal share (such as NMT,) measures transport contribution to carbon emissions and air quality issues (indicator 11.6.2).
b) Sub-indicators

26th – 29th March 2018
Opportunities
• Innovative Technologies/ Apps are available to collect basic data
OpenTripPlannerAnalyst (OTPA) Accessibility Tool. Developed by World Bank and Conveyal (http://Conveyal.com)� This open-source web-
based tool allows us to
combine the spatial
distribution of the city (for
example, jobs or schools),
the transportation network
and an individual’s travel
behavior to calculate the
ease with which an
individual can access
opportunities.
https://www.whereismytransport.com/
DATA For ALL public transport modes.
• Routes: shapes,
names
• Stopping points:
location, names
• Boarding and
alighting numbers
• Fares and variations
• Frequencies: AM
peak, off peak, PM
peak, weekends,
holidays, nights
• Travel times
Data collected

26th – 29th March 2018
Possible Collaboration in Tracking SDG 11.2.1
Partnerships will be essential!As data providers, for capacity building, reporting, analysis of data etc.
And others…
Nat. and Loc. GvtsOwnership(Line ministries and NSOs,
National Statistical Structures, cities,
transport provider )
Custodian Agency

26th – 29th March 2018
1 DATA• What Transport Data do you currently collect in urban areas?• What challenges do you anticipate in collecting SDG 11.2?
2 NATIONAL STRUCTURES• What mechanisms do you have in place in your country for SDG 11.2? • What partnership arrangements do you foresee in your country, e.g. city, transport service providers, NGOs etc?• What challenges do you foresee?
3 REPORTING• How will you compile and validate the data?• How will you report? What are the challenges you foresee?
4 EXTERNAL SUPPORT• What role do you foresee of the partners?• Who do you seek support from? How can we help?

26th – 29th March 2018

26th – 29th March 2018 27