regional regression equations for estimation of natural ... · department of transportation,...
TRANSCRIPT
Scientific Investigations Report 2009−5136
U.S. Department of the InteriorU.S. Geological Survey
Prepared in cooperation with the Colorado Water Conservation Board and the Colorado Department of Transportation
Regional Regression Equations for Estimation of Natural Streamflow Statistics in Colorado
Spine. Width varies. Printer is to determine final width and adjust spine and covers.
Spine. Width varies. Printer is to determine final width and adjust spine and covers.
Front cover 8-1/2" 11"

COVER: Arkansas River near Buena Vista, Colorado.Photograph by Michael Lewis, U.S. Geological Survey.

Regional Regression Equations for Estimation of Natural Streamflow Statistics in Colorado
By Joseph P. Capesius and Verlin C. Stephens
Prepared in cooperation with the Colorado Water Conservation Board and the Colorado Department of Transportation
Scientific Investigations Report 2009–5136
U.S. Department of the InteriorU.S. Geological Survey

U.S. Department of the InteriorKEN SALAZAR, Secretary
U.S. Geological SurveySuzette M. Kimball, Acting Director
U.S. Geological Survey, Reston, Virginia: 2009
For more information on the USGS—the Federal source for science about the Earth, its natural and living resources, natural hazards, and the environment, visit http://www.usgs.gov or call 1-888-ASK-USGS
For an overview of USGS information products, including maps, imagery, and publications, visit http://www.usgs.gov/pubprod
To order this and other USGS information products, visit http://store.usgs.gov
Any use of trade, product, or firm names is for descriptive purposes only and does not imply endorsement by the U.S. Government.
Although this report is in the public domain, permission must be secured from the individual copyright owners to reproduce any copyrighted materials contained within this report.
Suggested citation:Capesius, J.P., and Stephens, V.C., 2009, Regional regression equations for estimation of natural streamflow statistics in Colorado: U.S. Geological Survey Scientific Investigations Report 2009–5136, 46 p.
Library of Congress Cataloging-in-Publication Data
Capesius, Joseph P. Regional regression equations for estimation of natural streamflowstatistics in Colorado / by Joseph P. Capesius and Verlin C. Stephens p. cm. -- (Scientific investigations report ; 2009-5136) “Prepared in cooperation with the Colorado Water Conservation Board and theColorado Department of Transportation.” Includes bibliographic references. ISBN 978-1-4113-2562-3 1. Stream measurements--Colorado. 2. Streamflow--Colorado. 3. Regression analysis. I. Stephens, Verlin C. II. Geological Survey (U.S.) III. Colorado Water Conservation Board. IV. Colorado Dept. of Transportation. V. Title. VI. Series: Scientific investigations report ; 2009-5136. GB1225.C6C36 2009 551.48’309788021--dc22 2009039729

iii
ContentsAbstract ...........................................................................................................................................................1Introduction.....................................................................................................................................................1
Purpose and Scope ..............................................................................................................................1Description of Study Area ...................................................................................................................3Previous Studies ...................................................................................................................................3
Regional Regression Equations for Estimation of Natural Streamflow Statistics in Colorado .........4Definition of Hydrologic Regions of Colorado ..................................................................................4Selection of Stations ............................................................................................................................4
Selection of Stations for Peak-Streamflow Statistics ...........................................................4Selection of Stations for Other Streamflow Statistics .........................................................15
Computation of Streamflow Statistics and Basin and Climatic Characteristics ......................15Peak-Streamflow Frequency ...................................................................................................15Annual- and Monthly-Mean Streamflow and Flow-Duration Curves ...............................15Minimum and Maximum 7-Day Streamflow ..........................................................................15Basin and Climatic Characteristics ........................................................................................16
Computation of Regional Regression Equations ...........................................................................17Generalized Least-Squares Regression ................................................................................17Weighted Least-Squares Regression .....................................................................................18Discussion of Selection of Variables ......................................................................................18
Application and Limitations of Regional Regression Equations .................................................19Summary........................................................................................................................................................28Acknowledgments .......................................................................................................................................29Selected References ...................................................................................................................................29Supplemental Information ..........................................................................................................................33
Figures 1. Boundaries of hydrologic regions and locations of streamflow gaging
stations in Colorado and adjacent States .................................................................................2 2. Summary of variables and regression diagnostics for regional equations ......................18 3. Regional regression equations for the Mountain hydrologic region .................................20 4. Regional regression equations for the Northwest hydrologic region ...............................22 5. Regional regression equations for the Rio Grande hydrologic region ..............................24 6. Regional regression equations for the Southwest hydrologic region ...............................26 7. Regional regression equations for the Plains hydrologic region .......................................28
Tables 1. Drainage-basin and climatic characteristics at streamflow-gaging
stations used for regional regression analysis ........................................................................5 2. Basin and climatic characteristics evaluated for use in regional
regression equations .................................................................................................................16 3. Sources of data used to compute basin and climatic characteristics ..............................17 4. Streamflow-gaging stations used in the development of the regional
streamflow regression equations ............................................................................................35

iv
Conversion Factors and DatumInch/Pound to SI
Multiply By To obtainLength
inch (in.) 2.54 centimeter (cm)inch (in.) 25.4 millimeter (mm)foot (ft) 0.3048 meter (m)mile (mi) 1.609 kilometer (km)
Areasquare mile (mi2) 259.0 hectare (ha)square mile (mi2) 2.590 square kilometer (km2)
Flow rateacre-foot per day (acre-ft/d) 0.01427 cubic meter per second (m3/s)acre-foot per year (acre-ft/yr) 1,233 cubic meter per year (m3/yr)acre-foot per year (acre-ft/yr) 0.001233 cubic hectometer per year (hm3/yr)cubic foot per second (ft3/s) 0.02832 cubic meter per second (m3/s)
Vertical coordinate information is referenced to the North American Vertical Datum of 1988 (NAVD 88).
Horizontal coordinate information is referenced to the North American Datum.

AbstractThe U.S. Geological Survey (USGS), in cooperation
with the Colorado Water Conservation Board and the Colorado Department of Transportation, developed regional regression equations for estimation of various streamflow statistics that are representative of natural streamflow conditions at ungaged sites in Colorado. The equations define the statistical relations between streamflow statistics (response variables) and basin and climatic characteristics (predictor variables). The equations were devel-oped using generalized least-squares and weighted least-squares multilinear regression reliant on logarithmic variable transforma-tion. Streamflow statistics were derived from at least 10 years of streamflow data through about 2007 from selected USGS streamflow-gaging stations in the study area that are representa-tive of natural-flow conditions. Basin and climatic characteristics used for equation development are drainage area, mean water-shed elevation, mean watershed slope, percentage of drainage area above 7,500 feet of elevation, mean annual precipitation, and 6-hour, 100-year precipitation. For each of five hydrologic regions in Colorado, peak-streamflow equations that are based on peak-streamflow data from selected stations are presented for the 2-, 5-, 10-, 25-, 50-, 100-, 200-, and 500-year instantaneous-peak streamflows. For four of the five hydrologic regions, equations based on daily-mean streamflow data from selected stations are presented for 7-day minimum 2-, 10-, and 50-year streamflows and for 7-day maximum 2-, 10-, and 50-year streamflows. Other equations presented for the same four hydrologic regions include those for estimation of annual- and monthly-mean streamflow and streamflow-duration statistics for exceedances of 10, 25, 50, 75, and 90 percent. All equations are reported along with salient diagnostic statistics, ranges of basin and climatic characteristics on which each equation is based, and commentary of potential bias, which is not otherwise removed by log-transformation of the variables of the equations from interpretation of residual plots. The predictor-variable ranges can be used to assess equation applicability for ungaged sites in Colorado.
IntroductionThe U.S. Geological Survey (USGS), in coopera-
tion with the Colorado Water Conservation Board and the Colorado Department of Transportation, developed regional regression equations for estimation of various streamflow
statistics that are representative of natural streamflow condi-tions in Colorado. Accurate estimates of various streamflow statistics are important for water-resource management, stream-related structural design, stream-hazard identifica-tion, and water-quality management. Streamflow statistics routinely are needed for ungaged watersheds that lack nearby streamflow-gaging stations (stations) from which streamflow statistics could be directly computed. Regional regression equations are a common tool used to estimate streamflow statistics at ungaged sites across the Nation and Colorado.
Regional regression equations are based on statistical relations between (1) streamflow statistics of interest computed from applicable records of the stations and (2) basin and climatic characteristics, for which data are typically readily available. The use of regional equations, along with expressions of predic-tive uncertainty, generally represents a reliable and cost-effective means for estimating streamflow statistics at ungaged sites.
Purpose and Scope
The purpose of this report is to present regional regression equations, by hydrologic region, for estimation of streamflow statistics for naturally flowing streams in Colorado (fig. 1). The equations were developed using the statistical relations between streamflow statistics (response variables) and basin and climatic characteristics (predictor variables). The current (2009) study updates or refines the equations provided by Kircher and others (1985) and Vaill (1999) and uses streamflow data collected after those studies were completed. Each of these previous studies is described in the section “Previous Studies.”
For each of five hydrologic regions in Colorado, peak-streamflow equations based on peak-streamflow data from selected stations are presented for the 2-, 5-, 10-, 25-, 50-, 100-, 200-, and 500-year instantaneous-peak streamflows (peak streamflow). For four of the five hydrologic regions, minimum and maximum 7-day streamflow (7-day, T-year) equations based on daily-mean streamflow data from selected stations are presented for 7-day minimum 2-, 10-, and 50-year streamflows as well as for 7-day maximum 2-, 10-, and 50-year streamflows. Other equations presented for the same four hydrologic regions include those for estimation of annual- and monthly-mean streamflow and streamflow-duration statistics for exceedances of 10, 25, 50, 75, and 90 percent. The streamflow-duration statistics collectively are referred to as the “flow-duration curve.” The flow-duration values, presented in this report as
Regional Regression Equations for Estimation of Natural Streamflow Statistics in Colorado
By Joseph P. Capesius and Verlin C. Stephens

2 Regional Regression Equations for Estimation of Natural Streamflow Statistics in Colorado
Figure 1. Boundaries of hydrologic regions and locations of streamflow gaging stations in Colorado and adjacent States.
Q10th, Q25th, Q50th, Q75th, and Q90th, indicate the percentage of days that a given daily-mean streamflow is exceeded. For example, a 10-percent flow-duration value (Q10th) is calculated as the daily-mean streamflow at a given station that is exceeded 10 percent of the time or 10 percent of the days. Finally, this report also describes some limitations associated with the equa-tions, which includes an assessment of prediction errors and assessment of equation applicability for ungaged sites.
The study area of equation applicability is limited to Colorado, even though the study area was extended to include stations within a 50-mile boundary or buffer surrounding Colorado. The study area was extended 50 miles beyond the Colorado for the sole purpose of equation development.
The regional equations for peak-streamflow estimation were developed using annual peak-streamflow data collected through water year 2006 (October 1, 2005, through September 30, 2006). The remaining equations, with the exception of the 7-day, T-year minimum streamflow equations, were developed with data through water year 2007. The 7-day, T-year minimum streamflow equations were developed with data collected through climate year 2007 (April 1, 2006, through March 31, 2007). The choice of climate year in lieu of water year explicitly was made because the climate year designation splits the daily-mean streamflow record at a time (spring) in which streamflows for a given station gener-ally are larger than at the water year (autumn) or even calendar year transition.
36°
38°
40°
110° 108° 106° 104° 102°
COLORADO
WYOMING
NEBRASKA
KANSAS
UTAH
ARIZONA
NEW MEXICO
TEXAS
OKLAHOMA
Denver
White River
Gre
en R
iver
Colora
do River
Color
ado Rive
r
San Juan River
Anim
as
Rive
r
Ladder C reek
Republican River
Arikaree River
Arkansas River
Platte RiverCache La Poudre River
H uerfano Rive
r
North Platte River
Gunnison River
North Platte River
Purgato
ire R
iver
Rio Grande
S a n Ju
an R
Pied
ro Ri
ver
Yampa River
South Platte
River
Gre
enRi
ve
r
Dolores River
MountainRegion
PlainsRegion
NorthwestRegion
Rio GrandeRegion
SouthwestRegion
Base from U.S. Geological Survey digital data, 2005, 1:2,000,000Colorado State Plane Central projection
0 50 100 MILES
0 50 100 KILOMETERS
EXPLANATIONStreamflow-gaging station
Continental Divide
Hydrologic regional boundaries

Introduction 3
The study is limited by type of statistical procedures used to define the relation between streamflow statistics and basin and climate characteristics. These procedures included generalized least-square and weighted least-square, multilinear regression based on base-10 logarithmic transfor-mations of all included variables. The authors recognize that other transformations of variables could be used.
The study was limited to the use of several selected basin and climatic characteristics described in the section “Basin and Climatic Characteristics.” These characteris-tics are drainage area; mean watershed slope; mean annual precipitation; mean watershed elevation; 6-hour, 100-year precipitation; and percentage of drainage area above 7,500 feet of elevation.
The equations reported here, as well as equations in all the studies referenced, are or were scoped to estimate natural streamflow statistics for ungaged sites. To clarify, the equations are based on analysis of streamflow data representing stream-flow conditions relatively unaffected by anthropogenic influ-ences such as regulation and diversion or return flows such as from a municipality or mining operation, or urban development in a basin. Kircher and others (1985) provide the most quantita-tive description of natural streamflow. Those authors defined natural streamflow as streamflow from drainage basins rela-tively unaffected by urban development or water-management activities such as substantial reservoir storage, streamflow diversions, or return flows of previously diverted streamflow. Further, those authors defined natural streamflow as streamflow having less than about 10 percent of the mean-annual stream-flow volume at the station affected by anthropogenic activity. The definition by Kircher and others (1985) was used in the current (2009) study. Also, the selection of stations used for the current (2009) study was influenced by those stations selected by Kircher and others (1985), Vaill (1999), and the authors’ general knowledge of hydrologic systems in Colorado.
Description of Study Area
Colorado has a varied and diverse terrain and climate. The State lies within the headwaters of the major river basins of the Colorado River, Missouri River, Rio Grande, and Arkansas River. The geographic variation in Colorado is well characterized by three major physiographic provinces, which trend north to south across the State (Fenneman, 1931).
Encompassing about 40 percent of Colorado on the east, the Great Plains Province is characterized by rolling grasslands broken by occasional hills and bluffs and shallow river val-leys. Elevations in the Great Plains range from near 3,500 feet at the eastern border of Colorado to about 6,000 feet in the foothills of the Rocky Mountains at the western edge of the province. The Great Plains have low relative humidity, plenti-ful sunshine, limited precipitation, substantial and persistent wind, and substantial diurnal variability in air temperatures. Annual temperature extremes generally range from –10 to
–15o Fahrenheit in winter to about 100o Fahrenheit in sum-mer. Most precipitation occurs as rain during April through September, largely in the form of thunderstorms. Mean annual precipitation in the Great Plains ranges from 9 to 18 inches per year (Colorado State University, 2008). Precipitation tends to decrease from the eastern border of the Great Plains to a mini-mum near the foothills at which point it increases rapidly with the increase in elevation of the foothills (Western Regional Climate Center, 2008).
Encompassing central Colorado from north to south, the Southern Rocky Mountains Province lies west of the Great Plains and is characterized by several mountain ranges. Elevations range from about 6,000 feet to more than 14,000 feet. The mountain ranges are characteristically separated by steep valleys and high intermontane parks. The climate of the Southern Rocky Mountains is strongly affected by differences in eleva-tion. Wide variations occur within short distances. Similarly, temperature varies with elevation and decreases with increased elevation (Colorado Geological Survey, 2003; Colorado State University, 2008; Western Regional Climate Center, 2008). Mean annual precipitation is dominated by snowfall and increases with elevation from about 10 inches per year to more than 60 inches per year. Snowfall tends to be associated with eastern-moving winter storms, which originate from the Pacific Ocean and tend to produce more snow on the windward side of the mountain ranges than on the leeward.
Encompassing much of the western quarter of Colorado from north to south, the Colorado Plateaus Province is located between the Utah border to the west and the Southern Rocky Mountains to the east. The terrain is characterized by mesas and plateaus separated by steep and rugged canyons. Like the Great Plains, the Colorado Plateaus Province has low relative humidity, plentiful sunshine, limited precipitation, and substantial and persistent wind. Climatic variability is extreme over relatively short distances because of the microclimates created by the highly irregular landscape. Below 9,000 feet in elevation, mean annual precipitation ranges from 9 to 18 inches per year, whereas, high elevations (above 9,000 feet) receive in excess of 32 inches per year. Snowfall is a sub-stantial component of annual precipitation at high elevations. However, intense summer thunderstorms can account for 20 to 40 percent of the annual precipitation (Robson and Banta, 1995; Colorado Geological Survey, 2003; Colorado State University, 2008).
Previous Studies
Many reports document regression equations developed for estimating streamflow statistics in Colorado. Patterson (1964 and 1965), Patterson and Somers (1966), and Matthai (1968) developed regression equations for major river basins in Colorado. Headman and others (1972) developed equa-tions for streamflow statistics based on channel geometry. The first statewide regional regression study, which focused on peak streamflow, was conducted by McCain and Jarrett

4 Regional Regression Equations for Estimation of Natural Streamflow Statistics in Colorado
(1976). The hydrologic regions, as described in the section “Definition of Hydrologic Regions of Colorado,” originally were defined by McCain and Jarrett (1976) and subsequently adopted by Kircher and others (1985). Kircher and others (1985) developed regional regression equations for a range of high- and low-streamflow characteristics for streams in western Colorado by using USGS streamflow data collected through 1983. Their study is the last regional regression study for nonpeak streamflow statistics in Colorado. Livingston and Minges (1987) developed equations for the estimation of peak streamflows for small drainage basins (less than about 20 square miles) in the Great Plains part of eastern Colorado. Vaill (1999) developed regional regression equations for peak streamflow in Colorado. Vaill (1999) used peak streamflow data collected through 1993 for his study, which represents the most recent regional regression study relative to the current (2009) study for peak streamflow. Other regional regression studies of various streamflow statistics include Waltemeyer (2006) and Thomas and others (1997); however, those studies included only parts of Colorado because of study-specific focus in bordering States.
Regional Regression Equations for Estimation of Natural Streamflow Statistics in Colorado
The development of regional regression equations for the estimation of natural streamflow statistics in Colorado is composed of four major steps:1. Definition of distinct hydrologic regions,
2. Selection of stations for inclusion in multilinear regres-sion analysis and distribution of the selected stations into their respective hydrologic regions,
3. Computation of streamflow statistics and basin and climate characteristics for the stations, and
4. Computation of the regression equations for each stream-flow characteristic for each hydrologic region as applicable.
These steps are further described in the four sections that follow.
Definition of Hydrologic Regions of Colorado
For the current study and several previous studies, five hydrologic regions were defined. These are the Mountain, Northwest, Rio Grande, Southwest, and Plains regions (fig. 1). These regions are the same as those originally defined by McCain and Jarrett (1976) and adopted by Kircher and others (1985). A hydrologic region is qualitatively defined as a region of similar hydrology and climatology.
The five hydrologic regions of Colorado were defined on the basis of the physiographic and climatic characteristics that were used to develop best-fit regression equations.
The Mountain region is identified as that region of central Colorado above about 7,500 feet in elevation located between the Colorado-Wyoming border and the Rio Grande basin. The Mountain region encompasses the headwaters of most major river basins in Colorado where the annual peak streamflow gen-erally is produced by snowmelt runoff. The Northwest region is defined as the northwestern part of Colorado below 7,500 feet and encompassing substantial areas of the Yampa, White, and Gunnison River basins. The Rio Grande region ranges in eleva-tion from about 5,000 feet near the Colorado–New Mexico border to more than 14,000 feet in the northern parts and encompasses the Rio Grande basin. The Southwest region is defined as the region located south of the Gunnison River basin and west of the Rio Grande basin and encompasses the Dolores, Animas, and San Juan River basins. The Plains region is east of the Rocky Mountains and below 7,500 feet in the South Platte River basin and below 9,000 feet in the Arkansas River basin.
Selection of Stations
Various selection criteria were used to develop the list of selected stations for regression analysis reported here. This sec-tion details the selection criteria used.
Selection of Stations for Peak- Streamflow Statistics
A comprehensive list of all USGS streamflow stations within 50 miles of the Colorado border was acquired from the National Water Information System (NWIS) database (U.S. Geological Survey, 2008). From the comprehensive list of candidate stations, those stations with at least 10 years of streamflow record identified as representative of natural streamflow conditions were selected for this study.
Subsequently, multiple stations on the same stream course were evaluated for data similarity as judged by rela-tive drainage-area magnitude. If the relative drainage-area magnitude was less than a factor of 2.5, data were considered similar. In such cases, stations with the longer applicable record were selected. The reason for excluding stations on the basis of relative drainage-area and stream-course equality enhances the quantity of independent streamflow information (as represented by stations and their respective data). This exclusion process was used in Vaill (1999) and serves the purpose of removing redundant data or hydrologic information from the data base. At the completion of the selection process, 422 stations were identified, with a combined total of 13,054 years of record, and were used in the development of peak-streamflow equations. A map showing the location of the stations is provided in figure 1, and each station, ancillary information, and basin and climatic characteristics are listed in table 1. The “home page” of each station can be accessed online at http://waterdata.usgs.gov/nwis/nwisman/?site_no=STATION&agency_cd=USGS, where the word STATION is replaced by the eight-digit station number. The home pages provide authoritative station names and other identifying characteristics.

Regional Regression Equations for Estimation of N
atural Streamflow
Statistics in Colorado
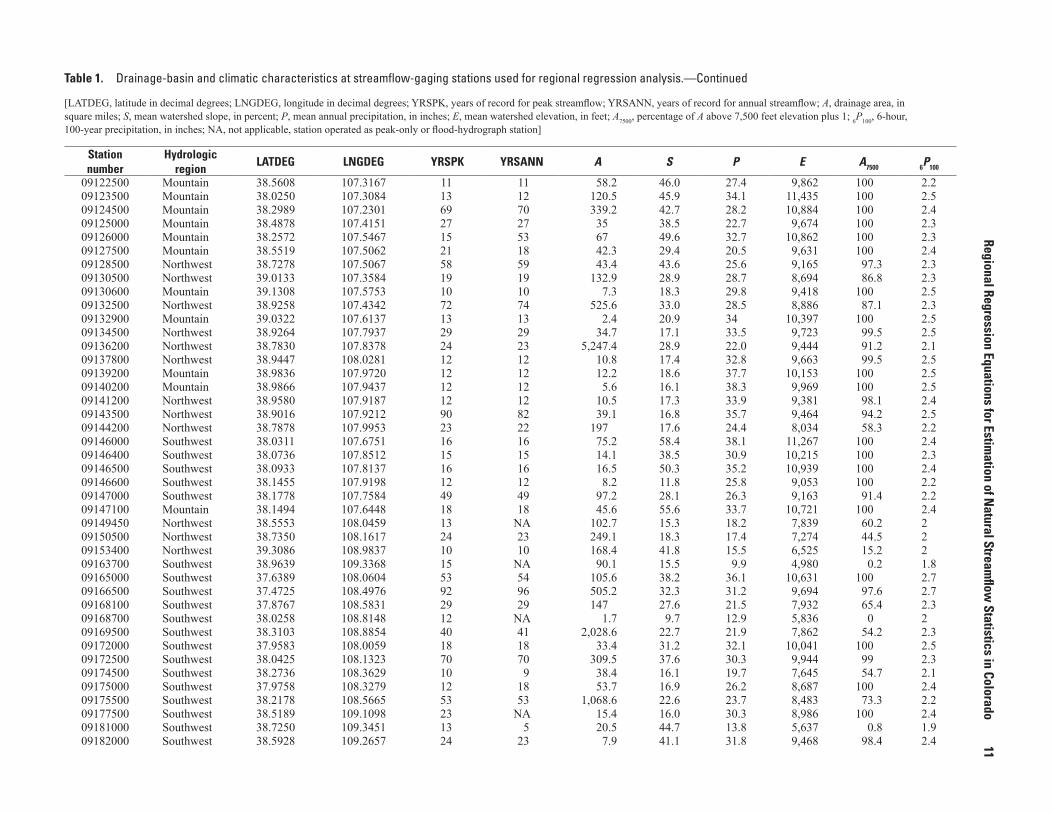
5Table 1. Drainage-basin and climatic characteristics at streamflow-gaging stations used for regional regression analysis.—Continued
[LATDEG, latitude in decimal degrees; LNGDEG, longitude in decimal degrees; YRSPK, years of record for peak streamflow; YRSANN, years of record for annual streamflow; A, drainage area, in square miles; S, mean watershed slope, in percent; P, mean annual precipitation, in inches; E, mean watershed elevation, in feet; A7500, percentage of A above 7,500 feet elevation plus 1; 6P100, 6-hour, 100-year precipitation, in inches; NA, not applicable, station operated as peak-only or flood-hydrograph station]
Station number
Hydrologic region
LATDEG LNGDEG YRSPK YRSANN A S P E A7500 6P100
06614800 Mountain 40.4961 105.8650 33 34 1.5 43.2 47.1 11,246 100 2.406616000 Mountain 40.5494 106.0211 32 32 20.5 25.7 30.9 9,794 100 2.106617100 Mountain 40.7411 106.2795 25 24 182.1 16.8 24.4 9,275 100 1.906618500 Mountain 40.7264 106.2906 25 24 255.4 13.7 20.5 8,994 100 1.906619000 Mountain 40.8616 106.3372 11 10 475.9 14.1 21.3 9,027 100 1.906620400 Mountain 41.1833 106.2700 10 NA 22.1 8.9 31.7 9,726 100 2.106621000 Mountain 41.0811 106.3075 26 25 118.1 12.8 23.5 9,118 100 206622000 Mountain 41.0500 106.5256 12 NA 107 21.7 30.4 9,168 100 2.106622500 Mountain 41.2083 106.5173 14 13 59.8 22.6 35.5 9,484 100 2.106622700 Mountain 41.3702 106.5206 47 47 38.1 18.5 35.3 9,403 100 2.106623800 Mountain 41.0236 106.8248 42 43 65.8 23.2 44.3 9,457 100 2.306624500 Mountain 41.2139 106.7784 18 15 201.5 24.3 39.5 9,048 97.8 2.206627500 Northwest 41.4000 107.0006 10 10 34 14.3 30.3 8,384 86.6 2.106629100 Northwest 41.6989 106.6267 13 NA 14.4 22.9 21.3 8,146 77.7 206630800 Mountain 41.6530 106.3453 13 NA 8.9 7.6 15.8 7,759 95.6 206631000 Northwest 41.7166 106.3172 11 9 191.4 10.9 22.4 8,319 67.7 206631100 Mountain 41.6400 106.3053 13 NA 25.5 11.5 23.4 8,483 99.2 2.106632400 Mountain 41.5852 106.2228 41 53 62.8 19.7 35.3 9,799 100 2.106696980 Mountain 39.3394 105.9117 14 8 23.7 31.6 29 11,296 100 2.806699005 Mountain 39.2869 105.6958 14 NA 230.2 18.4 20.8 10,152 100 2.406700500 Mountain 39.2089 105.3036 58 NA 92.6 33.7 29.6 10,054 98.5 2.606706000 Mountain 39.4572 105.6586 36 60 126.9 34.8 24.3 11,009 100 2.406707000 Plains 39.4089 105.1758 60 NA 475.7 31.7 25 9,464 91 2.506709500 Plains 39.4844 105.0025 41 NA 302.6 18.9 21.5 6,987 23.7 3.506710385 Mountain 39.6328 105.3367 23 NA 103.2 31.9 24.8 9,606 98.1 2.906710400 Mountain 39.6305 105.3217 14 NA 22.2 25.7 23.1 8,303 91.2 2.906710600 Plains 39.6803 105.1978 10 NA 7.6 28.2 20.3 7,207 25.2 3.406710990 Plains 39.6158 105.2322 13 NA 43.6 23.4 22.8 7,987 78 3.106711000 Plains 39.6355 105.1686 27 NA 50.2 25.1 22.4 7,826 69 3.106712000 Plains 39.3558 104.7633 67 NA 167.9 7.3 20.6 7,093 8.2 3.506716500 Mountain 39.7658 105.6261 49 53 146.6 44.5 27.1 11,182 100 2.406717400 Mountain 39.7164 105.5714 12 5 43.7 36.9 25 10,642 100 2.506719500 Plains 39.7505 105.2489 62 NA 392.3 39.2 24.4 9,962 94.4 2.606721500 Mountain 40.2189 105.5283 15 16 32.5 40.8 38.2 10,825 100 2.806722500 Mountain 40.0908 105.5144 24 24 13.4 33.6 38.3 11,119 100 2.806723000 Mountain 40.1667 105.4444 19 5 27.8 37.3 31.4 9,959 100 2.906725500 Mountain 39.9617 105.5044 51 87 36.5 35.3 33.2 10,345 100 2.806726900 Plains 40.0117 105.3486 12 NA 3.9 24.6 20.6 7,294 34.6 306729000 Mountain 39.9147 105.5019 7 10 43.6 32.8 30.9 10,174 100 2.806730300 Plains 39.8778 105.2772 24 NA 15.2 36.4 23.5 8,255 89.3 3.106732000 Mountain 40.3453 105.5856 18 18 24.6 45.0 40.8 10,503 100 2.606739500 Plains 40.4539 105.1989 9 NA 134.1 29.9 20.4 7,421 46.2 3.306748200 Mountain 40.5516 105.6269 13 13 3.6 44.3 24.8 11,027 100 2.9

6
Regional Regression Equations for Estimation of N
atural Streamflow
Statistics in ColoradoTable 1. Drainage-basin and climatic characteristics at streamflow-gaging stations used for regional regression analysis.—Continued
[LATDEG, latitude in decimal degrees; LNGDEG, longitude in decimal degrees; YRSPK, years of record for peak streamflow; YRSANN, years of record for annual streamflow; A, drainage area, in square miles; S, mean watershed slope, in percent; P, mean annual precipitation, in inches; E, mean watershed elevation, in feet; A7500, percentage of A above 7,500 feet elevation plus 1; 6P100, 6-hour, 100-year precipitation, in inches; NA, not applicable, station operated as peak-only or flood-hydrograph station]
Station number
Hydrologic region
LATDEG LNGDEG YRSPK YRSANN A S P E A7500 6P100
06748510 Mountain 40.6386 105.6617 13 13 0.9 22.4 24 10,878 100 2.806748530 Mountain 40.6230 105.5650 13 13 12.4 26.7 20 9,833 100 2.806748600 Mountain 40.6469 105.4936 23 23 92.6 28.9 21.3 9,866 100 2.806755000 Plains 41.1264 105.1944 35 21 13.5 10.4 18.9 7,808 89.6 306758200 Plains 39.3372 104.4755 10 NA 115.4 7.0 19.8 7,002 5.6 3.506758250 Plains 39.6130 104.4508 10 NA 6.5 5.7 18.1 5,923 0 3.306758700 Plains 39.4925 104.1633 10 NA 2.7 9.2 17.3 5,849 0 3.306761900 Plains 41.2564 104.0811 22 NA 0.6 1.7 15.5 5,300 0 3.406762500 Plains 41.2278 103.8931 64 NA 1,216.1 4.0 15.6 5,850 3.8 3.106762600 Plains 41.3197 104.0808 25 NA 7.6 2.0 16.8 5,339 0 3.406821300 Plains 39.5200 103.4436 11 NA 6.8 2.6 16.3 5,348 0 3.706821400 Plains 39.9067 102.2694 11 NA 19.8 2.2 18.2 3,899 0 4.606823500 Plains 40.0394 101.8667 65 NA 176.8 4.3 18.3 3,654 0 4.406825500 Plains 39.5755 102.2521 26 NA 268.9 3.0 17.7 4,333 0 4.506844700 Plains 39.2853 101.4660 22 NA 85.7 1.6 19.5 3,619 0 4.406844800 Plains 39.3206 101.6329 33 NA 20.1 1.0 19.5 3,698 0 4.406858500 Plains 39.0179 101.3479 33 NA 696.2 2.5 18 3,964 0 4.607079500 Mountain 39.2597 106.3406 11 11 51.2 33.4 25.3 11,433 100 2.207081000 Mountain 39.2642 106.3409 14 11 45.7 22.8 22 10,800 100 2.207082000 Mountain 39.2697 106.3950 8 21 23.8 32.8 30.8 11,146 100 2.507083000 Mountain 39.1722 106.3892 60 61 23.5 49.0 34.5 11,955 100 2.707089000 Mountain 38.8128 106.2222 48 NA 68.5 45.8 22.2 11,380 100 2.707091000 Mountain 38.7336 106.1600 20 NA 83 47.1 22.5 11,379 100 2.707093500 Mountain 38.5214 105.9897 14 NA 211.6 36.1 18.3 10,096 98.3 2.507093775 Plains 38.4672 105.8600 23 NA 211 22.7 13.8 9,356 97.2 2.407095000 Plains 38.1861 105.4836 66 NA 320.5 19.5 21.2 9,189 100 2.707096500 Plains 38.4364 105.1914 32 NA 436.3 26.2 16.7 8,428 81.4 2.407099100 Plains 38.3742 104.9642 11 NA 213.8 27.9 20.4 8,143 51.7 3.307099230 Plains 38.4650 104.8272 28 NA 62.2 25.1 19.2 6,860 23.6 3.607105920 Plains 38.6817 104.8586 12 NA 11 48.7 24 8,832 89.1 3.607105945 Plains 38.7075 104.8466 28 NA 6.8 48.5 22.5 8,193 75.7 3.607107500 Plains 38.0517 104.7936 18 NA 171.4 28.6 22.1 7,964 52.9 3.607114000 Rio Grande 37.4200 105.0528 46 NA 53.1 35.4 27.3 9,883 100 3.307118000 Plains 37.3864 104.6658 11 NA 140.1 27.0 22 8,062 60 3.507120620 Plains 37.5547 104.0216 21 NA 15.6 6.2 14.7 5,582 0 407121500 Plains 38.0031 103.6561 41 NA 510.9 3.9 13.6 4,871 0 407124300 Plains 37.1147 104.6053 18 NA 100.1 25.5 19.5 7,366 42.7 3.907125100 Plains 37.2000 104.1941 13 NA 79.1 10.0 15.6 6,077 6.5 3.907125500 Plains 37.1684 104.1450 14 NA 162.2 13.5 18 6,642 24.7 4.107126100 Plains 37.3045 104.0155 16 NA 84.8 2.8 14 5,479 0 3.807126200 Plains 37.3456 103.9580 41 NA 161.4 2.8 14.3 5,521 0 3.807126325 Plains 37.4242 103.9202 24 NA 48.7 4.4 14.1 5,330 0 4.107126390 Plains 37.4928 103.8280 21 NA 48.6 4.6 13.9 5,161 0 4.2

Regional Regression Equations for Estimation of N
atural Streamflow
Statistics in Colorado
7Table 1. Drainage-basin and climatic characteristics at streamflow-gaging stations used for regional regression analysis.—Continued
[LATDEG, latitude in decimal degrees; LNGDEG, longitude in decimal degrees; YRSPK, years of record for peak streamflow; YRSANN, years of record for annual streamflow; A, drainage area, in square miles; S, mean watershed slope, in percent; P, mean annual precipitation, in inches; E, mean watershed elevation, in feet; A7500, percentage of A above 7,500 feet elevation plus 1; 6P100, 6-hour, 100-year precipitation, in inches; NA, not applicable, station operated as peak-only or flood-hydrograph station]
Station number
Hydrologic region
LATDEG LNGDEG YRSPK YRSANN A S P E A7500 6P100
07126415 Plains 37.5153 103.7255 23 NA 48.7 11.2 13.9 4,981 0 4.307126470 Plains 37.5439 103.6322 16 NA 421.3 8.6 15.6 5,607 0 4.507126480 Plains 37.5892 103.6483 21 NA 56.1 11.3 14.1 4,968 0 4.307133200 Plains 37.7242 102.7405 11 NA 2.4 5.2 16 4,431 0 507138600 Plains 38.5250 101.6216 39 NA 25.2 1.1 17.7 3,650 0 4.407138650 Plains 38.4811 101.4882 20 NA 500.3 1.4 17 3,858 0 4.707153500 Plains 36.9875 103.4241 33 NA 529.2 13.5 17.2 6,251 3.4 4.107154400 Plains 36.8833 103.0183 53 NA 112.2 11.8 16.7 5,087 0 4.407154650 Plains 36.8978 102.9016 22 NA 24.9 12.0 17.2 4,555 0 4.207155100 Plains 36.7722 102.8049 18 NA 10.6 1.8 17.1 4,624 0 4.207155590 Plains 37.1220 101.8979 35 NA 2,926.6 8.4 17.0 5,001 0.8 4.607155900 Plains 37.1909 101.8988 34 NA 57.1 0.6 17.3 3,669 0 4.907156010 Plains 37.2584 101.7754 15 NA 411.3 0.9 17.2 3,946 0 5.107156100 Plains 37.5000 101.7616 15 NA 584.2 1.5 17 4,411 0 5.107156220 Plains 37.6264 101.7616 32 NA 813.3 1.6 17 4,149 0 5.107156600 Plains 37.3353 101.0504 33 NA 21.5 1.7 18.6 2,983 0 4.807199000 Plains 36.7872 104.4622 40 NA 199.1 23.6 20.1 7,594 59.1 3.607201000 Plains 36.9058 104.4361 48 NA 14.6 23.8 20.9 7,608 50.8 3.907201200 Plains 36.8308 104.3333 30 NA 5.2 16.2 19 7,120 24 3.907203000 Plains 36.6817 104.7867 76 NA 295.2 23.7 20.6 8,016 70.7 3.307204000 Rio Grande 36.5539 105.2678 69 NA 78.8 26.3 21.1 9,405 100 3.307204500 Rio Grande 36.4853 105.2656 68 NA 73.2 19.4 23.6 9,151 100 307205000 Rio Grande 36.5186 105.2753 72 NA 10.5 28.1 21.7 9,405 100 3.107206400 Rio Grande 36.5264 105.1750 40 NA 7.2 48.2 25.9 9,810 100 3.307207500 Plains 36.5739 104.9461 57 NA 185.4 27.4 21.5 8,589 90.4 3.307208500 Plains 36.3725 104.9689 83 NA 60.1 24.2 26.2 9,550 97.1 3.507211000 Plains 36.3603 104.5986 75 NA 949 21.6 20.7 8,106 65.6 3.307225500 Plains 36.3259 103.9255 12 NA 268.7 6.2 17.2 6,532 2.3 4.107227295 Plains 36.3889 103.3186 42 NA 1.2 2.0 16.2 5,182 0 4.607232500 Plains 36.7214 101.4896 57 NA 2,033 3.0 17.3 4,463 0.1 4.507232650 Plains 36.5564 102.7866 12 NA 33.9 1.1 16.6 4,593 0 4.308216500 Rio Grande 37.8561 106.9275 32 31 34.2 40.5 30.6 11,473 100 2.308218500 Rio Grande 37.7519 106.8300 36 37 91.9 35.7 37.4 10,723 100 2.408219500 Rio Grande 37.6569 106.6492 80 80 210.6 31.3 38.2 10,398 100 2.708220500 Rio Grande 37.5917 106.4500 47 38 52.7 30.7 33.6 10,507 100 2.708223500 Rio Grande 37.4903 106.2595 25 23 30.7 34.6 31.8 10,356 100 2.508224500 Rio Grande 38.2203 106.0897 59 58 45.4 35.8 18.8 10,405 100 2.308227000 Rio Grande 38.1633 106.2906 87 87 516.9 22.8 20.8 9,949 100 2.108227500 Rio Grande 38.0136 105.6928 46 34 12.9 64.6 30.1 11,294 100 2.608230500 Rio Grande 37.8597 106.3195 57 39 106.2 27.6 26.5 10,056 100 2.208231000 Rio Grande 37.8133 106.3186 68 47 62.2 27.8 31.1 10,259 100 2.308236000 Rio Grande 37.3747 106.3348 54 65 107.6 33.7 38.4 10,872 100 2.6

8
Regional Regression Equations for Estimation of N
atural Streamflow
Statistics in ColoradoTable 1. Drainage-basin and climatic characteristics at streamflow-gaging stations used for regional regression analysis.—Continued
[LATDEG, latitude in decimal degrees; LNGDEG, longitude in decimal degrees; YRSPK, years of record for peak streamflow; YRSANN, years of record for annual streamflow; A, drainage area, in square miles; S, mean watershed slope, in percent; P, mean annual precipitation, in inches; E, mean watershed elevation, in feet; A7500, percentage of A above 7,500 feet elevation plus 1; 6P100, 6-hour, 100-year precipitation, in inches; NA, not applicable, station operated as peak-only or flood-hydrograph station]
Station number
Hydrologic region
LATDEG LNGDEG YRSPK YRSANN A S P E A7500 6P100
08240500 Rio Grande 37.3747 105.2950 59 48 52.7 41.2 23.2 10,492 100 2.608241500 Rio Grande 37.4250 105.4150 58 37 182.9 25.1 19.4 9,169 100 2.508242500 Rio Grande 37.4472 105.4258 67 67 40.2 32.5 22.3 10,152 100 2.708245500 Rio Grande 37.3539 106.5250 14 17 44.2 35.0 45 11,218 100 2.908246500 Rio Grande 37.0539 106.1875 43 97 281.6 27.8 35.3 10,481 100 2.508247500 Rio Grande 36.9931 106.0386 82 67 115.7 14.6 25.2 9,353 100 3.408248000 Rio Grande 36.9822 106.0736 88 88 152.8 21.7 30.6 9,861 100 3.108248500 Rio Grande 37.1770 105.8781 59 59 372.9 15.2 23.5 9,192 100 2.908252500 Rio Grande 36.8983 105.2544 68 NA 25.6 23.5 26.9 10,599 100 3.308253000 Rio Grande 36.8969 105.2603 70 NA 18.5 29.9 28.7 11,023 100 3.508253500 Rio Grande 36.8842 105.2811 69 NA 2.2 39.2 29.6 11,313 100 3.508255000 Rio Grande 36.9528 105.4103 10 NA 11.2 35.0 27 10,929 100 3.608263000 Rio Grande 36.8292 105.5478 32 25 10.6 41.7 28.9 10,973 100 3.408264000 Rio Grande 36.6223 105.3895 24 14 19.2 37.6 30.2 11,077 100 3.508265000 Rio Grande 36.7034 105.5686 75 77 112.2 42.4 26.3 10,149 100 3.308267500 Rio Grande 36.5419 105.5561 70 73 37.1 55.2 28.3 10,389 100 3.308268500 Rio Grande 36.5322 105.6856 51 67 66.6 43.1 23.3 9,401 83.7 3.108269000 Rio Grande 36.4394 105.5036 72 56 63 40.2 25.1 9,608 99.8 308275000 Rio Grande 36.3756 105.5492 19 17 60.8 31.2 24.6 9,040 98.9 2.908275500 Rio Grande 36.2989 105.5817 50 52 80.4 32.7 27.7 9,352 97.7 3.308275600 Rio Grande 36.3320 105.5789 24 23 38 33.5 26.6 9,362 99.4 3.208281200 Rio Grande 36.9556 106.5367 13 NA 28.1 25.8 34.2 9,724 100 2.908284000 Rio Grande 36.6986 106.5575 24 NA 50.6 15.6 26.1 8,856 99.9 2.908284100 Rio Grande 36.6625 106.6331 51 52 475.3 20.2 30.2 9,304 94.4 2.908284500 Rio Grande 36.6681 106.7048 34 28 192.5 13.6 20 7,792 75.3 2.508286650 Rio Grande 36.3172 106.4853 33 NA 143.9 15.6 18.9 8,140 77.7 2.808288000 Rio Grande 36.3917 106.2395 33 19 48 20.2 24.6 9,157 99.9 3.208289000 Rio Grande 36.3497 106.0442 75 75 411.9 20.2 19.7 8,492 80.5 2.909012500 Mountain 40.2533 105.8114 10 8 45.8 42.5 36.8 10,680 100 2.109016500 Mountain 40.1125 105.7497 27 28 47.8 50.2 35.8 10,641 100 2.309020000 Mountain 40.1805 106.0092 19 18 109.2 29.5 25.8 9,630 100 2.109024000 Mountain 39.9000 105.7767 20 97 27.8 38.9 32.8 10,767 100 2.309026500 Mountain 39.9100 105.8783 33 73 32.8 36.3 29 10,738 100 2.209032000 Mountain 39.9500 105.7656 14 73 19.9 29.7 30.5 10,453 100 2.309032500 Mountain 39.9975 105.8236 17 26 51.1 27.0 28.7 9,973 100 2.209033000 Mountain 40.0508 105.7775 21 19 8.1 23.3 34.8 10,509 100 2.209033500 Mountain 40.0867 105.7947 10 9 11.7 29.3 26.5 9,538 100 209034000 Mountain 40.0853 105.9553 5 23 295.9 26.6 25.8 9,756 100 2.109034500 Mountain 40.0833 106.0881 28 86 823.9 29.7 26.7 9,737 100 2.109034900 Mountain 39.7603 105.9064 41 42 5.5 49.7 32.3 11,793 100 2.309035500 Mountain 39.7789 105.9283 28 50 16.4 46.0 30.7 11,559 100 2.309035700 Mountain 39.7972 106.0261 32 42 35.2 42.1 28.6 11,106 100 2.2

Regional Regression Equations for Estimation of N
atural Streamflow
Statistics in Colorado
9Table 1. Drainage-basin and climatic characteristics at streamflow-gaging stations used for regional regression analysis.—Continued
[LATDEG, latitude in decimal degrees; LNGDEG, longitude in decimal degrees; YRSPK, years of record for peak streamflow; YRSANN, years of record for annual streamflow; A, drainage area, in square miles; S, mean watershed slope, in percent; P, mean annual precipitation, in inches; E, mean watershed elevation, in feet; A7500, percentage of A above 7,500 feet elevation plus 1; 6P100, 6-hour, 100-year precipitation, in inches; NA, not applicable, station operated as peak-only or flood-hydrograph station]
Station number
Hydrologic region
LATDEG LNGDEG YRSPK YRSANN A S P E A7500 6P100
09035800 Mountain 39.8005 106.0264 41 42 8.8 37.5 28.3 10,945 100 2.209035900 Mountain 39.7958 106.0306 41 42 27.4 42.1 28.7 10,989 100 2.309036500 Mountain 39.9075 106.0172 10 10 13.9 36.8 28.2 10,526 100 2.109039000 Mountain 40.2175 106.3131 40 40 44.6 36.7 28.3 9,869 100 2.209040000 Mountain 40.1575 106.2834 37 36 75.7 30.0 23.2 9,266 100 2.209041100 Mountain 40.2405 106.3736 13 13 11.5 25.2 20.6 8,907 100 209046530 Mountain 39.4930 106.0447 10 8 11.1 34.2 28 11,034 100 2.209047000 Mountain 39.6139 106.0520 44 50 128.2 31.8 27 10,913 100 2.309047500 Mountain 39.6055 105.9431 58 58 57.8 41.9 29.8 11,497 100 2.409047700 Mountain 39.5944 105.9725 49 50 9.1 35.2 26.2 10,879 100 2.109050100 Mountain 39.5753 106.1106 49 50 92.2 35.3 29 11,238 100 2.309052400 Mountain 39.7280 106.1734 26 28 8.6 48.9 31.8 11,199 100 2.409052800 Mountain 39.7630 106.1925 27 28 14 52.8 32.5 11,029 100 2.309055000 Mountain 39.8528 106.2678 10 9 7.6 25.8 24.4 9,600 100 2.109058610 Mountain 39.7039 106.4575 33 33 3.3 28.2 28.9 10,024 100 2.209058700 Mountain 39.6983 106.4456 40 40 3 22.5 27.6 9,848 100 2.209058800 Mountain 39.7317 106.4267 38 40 3.6 28.2 29.6 10,575 100 2.409059500 Northwest 39.8000 106.5839 62 63 93.4 33.0 25.8 9,722 99.1 2.209060500 Mountain 40.0411 106.6559 28 28 47.8 18.8 29.3 9,390 100 2.209063200 Mountain 39.5222 106.3236 40 43 9.5 34.0 26.7 10,823 100 2.209063400 Mountain 39.5228 106.3361 43 44 23.8 34.2 28.1 10,721 100 2.209064500 Mountain 39.4733 106.3678 32 71 58.2 38.0 27.8 10,922 100 2.409065100 Mountain 39.5680 106.4125 46 47 34.2 47.0 30.8 11,184 100 2.309065500 Mountain 39.6258 106.2781 50 53 14.5 50.5 30.5 11,116 100 2.409066000 Mountain 39.5964 106.2650 51 53 12.5 31.7 28 10,713 100 2.309066100 Mountain 39.6400 106.2934 40 44 4.5 60.1 31.4 11,088 100 2.309066150 Mountain 39.6436 106.3025 33 41 5.3 58.0 30.6 11,074 100 2.409066200 Mountain 39.6483 106.3231 40 43 6.1 53.5 28.5 10,904 100 2.409066300 Mountain 39.6458 106.3823 42 43 5.9 36.9 25.7 10,504 100 2.309066400 Mountain 39.6828 106.4014 43 44 7.4 30.7 26.6 10,399 100 2.309066500 Mountain 39.6147 106.4400 12 12 101 40.6 27.9 10,305 100 2.209067005 Mountain 39.6317 106.5225 11 11 395.1 37.1 26.7 10,456 99.9 2.209068000 Mountain 39.5572 106.7631 22 22 71.5 39.5 26.1 9,951 99.9 2.209069500 Mountain 39.5455 106.9348 11 12 62.6 35.4 24.7 9,689 99.8 2.209070000 Mountain 39.6494 106.9537 60 61 944.6 33.6 23.1 9,481 88.3 2.109071300 Mountain 39.7166 107.3103 20 20 6.5 9.6 42.7 10,771 100 309073500 Mountain 39.1894 106.8145 13 43 107.4 42.0 28.6 11,215 100 2.409073700 Mountain 39.2139 106.6559 16 16 6.1 47.9 31.9 11,762 100 2.509073800 Mountain 39.1964 106.6900 10 10 8.6 36.7 29.9 11,439 100 2.409073900 Mountain 39.1889 106.7184 10 10 6.6 28.1 28.9 11,263 100 2.309074000 Mountain 39.2058 106.7975 43 44 42.1 34.1 28.8 10,890 100 2.309074800 Mountain 39.0875 106.8123 25 25 32.3 46.9 36.4 11,431 100 2.4

10
Regional Regression Equations for Estimation of N
atural Streamflow
Statistics in ColoradoTable 1. Drainage-basin and climatic characteristics at streamflow-gaging stations used for regional regression analysis.—Continued
[LATDEG, latitude in decimal degrees; LNGDEG, longitude in decimal degrees; YRSPK, years of record for peak streamflow; YRSANN, years of record for annual streamflow; A, drainage area, in square miles; S, mean watershed slope, in percent; P, mean annual precipitation, in inches; E, mean watershed elevation, in feet; A , percentage of A above 7,500 feet elevation plus 1; P , 6-hour, 7500 6 100100-year precipitation, in inches; NA, not applicable, station operated as peak-only or flood-hydrograph station]
Station number
Hydrologic region
LATDEG LNGDEG YRSPK YRSANN A S P E A7500 P6 100
090757000907720009077800090780000907810009078200090785000908030009081600090828000908300009084000090852000908530009085400090895000909110009091500090920000909250009093000090950000909600009096500090968000909750009097600091045000910700009110000091105000911150009112000091125000911330009113500091145000911550009117000091180000911900009122000
MountainMountainMountainMountainMountainMountainMountainMountainNorthwestMountainNorthwestMountainNorthwestNorthwestNorthwestMountainNorthwestNorthwestNorthwestNorthwestNorthwestNorthwestMountainMountainMountainMountainMountainNorthwestMountainMountainMountainMountainMountainMountainMountainMountainMountainMountainMountainMountainMountainMountain
39.123639.245539.241739.330839.358939.334239.342839.361739.232239.329739.330539.466739.605339.609139.597839.331139.531639.677839.620039.471939.566939.453339.223639.250539.236139.272239.325039.086438.860338.664438.864438.869738.824438.664438.765538.702238.541938.411738.497238.559738.521738.2914
106.9053106.5314106.5931106.6581106.5684106.5753106.6659106.8206107.2273107.3334107.2245107.0523107.4484107.4348107.4239107.5801107.7140107.6984107.7634107.8326108.1109108.3170107.8020107.8406107.6339107.8506107.8423108.1267106.5667106.8453106.9098106.9695106.8528106.8481107.0584106.9984106.9498106.4228106.7261106.6364106.9409107.1145
2599
28151639145016141518151449148
203024231337155912242420122512761226785514246818
25191941171741145216141517141344
NA15193023221259155912202597112414851225815614247018
35.318.911.588.910.77.2
42.312.4
167.327.975.430.323.815.86.2
64.263.434.9
137.17.9
141.5323.122.880.449.8
1439.35.3
127.6477.189.268.932.9
289.347.7
119.31,010
148.3425.9106.9
1,059.9339.9
60.253.448.441.048.238.037.744.049.422.130.930.438.134.940.626.523.433.532.429.034.642.220.417.417.520.636.921.527.330.940.736.837.834.232.228.629.831.226.338.324.226.4
44.336.133.231.632.631.929.526.839.53432.62735.834.128.929.920.226.122.929.421.220.231.234.330.326.730.934.126.623.938.233.63231.731.927.325.621.418.323.418.621.1
11,38411,84611,59810,97511,20410,89110,54610,10310,1669,4639,1689,4909,7169,6619,0108,7327,2438,5507,9729,4068,1347,6249,3659,7439,3518,6229,5899,862
10,92410,64710,88310,33610,80810,27210,2029,894
10,21010,2379,606
10,6199,733
10,432
10010010010010010010010097.7
10094.7
10087.690.984.697.440.791.565.594.39164.8
10099.5
10092.4
100100100100100100100100100100100100100100100100
2.42.72.62.52.52.52.52.32.32.42.32.22.72.52.32.32.12.52.22.22.122.22.42.42.32.22.42.32.22.42.32.42.32.32.12.22.22.12.22.12.2
Regional Regression Equations for Estimation of N
atural Streamflow
Statistics in Colorado
11Table 1. Drainage-basin and climatic characteristics at streamflow-gaging stations used for regional regression analysis.—Continued
[LATDEG, latitude in decimal degrees; LNGDEG, longitude in decimal degrees; YRSPK, years of record for peak streamflow; YRSANN, years of record for annual streamflow; A, drainage area, in square miles; S, mean watershed slope, in percent; P, mean annual precipitation, in inches; E, mean watershed elevation, in feet; A7500, percentage of A above 7,500 feet elevation plus 1; 6P100, 6-hour, 100-year precipitation, in inches; NA, not applicable, station operated as peak-only or flood-hydrograph station]
Station number
Hydrologic region
LATDEG LNGDEG YRSPK YRSANN A S P E A7500 6P100
09122500 Mountain 38.5608 107.3167 11 11 58.2 46.0 27.4 9,862 100 2.209123500 Mountain 38.0250 107.3084 13 12 120.5 45.9 34.1 11,435 100 2.509124500 Mountain 38.2989 107.2301 69 70 339.2 42.7 28.2 10,884 100 2.409125000 Mountain 38.4878 107.4151 27 27 35 38.5 22.7 9,674 100 2.309126000 Mountain 38.2572 107.5467 15 53 67 49.6 32.7 10,862 100 2.309127500 Mountain 38.5519 107.5062 21 18 42.3 29.4 20.5 9,631 100 2.409128500 Northwest 38.7278 107.5067 58 59 43.4 43.6 25.6 9,165 97.3 2.309130500 Northwest 39.0133 107.3584 19 19 132.9 28.9 28.7 8,694 86.8 2.309130600 Mountain 39.1308 107.5753 10 10 7.3 18.3 29.8 9,418 100 2.509132500 Northwest 38.9258 107.4342 72 74 525.6 33.0 28.5 8,886 87.1 2.309132900 Mountain 39.0322 107.6137 13 13 2.4 20.9 34 10,397 100 2.509134500 Northwest 38.9264 107.7937 29 29 34.7 17.1 33.5 9,723 99.5 2.509136200 Northwest 38.7830 107.8378 24 23 5,247.4 28.9 22.0 9,444 91.2 2.109137800 Northwest 38.9447 108.0281 12 12 10.8 17.4 32.8 9,663 99.5 2.509139200 Mountain 38.9836 107.9720 12 12 12.2 18.6 37.7 10,153 100 2.509140200 Mountain 38.9866 107.9437 12 12 5.6 16.1 38.3 9,969 100 2.509141200 Northwest 38.9580 107.9187 12 12 10.5 17.3 33.9 9,381 98.1 2.409143500 Northwest 38.9016 107.9212 90 82 39.1 16.8 35.7 9,464 94.2 2.509144200 Northwest 38.7878 107.9953 23 22 197 17.6 24.4 8,034 58.3 2.209146000 Southwest 38.0311 107.6751 16 16 75.2 58.4 38.1 11,267 100 2.409146400 Southwest 38.0736 107.8512 15 15 14.1 38.5 30.9 10,215 100 2.309146500 Southwest 38.0933 107.8137 16 16 16.5 50.3 35.2 10,939 100 2.409146600 Southwest 38.1455 107.9198 12 12 8.2 11.8 25.8 9,053 100 2.209147000 Southwest 38.1778 107.7584 49 49 97.2 28.1 26.3 9,163 91.4 2.209147100 Mountain 38.1494 107.6448 18 18 45.6 55.6 33.7 10,721 100 2.409149450 Northwest 38.5553 108.0459 13 NA 102.7 15.3 18.2 7,839 60.2 209150500 Northwest 38.7350 108.1617 24 23 249.1 18.3 17.4 7,274 44.5 209153400 Northwest 39.3086 108.9837 10 10 168.4 41.8 15.5 6,525 15.2 209163700 Southwest 38.9639 109.3368 15 NA 90.1 15.5 9.9 4,980 0.2 1.809165000 Southwest 37.6389 108.0604 53 54 105.6 38.2 36.1 10,631 100 2.709166500 Southwest 37.4725 108.4976 92 96 505.2 32.3 31.2 9,694 97.6 2.709168100 Southwest 37.8767 108.5831 29 29 147 27.6 21.5 7,932 65.4 2.309168700 Southwest 38.0258 108.8148 12 NA 1.7 9.7 12.9 5,836 0 209169500 Southwest 38.3103 108.8854 40 41 2,028.6 22.7 21.9 7,862 54.2 2.309172000 Southwest 37.9583 108.0059 18 18 33.4 31.2 32.1 10,041 100 2.509172500 Southwest 38.0425 108.1323 70 70 309.5 37.6 30.3 9,944 99 2.309174500 Southwest 38.2736 108.3629 10 9 38.4 16.1 19.7 7,645 54.7 2.109175000 Southwest 37.9758 108.3279 12 18 53.7 16.9 26.2 8,687 100 2.409175500 Southwest 38.2178 108.5665 53 53 1,068.6 22.6 23.7 8,483 73.3 2.209177500 Southwest 38.5189 109.1098 23 NA 15.4 16.0 30.3 8,986 100 2.409181000 Southwest 38.7250 109.3451 13 5 20.5 44.7 13.8 5,637 0.8 1.909182000 Southwest 38.5928 109.2657 24 23 7.9 41.1 31.8 9,468 98.4 2.4

12
Regional Regression Equations for Estimation of N
atural Streamflow
Statistics in ColoradoTable 1. Drainage-basin and climatic characteristics at streamflow-gaging stations used for regional regression analysis.—Continued
[LATDEG, latitude in decimal degrees; LNGDEG, longitude in decimal degrees; YRSPK, years of record for peak streamflow; YRSANN, years of record for annual streamflow; A, drainage area, in square miles; S, mean watershed slope, in percent; P, mean annual precipitation, in inches; E, mean watershed elevation, in feet; A7500, percentage of A above 7,500 feet elevation plus 1; 6P100, 6-hour, 100-year precipitation, in inches; NA, not applicable, station operated as peak-only or flood-hydrograph station]
Station number
Hydrologic region
LATDEG LNGDEG YRSPK YRSANN A S P E A7500 6P100
09182600 Southwest 38.9528 109.6590 15 NA 5.8 31.7 11.1 5,743 0 1.909183000 Southwest 38.6128 109.5798 31 29 163 14.8 9.6 4,807 0 1.809184000 Southwest 38.5622 109.5140 47 43 77.1 29.6 19.9 7,104 37.6 2.209185200 Southwest 38.4000 109.4507 15 NA 15.2 25.1 15 6,669 14.1 2.109185500 Southwest 38.2433 109.4401 22 21 357.9 9.7 14.2 6,586 1.8 2.109187000 Southwest 38.0625 109.5743 17 8 114.3 32.8 17.2 7,338 45.1 2.409216400 Northwest 41.5594 109.5112 16 NA 45.9 16.7 9.5 7,042 12.4 1.709216537 Northwest 41.6394 108.1293 24 NA 34.4 7.0 7.9 7,011 0.1 1.709216550 Northwest 41.6750 108.7368 21 NA 153 7.9 8.5 6,976 4.7 1.709216600 Northwest 41.4569 108.9423 22 NA 8.1 15.1 9.2 6,982 3.3 1.709216700 Northwest 41.4833 108.9673 18 NA 481.9 12.5 11.2 7,317 31 1.709216900 Northwest 41.5327 109.3810 24 NA 1.3 34.2 8.8 6,827 0 1.709224810 Northwest 41.4597 109.6229 17 NA 12.1 10.2 8.6 6,654 0 1.709224820 Northwest 41.4250 109.6160 20 NA 3.6 11.4 8.6 6,566 0 1.709224840 Northwest 41.4111 109.6021 17 NA 1.3 15.0 8.6 6,553 0 1.709224980 Northwest 41.3736 109.6451 17 NA 414.9 7.6 9.9 6,840 12.8 1.709225200 Northwest 41.1705 109.6101 20 NA 6.7 15.9 10.3 6,653 2.9 1.709225300 Northwest 41.0611 109.6188 21 NA 11.9 12.2 10.6 6,578 0 1.709229450 Northwest 41.0205 109.6801 10 NA 525.3 15.8 19.3 8,541 67.4 2.209235600 Northwest 40.7680 109.3190 35 36 24.9 19.9 20.5 8,139 100 2.609238500 Northwest 40.4080 106.7870 20 13 42.3 19.6 47.1 9,493 98.1 2.409239500 Northwest 40.4836 106.8323 99 99 567.4 21.7 31.5 8,782 86.3 2.209241000 Mountain 40.7175 106.9159 69 68 216.5 27.3 38.1 9,106 99.4 2.409244100 Northwest 40.3341 107.1392 18 18 34.5 25.2 26.3 8,292 73.6 2.109245000 Northwest 40.6697 107.2851 44 43 67.7 20.4 30.7 8,414 94.5 2.209245500 Northwest 40.6805 107.2873 15 15 21.4 22.7 31.4 8,461 89 2.209249000 Northwest 40.3125 107.3201 19 18 144.1 23.8 33.7 9,063 92.3 2.309250000 Northwest 40.1936 107.7323 34 NA 63.3 21.3 24.3 7,906 62.9 2.209251500 Northwest 40.9905 107.0442 10 10 115.4 21.0 33.5 8,707 97.8 2.309251800 Northwest 41.0425 106.9572 10 9 13 26.8 47 9,458 100 2.309253000 Northwest 40.9994 107.1434 60 60 252.7 22.4 32.8 8,546 91.6 2.309253400 Northwest 41.1322 107.0692 12 NA 12.7 24.1 48.6 9,573 100 2.309255000 Northwest 40.9825 107.3828 76 76 149.8 19.4 30.5 8,390 85.6 2.209256000 Northwest 41.0978 107.3819 38 36 332.4 15.3 26.6 7,837 74.8 2.109257000 Northwest 41.0283 107.5492 59 46 1,010.9 18.6 27.8 8,001 71.1 2.209257500 Northwest 40.8766 107.4645 10 NA 8.4 18.9 38.1 9,011 100 2.209258000 Northwest 40.9155 107.5217 39 39 24.8 18.7 28.2 8,066 70 2.109258200 Northwest 41.3400 107.6712 12 NA 51.2 7.4 13.1 6,927 3.2 1.809258900 Northwest 41.1319 107.6465 14 NA 920.5 8.7 13 6,988 11.7 1.809259500 Northwest 40.8405 107.5151 11 NA 8.5 17.6 31.4 8,405 86.4 2.109260000 Northwest 40.5486 108.4243 83 86 4,035.8 11.7 16.6 7,063 21.8 1.909263700 Northwest 40.3000 109.1340 15 NA 63.1 19.2 12.6 6,468 12 1.9

Regional Regression Equations for Estimation of N
atural Streamflow
Statistics in Colorado
13Table 1. Drainage-basin and climatic characteristics at streamflow-gaging stations used for regional regression analysis.—Continued
[LATDEG, latitude in decimal degrees; LNGDEG, longitude in decimal degrees; YRSPK, years of record for peak streamflow; YRSANN, years of record for annual streamflow; A, drainage area, in square miles; S, mean watershed slope, in percent; P, mean annual precipitation, in inches; E, mean watershed elevation, in feet; A7500, percentage of A above 7,500 feet elevation plus 1; 6P100, 6-hour, 100-year precipitation, in inches; NA, not applicable, station operated as peak-only or flood-hydrograph station]
Station number
Hydrologic region
LATDEG LNGDEG YRSPK YRSANN A S P E A7500 6P100
09263800 Northwest 40.3166 109.2173 14 NA 9.4 10.1 9.2 5,379 0 1.809264000 Northwest 40.7333 109.6785 11 11 26.6 10.1 29.2 9,929 100 2.609264500 Northwest 40.7333 109.7035 12 12 19.9 18.2 32.2 10,480 100 2.709266500 Northwest 40.5775 109.6221 94 92 101.5 20.7 27.4 9,452 96.7 2.509268000 Northwest 40.6263 109.8201 37 36 44.6 20.8 31.8 10,353 100 2.709268500 Northwest 40.6427 109.8110 44 43 8.8 24.5 30.9 10,138 100 2.709268900 Northwest 40.6594 109.7510 29 29 7.5 18.0 30.5 10,030 100 2.609269000 Northwest 40.6500 109.7618 18 17 10.4 19.1 29.5 9,832 100 2.609270500 Northwest 40.5263 109.6057 35 35 116.2 24.7 26.7 9,279 86.6 2.509271800 Northwest 40.4166 109.7507 15 NA 4.3 20.8 12.7 6,542 12.9 1.909300500 Northwest 40.3019 109.8532 28 22 544.6 21.6 23.1 8,833 66.2 2.409302450 Mountain 40.0503 107.4689 25 25 21.6 21.8 30.3 8,971 100 2.409302500 Mountain 40.0383 107.4881 12 12 59.9 25.8 37.8 9,814 100 2.509303000 Northwest 39.9875 107.6145 50 56 259.4 25.2 35.5 9,551 98 2.409303300 Mountain 39.8433 107.3348 20 20 52.2 21.5 42.1 10,585 100 2.709303320 Mountain 39.8428 107.3367 14 14 7.4 14.2 41.8 10,667 100 2.809304000 Northwest 39.9744 107.6253 46 47 176.5 27.2 36.9 9,852 97.5 2.509304500 Northwest 40.0336 107.8623 98 103 760.3 24.9 30.9 8,938 84 2.409306007 Northwest 39.8261 108.1831 25 24 177.3 32.7 19.9 7,634 57.6 2.109306036 Northwest 39.8250 108.1993 12 11 3.6 14.3 16.7 6,933 0 209306039 Northwest 39.8266 108.2076 11 11 1.2 13.8 16.4 6,744 0 209306042 Northwest 39.8336 108.2206 18 16 1.1 15.4 16.5 6,671 0 209306052 Northwest 39.8141 108.2437 11 9 7.9 19.5 17.3 7,213 23.8 209306058 Northwest 39.8372 108.2443 11 11 48.3 28.8 18.1 7,473 48.9 209306200 Northwest 39.9211 108.2976 41 42 505.8 27.9 18.7 7,419 45.1 2.109306240 Northwest 39.8883 108.5284 11 11 9.2 28.3 20.5 7,876 78 209306242 Northwest 39.9203 108.4729 33 33 31.7 24.2 19.2 7,542 49.6 209306255 Northwest 40.1686 108.4012 28 29 262.5 19.5 16.7 6,878 17.7 1.909306800 Northwest 39.7533 109.3548 19 19 323.3 29.2 15.9 7,157 32.3 209307500 Northwest 39.5664 109.5874 27 27 300 37.6 17.5 7,772 63.2 2.209308000 Northwest 39.9389 109.6485 26 17 902.7 28.5 15.1 7,112 35.5 209328900 Southwest 38.9422 109.8212 10 NA 22.9 37.8 12.1 6,110 0.4 209339900 Southwest 37.3897 106.8412 45 45 65.4 44.4 43 10,235 100 3.109340000 Southwest 37.3695 106.8923 46 45 90.8 45.7 41.5 10,071 100 309340500 Southwest 37.4856 106.9303 17 16 39.9 46.9 51 11,081 100 3.109341500 Southwest 37.3920 106.9073 29 28 85.6 43.3 45 10,380 100 3.109342000 Southwest 37.3695 106.9403 13 12 24 40.2 39.9 9,890 100 3.109342500 Southwest 37.2667 107.0078 75 72 280.8 38.9 38.8 9,738 96.1 309343000 Southwest 37.2128 106.7945 37 36 57.9 46.7 39.2 10,026 100 3.109343500 Southwest 37.1936 106.9053 18 17 23.1 32.5 33.1 9,264 99.1 2.809344000 Southwest 37.0853 106.6895 41 59 69.2 43.3 40.1 10,255 100 309345200 Southwest 37.0756 106.8111 8 25 13.4 26.0 33.2 9,608 100 2.9

14
Regional Regression Equations for Estimation of N
atural Streamflow
Statistics in ColoradoTable 1. Drainage-basin and climatic characteristics at streamflow-gaging stations used for regional regression analysis.—Continued
[LATDEG, latitude in decimal degrees; LNGDEG, longitude in decimal degrees; YRSPK, years of record for peak streamflow; YRSANN, years of record for annual streamflow; A, drainage area, in square miles; S, mean watershed slope, in percent; P, mean annual precipitation, in inches; E, mean watershed elevation, in feet; A7500, percentage of A above 7,500 feet elevation plus 1; 6P100, 6-hour, 100-year precipitation, in inches; NA, not applicable, station operated as peak-only or flood-hydrograph station]
Station number
Hydrologic region
LATDEG LNGDEG YRSPK YRSANN A S P E A7500 6P100
09346000 Southwest 37.0028 106.9075 36 71 176 32.3 31.4 9,180 95.4 2.809346200 Southwest 36.9333 107.0006 39 NA 129.5 18.1 20.9 7,637 67.1 2.509347500 Southwest 37.4286 107.1934 14 13 82.6 41.9 37.8 10,137 100 309349800 Southwest 37.0883 107.3978 44 45 624.9 29.3 27.2 8,564 78.5 2.709350800 Southwest 36.7231 107.2797 49 NA 60.2 18.2 18 7,394 32.5 2.509352900 Southwest 37.4775 107.5437 43 45 72.5 57.9 39.5 11,350 100 3.509355000 Southwest 37.0111 107.5970 56 56 58.3 16.7 17.4 6,940 20.6 2.109357200 Southwest 36.4667 107.9173 35 NA 0.2 14.4 10.5 6,934 0 2.109357230 Southwest 36.5900 108.1848 21 NA 0.3 9.9 9.6 5,958 0 209357500 Southwest 37.8331 107.5995 47 47 57.6 54.4 44.7 11,936 100 2.709358550 Southwest 37.8197 107.6637 14 15 20.1 54.5 40.5 11,445 100 2.709359000 Southwest 37.7975 107.6953 14 13 44.4 51.9 41.2 11,571 100 2.809361000 Southwest 37.4219 107.8451 50 48 168.4 46.7 33.7 9,592 98.7 2.809361400 Southwest 37.3342 107.9095 20 6 25.5 53.9 34.1 9,413 97.5 3.109361500 Southwest 37.2792 107.8803 83 95 709.6 46.6 35.9 10,146 93.5 2.909362000 Southwest 37.6039 107.8937 22 22 63.2 33.0 24.8 8,174 68.7 2.709363000 Southwest 37.3253 107.7490 45 42 97.4 34.1 34.4 9,999 99.4 3.509363100 Southwest 37.1397 107.7534 23 23 17.8 6.8 16.9 6,762 0 2.209365500 Southwest 37.2897 108.0406 92 90 33.4 49.2 39.8 10,228 100 309366000 Southwest 37.1189 108.1987 23 22 75.6 23.3 21.4 7,835 59.6 2.409366500 Southwest 36.9997 108.1887 86 87 309.3 18.0 20.3 7,605 39.5 2.409367400 Southwest 36.7861 108.2259 27 4 1.1 15.3 9.8 5,650 0 209367530 Southwest 36.7333 108.3006 35 NA 3 7.6 9.2 5,503 0 1.909367550 Southwest 36.7667 108.3701 21 NA 4.6 6.6 9 5,468 0 1.909367561 Southwest 36.7733 108.4412 16 15 136.3 13.0 10.7 5,776 0 209367950 Southwest 36.7244 108.5915 30 18 4,390.7 7.3 9.9 6,328 4.5 2.209367980 Southwest 36.7706 108.7262 17 NA 21.7 3.5 7.9 5,227 0 209368020 Southwest 36.9258 108.7250 21 NA 2.1 6.1 8.8 5,334 0 209368500 Southwest 37.3817 108.2581 16 15 39.5 26.3 33.4 9,705 99.9 2.809369000 Southwest 37.3703 108.2315 15 14 12.1 43.0 33.1 9,690 100 2.709369500 Southwest 37.3739 108.2306 15 13 12.1 25.3 31 9,388 100 2.709371000 Southwest 37.0275 108.7415 72 78 526.7 26.4 19 7,216 28.8 2.309371300 Southwest 37.3475 108.4829 11 NA 4.5 22.6 17.3 6,856 7.8 2.309372000 Southwest 37.3242 109.0157 56 56 347.5 15.5 14.9 6,407 3.4 2.209378170 Southwest 37.8467 109.3696 21 22 8.4 27.7 26.8 8,621 91.4 2.709378630 Southwest 37.7556 109.4765 41 42 3.8 35.7 26.3 8,680 93.6 2.709378650 Southwest 37.6808 109.4626 17 18 37.4 26.1 22.5 7,917 58.4 2.609378700 Southwest 37.5606 109.5787 29 23 205 28.9 15.4 6,807 21.7 2.409379000 Southwest 37.2661 109.6757 10 9 278.9 22.8 10.6 5,861 5.5 2.209379030 Southwest 36.3333 109.6243 15 NA 76.9 12.3 8.3 5,905 0 2.209379060 Southwest 36.4694 109.4062 14 NA 1.3 3.3 8.9 5,826 0 2.109379300 Southwest 37.2167 109.8173 15 NA 64.4 21.1 8.6 5,383 0 2

Regional Regression Equations for Estimation of Natural Streamflow Statistics in Colorado 15
Selection of Stations for Other Streamflow Statistics
Many USGS streamflow-gaging stations in the study area operate as peak-only or flood-hydrograph stations and as such do not record daily-mean streamflow data. However, the remaining streamflow statistics or “other streamflow statistics” (nonannual peak) considered in this report are computed from continuous daily-mean streamflow. Hence, a subset of the 422 stations needed to be identified for the purposes of this study.
Stations used for development of equations for estimating the annual- and monthly-mean flow characteris-tics, the minimum and maximum streamflow characteristics, and the flow-duration curve are a subset of the 422 stations described in the previous section. A total of 288 sites with a combined record of 9,877 years of annual mean streamflow were selected. These stations are identified in table 1 as those with an applicable count of annual streamflow values. The actual number of stations used in the other streamflow-statistic equations is slightly reduced to counts between 210 and 280 because of factors such as the presence of zero-flow values or periods of partial streamflow record.
Finally, the authors concluded that the number of stations in the Plains hydrologic region was inadequate for regression-equation development for any of the streamflow statistics other than peak streamflow. Additionally, the pres-ence of substantial record of zero flows at many stations throughout the region, which is attributed in part to the lack of abundant precipitation and sandy soils, makes direct application of conventional regional-regression techniques, such as shown in this report, difficult and any resulting equa-tions of questionable applicability.
Computation of Streamflow Statistics and Basin and Climatic Characteristics
The methods used for computing the streamflow statistics and basin and climatic characteristics used in the development of the regression equations are described in this section. The resulting streamflow statistics and basin and climate character-istics are used as the respective response and predictor variables in the regression analysis.
Peak-Streamflow Frequency
The annual peak-streamflow data by station were used to estimate station-specific peak-streamflow magnitude by recurrence intervals, such as the 100-year peak streamflow. Peak streamflow estimates by station and T-year recurrence interval provide the basis for computing regional peak-streamflow regression equations.
The station-specific peak-streamflow values used for this report were computed using the computer program PeakFQ (Flynn and others, 2006) for all annual-peak streamflows representative of natural-flow conditions. PeakFQ is based on the guidelines for estimating peak-streamflow frequency that are described by the Interagency Advisory Committee on Water Data (1982). The guidelines are commonly referred to by practitioners as “Bulletin 17B.”
The Bulletin 17B guidelines fit a Pearson Type III dis-tribution to the product moments of the logarithms of annual peak streamflow. The product moments are mean, standard deviation, and skew. To compensate for effects of short record at a station, station skew is combined or weighted with a generalized value that is derived from a generalized skew map, which is included in Bulletin 17B. The program also provides for conditional probability adjustments for sites with zero-flow values for the annual peak. All other default settings of PeakFQ were used, and the program was operated in a batch or automated mode by using default settings to estimate station-specific, peak streamflow by recurrence intervals for this study. These station-specific, peak-streamflow values are considered the results of intermediate computations and are not reported here.
Annual- and Monthly-Mean Streamflow and Flow-Duration Curves
Daily-mean streamflow data for the 288 stations were used to compute the annual- and monthly-mean stream-flows and the station-specific flow-duration curves. Not all 288 stations could be used, however, because of zero-flow conditions. Four sites have annual-mean streamflow values of zero, and various stations have one or more monthly-mean streamflows of zero. Station-specific annual- and monthly-mean streamflows and flow-duration curve values provide the basis for developing regional equations for estimation of these streamflow statistics. Annual-mean streamflows are computed as the arithmetic mean of all annual-mean stream-flows representative of natural-flow conditions. Monthly-mean streamflows are computed as the arithmetic mean of all monthly-mean streamflows representative of natural-flow conditions. The flow-duration values are computed by sorting or ranking the daily-mean streamflow data and linearly inter-polating to the five exceedance percentiles of interest (10, 25, 50, 75, and 90).
Minimum and Maximum 7-Day StreamflowMinimum- and maximum 7-day, T-year streamflows are
computed from analysis of the 7-day minimum and maximum daily-mean streamflow for each year of record representative of natural-flow conditions. The 7-day, T-year statistics are the minimum or maximum consecutive 7-day mean streamflow

16 Regional Regression Equations for Estimation of Natural Streamflow Statistics in Colorado
Table 2. Basin and climatic characteristics evaluated for use in regional regression equations.
[NED, National Elevation Dataset; PRISM, Parameter-Elevation Regressions on Independent Slopes Model; km, kilometer; NOAA, National Oceanic and Atmospheric Administration; DAYMET, Daymet project]
Characteristic Unit Datasets usedDrainage area square
milesWatershed Polygon generated using StreamStats process
Maximum elevation feet 10-meter NEDMinimum elevation feet 10-meter NEDRelief (difference between maximum and minimum elevations) feet 10-meter NEDMean watershed elevation feet 10-meter NEDMean watershed slope (not channel slope) percent 10-meter NEDPercentage of area with slopes greater than 30 percent percent 10-meter NEDPercentage of area with slopes greater than 30 percent and facing north percent 10-meter NEDPercentage of area with slopes greater than 15 percent percent 10-meter NEDPercentage of area with slopes greater than 15 percent and facing north percent 10-meter NEDPercentage of area above 7,500 feet percent 10-meter NEDMean annual precipitation inches PRISM 4 km,a 8 kmb
6-hour, 2-year precipitation inches NOAA-Atlas 14,c NOAA-Atlas 2d
24-hour, 2-year precipitation inches NOAA-Atlas 14,c NOAA-Atlas 24
6-hour, 100-year precipitation inches NOAA-Atlas 14,c NOAA-Atlas 2d
24-hour, 100-year precipitation inches NOAA-Atlas 14,c NOAA-Atlas 2d
Mean annual number of wet days days DAYMETaUsed for Colorado, Utah, Arizona, New Mexico, and Wyoming.bUsed for Nebraska, Kansas, Oklahoma, and Texas.cUsed for Utah, Arizona, and New Mexico.dUsed for Colorado, Wyoming, Nebraska, Kansas, Oklahoma, and Texas.
expected to occur once every T-years or that has an exceed-ance probability of 1/T, and these statistics provide the basis for developing regional equations for estimation of minimum and maximum 7-day streamflow.
Minimum- and maximum-streamflow frequency statistics were estimated using the methods described by Riggs (1972) implemented by the computer program SWSTAT (Lumb and others, 1990). The use of SWSTAT in the context of this report requires the explicit assumption that the log-Pearson Type III distribution is simultaneously suitable for low- and high-flow frequency analysis in Colorado. The general approach imple-mented by SWSTAT includes the following: Annual series of the minimum or maximum 7-day streamflows by station are computed by a “sliding window,” and the product moments of mean, standard deviation, and skew of the logarithms of the streamflow values are computed. Finally, a log-Pearson Type III distribution is fit to the product moments, and the quantiles for the 2-year, 10-year, and 50-year recurrence intervals are extracted to produce the station-specific minimum and maxi-mum 7-day, T-year streamflow statistics.
Basin and Climatic CharacteristicsBased on the results of previous regional streamflow
studies conducted in Colorado and neighboring States (Kircher and others, 1985; Thomas and others, 1997; Vaill, 1999; Hortness and Berenbrock, 2001; Berenbrock, 2002; Miller, 2003; Hortness, 2006; Waltemeyer, 2006; and Kenney
and others, 2007) and on the availability of readily accessible data, a total of 17 characteristics (11 basin and 6 climatic characteristics) that are listed in table 2 were evaluated as candidate predictor variables in the regression analysis. For each of the 422 stations utilized in this study for the develop-ment of the regression equations, values for all 17 charac-teristics were calculated using various techniques involving geographic information system technology and multiple data sources that are listed in table 3.
Exploratory graphical and statistical analysis of rela-tions between the basin and climatic characteristics was conducted to narrow the list of candidate characteristics into those that are appropriate or applicable variables for regres-sion analysis. The graphical and statistical analysis considered strength of correlation or concordance, linearity, and cross-correlation between variables. For example, mean annual precipitation and mean watershed elevation are strongly related in Colorado; so, to a degree, having one is equivalent to having the other. The decision process also is influenced by the number of stations (degrees of freedom) by region. The graphical and statistical analysis resulted in selection of the six predictor variables of drainage area (A) in square miles; mean watershed elevation (E) in feet; mean water-shed slope (S) in percent; percentage of drainage area above 7,500 feet of elevation (A7500); mean annual precipitation (P) in inches; and 6-hour, 100-year precipitation (6P100) in inches. Only these six variables are considered for the remainder of this report.
Regional Regression Equations for Estimation of Natural Streamflow Statistics in Colorado 17
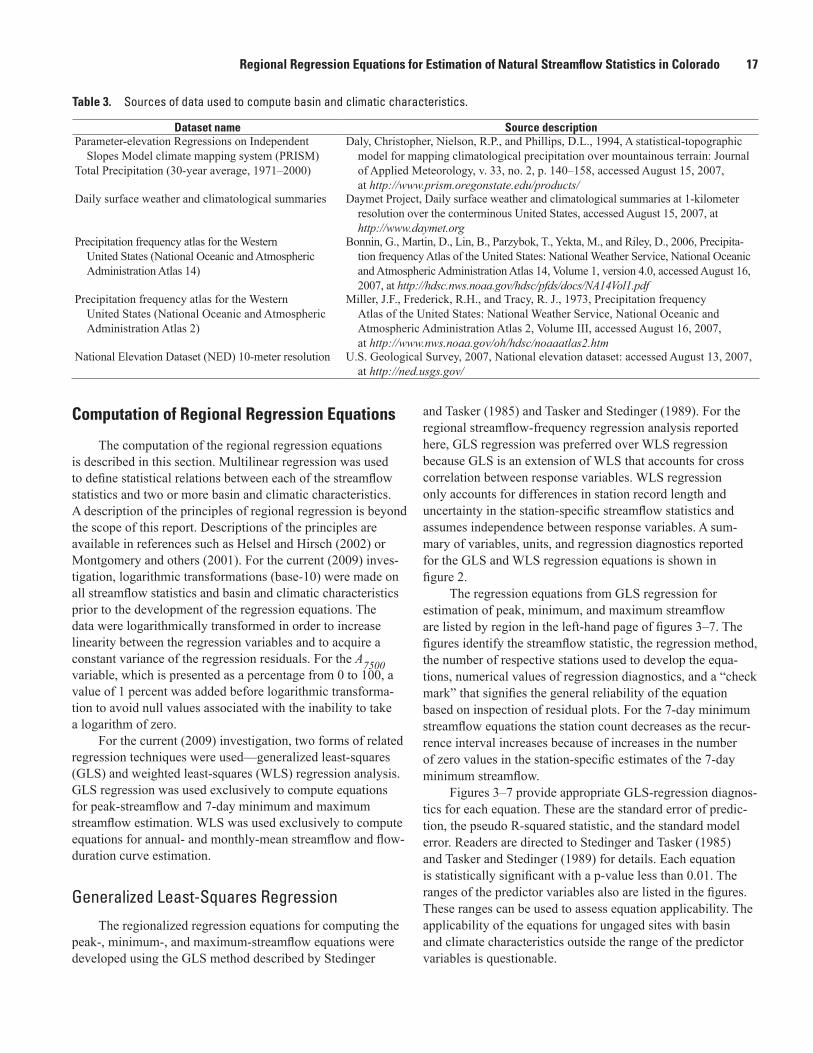
Table 3. Sources of data used to compute basin and climatic characteristics.
Dataset name Source descriptionParameter-elevation Regressions on Independent
Slopes Model climate mapping system (PRISM)Total Precipitation (30-year average, 1971–2000)
Daly, Christopher, Nielson, R.P., and Phillips, D.L., 1994, A statistical-topographic model for mapping climatological precipitation over mountainous terrain: Journal of Applied Meteorology, v. 33, no. 2, p. 140–158, accessed August 15, 2007, at http://www.prism.oregonstate.edu/products/
Daily surface weather and climatological summaries Daymet Project, Daily surface weather and climatological summaries at 1-kilometer resolution over the conterminous United States, accessed August 15, 2007, at http://www.daymet.org
Precipitation frequency atlas for the Western United States (National Oceanic and Atmospheric Administration Atlas 14)
Bonnin, G., Martin, D., Lin, B., Parzybok, T., Yekta, M., and Riley, D., 2006, Precipita-tion frequency Atlas of the United States: National Weather Service, National Oceanic and Atmospheric Administration Atlas 14, Volume 1, version 4.0, accessed August 16, 2007, at http://hdsc.nws.noaa.gov/hdsc/pfds/docs/NA14Vol1.pdf
Precipitation frequency atlas for the Western United States (National Oceanic and Atmospheric Administration Atlas 2)
Miller, J.F., Frederick, R.H., and Tracy, R. J., 1973, Precipitation frequency Atlas of the United States: National Weather Service, National Oceanic and Atmospheric Administration Atlas 2, Volume III, accessed August 16, 2007, at http://www.nws.noaa.gov/oh/hdsc/noaaatlas2.htm
National Elevation Dataset (NED) 10-meter resolution U.S. Geological Survey, 2007, National elevation dataset: accessed August 13, 2007, at http://ned.usgs.gov/
Computation of Regional Regression Equations
The computation of the regional regression equations is described in this section. Multilinear regression was used to define statistical relations between each of the streamflow statistics and two or more basin and climatic characteristics. A description of the principles of regional regression is beyond the scope of this report. Descriptions of the principles are available in references such as Helsel and Hirsch (2002) or Montgomery and others (2001). For the current (2009) inves-tigation, logarithmic transformations (base-10) were made on all streamflow statistics and basin and climatic characteristics prior to the development of the regression equations. The data were logarithmically transformed in order to increase linearity between the regression variables and to acquire a constant variance of the regression residuals. For the A7500 variable, which is presented as a percentage from 0 to 100, a value of 1 percent was added before logarithmic transforma-tion to avoid null values associated with the inability to take a logarithm of zero.
For the current (2009) investigation, two forms of related regression techniques were used—generalized least-squares (GLS) and weighted least-squares (WLS) regression analysis. GLS regression was used exclusively to compute equations for peak-streamflow and 7-day minimum and maximum streamflow estimation. WLS was used exclusively to compute equations for annual- and monthly-mean streamflow and flow-duration curve estimation.
Generalized Least-Squares Regression
The regionalized regression equations for computing the peak-, minimum-, and maximum-streamflow equations were developed using the GLS method described by Stedinger
and Tasker (1985) and Tasker and Stedinger (1989). For the regional streamflow-frequency regression analysis reported here, GLS regression was preferred over WLS regression because GLS is an extension of WLS that accounts for cross correlation between response variables. WLS regression only accounts for differences in station record length and uncertainty in the station-specific streamflow statistics and assumes independence between response variables. A sum-mary of variables, units, and regression diagnostics reported for the GLS and WLS regression equations is shown in figure 2.
The regression equations from GLS regression for estimation of peak, minimum, and maximum streamflow are listed by region in the left-hand page of figures 3–7. The figures identify the streamflow statistic, the regression method, the number of respective stations used to develop the equa-tions, numerical values of regression diagnostics, and a “check mark” that signifies the general reliability of the equation based on inspection of residual plots. For the 7-day minimum streamflow equations the station count decreases as the recur-rence interval increases because of increases in the number of zero values in the station-specific estimates of the 7-day minimum streamflow.
Figures 3–7 provide appropriate GLS-regression diagnos-tics for each equation. These are the standard error of predic-tion, the pseudo R-squared statistic, and the standard model error. Readers are directed to Stedinger and Tasker (1985) and Tasker and Stedinger (1989) for details. Each equation is statistically significant with a p-value less than 0.01. The ranges of the predictor variables also are listed in the figures. These ranges can be used to assess equation applicability. The applicability of the equations for ungaged sites with basin and climate characteristics outside the range of the predictor variables is questionable.

18 Regional Regression Equations for Estimation of Natural Streamflow Statistics in Colorado
Regression Equation Response Variables
Variable Variable definition
QT T-year peak streamflow, in cubic feet per second
7QTmin 7-day, T-year minimum streamflow, in cubic feet per second
7QTmax 7-day, T-year maximum streamflow, in cubic feet per second
Qann Annual-mean streamflow, in cubic feet per secondQmonth Monthly-mean streamflow by abbreviation, in cubic feet per secondQ#th Daily-mean streamflow as exceedance probability as percent, in cubic feet per second
Regression Equation Predictor Variables
Variable Variable definition
A Drainage area, in square milesA7500 Percentage of A above 7,500 feet of elevation plus 1E Mean elevation of watershed, in feetP Mean annual precipitation, in inches
6P100 6-hour, 100-year precipitation, in inchesS Mean watershed slope, in percent
Regression Equation Diagnostics for GLS and WLS Regression Equations
Diagnostic Diagnostic Definition
SEP Standard error of prediction (WLS and GLS), in percentadjR2 100 × adjusted R-squared (WLS only), dimensionlesspseudoR2 100 × pseudo R-squared (GLS only), dimensionlessSME Standard model error (GLS only), in percent
√ Mark that qualifies (see text) the reliability of regression residuals
Figure 2. Summary of variables and regression diagnostics for regional equations. GLS, Generalized Least Squares; WLS, Weighted Least Squares.
Weighted Least-Squares Regression
The regionalized regression equations for computing the annual-and monthly-mean streamflow equations and the equations for the flow-duration curve were developed using WLS regression. For the regional regression analy-sis reported here, WLS regression was preferred over GLS regression because GLS regression was specifically developed for use with T-year type streamflow statistics and is difficult to extend to other streamflow statistics. The weights used for the WLS regression for the annual-mean and monthly-mean equations are based on the variance of the logarithms of the observed values. Specifically, stations with lesser variance received greater weighting. The weights for flow-duration equations are based on length of available record in years. The equations for estimating monthly- and annual-mean streamflows and flow-duration curves for four of the five hydrologic regions are listed in figures 3–7. Equations
were not developed for the Plains hydrologic region for reasons outlined in section “Selection of Stations for Other Streamflow Statistics.”
The figures also provide appropriate WLS-regression diagnostics for each equation. These include the standard error of prediction and the adjusted R-squared statistic. Each equa-tion is statistically significant with a p-value less than 0.01. Readers are directed to standard texts on regression such as Helsel and Hirsch (2002) or Montgomery and others (2001) for details. Similar to the GLS-regression equations, the ranges of the predictor variables also are listed in the figures.
Discussion of Selection of Variables
The six selected basin and climatic characteristics were examined as predictor variables for the regression equa-tions reported in figures 3–7. Regression-equation develop-ment is an inherently iterative process, and the modeler must

Regional Regression Equations for Estimation of Natural Streamflow Statistics in Colorado 19
balance several competing objectives, including the tradeoff between number of variables to include in the equation and the degrees of freedom (data points) used to estimate regression coefficients.
One goal in the early stages of regression-equation development is to identify and select those basin and climatic characteristics that have a statistically significant effect on the dependent variables and to generally exclude those predictor variables having limited influence. For example, P and E are strongly coupled in the study area in which the latter influ-ences the former through orographic effects that enhance the formation of precipitation; hence, it is not always optimal to have both variables present in an equation. Other variables can be selected on professional judgment and logic and confirmed by statistical significance. For example, A is a vital predictor variable for streamflow statistics and is the only common vari-able used in all regional equations developed by Kircher and others (1985) and Vaill (1999). For the regression equations reported here, A is similarly included.
The selection of variables also is influenced by vari-ous regression diagnostics such as statistical significance (as measured by p-values), residual standard error, the distribution of regression residuals, several coefficient-of-determination statistics (R-squared statistics) or R-squared-like statistics (pseudo R-squared for the GLS regression; see Griffis and Stedinger [2007]) and others. Selection of variables can also be influenced by the preference to maintain a consistent structural form to a set of estimating equations in order to help ensure physically consistent estimates. By maintaining a regionally consistent set of included variables in the equations with ensembles of T-year peak streamflow, situations such as the 50-year peak streamflow being estimated as less than the 25-year peak streamflow are virtually eliminated. By main-taining a regionally consistent set of included variables in the equation ensembles for monthly streamflow, a smooth month-to-month variation in estimated streamflow, which is presum-ably more reflective of actual seasonal variations, is provided.
Application and Limitations of Regional Regression Equations
Application and limitations of the regional regression equations in figures 3–7 exist. The number of equations reported here is too large for a comprehensive discussion of the subtle details of each. However, all of the equations reported in the figures are statistically significant, with a p-value less than 0.01, and represent reasonably reliable equations that were developed from USGS data, available sample sizes, and techniques that are within the scope of the report.
The authors have assessed each equation and assigned a qualification as a “boxed check mark” to each equation based on visual interpretation of the residual plots (not
reported here) for each equation. A boxed check mark is provided in figures 3–7 for each equation for which no bias was identified. A boxed check mark is not provided for those equations for which the residual plots indicate that bias (as either overestimation or underestimation) could exist for some combinations of basin and climatic characteristics. Such biases are indicated by nonlinear relations in the residual plots or the presence of heteroscedasticity (nonconstant variance). The magnitude and direction of bias are difficult to systematically quantify and mitigate for each of those equations within the scope of this report. For each of the equations listed in the figures, however, the qualification provides a mechanism by which the potential for biased estimation can be communi-cated to practitioners.
All streamflow statistics estimated from the equations are considered to be associated with natural basin and climatic characteristics and are not representative of anthropogenically influenced conditions, such as site-specific situations involving factors like the placement or removal of a dam or substantial diversion and return flows. In general, the equations and their associated errors are most valid for ungaged watersheds with basin and climatic characteristics well within the ranges of the predictor variables for each equation. Estimates and associated errors for ungaged sites having basin or climate characteristics outside the reported range of the independent variables are less applicable and could be erroneous. As a result, consideration of these and other limitations requires substantial judgment on the part of the practitioners for reliable application of the regional equations for estimation of natural streamflow statis-tics in Colorado.
The USGS has developed a Web-based computer pro-gram called StreamStats (Ries and others, 2004). The software facilitates the computation of streamflow statistics using regional regression equations or other procedures that have been published previously. StreamStats allows the user to obtain streamflow statistics for both gaged and ungaged sites by selecting a specific stream location on a map interface. If the location of interest lacks a station, the algorithms in StreamStats delineate the watershed for the location, compute basin and climatic characteristics, and provide estimates of the streamflow statistics using the available regression equations. In general, the computational algorithms used to generate basin and climatic characteristics for the regression equations reported here are consistent with those of StreamStats. As a result, predictor variables used to develop the equations presented in this report are compatible for use with StreamStats, which represents a unique contribution to ungaged-site, regional-streamflow estimation in Colorado. Finally, regression equations reported here for Colorado have been included in StreamStats to ease the computation of estimates of streamflow statistics for practitioners.

20 Regional Regression Equations for Estimation of Natural Streamflow Statistics in Colorado
Figure 3. Regional regression equations for the Mountain hydrologic region.
Summary of Variables, Units, and Regression Diagnostics is shown in figure 2.
Q A S P
Q A S P
Q
22 05 0 78 0 17 2 10
51 51 0 77 0 16 1 85
101
10
10
10
=
=
=
−
−
−
. . . .
. . . .
.....
. . . .
.
20 0 77 0 14 1 71
250 90 0 75 0 16 1 55
500 68 0
10
10
A S P
Q A S P
Q A
=
=
−
− ....
. . . .
. .
75 0 16 1 45
1000 46 0 75 0 14 1 35
2000 28 0 75
10
10
S P
Q A S P
Q A
=
=
−
− SS P
Q A S P
0 13 1 26
5000 06 0 74 0 15 1 1410
. .
. . . .= −
7 21 99 0 82 2 08
7 101 38 0 85 1 78
7 50
10
10
1
Q A P
Q A P
Q
max . . .
max . . .
max
=
=
=
−
−
00 0 94 0 85 1 57− . . .A P
7 226 56 1 13 1 26 5 85
7 1033 76 1 20 2 25 7
10
10
Q A P E
Q A P E
min . . . .
min . . .
=
=
−
− ..
min . . . .
20
7 5018 56 1 17 1 86 3 5610Q A P E= −
√
√
√
√
√
√
√
√
√
√
√
√
√
√
SEP = 49,
SEP = 44,
SEP = 41,
SEP = 40,
SEP = 39,
SEP = 36,
SEP = 36,
SEP = 33,
SEP = 89,
SEP = 153,
SEP = 126,
SEP = 46,
SEP = 35,
SEP = 31,
pseudoR2 = 83,
pseudoR2 = 86,
pseudoR2 = 87,
pseudoR2 = 88,
pseudoR2 = 88,
pseudoR2 = 90,
pseudoR2 = 90,
pseudoR2 = 91,
pseudoR2 = 80,
pseudoR2 = 67,
pseudoR2 = 72,
pseudoR2 = 86,
pseudoR2 = 92,
pseudoR2 = 94,
SME = 48,
SME = 43,
SME = 40,
SME = 39,
SME = 37,
SME = 34,
SME = 34, and
SME = 31.
SME = 87,
SME = 148, and
SME = 122.
SME = 45,
SME = 34, and
SME = 30.
Peak Streamflow Equations for Mountain Hydrologic Region
Minimum Streamflow for Mountain Hydrologic Region
Maximum Streamflow for Mountain Hydrologic Region
Generalized least-squares (GLS) regression, 141 stationsApproximate range of predictor variables
Generalized least-squares (GLS) regression, 124, 118, and 111 stationsApproximate range of predictor variables
Generalized least-squares (GLS) regression, 130 stationsApproximate range of predictor variables
A: 1–1,060 square miles; S: 7.6–60.2 percent; and P: 18–47 inches
A: 1–1,060 square miles; P: 18–47 inches; and E: 8,600–12,000 feet elevation
A: 1–1,060 square miles and P: 18–47 inches

Regional Regression Equations for Estimation of Natural Streamflow Statistics in Colorado 21
Figure 3. Regional regression equations for the Mountain hydrologicregion.—Continued
Summary of Variables, Units, and Regression Diagnostics is shown in figure 2.
Q A PQ A PQ
10th
25th
50th
=
=
=
−
−
−
10
10
10
2 64 0 89 2 22
2 86 0 96 1 92
2 6
. . .
. . .
. 99 0 98 1 49
2 85 1 01 1 40
3 46 1 10 1 59
10
10
A PQ A PQ A P
. .
. . .
. . .75th
90th
=
=
−
−
Q A PQ A PQ A
ann
oct
nov
=
=
=
−
−
−
10
10
10
2 31 0 88 1 71
3 29 0 97 1 98
3 14 0
. . .
. . .
. .. .
. . .
. . .
98 1 78
2 90 1 00 1 52
2 99 1 02 1 53
10
10
PQ A PQ A P
Q
dec
jan
feb
=
=
=
−
−
110
10
10
2 92 1 02 1 46
2 87 1 06 1 42
2 95 1 14
−
−
−
=
=
. . .
. . .
. .
A P
Q A PQ A P
mar
apr11 64
1 60 0 94 1 44
1 29 0 82 1 52
2
10
10
10
.
. . .
. . .
Q A P
Q A P
Q
may
jun
jul
=
=
=
−
−
− .. . .
. . .
. . .
80 0 84 2 23
2 73 0 85 1 91
2 93 0 92 1 84
10
10
A P
Q A P
Q A Paug
sep
=
=
−
−
√
√
√
√
√
√
√
√
√
√
√
√
√
√
SEP = 33,
SEP = 45,
SEP = 46,
SEP = 47,
SEP = 50,
SEP = 51,
SEP = 49,
SEP = 44,
SEP = 46,
SEP = 46,
SEP = 76,
SEP = 80,
SEP = 59,
SEP = 45,
SEP = 55,
SEP = 55,
SEP = 64,
SEP = 85,
adjR2 = 93,
adjR2 = 89,
adjR2 = 90,
adjR2 = 89,
adjR2 = 88,
adjR2 = 88,
adjR2 = 89,
adjR2 = 92,
adjR2 = 87,
adjR2 = 87,
adjR2 = 72,
adjR2 = 75, and
adjR2 = 86.
adjR2 = 90,
adjR2 = 88,
adjR2 = 88,
adjR2 = 86, and
adjR2 = 82.
Annual and Monthly Mean Streamflow for Mountain Hydrologic Region
Flow-Duration Curve for Mountain Hydrologic Region
Weighted least-squares (WLS) regression, 129 stationsApproximate range of predictor variables
Weighted least-squares (WLS) regression, 129 stationsApproximate range of predictor variables
A: 1–1,060 square miles and P: 18–47 inches
A: 1–1,060 square miles and P: 18–47 inches

22 Regional Regression Equations for Estimation of Natural Streamflow Statistics in Colorado
Figure 4. Regional regression equations for the Northwest hydrologic region.
Summary of Variables, Units, and Regression Diagnostics is shown in figure 2.
7 234 73 0 83 8 56
7 1038 52 0 90 9 42
7 50
10
10
Q A EQ A EQ
min . . .
min . . .
min
=
=
−
−
== −10 36 44 0 94 8 84. . .A E
7 27 19 1 03 3 60
75001 25
7 105 35 1 00 2 48
10
10
Q A P AQ A P
max . . . .
max . . .
=
=
−
− AAQ A P A
75001 31
7 503 90 0 94 1 80
75001 2310
.
max . . . .= −
Q A A PQ A A P
2
5
=
=
− −
− −
10
10
1 15 0 757500
0 41 2 15
0 49 0 767500
0 54 2
. . . .
. . . .000
0 10 0 757500
0 63 1 93
0 35 0 757500
0 7
10
10
Q A A PQ A A
10
25
=
=
− −
−
. . . .
. . . 22 1 82
0 65 0 747500
0 77 1 74
0 93 0 747500
10
10
PQ A A PQ A A
.
. . . .
. .50
100
=
=
−
−−
−=
=
0 81 1 65
1 20 0 737500
0 85 1 56
1 53 0 72
10
10
. .
. . . .
. .
PQ A A PQ A
200
500 AA P75000 88 1 44− . .
√
√
√
√
√
√
√
√
√
√
√
√
SEP = 113,
SEP = 88,
SEP = 79,
SEP = 74,
SEP = 74,
SEP = 75,
SEP = 76,
SEP = 79,
SEP = 212,
SEP = 280,
SEP = 338,
SEP = 86,
SEP = 59,
SEP = 51,
pseudoR2 = 72,
pseudoR2 = 75,
pseudoR2 = 77,
pseudoR2 = 79,
pseudoR2 = 79,
pseudoR2 = 79,
pseudoR2 = 79,
pseudoR2 = 79,
pseudoR2 = 42,
pseudoR2 = 41,
pseudoR2 = 39,
pseudoR2 = 84,
pseudoR2 = 89,
pseudoR2 = 90,
SME = 108,
SME = 84,
SME = 75,
SME = 70,
SME = 69,
SME = 70,
SME = 70, and
SME = 72.
SME = 199,
SME = 259, and
SME = 307.
SME = 82,
SME = 56, and
SME = 48.
Peak Streamflow Equations for Northwest Hydrologic Region
Minimum Streamflow for Northwest Hydrologic Region
Maximum Streamflow for Northwest Hydrologic Region
Generalized least-squares (GLS) regression, 90 stationsApproximate range of predictor variables
Generalized least-squares (GLS) regression, 52, 47, and 42 stationsApproximate range of predictor variables
Generalized least-squares (GLS) regression, 59 stationsApproximate range of predictor variables
A: 1–5,250 square miles; A7500: 0–100 percent, and P: 8–49 inches
A: 5–5,250 square miles; E: 6,880–10,480 feet
A: 5–5,250 square miles, P: 8–49 inches, and A7500: 0–100 percent

Regional Regression Equations for Estimation of Natural Streamflow Statistics in Colorado 23
Figure 4. Regional regression equations for the Northwest hydrologicsection.—Continued
Summary of Variables, Units, and Regression Diagnostics is shown in figure 2.
Annual and Monthly Mean Streamflow for Northwest Hydrologic Region
Flow-Duration Curve for Northwest Hydrologic Region
Weighted least-squares (WLS) regression, 56 stationsApproximate range of predictor variables
Weighted least-squares (WLS) regression, 62 stationsApproximate range of predictor variables
A: 1–5,250 square miles and P: 8–49 inches
A: 1–5,250 square miles and P: 8–49 inches
Q A PQ A PQ A
ann
oct
nov
=
=
=
−
−
−
10
10
10
4 98 0 95 3 32
4 32 1 01 2 54
4 68 1
. . .
. . .
. .. .
. . .
. . .
08 2 62
4 53 1 07 2 46
4 73 1 05 2 62
10
10
PQ A PQ A PQ
dec
jan
feb
=
=
=
−
−
110
10
10
4 63 1 14 2 46
4 39 1 14 2 36
4 77 1 06
−
−
−
=
=
. . .
. . .
. .
A PQ A PQ A P
mar
apr33 02
4 54 0 96 3 40
6 90 1 00 4 87
4
10
10
10
.
. . .
. . .
Q A PQ A PQ
may
jun
jul
=
=
=
−
−
− .. . .
. . .
. . .
37 0 83 3 09
3 03 0 84 1 98
2 62 0 92 1 55
10
10
A PQ A PQ A P
aug
sep
=
=
−
−
Q A PQ A PQ
10th
25th
50th
=
=
=
−
−
−
10
10
10
6 03 1 03 4 23
5 86 1 05 3 72
6 0
. . .
. . .
. 77 1 05 3 61
6 91 1 07 3 98
8 32 1 06 4 80
10
10
A PQ A PQ A P
. .
. . .
. . .75th
90th
=
=
−
−
√
√
√
√
√
√
√
√
√
SEP = 55,
SEP = 94,
SEP = 83,
SEP = 79,
SEP = 85,
SEP = 77,
SEP = 68,
SEP = 84,
SEP = 71,
SEP = 80,
SEP = 75,
SEP = 90,
SEP = 104,
SEP = 73,
SEP = 77,
SEP = 83,
SEP = 100,
SEP = 154,
adjR2 = 88,
adjR2 = 78,
adjR2 = 83,
adjR2 = 82,
adjR2 = 81,
adjR2 = 85,
adjR2 = 90,
adjR2 = 85,
adjR2 = 84,
adjR2 = 82,
adjR2 = 68,
adjR2 = 67, and
adjR2 = 70.
adjR2 = 86,
adjR2 = 85,
adjR2 = 83,
adjR2 = 80, and
adjR2 = 70.

24 Regional Regression Equations for Estimation of Natural Streamflow Statistics in Colorado
Figure 5. Regional regression equations for the Rio Grande hydrologic region.
Summary of Variables, Units, and Regression Diagnostics is shown in figure 2.
Q A PQ A PQ A P
23 00 1 00 2 46
52 04 0 95 2 02
101 55 0 93 1
10
10
10
=
=
=
−
−
−
. . .
. . .
. . ..
. . .
. . .
.
80
251 01 0 91 1 55
500 66 0 89 1 39
1000 19
10
10
10
Q A PQ A PQ
=
=
=
−
−
− AA PQ A PQ A P
0 87 1 17
2000 03 0 86 1 11
5000 52 0 84 0 85
10
10
. .
. . .
. . .
=
=
−
7 244 17 1 03 10 71
7 1046 35 1 09 11 15
7 50
10
10
Q A EQ A EQ
min . . .
min . . .
m
=
=
−
−
iin . . .= −10 49 44 1 13 11 88A E
7 23 83 0 98 2 89
7 102 22 0 92 2 11
7 50
10
10
1
Q A PQ A PQ
max . . .
max . . .
max
=
=
=
−
−
00 1 38 0 86 1 74− . . .A P
√
√
√
√
√
√
√
√
√
√
√
√
√
√
√
√
√
SEP = 67,
SEP = 57,
SEP = 54,
SEP = 52,
SEP = 51,
SEP = 51,
SEP = 52,
SEP = 54,
SEP = 111,
SEP = 189,
SEP = 165,
SEP = 81,
SEP = 55,
SEP = 31,
pseudoR2 = 80,
pseudoR2 = 83,
pseudoR2 = 84,
pseudoR2 = 84,
pseudoR2 = 85,
pseudoR2 = 85,
pseudoR2 = 84,
pseudoR2 = 84,
pseudoR2 = 51,
pseudoR2 = 37,
pseudoR2 = 47,
pseudoR2 = 68,
pseudoR2 = 77,
pseudoR2 = 94,
SME = 64,
SME = 55,
SME = 51,
SME = 49,
SME = 48,
SME = 48,
SME = 49, and
SME = 49.
SME = 103,
SME = 170, and
SME = 148.
SME = 76,
SME = 52, and
SME = 30.
Peak Streamflow Equations for Rio Grande Hydrologic Region
Minimum Streamflow for Rio Grande Hydrologic Region
Maximum Streamflow for Rio Grande Hydrologic Region
Generalized least-squares (GLS) regression, 44 stationsApproximate range of predictor variables
Generalized least-squares (GLS) regression, 28, 27, and 24 stationsApproximate range of predictor variables
Generalized least-squares (GLS) regression, 31 stationsApproximate range of predictor variables
A: 2–517 square miles and P: 19–45 inches
A: 13–517 square miles and E: 8,600–12,000 feet elevation
A: 13–517 square miles and P: 19–45 inches

Regional Regression Equations for Estimation of Natural Streamflow Statistics in Colorado 25
Figure 5. Regional regression equations for the Rio Grande hydrologicregion.—Continued
Summary of Variables, Units, and Regression Diagnostics is shown in figure 2.
Annual and Monthly Mean Streamflow for Rio Grande Hydrologic Region
Flow-Duration Curve for Rio Grande Hydrologic Region
Weighted least-squares (WLS) regression, 32 stationsApproximate range of predictor variables
Weighted least-squares (WLS) regression, 32 stationsApproximate range of predictor variables
A: 2–517 square miles and E: 7,790–11,500 feet
A: 2–517 square miles and E: 7,790–11,500 feet
Q A EQ A EQ
ann
oct
nov
=
=
=
−
−
−
10
10
10
33 58 1 12 8 24
32 88 0 95 8 04
24 7
. . .
. . .
. 99 0 90 6 02
17 71 0 86 4 26
13 34 0 83 3 18
10
10
A EQ A EQ A E
. .
. . .
. . .dec
jan
=
=
−
−
QQ A EQ A EQ
feb
mar
apr
=
=
=
−
−
−
10
10
10
11 68 0 87 2 75
9 32 0 97 2 14
5 09
. . .
. . .
. AA E
Q A E
Q A E
1 10 1 16
37 25 1 26 9 23
61 30 1 23 15 22
10
10
. .
. . .
. . .
may
jun
=
=
−
−
QQ A E
Q A E
Q
jul
aug
sep
=
=
=
−
−
−
10
10
10
53 30 1 07 13 17
43 001 03
10 59
4
. . .
..
.
11 49 0 99 10 19. . .A E
Q A EQ A EQ
10th
25th
50th
=
=
=
−
−
−
10
10
10
32 35 1 13 8 04
41 33 1 07 10 18
. . .
. . .
338 61 0 96 9 46
42 09 0 90 10 30
50 71 0
10
10
. . .
. . .
. .
A EQ A EQ A
75th
90th
=
=
−
− 889 12 42E .
√
√
√
√
√
√
√
√
√
√
√
√
√
√
√
√
√
√
SEP = 73,
SEP = 55,
SEP = 53,
SEP = 63,
SEP = 64,
SEP = 56,
SEP = 49,
SEP = 79,
SEP = 84,
SEP = 84,
SEP = 74,
SEP = 53,
SEP = 57,
SEP = 81,
SEP = 67,
SEP = 75,
SEP =112,
SEP =145,
adjR2 = 72,
adjR2 = 72,
adjR2 = 73,
adjR2 = 68,
adjR2 = 66,
adjR2 = 74,
adjR2 = 82,
adjR2 = 75,
adjR2 = 71,
adjR2 = 74,
adjR2 = 72,
adjR2 = 80, and
adjR2 = 75.
adjR2 = 66,
adjR2 = 72,
adjR2 = 64,
adjR2 = 48, and
adjR2 = 44.

26 Regional Regression Equations for Estimation of Natural Streamflow Statistics in Colorado
Figure 6. Regional regression equations for the Southwest hydrologic region.
Summary of Variables, Units, and Regression Diagnostics is shown in figure 2.
Peak Streamflow Equations for Southwest Region
Minimum Streamflow for Southwest Region
Maximum Streamflow for Southwest Region
Generalized least-squares (GLS) regression, 78 stationsApproximate range of predictor variables
Generalized least-squares (GLS) regression, 46, 37, and 33 stationsApproximate range of predictor variables
Generalized least-squares (GLS) regression, 59 stationsApproximate range of predictor variables
A: 1–4,390 square miles and A7500: 0–100 percent
A: 4–4,390 square miles, P: 10–51 inches, E: 5,600–11,600 feet
A: 4–4,390 square miles and P: 10–51 inches
Q A AQ A AQ
21 67 0 64
75000 10
52 13 0 62
75000 19
102 36
10
10
10
=
=
=
−
−
. . .
. . .
. AA AQ A AQ A A
0 617500
0 23
252 61 0 60
75000 27
502 77 0 59
7
10
10
. .
. . .
. .
−
−=
= 55000 30
1002 91 0 59
75000 33
2003 04 0 58
75000
10
10
−
−
−
=
=
.
. . .
. .
Q A AQ A A ..
. . .
36
5003 21 0 58
75000 3910Q A A= −
7 222 24 1 16 1 51 4 65
7 1018 74 0 97 1 35 3
10
10
Q A P EQ A P E
min . . . .
min . . .
=
=
−
− ..
min . . . .
88
7 5026 29 0 49 0 11 6 4510Q A P E= −
7 24 07 0 99 3 10
7 102 68 0 93 2 44
7 50
10
10
1
Q A PQ A PQ
max . . .
max . . .
max
=
=
=
−
−
00 1 86 0 89 2 03− . . .A P
√
√
√
√
√
√
√
√
√
√
√
√
√
√
SEP = 90,
SEP = 71,
SEP = 67,
SEP = 66,
SEP = 67,
SEP = 69,
SEP = 71,
SEP = 75,
SEP = 226,
SEP = 255,
SEP = 354,
SEP = 64,
SEP = 43,
SEP = 33,
pseudoR2 = 67,
pseudoR2 = 52,
pseudoR2 = 33,
pseudoR2 = 88,
pseudoR2 = 93,
pseudoR2 = 95,
pseudoR2 = 70,
pseudoR2 = 75,
pseudoR2 = 77,
pseudoR2 = 78,
pseudoR2 = 78,
pseudoR2 = 78,
pseudoR2 = 77,
pseudoR2 = 77,
SME = 87,
SME = 69,
SME = 64,
SME = 63,
SME = 63,
SME = 65,
SME = 67, and
SME = 70.
SME = 207,
SME = 226, and
SME = 300.
SME = 61,
SME = 40, and
SME = 30.

Regional Regression Equations for Estimation of Natural Streamflow Statistics in Colorado 27
Figure 6. Regional regression equations for the Southwest hydrologicregion.—Continued
Summary of Variables, Units, and Regression Diagnostics is shown in figure 2.
Annual and Monthly Mean Streamflow for Southwest Region
Flow-Duration Curve for Southwest Region
Weighted least-squares (WLS) regression, 57 stationsApproximate range of predictor variables
Weighted least-squares (WLS) regression, 57 stationsApproximate range of predictor variables
A: 1–4,390 square miles and P: 10–51 inches
A: 1–4,390 square miles and P: 10–51 inches
Q A PQ A PQ A
ann
oct
nov
=
=
=
−
−
−
10
10
10
4 37 0 91 2 98
4 80 1 00 2 89
4 59 0
. . .
. . .
. .. .
. . .
. . .
91 2 78
4 22 0 91 2 45
4 28 0 96 2 39
10
10
PQ A PQ A P
Q
dec
jan
feb
=
=
=
−
−
110
10
10
3 97 0 98 2 18
3 79 1 00 2 12
4 98 1 12
−
−
−
=
=
. . .
. . .
. .
A PQ A PQ A P
mar
apr33 11
5 16 1 01 3 63
6 13 1 05 4 30
5
10
10
10
.
. . .
. . .
Q A P
Q A P
Q
may
jun
jul
=
=
=
−
−
− .. . .
. . .
. . .
19 0 91 3 58
4 60 0 94 2 95
8 72 0 98 5 46
10
10
A P
Q A P
Q A Paug
sep
=
=
−
−
Q A PQ A PQ
10th
25th
50th
=
=
=
−
−
−
10
10
10
5 44 1 02 3 79
5 27 1 00 3 40
5 0
. . .
. . .
. 88 0 98 3 01
5 99 1 02 3 37
7 30 1 01 4 11
10
10
A PQ A PQ A P
. .
. . .
. . .75th
90th
=
=
−
−
√
√
√
√
√
√
√
√
√
√
√
√
SEP = 79
SEP = 96,
SEP = 98,
SEP = 100,
SEP = 148,
SEP = 60,
SEP = 106,
SEP = 80,
SEP = 75,
SEP = 77,
SEP = 58,
SEP = 47,
SEP = 50,
SEP = 62,
SEP = 121,
SEP = 180,
SEP = 119,
SEP = 120,
adjR2 = 85,
adjR2 = 77,
adjR2 = 76,
adjR2 = 75,
adjR2 = 77,
adjR2 = 83,
adjR2 = 82,
adjR2 = 95,
adjR2 = 88,
adjR2 = 85,
adjR2 = 63,
adjR2 = 64, and
adjR2 = 79.
adjR2 = 85,
adjR2 = 78,
adjR2 = 75,
adjR2 = 78, and
adjR2 = 72.

28 Regional Regression Equations for Estimation of Natural Streamflow Statistics in Colorado
Figure 7. Regional regression equations for the Plains hydrologic region.
Summary The U.S. Geological Survey (USGS), in cooperation
with the Colorado Water Conservation Board and the Colorado Department of Transportation, developed regional regression equations for estimation of various streamflow statistics that are representative of natural streamflow conditions in Colorado. Accurate estimates of various streamflow statistics are impor-tant for water-resource management, stream-related structural design, stream-hazard identification, and water-quality manage-ment. Streamflow statistics routinely are needed for sites in ungaged watersheds (ungaged sites) that lack nearby stream-flow-gaging stations (stations) from which streamflow statistics could be directly computed. Regional regression equations are a common tool used to estimate streamflow statistics at ungaged sites across the Nation and Colorado.
Regional regression equations are based on statistical relations between (1) streamflow statistics of interest computed from applicable records of the stations and (2) basin and climatic characteristics, for which data are typically readily available. The use of regional equations generally represents a reliable and cost-effective means for estimating streamflow statistics at ungaged sites, along with expressions of predictive uncertainty.
The purpose of this report is to present regional regression equations by hydrologic region for estimation of streamflow statistics for naturally flowing streams in Colorado. The equa-tions were developed using the statistical relations between streamflow statistics (response variables) and basin and climatic characteristics (predictor variables).
For each of five hydrologic regions in Colorado, peak-streamflow equations that are based on peak-streamflow data from selected stations are presented for the 2-, 5-, 10-, 25-, 50-,
100-, 200- and 500-year instantaneous-peak streamflows (peak streamflow). For four of the five hydrologic regions, minimum and maximum 7-day streamflow (7-day, T-year) equations based on daily-mean streamflow data from selected stations are presented for 7-day minimum 2-, 10-, and 50-year streamflows, as well as for 7-day maximum 2-, 10-, and 50-year streamflows. Other equations presented for the same four hydrologic regions include those for estimation of annual- and monthly-mean streamflow and streamflow-duration statistics for exceedances of 10, 25, 50, 75, and 90 percent. The streamflow-duration statistics collectively are referred to as the “flow-duration curve.” The flow-duration values, presented in this report as Q10th, Q25th, Q50th, Q75th, and Q90th, indicate the percentage of days that a given daily-mean streamflow is exceeded. For example, a 10-per-cent flow-duration value (Q10th) is calculated as the daily-mean streamflow at a given station that is exceeded 10 percent of the time or 10 percent of the days. Finally, this report also describes some limitations associated with the equations, including an assessment of prediction errors and assessment of equation appli-cability for ungaged sites.
The regional equations for peak-streamflow estimation were developed using annual peak-streamflow data collected through water year 2006 (October 1, 2005, through September 30, 2006). The remaining equations, with the exception of the 7-day, T-year minimum streamflow equations, were developed using data through water year 2007. The 7-day, T-year minimum streamflow equations were developed using data collected through climate year 2007 (April 1, 2006, through March 31, 2007).
The study was limited to the use of several selected basin and climatic characteristics including drainage area; mean watershed elevation; mean watershed slope; percentage of drainage area above 7,500 feet of elevation; mean annual precipitation; and 6-hour, 100-year precipitation.
Peak Streamflow Equations for Plains Hydrologic RegionGeneralized least-squares (GLS) regression, 69 stationsApproximate range of predictor variables
Summary of Variables, Units, and Regression Diagnostics is shown in figure 2.
A: 0.5–2,930 square miles and 6P100: 2.4–5.1 inches
Q A PQ A PQ A
21 26 0 52
6 1000 35
50 94 0 57
6 1001 64
100 85 0
10
10
10
=
=
=
. . .
. . .
. .. .
. . .
. .
596 100
2 15
250 84 0 61
6 1002 57
500 85 0 62
6 1002
10
10
PQ A PQ A P
=
= ..
. . .
. . .
79
1000 88 0 63
6 1002 98
2000 95 0 63
6 1003 37
500
10
10
Q A PQ A PQ
=
=
== 100 81 0 646 100
3 59. . .A P
√
√
√
√
√
√
√
√
SEP = 183,
SEP = 142,
SEP = 136,
SEP = 137,
SEP = 139,
SEP = 141,
SEP = 160,
SEP = 141,
pseudoR2 = 40,
pseudoR2 = 54,
pseudoR2 = 58,
pseudoR2 = 62,
pseudoR2 = 64,
pseudoR2 = 65,
pseudoR2 = 65,
pseudoR2 = 70,
SME = 174,
SME = 134,
SME = 128,
SME = 128,
SME = 129,
SME = 131,
SME = 147, and
SME = 128.

Selected References 29
The computation of the regional regression equations used multilinear regression to define statistical relations between each of the streamflow statistics and two or more basin and climatic characteristics. For the investigation, logarithmic transformations (base-10) were made on all streamflow statistics and basin and climatic characteristics prior to the development of the regression equations. The data were logarithmically transformed to increase linearity between the regression variables and to acquire a con-stant variance of the regression residuals.
For the investigation, two forms of related regression tech-niques were used—generalized least-squares (GLS) and weighted least-squares (WLS) regression analyses. GLS regression was used exclusively to compute equations for peak-streamflow and 7-day minimum and maximum streamflow estimation. WLS was used exclusively to compute equations for annual- and monthly-mean streamflow and flow-duration curve estimation.
The regionalized regression equations for computing the peak-, minimum-, and maximum-streamflow equations were developed using the GLS method. For the regional streamflow-frequency regression analysis reported here, GLS regression was preferred over WLS regression because GLS is an extension of WLS that accounts for cross correlation between response variables. WLS regression only accounts for differences in station record length and uncertainty in the station-specific streamflow statistics and assumes independence between response variables.
WLS regression was used for the development of region-alized regression equations for computing the annual- and monthly-mean streamflow equations and the equations for the flow-duration curve. WLS regression was preferred over GLS regression because GLS regression was specifically developed for use with T-year type streamflow statistics and is difficult to extend to other streamflow statistics. The weights used for the WLS regression for the annual-mean and monthly-mean equations are based on the variance of the logarithms of the observed values. The weights for flow-duration equations are based on length of available record in years.
Appropriate diagnostics for each of the equations are reported. These are standard error of prediction in percent (GLS and WLS), the adjusted R-squared statistic in percent (WLS only), the pseudo R-squared statistics in percent (GLS only), and the standard model error in percent (GLS only). Each of the equa-tions is statistically significant with p-values less than 0.01. The ranges of the predictor variables also are provided. These ranges can be used to assess equation applicability. The applicability of the equations for ungaged sites with basin and climate character-istics outside the range of the predictor variables is questionable.
Application and limitations of the regional regression equa-tions exist. All of the equations reported in the figures are statisti-cally significant and represent reasonably reliable equations that have been developed from USGS data, available sample sizes, and techniques that are within the scope of the report.
The authors have assessed each equation and assigned a qualification to each equation based on visual interpreta-tion of the residual plots (not reported here) for each equation. For some equations the residual plots indicate that bias (as either overestimation or underestimation) could exist for some
combinations of basin and climatic characteristics. Such biases are indicated by nonlinear relations in the residual plots or the presence of heteroscedasticity (nonconstant variance). The mag-nitude and direction of bias are difficult to systematically quantify and mitigate for each of those equations within the scope of this report. For each of the equations listed in the figures, however, the qualification provides a mechanism by which the potential for biased estimation can be communicated to practitioners.
All streamflow statistics estimated from the equations are considered to be associated with natural basin and climatic char-acteristics and are not representative of anthropogenically influ-enced conditions, such as site-specific situations involving factors like the placement or removal of a dam or substantial diversion and return flows. In general, the equations and their associated errors are most valid for ungaged watersheds with basin and climatic characteristics well within the ranges of the predictor variables for each equation. Estimates and associated errors for ungaged sites having basin or climate characteristics outside the reported range of the independent variables are less applicable and could be erroneous. As a result, consideration of these and other limitations requires substantial judgment on the part of the practitioner for reliable application of the regional equations for estimation of natural streamflow statistics in Colorado.
AcknowledgmentsThe authors recognize John England of the Bureau
of Reclamation and William H. Asquith, Kenny Eng, Robert Jarrett, Terry Kenney, Julie Kiang, and Karen Ryberg of the USGS for providing invaluable technical guidance and review for this study and report.
Selected References
Berenbrock, Charles, 2002, Estimating the magnitude of peak flows at selected recurrence intervals for streams in Idaho: U.S. Geological Survey Water-Resources Investigations Report 2002–4170, 59 p.
Bonnin, G., Martin, T., Lin, D., Parzybok, B., Yekta, M., and Riley, D., 2006, Precipitation frequency Atlas of the United States: National Weather Service, National Oceanic and Atmospheric Administration Atlas 14, Volume III, accessed August 16, 2007, at http://www.nws.noaa.gov/oh/hdsc/PF_documents/Atlas2_Volume3.pdf
Colorado Geological Survey, 2003, Ground water atlas of Colorado: Colorado Geological Survey Special Publication Number 53, 210 p.
Colorado State University, 2008, Precipitation map of Colorado: Fort Collins, Colorado State University, accessed July 28, 2008 at http://waterknowledge.colostate.edu/prcp_map.htm

30 Regional Regression Equations for Estimation of Natural Streamflow Statistics in Colorado
Daly, Christopher, Nielson, R.P., and Phillips, D.L., 1994, A statistical-topographic model for mapping climatological precipitation over mountainous terrain: Journal of Applied Meteorology, v. 33, no. 2, p. 140–158, accessed August 15, 2007 at http://www.prism.oregonstate.edu/products/
Daymet Project, daily surface weather and climatological summaries at 1 km resolution over the conterminous United States, accessed August 15, 2007, at http:://www.daymet.org
Fenneman, N.M., 1931, Physiography of the western United States: McGraw-Hill, Inc., New York, 534 p.
Flynn, K.M., Kirby, W.H., and Hummel, P.R., 2006, User’s manual for program PeakFQ, Annual flood frequency analysis using Bulletin 17B guidelines: U.S. Geological Survey Techniques and Methods book 4, chap. B4, 42 p.
Griffis, V.W., and Stedinger, J.R., 2007, The use of GLS regression in regional hydrologic analyses: Journal of Hydrology, v. 344, p. 82–95.
Headman, E.R., Moore, D.O., and Livingston, R.K., 1972, Selected streamflow characteristics as related to channel geometry of perennial streams in Colorado: U.S. Geological Survey Open-File Report 72–160, 24 p.
Helsel, D.R., and Hirsch, R.M., 2002, Statistical methods in water resources: U.S. Geological Survey Techniques of Water-Resources Investigations, book 4, chap. A3, 510 p.
Hortness, J.E., 2006, Estimating low-flow frequency statistics for unregulated streams in Idaho: U.S. Geological Survey Scientific Investigations Report 2006–5035, 31 p.
Hortness, J.E., and Berenbrock, C. 2001, Estimating monthly and annual streamflow statistics at ungaged sites in Idaho: U.S. Geological Survey Water Resources-Investigations Report 2001–4093, 36 p.
Interagency Advisory Committee on Water Data, 1982, Guide-lines for determining flood flow frequency: U.S. Geological Survey, Office of Water Data Coordination, Bulletin 17B of the Hydrology Subcommittee, 183 p.
Jarrett, R.D., and Costa, J.E. , 1988, Evaluation of the flood hydrology in the Colorado Front Range using precipitation, streamflow and paleoflood data for the Big Thompson River basin: U.S. Geological Survey Water-Resources Investiga-tions Report 87–4117, 37 p.
Jarrett, R.D., and Tomlinson, E.M., 2000, Regional interdisci-plinary paleoflood approach to assess extreme flood poten-tial: Water Resources Research, v. 36, no. 10, p. 2957–2984.
Kenney, T.A., Wilkowske, C.D., and Wright, S.J., 2007, Methods for estimating magnitude and frequency of peak flows for natural streams in Utah: U.S. Geological Survey Scientific Investigations Report 2007–5158, 28 p.
Kircher, J.E., Choquette, A.F., and Richter, B.D., 1985, Estimation of natural streamflow characteristics in western Colorado: U.S. Geological Survey Water-Resources Investi-gations Report 85–4086, 28 p.
Livingston, R.K., and Minges, D.R., 1987, Techniques for estimating regional flood characteristics of small rural watersheds in the plains of eastern Colorado: U.S. Geologi-cal Survey Water-Resources Investigations Report 87–4094, 72 p.
Lumb, A.M., Kittle, J.L., and Flynn, K.M., 1990, Users manual for ANNIE—A computer program for interactive hydrologic analyses and data management: U.S. Geological Survey Water-Resources Investigations Report 89–4080, 236 p.
Matthai, H.F., 1968, Magnitude and frequency of floods in the United States—Part 6B, Missouri River Basin below Sioux City, Iowa: U.S. Geological Survey Water-Supply Paper 1680, 491 p.
McCain, J.F., and Jarrett, R.D., 1976, Manual for estimating flood characteristics of natural-flow streams in Colorado: Colorado Water Conservation Board Technical Manual 1, 68 p.
Miller, J.F., Frederick, R.H., and Tracy, R. J., 1973, Precipita-tion frequency Atlas of the United States: National Weather Service, National Oceanic and Atmospheric Administra-tion Atlas 2, Volume 11, accessed August 16, 2007, at http://www.nws.noaa.gov/oh/hdsc/noaaatla2.htm
Miller, K.A., 2003, Peak-flow characteristics of Wyoming streams: U.S. Geological Survey Water-Resources Investi-gations Report 2003–4107, 79 p.
Montgomery, D.C., Peck, E.A., and Vining, G.G., 2001, Introduction to linear regression analysis—Wiley series in probability and statistics: New York, Wiley, 641 p.
Patterson, J.L., 1964, Magnitude and frequency of floods in the United States—Part 7, Lower Mississippi River Basin: U.S. Geological Survey Water-Supply Paper 1681, 636 p.
Patterson, J.L., 1965, Magnitude and frequency of floods in the United States—Part 8, Western Gulf of Mexico basins: U.S. Geological Survey Water-Supply Paper 1682, 506 p.
Patterson, J.L., and Somers, W.P., 1966, Magnitude and frequency of floods in the United States, Part 9—Colorado River Basin: U.S. Geological Survey Water-Supply Paper 1683, 475 p.

Selected References 31
Ries, K.G. III, Steeves, P.A,, Coles, J.D., Rea, A.H., and Stewart, D.W., 2004, StreamStats—A U.S. Geo-logical Survey Web application for stream information: U.S. Geological Survey Fact Sheet 2004–3115.
Riggs, H.C., 1972, Low-flow investigations: U.S. Geologi-cal Survey Techniques of Water-Resources Investigations, book 4, chap. B1, 18 p.
Robson, S.G., and Banta, E.R., 1995, Ground water atlas of the United States, Segment 2—Arizona, Colorado, New Mexico, Utah: U.S. Geological Survey Hydrologic Investigations Atlas 730–C.
Stedinger, J.R., and Tasker, G.D., 1985, Regional hydrologic analysis I—Ordinary, weighted, and generalized least-squares compared: American Geophysical Union, Water Resources Research, v. 21, no. 9, p. 1421–1432.
Tasker, G.D., and Stedinger, J.R., 1986, Regional skew with weighted LS regression: American Society of Civil Engi-neers Journal of Water Resources Planning and Manage-ment, v. 112, no. 2, p. 225–237.
Tasker, G.D., and Stedinger, J.R., 1989, An operational GLS model for hydrologic regression: Journal of Hydrology, v. 111, p. 361–375.
Thomas, B.E., Hjalmarson, H.W., and Waltemeyer, S.D., 1997, Methods for estimating magnitude and frequency of floods in the southwestern United States: U.S. Geological Survey Water-Supply Paper 2433, 195 p.
U.S. Geological Survey, 2007, National elevation dataset, accessed August 13, 2007, at http://ned.usgs.gov/
U.S. Geological Survey, 2008, National Water Information System—NWISWeb: accessed on various dates in 2008 at http://waterdata.usgs.gov
Vaill, J.E., 1999, Analysis of the magnitude and frequency of floods in Colorado: U.S. Geological Survey Water-Resources Investigations Report 99–4190, 35 p.
Waltemeyer, S.D., 2006, Analysis of the magnitude and frequency of peak discharges for the Navajo Nation in Arizona, Utah, Colorado, and New Mexico: U.S. Geological Survey Scientific Investigations Report 2006–5306, 42 p.
Western Regional Climate Center, 2008, Climate of Colo-rado: Western Regional Climate Center, URL accessed on July 28, 2008 at http://www.wrcc.dri.edu/narratives/COLORADO.htm


Supplemental Information


Supplemental Inform
ation
35Table 4. Streamflow-gaging stations used in the development of the regional streamflow regression equations.—Continued
[Peak flow, 2-, 5-, 10-, 25-, 50-, 100-, 200-, and 500-year peak flow; Maximum 7Q2, maximum 7-day, 2-year flow; Maximum 7Q10, maximum 7-day, 10-year flow; Maximum 7Q50, maximum 7-day, 50-year flow; Minimum 7Q2, minimum 7-day, 2-year flow; Minimum 7Q10, minimum 7-day, 10-year flow; Minimum 7Q50, minimum 7-day, 50-year flow; Flow duration, 10-, 25-, 50-, 75-, and 90-percent flow duration; X, station used in the development of regional regression equation for the indicated streamflow characteristic and hydrologic region; --, station not used in the development of regional regression equation for the indicated streamflow characteristic and hydrologic region]
Station number
Station nameHydrologic
region (fig. 1)
Streamflow characteristic
Peak flow
Maximum Minimum Mean flow Flow duration7Q2 7Q10 7Q50 7Q2 7Q10 7Q50 Annual Monthly
06614800 Michigan River near Cameron Pass, CO Mountain X X X X X X X X X X06616000 North Fork Michigan River near Gould, CO Mountain X X X X X X -- X X X06617100 Michigan River at Walden, CO Mountain X X X X X X X X X X06618500 Illinois Creek at Walden, CO Mountain X X X X X X -- X X X06619000 Michigan River near Cowdrey, CO Mountain X X X X X -- -- X X X06620400 Douglas Creek above Keystone, WY Mountain X X X X -- -- -- -- --06621000 Douglas Creek near Foxpark, WY Mountain X X X X X X X X X X06622000 Big Creek at Big Creek Ranger Station, WY Mountain X -- -- -- -- -- -- -- -- --06622500 French Creek near French, WY Mountain X X X X X X X X X X06622700 North Brush Creek near Saratoga, WY Mountain X X X X X X X X X X06623800 Encampment River above Hog Park Creek, near
Encampment, WYMountain X X X X X X X X X X
06624500 Encampment River at Encampment, WY Mountain X -- -- -- -- -- -- X X --06627500 Jack Creek at Matheson Ranch near Saratoga, WY Northwest X -- -- -- -- -- -- X X --06629100 Rattlesnake Creek near Walcott, WY Northwest X -- -- -- -- -- -- -- -- --06630800 Bear Creek near Elk Mountain, WY Mountain X -- -- -- -- -- -- -- -- --06631000 Medicine Bow River near Medicine Bow, WY Northwest X -- -- -- -- -- -- X X --06631100 Wagonhound Creek near Elk Mountain, WY Mountain X -- -- -- -- -- -- -- -- --06632400 Rock Creek above King Canyon Canal, near Arlington, WY Mountain X X X X X X X X X X06696980 Tarryall Creek at Upper Station near Como, CO Mountain X X X X -- -- -- X X X06699005 Tarryall Creek below Rock Creek near Jefferson, CO Mountain X -- -- -- -- -- -- -- -- --06700500 Goose Creek above Cheesman Lake, CO Mountain X -- -- -- -- -- -- -- -- --06706000 North Fork South Platte River below Geneva Creek,
at Grant, CO Mountain X X X X X X X X X X
06707000 North Fork South Platte River at South Platte, CO Plains X -- -- -- -- -- -- -- -- --06709500 Plum Creek near Louviers, CO Plains X -- -- -- -- -- -- -- -- --06710385 Bear Creek above Evergreen, CO Mountain X -- -- -- -- -- -- -- -- --06710400 Cub Creek at Evergreen, CO Mountain X -- -- -- -- -- -- -- -- --06710600 Mount Vernon Creek near Morrison, CO Plains X -- -- -- -- -- -- -- -- --06710990 Parmalee Gulch at Mouth, at Indian Hills, CO Plains X -- -- -- -- -- -- -- -- --06711000 Turkey Creek near Morrison, CO Plains X -- -- -- -- -- -- -- -- --06712000 Cherry Creek near Franktown, CO Plains X -- -- -- -- -- -- -- -- --06716500 Clear Creek near Lawson, CO Mountain X X X X X X X X X X06717400 Chicago Creek below Devils Canyon near Idaho Sprgs CO Mountain X X X X X X X X X X06719500 Clear Creek near Golden, CO Plains X -- -- -- -- -- -- -- -- --06721500 North St. Vrain Creek near Allens Park, CO Mountain X X X X X X X X X X06722500 South St. Vrain Creek near Ward, CO Mountain X X X X X X X X X X06723000 Middle St. Vrain Creek near Allens Park, CO Mountain X X X X -- -- -- X X X06725500 Middle Boulder Creek at Nederland, CO Mountain X X X X X X X X X X

36
Regional Regression Equations for Estimation of N
atural Streamflow
Statistics in ColoradoTable 4. Streamflow-gaging stations used in the development of the regional streamflow regression equations.—Continued
[Peak flow, 2-, 5-, 10-, 25-, 50-, 100-, 200-, and 500-year peak flow; Maximum 7Q2, maximum 7-day, 2-year flow; Maximum 7Q10, maximum 7-day, 10-year flow; Maximum 7Q50, maximum 7-day, 50-year flow; Minimum 7Q2, minimum 7-day, 2-year flow; Minimum 7Q10, minimum 7-day, 10-year flow; Minimum 7Q50, minimum 7-day, 50-year flow; Flow duration, 10-, 25-, 50-, 75-, and 90-percent flow duration; X, station used in the development of regional regression equation for the indicated streamflow characteristic and hydrologic region; --, station not used in the development of regional regression equation for the indicated streamflow characteristic and hydrologic region]
Station number
Station nameHydrologic
region (fig. 1)
Streamflow characteristic
Peak flow
Maximum Minimum Mean flow Flow duration7Q2 7Q10 7Q50 7Q2 7Q10 7Q50 Annual Monthly
06726900 Bummers Gulch near El Vado, CO Plains X -- -- -- -- -- -- -- -- --06729000 South Boulder Creek near Rollinsville, CO Mountain X X X X X X X X X X06730300 Coal Creek near Plainview, CO Plains X -- -- -- -- -- -- -- -- --06732000 Glacier Creek near Estes Park, CO Mountain X X X X X X X X X X06739500 Buckhorn Creek near Masonville, CO Plains X -- -- -- -- -- -- -- -- --06748200 Fall Creek near Rustic, CO Mountain X X X X X X X X X X06748510 Little Beaver Creek near Idylwilde, CO Mountain X X X X X X X X X X06748530 Little Beaver Creek near Rustic, CO Mountain X X X X X X X X X X06748600 South Fork Cache La Poudre River near Rustic, CO Mountain X X X X X X X X X X06755000 South Crow Creek near Hecla, WY Plains X -- -- -- -- -- -- X X --06758200 Kiowa Creek at Kiowa, CO Plains X -- -- -- -- -- -- -- -- --06758250 Kiowa Creek Tributary near Bennett, CO Plains X -- -- -- -- -- -- -- -- --06758700 Middle Bijou Creek Tributary near Deer Trail, CO Plains X -- -- -- -- -- -- -- -- --06761900 Lodgepole Creek Tributary near Pine Bluffs, WY Plains X -- -- -- -- -- -- -- -- --06762500 Lodgepole Creek at Bushnell, Nebr. Plains X -- -- -- -- -- -- -- -- --06762600 Lodgepole Creek Tributary No. 2 near Albin, WY Plains X -- -- -- -- -- -- -- -- --06821300 North Fork Arikaree River Tributary near Shaw, CO Plains X -- -- -- -- -- -- -- -- --06821400 North Fork Black Wolf Creek near Vernon, CO Plains X -- -- -- -- -- -- -- -- --06823500 Buffalo Creek near Haigler, NE Plains X -- -- -- -- -- -- -- -- --06825500 Landsman Creek near Hale, CO Plains X -- -- -- -- -- -- -- -- --06844700 South Fork Sappa Creek near Brewster, KS Plains X -- -- -- -- -- -- -- -- --06844800 South Fork Sappa Creek Tributary near Goodland, KS Plains X -- -- -- -- -- -- -- -- --06858500 North Fork Smoky Hill River near Mcallaster, KS Plains X -- -- -- -- -- -- -- -- --07079500 East Fork Arkansas River near Leadville, CO Mountain X X X X X X X X X X07081000 Tennessee Creek near Leadville, CO Mountain X X X X X X X X X X07082000 Lake Fork above Sugar Loaf Reservoir, CO Mountain X X X X X X X X X X07083000 Halfmoon Creek near Malta, CO Mountain X X X X X X X X X X07089000 Cottonwood C below Hot Springs, near Buena Vista, CO Mountain X -- -- -- -- -- -- -- -- --07091000 Chalk Creek near Nathrop, CO Mountain X -- -- -- -- -- -- -- -- --07093500 South Arkansas River near Salida, CO Mountain X -- -- -- -- -- -- -- -- --07093775 Badger Creek, Lower Station, near Howard, CO Plains X -- -- -- -- -- -- -- -- --07095000 Grape Creek near Westcliffe, CO Plains X -- -- -- -- -- -- -- -- --07096500 Fourmile Creek near Canon City, CO Plains X -- -- -- -- -- -- -- -- --07099100 Beaver Creek near Portland, CO Plains X -- -- -- -- -- -- -- -- --07099230 Turkey Creek above Teller Reservoir near Stone City, CO Plains X -- -- -- -- -- -- -- -- --07105920 Little Fountain Creek above Keaton Reservoir, near
Fort Carson, CO Plains X -- -- -- -- -- -- -- -- --
07105945 Rock Creek above Fort Carson Reservation, CO Plains X -- -- -- -- -- -- -- -- --07107500 St. Charles River at Burnt Mill, CO Plains X -- -- -- -- -- -- -- -- --
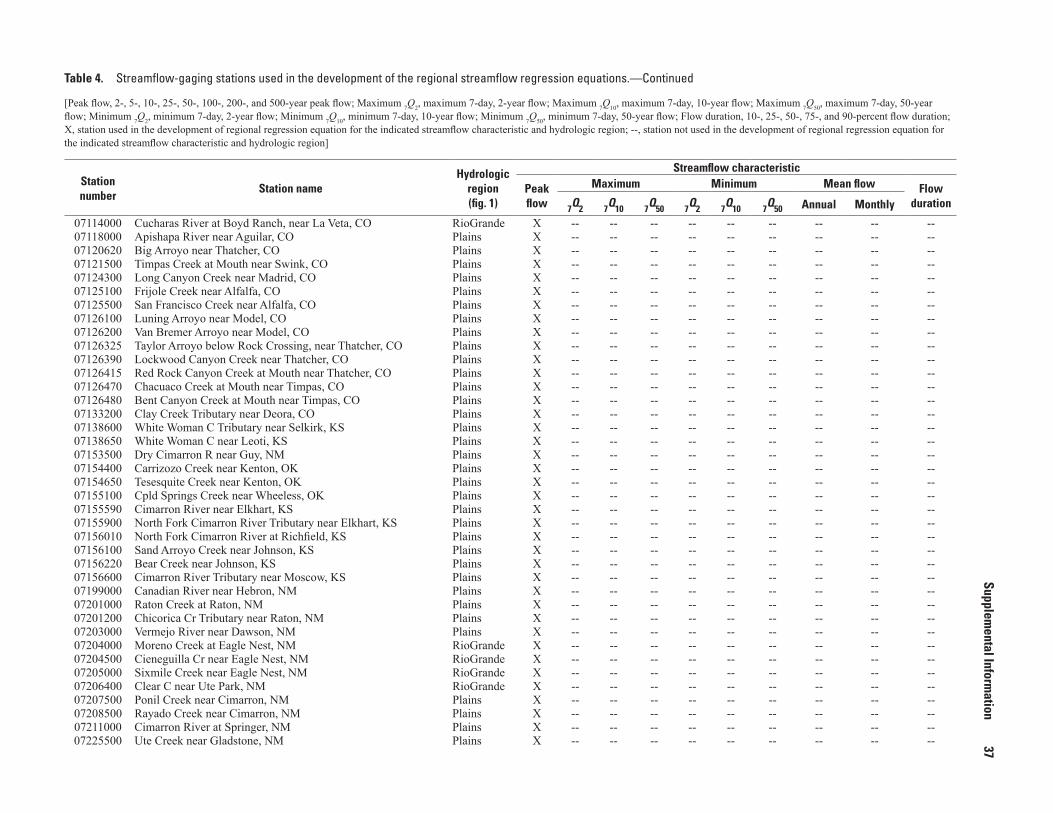
Supplemental Inform
ation
37Table 4. Streamflow-gaging stations used in the development of the regional streamflow regression equations.—Continued
[Peak flow, 2-, 5-, 10-, 25-, 50-, 100-, 200-, and 500-year peak flow; Maximum 7Q2, maximum 7-day, 2-year flow; Maximum 7Q10, maximum 7-day, 10-year flow; Maximum 7Q50, maximum 7-day, 50-year flow; Minimum 7Q2, minimum 7-day, 2-year flow; Minimum 7Q10, minimum 7-day, 10-year flow; Minimum 7Q50, minimum 7-day, 50-year flow; Flow duration, 10-, 25-, 50-, 75-, and 90-percent flow duration; X, station used in the development of regional regression equation for the indicated streamflow characteristic and hydrologic region; --, station not used in the development of regional regression equation for the indicated streamflow characteristic and hydrologic region]
Station number
Station nameHydrologic
region (fig. 1)
Streamflow characteristic
Peak flow
Maximum Minimum Mean flow Flow duration7Q2 7Q10 7Q50 7Q2 7Q10 7Q50 Annual Monthly
07114000 Cucharas River at Boyd Ranch, near La Veta, CO RioGrande X -- -- -- -- -- -- -- -- --07118000 Apishapa River near Aguilar, CO Plains X -- -- -- -- -- -- -- -- --07120620 Big Arroyo near Thatcher, CO Plains X -- -- -- -- -- -- -- -- --07121500 Timpas Creek at Mouth near Swink, CO Plains X -- -- -- -- -- -- -- -- --07124300 Long Canyon Creek near Madrid, CO Plains X -- -- -- -- -- -- -- -- --07125100 Frijole Creek near Alfalfa, CO Plains X -- -- -- -- -- -- -- -- --07125500 San Francisco Creek near Alfalfa, CO Plains X -- -- -- -- -- -- -- -- --07126100 Luning Arroyo near Model, CO Plains X -- -- -- -- -- -- -- -- --07126200 Van Bremer Arroyo near Model, CO Plains X -- -- -- -- -- -- -- -- --07126325 Taylor Arroyo below Rock Crossing, near Thatcher, CO Plains X -- -- -- -- -- -- -- -- --07126390 Lockwood Canyon Creek near Thatcher, CO Plains X -- -- -- -- -- -- -- -- --07126415 Red Rock Canyon Creek at Mouth near Thatcher, CO Plains X -- -- -- -- -- -- -- -- --07126470 Chacuaco Creek at Mouth near Timpas, CO Plains X -- -- -- -- -- -- -- -- --07126480 Bent Canyon Creek at Mouth near Timpas, CO Plains X -- -- -- -- -- -- -- -- --07133200 Clay Creek Tributary near Deora, CO Plains X -- -- -- -- -- -- -- -- --07138600 White Woman C Tributary near Selkirk, KS Plains X -- -- -- -- -- -- -- -- --07138650 White Woman C near Leoti, KS Plains X -- -- -- -- -- -- -- -- --07153500 Dry Cimarron R near Guy, NM Plains X -- -- -- -- -- -- -- -- --07154400 Carrizozo Creek near Kenton, OK Plains X -- -- -- -- -- -- -- -- --07154650 Tesesquite Creek near Kenton, OK Plains X -- -- -- -- -- -- -- -- --07155100 Cpld Springs Creek near Wheeless, OK Plains X -- -- -- -- -- -- -- -- --07155590 Cimarron River near Elkhart, KS Plains X -- -- -- -- -- -- -- -- --07155900 North Fork Cimarron River Tributary near Elkhart, KS Plains X -- -- -- -- -- -- -- -- --07156010 North Fork Cimarron River at Richfield, KS Plains X -- -- -- -- -- -- -- -- --07156100 Sand Arroyo Creek near Johnson, KS Plains X -- -- -- -- -- -- -- -- --07156220 Bear Creek near Johnson, KS Plains X -- -- -- -- -- -- -- -- --07156600 Cimarron River Tributary near Moscow, KS Plains X -- -- -- -- -- -- -- -- --07199000 Canadian River near Hebron, NM Plains X -- -- -- -- -- -- -- -- --07201000 Raton Creek at Raton, NM Plains X -- -- -- -- -- -- -- -- --07201200 Chicorica Cr Tributary near Raton, NM Plains X -- -- -- -- -- -- -- -- --07203000 Vermejo River near Dawson, NM Plains X -- -- -- -- -- -- -- -- --07204000 Moreno Creek at Eagle Nest, NM RioGrande X -- -- -- -- -- -- -- -- --07204500 Cieneguilla Cr near Eagle Nest, NM RioGrande X -- -- -- -- -- -- -- -- --07205000 Sixmile Creek near Eagle Nest, NM RioGrande X -- -- -- -- -- -- -- -- --07206400 Clear C near Ute Park, NM RioGrande X -- -- -- -- -- -- -- -- --07207500 Ponil Creek near Cimarron, NM Plains X -- -- -- -- -- -- -- -- --07208500 Rayado Creek near Cimarron, NM Plains X -- -- -- -- -- -- -- -- --07211000 Cimarron River at Springer, NM Plains X -- -- -- -- -- -- -- -- --07225500 Ute Creek near Gladstone, NM Plains X -- -- -- -- -- -- -- -- --

38
Regional Regression Equations for Estimation of N
atural Streamflow
Statistics in ColoradoTable 4. Streamflow-gaging stations used in the development of the regional streamflow regression equations.—Continued
[Peak flow, 2-, 5-, 10-, 25-, 50-, 100-, 200-, and 500-year peak flow; Maximum 7Q2, maximum 7-day, 2-year flow; Maximum 7Q10, maximum 7-day, 10-year flow; Maximum 7Q50, maximum 7-day, 50-year flow; Minimum 7Q2, minimum 7-day, 2-year flow; Minimum 7Q10, minimum 7-day, 10-year flow; Minimum 7Q50, minimum 7-day, 50-year flow; Flow duration, 10-, 25-, 50-, 75-, and 90-percent flow duration; X, station used in the development of regional regression equation for the indicated streamflow characteristic and hydrologic region; --, station not used in the development of regional regression equation for the indicated streamflow characteristic and hydrologic region]
Station number
Station nameHydrologic
region (fig. 1)
Streamflow characteristic
Peak flow
Maximum Minimum Mean flow Flow duration7Q2 7Q10 7Q50 7Q2 7Q10 7Q50 Annual Monthly
07227295 Sandy Arroyo Tributary near Clayton, NM Plains X -- -- -- -- -- -- -- -- --07232500 Beaver River near Guymon, OK Plains X -- -- -- -- -- -- -- -- --07232650 Aqua Frio Creek near Felt, OK Plains X -- -- -- -- -- -- -- -- --08216500 Willow Creek at Creede, CO RioGrande X X X X X X X X X X08218500 Goose Creek at Wagonwheel Gap, CO RioGrande X X X X X X X X X X08219500 South Fork Rio Grande at South Fork, CO RioGrande X X X X X X X X X X08220500 Pinos Creek near Del Norte, CO RioGrande X X X X X X X X X X08223500 Rock Creek near Monte Vista, CO RioGrande X X X X X X X X X X08224500 Kerber Cr above Little Kerber Cr near Villa Grove, CO RioGrande X X X X X X -- X X X08227000 Saguache Creek near Saguache, CO RioGrande X X X X X X X X X X08227500 North Crestone Creek near Crestone, CO RioGrande X X X X X X X X X X08230500 Carnero Creek near La Garita, CO RioGrande X X X X X X -- X X X08231000 La Garita Creek near La Garita, CO RioGrande X X X X X X X X X X08236000 Alamosa River above Terrace Reservoir, CO RioGrande X X X X X X X X X X08240500 Trinchera C above Turners Ranch, Nr Ft Garland, CO RioGrande X X X X X X X X X X08241500 Sangre De Cristo Creek near Fort Garland, CO RioGrande X X X X X -- -- X X X08242500 Ute Creek near Fort Garland, CO RioGrande X X X X X X -- X X X08245500 Conejos River at Platoro, CO RioGrande X X X X X X X X X X08246500 Conejos River near Mogote, CO RioGrande X X X X X X X X X X08247500 San Antonio River at Ortiz, CO RioGrande X X X X -- -- -- X X X08248000 Los Pinos River near Ortiz, CO RioGrande X X X X X X X X X X08248500 San Antonio River at Mouth, near Manassa, CO RioGrande X X X X -- -- -- X X X08252500 Costilla Creek above Costilla Dam, NM RioGrande X -- -- -- -- -- -- -- X --08253000 Casias Creek near Costilla, NM RioGrande X -- -- -- -- -- -- -- X --08253500 Santistevan Creek near Costilla, NM RioGrande X -- -- -- -- -- -- -- X --08255000 Ute Creek near Amalia, NM RioGrande X -- -- -- -- -- -- -- X --08263000 Latir Creek near Cerro, NM RioGrande X -- -- -- -- -- -- X X X08264000 Red River near Red River, NM RioGrande X X X X X X X X X X08265000 Red River near Questa, NM RioGrande X X X X X X X X X X08267500 Rio Hondo near Valdez, NM RioGrande X X X X X X X X X X08268500 Arroyo Hondo at Arroyo Hondo, NM RioGrande X X X X X X X X X X08269000 Rio Pueblo De Taos near Taos, NM RioGrande X X X X X X X X X X08275000 Rio Fernando De Taos near Taos, NM RioGrande X X X X X X X X X X08275500 Rio Grande Del Rancho near Talpa, NM RioGrande X X X X X X X X X X08275600 Rio Chiquito near Talpa, NM RioGrande X X X X X X X X X X08281200 Wolf Creek near Chama, NM RioGrande X -- -- -- -- -- -- -- -- --08284000 Rito De Tierra Amarilla at Tierra Amar, NM RioGrande X -- -- -- -- -- -- -- -- --08284100 Rio Chama near La Puente, NM RioGrande X X X X X X X X X X08284500 Willow Creek near Park View, NM RioGrande X X X X -- -- -- X X X

Supplemental Inform
ation
39Table 4. Streamflow-gaging stations used in the development of the regional streamflow regression equations.—Continued
[Peak flow, 2-, 5-, 10-, 25-, 50-, 100-, 200-, and 500-year peak flow; Maximum 7Q2, maximum 7-day, 2-year flow; Maximum 7Q10, maximum 7-day, 10-year flow; Maximum 7Q50, maximum 7-day, 50-year flow; Minimum 7Q2, minimum 7-day, 2-year flow; Minimum 7Q10, minimum 7-day, 10-year flow; Minimum 7Q50, minimum 7-day, 50-year flow; Flow duration, 10-, 25-, 50-, 75-, and 90-percent flow duration; X, station used in the development of regional regression equation for the indicated streamflow characteristic and hydrologic region; --, station not used in the development of regional regression equation for the indicated streamflow characteristic and hydrologic region]
Station number
Station nameHydrologic
region (fig. 1)
Streamflow characteristic
Peak flow
Maximum Minimum Mean flow Flow duration7Q2 7Q10 7Q50 7Q2 7Q10 7Q50 Annual Monthly
08286650 Canjilon Creek above Abiquiu Reservoir, NM RioGrande X -- -- -- -- -- -- -- -- --08288000 El Rito near El Rito, NM RioGrande X X X X X X X X X X08289000 Rio Ojo Caliente at La Madera, NM RioGrande X X X X X X X X X X09012500 North Inlet at Grand Lake, CO Mountain X X X X X X X X X X09016500 Arapaho Creek at Monarch Lake Outlet, CO Mountain X X X X X X X X X X09020000 Willow Creek near Granby, CO Mountain X X X X -- -- -- X X X09024000 Fraser River at Winter Park, CO Mountain X X X X X X X X X X09026500 St. Louis Creek near Fraser, CO Mountain X X X X X X X X X X09032000 Ranch Creek near Fraser, CO Mountain X X X X X X X X X X09032500 Ranch Creek near Tabernash, CO Mountain X X X X X X -- X X X09033000 Meadow Creek near Tabernash, CO Mountain X X X X X X X X X X09033500 Strawberry Creek near Granby, CO Mountain X X X X X -- -- X X X09034000 Fraser River at Granby, CO Mountain X X X X X X X X X X09034500 Colorado River at Hot Sulphur Springs, CO Mountain X X X X X X X X X X09034900 Bobtail Creek near Jones Pass, CO Mountain X X X X X X X X X X09035500 Williams Fork below Steelman Creek, CO Mountain X X X X X X X X X X09035700 Williams Fork above Darling Creek, Nr Leal, CO Mountain X X X X X X X X X X09035800 Darling Creek near Leal, CO Mountain X X X X X X X X X X09035900 South Fork of Williams Fork near Leal, CO Mountain X X X X X X X X X X09036500 Keyser Creek near Leal, CO Mountain X X X X X X X X X X09039000 Troublesome Creek near Pearmont, CO Mountain X X X X X X X X X X09040000 East Fork Troublesome Creek near Troublesome, CO Mountain X X X X X X X X X X09041100 Antelope Creek near Kremmling, CO Mountain X X X X X X -- X X X09046530 French Gulch at Breckenridge, CO Mountain X X X X X X X X X X09047000 Blue River at Dillon, CO Mountain X X X X X X X X X X09047500 Snake River near Montezuma, CO Mountain X X X X X X X X X X09047700 Keystone Gulch near Dillon, CO Mountain X X X X X X X X X X09050100 Ten Mile Creek below North Ten Mile Creek, at Frisco, CO Mountain X X X X X X X X X X09052400 Boulder Creek at Upper Station, near Dillon, CO Mountain X X X X X X X X X X09052800 Slate Creek at Upper Station, near Dillon, CO Mountain X X X X X X X X X X09055000 Otter Creek above Green Mountain Reservoir, CO Mountain X X X X X X X X X X09058610 Dickson Creek near Vail, CO Mountain X X X X X -- -- X X X09058700 Freeman Creek near Minturn, CO Mountain X X X X X -- -- X X X09058800 East Meadow Creek near Minturn CO Mountain X X X X X X X X X X09059500 Piney River near State Bridge, CO Northwest X X X X X X X X X X09060500 Rock Creek near Toponas, CO Mountain X X X X X X X X X X09063200 Wearyman Creek near Red Cliff, CO Mountain X X X X X X X X X X09063400 Turkey Creek near Red Cliff, CO Mountain X X X X X X X X X X09064500 Homestake Creek near Red Cliff, CO Mountain X X X X X X X X X X

40
Regional Regression Equations for Estimation of N
atural Streamflow
Statistics in ColoradoTable 4. Streamflow-gaging stations used in the development of the regional streamflow regression equations.—Continued
[Peak flow, 2-, 5-, 10-, 25-, 50-, 100-, 200-, and 500-year peak flow; Maximum 7Q2, maximum 7-day, 2-year flow; Maximum 7Q10, maximum 7-day, 10-year flow; Maximum 7Q50, maximum 7-day, 50-year flow; Minimum 7Q2, minimum 7-day, 2-year flow; Minimum 7Q10, minimum 7-day, 10-year flow; Minimum 7Q50, minimum 7-day, 50-year flow; Flow duration, 10-, 25-, 50-, 75-, and 90-percent flow duration; X, station used in the development of regional regression equation for the indicated streamflow characteristic and hydrologic region; --, station not used in the development of regional regression equation for the indicated streamflow characteristic and hydrologic region]
Station number
Station nameHydrologic
region (fig. 1)
Streamflow characteristic
Peak flow
Maximum Minimum Mean flow Flow duration7Q2 7Q10 7Q50 7Q2 7Q10 7Q50 Annual Monthly
09065100 Cross Creek near Minturn, CO Mountain X X X X X X X X X X09065500 Gore Creek at Upper Station, near Minturn, CO Mountain X X X X X X X X X X09066000 Black Gore Creek near Minturn, CO Mountain X X X X X X X X X X09066100 Bighorn Creek near Minturn, CO Mountain X X X X X X X X X X09066150 Pitkin Creek near Minturn, CO Mountain X X X X X X X X X X09066200 Booth Creek near Minturn, CO Mountain X X X X X X X X X X09066300 Middle Creek near Minturn, CO Mountain X X X X X X X X X09066400 Red Sandstone Creek near Minturn, CO Mountain X X X X X X X X X X09066500 Gore Creek near Minturn, CO Mountain X X X X X X X X X X09067005 Eagle River at Avon, CO Mountain X X X X X X X X X X09068000 Brush Creek near Eagle, CO Mountain X X X X X X X X X X09069500 Gypsum Creek near Gypsum, CO Mountain X X X X X X X X X X09070000 Eagle River below Gypsum, CO Mountain X X X X X X X X X X09071300 Grizzly Creek near Glenwood Springs, CO Mountain X X X X X -- -- X X X09073500 Roaring Fork River at Aspen, CO Mountain X X X X X X X X X X09073700 Hunter Creek above Midway Creek, near Aspen, CO Mountain X X X X X X X X X X09073800 Midway Creek near Aspen, CO Mountain X X X X X X X X X X09073900 No Name Creek near Aspen, CO Mountain X X X X X X X X X X09074000 Hunter Creek near Aspen, CO Mountain X X X X X X X X X X09074800 Castle Creek Above Aspen, CO Mountain X X X X X X X X X X09075700 Maroon Creek Above Aspen, CO Mountain X X X X X X X X X X09077200 Fryingpan River near Ivanhoe Lake, CO Mountain X X X X X X X X X X09077800 South Fork Fryingpan River at Upper Station, near Norrie, CO Mountain X X X X X X X X X X09078000 Fryingpan River at Norrie, CO Mountain X X X X X X X X X X09078100 North Fork Fryingpan River above Cunningham C, near
Norrie, CO Mountain X X X X X X X X X X
09078200 Cunningham Creek near Norrie, CO Mountain X X X X X X X X X X09078500 North Fork Fryingpan River near Norrie, CO Mountain X X X X X X X X X X09080300 Rocky Fork Creek near Meredith, CO Mountain X X X X X X X X X X09081600 Crystal River above Avalanche Creek, near Redstone, CO Northwest X X X X X X X X X X09082800 North Thompson Creek near Carbondale, CO Mountain X X X X X X X X X X09083000 Thompson Creek near Carbondale, CO Northwest X X X X X X X X X X09084000 Cattle Creek near Carbondale, CO Mountain X X X X X X X X X X09085200 Canyon Creek above New Castle, CO Northwest X X X X X X X X X X09085300 East Canyon Creek near New Castle, CO Northwest X X X X X X X X X X09085400 Possum Creek near New Castle, CO Northwest X X X X X X X X X X09089500 West Divide Creek near Raven, CO Mountain X X X X X -- -- X X X09091100 Mamm Creek near Silt, CO Northwest X -- -- -- -- -- -- -- -- --09091500 East Rifle Creek near Rifle, CO Northwest X X X X X X X X X X

Supplemental Inform
ation
41Table 4. Streamflow-gaging stations used in the development of the regional streamflow regression equations.—Continued
[Peak flow, 2-, 5-, 10-, 25-, 50-, 100-, 200-, and 500-year peak flow; Maximum 7Q2, maximum 7-day, 2-year flow; Maximum 7Q10, maximum 7-day, 10-year flow; Maximum 7Q50, maximum 7-day, 50-year flow; Minimum 7Q2, minimum 7-day, 2-year flow; Minimum 7Q10, minimum 7-day, 10-year flow; Minimum 7Q50, minimum 7-day, 50-year flow; Flow duration, 10-, 25-, 50-, 75-, and 90-percent flow duration; X, station used in the development of regional regression equation for the indicated streamflow characteristic and hydrologic region; --, station not used in the development of regional regression equation for the indicated streamflow characteristic and hydrologic region]
Station number
Station nameHydrologic
region (fig. 1)
Streamflow characteristic
Peak flow
Maximum Minimum Mean flow Flow duration7Q2 7Q10 7Q50 7Q2 7Q10 7Q50 Annual Monthly
09092000 Rifle Creek near Rifle, CO Northwest X X X X X X X X X X09092500 Beaver Creek near Rifle, CO Northwest X X X X X X X X X X09093000 Parachute Creek near Parachute CO Northwest X X X X X -- -- X X X09095000 Roan Creek near De Beque, CO Northwest X X X X X X X X X X09096000 Plateau Creek at Upper Station, near Collbran, CO Mountain X X X X X X -- X X X09096500 Plateau Creek near Collbran, CO Mountain X X X X X X X X X X09096800 Buzzard Creek below Owens Creek, near Heiberger, CO Mountain X X X X -- -- -- X X X09097500 Buzzard Creek near Collbran, CO Mountain X X X X X X -- X X X09097600 Brush Creek near Collbran, CO Mountain X X X X X X X X X X09104500 Mesa Creek near Mesa, CO Northwest X X X X X X X X X X09107000 Taylor River at Taylor Park, CO Mountain X X X X X X X X X X09110000 Taylor River at Almont, CO Mountain X X X X X X X X X X09110500 East River near Crested Butte, CO Mountain X X X X X X X X X X09111500 Slate River near Crested Butte, CO Mountain X X X X X X X X X X09112000 Cement Creek near Crested Butte, CO Mountain X X X X X X X X X X09112500 East River at Almont CO Mountain X X X X X X X X X X09113300 Ohio Creek at Baldwin, CO Mountain X X X X X X X X X X09113500 Ohio Creek near Baldwin, CO Mountain X X X X X X X X X X09114500 Gunnison River near Gunnison, CO Mountain X X X X X X X X X X09115500 Tomichi Creek at Sargents, CO Mountain X X X X X X X X X X09117000 Tomichi Creek at Parlin, CO Mountain X X X X X X X X X X09118000 Quartz Creek near Ohio City, CO Mountain X X X X X X X X X X09119000 Tomichi Creek at Gunnison, CO Mountain X X X X X X X X X X09122000 Cebolla Creek at Powderhorn, CO Mountain X X X X X X X X X X09122500 Soap Creek near Sapinero, CO Mountain X X X X X X X X X X09123500 Lake Fork at Lake City, CO Mountain X X X X X X X X X X09124500 Lake Fork at Gateview, CO Mountain X X X X X X X X X X09125000 Curecanti Creek near Sapinero, CO Mountain X X X X X X X X X X09126000 Cimarron River near Cimarron, CO Mountain X X X X X X X X X X09127500 Crystal Creek near Maher, CO Mountain X X X X X X X X X X09128500 Smith Fork near Crawford, CO Northwest X X X X X X X X X X09130500 East Muddy Creek near Bardine, CO Northwest X X X X X X X X X X09130600 West Muddy Creek near Ragged Mountain, CO Mountain X X X X X X X X X X09132500 North Fork Gunnison River near Somerset, CO Northwest X X X X X X X X X X09132900 West Hubbard Creek near Paonia, CO Mountain X X X X X X X X X X09134500 Leroux Creek near Cedaredge, CO Northwest X X X X X X X X X X09136200 Gunnison River near Lazear, CO Northwest X X X X X X X X X X09137800 Dirty George Creek near Grand Mesa, CO Northwest X X X X X X X X X X09139200 Ward Creek near Grand Mesa, CO Mountain X X X X X X X X X X

42
Regional Regression Equations for Estimation of N
atural Streamflow
Statistics in ColoradoTable 4. Streamflow-gaging stations used in the development of the regional streamflow regression equations.—Continued
[Peak flow, 2-, 5-, 10-, 25-, 50-, 100-, 200-, and 500-year peak flow; Maximum 7Q2, maximum 7-day, 2-year flow; Maximum 7Q10, maximum 7-day, 10-year flow; Maximum 7Q50, maximum 7-day, 50-year flow; Minimum 7Q2, minimum 7-day, 2-year flow; Minimum 7Q10, minimum 7-day, 10-year flow; Minimum 7Q50, minimum 7-day, 50-year flow; Flow duration, 10-, 25-, 50-, 75-, and 90-percent flow duration; X, station used in the development of regional regression equation for the indicated streamflow characteristic and hydrologic region; --, station not used in the development of regional regression equation for the indicated streamflow characteristic and hydrologic region]
Station number
Station nameHydrologic
region (fig. 1)
Streamflow characteristic
Peak flow
Maximum Minimum Mean flow Flow duration7Q2 7Q10 7Q50 7Q2 7Q10 7Q50 Annual Monthly
09140200 Kiser Creek near Grand Mesa, CO Mountain X X X X X X X X X X09141200 Youngs Creek near Grand Mesa, CO Northwest X X X X X X X X X X09143500 Surface Creek at Cedaredge, CO Northwest X X X X X X X X X X09144200 Tongue Creek at Cory, CO Northwest X X X X X X X X X X09146000 Uncompahgre River below Ouray, CO Southwest X X X X X X X X X X09146400 West Fork Dallas Creek near Ridgway, CO Southwest X X X X X X X X X X09146500 East Fork Dallas Creek near Ridgway, CO Southwest X X X X X X X X X X09146600 Pleasant Valley Creek near Noel, CO Southwest X X X X X X X X X09147000 Dallas Creek near Ridgway, CO Southwest X X X X X X X X X X09147100 Cow Creek near Ridgway, CO Mountain X X X X X X X X X X09149450 Dry Creek near Olathe, CO Northwest X -- -- -- -- -- -- -- -- --09150500 Roubideau Creek at Mouth, near Delta, CO Northwest X X X X X X X X X X09153400 West Salt Creek near Mack, CO Northwest X X X X -- -- -- X X X09163700 Cisco Wash near Cisco, UT Southwest X -- -- --09165000 Dolores River below Rico, CO Southwest X X X X -- -- -- X X X09166500 Dolores River at Dolores, CO Southwest X X X X X X X X X X09168100 Disappointment Creek near Dove Creek, CO Southwest X X X X X -- -- X X X09168700 Disappointment Creek Tributary near Slick Rock, CO Southwest X -- -- -- -- -- -- -- -- --09169500 Dolores River at Bedrock, CO Southwest X X X X X X X X X X09172000 Fall Creek near Fall Creek, CO Southwest X X X X X X X X X X09172500 San Miguel River near Placerville, CO Southwest X X X X X X X X X X09174500 Cottonwood Creek near Nucla, CO Southwest X X X X -- -- X X X09175000 West Naturita Creek near Norwood, CO Southwest X X X X X -- -- X X X09175500 San Miguel River at Naturita, CO Southwest X X X X X X X X X X09177500 Taylor Creek near Gateway, CO Southwest X -- -- -- -- -- -- -- -- --09181000 Onion Creek near Moab, UT Southwest X X X X X X X X X X09182000 Castle Creek above Diversions, near Moab, UT Southwest X X X X X -- -- X X X09182600 Salt Wash near Thompson, UT Southwest X -- -- -- -- -- -- -- -- --09183000 Courthouse Wash near Moab, UT Southwest X X X X X -- -- X X X09184000 Mill Creek near Moab, UT Southwest X X X X X X X X X X09185200 Kane Springs Canyon near Moab, UT Southwest X -- -- -- -- -- -- -- -- --09185500 Hatch Wash near La Sal, UT Southwest X X X X -- -- -- X X X09187000 Cottonwood Creek near Monticello, UT Southwest X X X X -- -- -- X X X09216400 Greasewood Canyon near Green River, WY Northwest X -- -- -- -- -- -- -- -- --09216537 Delaney Draw near Red Desert, WY Northwest X -- -- -- -- -- -- -- -- --09216550 Deadman Wash near Point of Rocks, WY Northwest X -- -- -- -- -- -- -- -- --09216600 Cutthroat Draw near Rock Springs, WY Northwest X -- -- -- -- -- -- -- -- --09216700 Salt Wells Creek near Rock Springs, WY Northwest X -- -- -- -- -- -- -- -- --09216900 Bitter Cr Tributary near Green River WY Northwest X -- -- -- -- -- -- -- -- --

Supplemental Inform
ation
43Table 4. Streamflow-gaging stations used in the development of the regional streamflow regression equations.—Continued
[Peak flow, 2-, 5-, 10-, 25-, 50-, 100-, 200-, and 500-year peak flow; Maximum 7Q2, maximum 7-day, 2-year flow; Maximum 7Q10, maximum 7-day, 10-year flow; Maximum 7Q50, maximum 7-day, 50-year flow; Minimum 7Q2, minimum 7-day, 2-year flow; Minimum 7Q10, minimum 7-day, 10-year flow; Minimum 7Q50, minimum 7-day, 50-year flow; Flow duration, 10-, 25-, 50-, 75-, and 90-percent flow duration; X, station used in the development of regional regression equation for the indicated streamflow characteristic and hydrologic region; --, station not used in the development of regional regression equation for the indicated streamflow characteristic and hydrologic region]
Station number
Station nameHydrologic
region (fig. 1)
Streamflow characteristic
Peak flow
Maximum Minimum Mean flow Flow duration7Q2 7Q10 7Q50 7Q2 7Q10 7Q50 Annual Monthly
09224810 Blacks Fork Tributary No 2 near Green River, WY Northwest X -- -- -- -- -- -- -- -- --09224820 Blacks Fork Tributary No 3 near Green River, WY Northwest X -- -- -- -- -- -- -- -- --09224840 Blacks Fork Tributary No 4 near Green River, WY Northwest X -- -- -- -- -- -- -- -- --09224980 Summers Dry Creek near Green River, WY Northwest X -- -- -- -- -- -- -- -- --09225200 Squaw Hollow near Burntfork, WY Northwest X -- -- -- -- -- -- -- -- --09225300 Green River Tributary No 2 near Burntfork, WY Northwest X -- -- -- -- -- -- -- -- --09229450 Henrys Fork Tributary near Manila, UT Northwest X -- -- -- -- -- -- -- -- --09235600 Pot Creek Above Diversions, near Vernal, UT Northwest X X X X -- -- -- X X X09238500 Walton Creek near Steamboat Springs, CO Northwest X X X X X X X X X X09239500 Yampa River at Steamboat Springs, CO Northwest X X X X X X X X X X09241000 Elk River at Clark, CO Mountain X X X X X X X X X X09244100 Fish Creek near Milner, CO Northwest X X X X X X X X X X09245000 Elkhead Creek near Elkhead, CO Northwest X X X X X X -- X X X09245500 North Fork Elkhead Creek near Elkhead, CO Northwest X X X X X -- -- X X X09249000 East Fork Williams Fork near Pagoda, CO Northwest X X X X X X X X X X09250000 Milk Creek near Thornburgh, CO Northwest X -- -- -- -- -- -- -- -- --09251500 Middle Fork Little Snake River near Battle Creek, CO Northwest X X X X X X X X X X09251800 North Fork Little Snake River near Encampment, WY Northwest X X X X X X X X X X09253000 Little Snake River near Slater, CO Northwest X X X X X X X X X X09253400 Battle Creek near Encampment, WY Northwest X X X X X X X -- -- --09255000 Slater Fork near Slater, CO Northwest X X X X X X X X X X09256000 Savery Creek near Savery, WY Northwest X X X X X X -- X X X09257000 Little Snake River near Dixon, WY Northwest X X X X X X X X X X09257500 Willow Creek near Baggs, WY Northwest X -- -- -- -- -- -- -- -- --09258000 Willow Creek near Dixon, WY Northwest X X X X X X -- X X X09258200 Dry Cow Creek near Baggs, WY Northwest X -- -- -- -- -- -- -- -- --09258900 Muddy Creek above Baggs, WY Northwest X -- -- -- -- -- -- -- -- --09259500 Fourmile Creek near Baggs, WY Northwest X -- -- -- -- -- -- -- -- --09260000 Little Snake River near Lily, CO Northwest X X X X X -- -- X X X09263700 Cliff Creek near Jensen, UT Northwest X -- -- -- -- -- -- -- -- --09263800 Cow Wash near Jensen, UT Northwest X -- -- -- -- -- -- -- -- --09264000 Ashley C Below Trout C near Vernal, UT Northwest X X X X X X X X X X09264500 South Fork Ashley Creek nearVernal, UT Northwest X X X X X X X X X X09266500 Ashley Creek near Vernal, UT Northwest X X X X X X X X X X09268000 Dry Fork Above Sinks, near Dry Fork, UT Northwest X X X X X X X X X X09268500 North Fork Of Dry Fork near Dry Fork, UT Northwest X X X X X X X X X X09268900 Brownie Canyon Above Sinks, near Dry Fork, UT Northwest X X X X X X X X X X09269000 East Fork Of Dry Fork near Dry Fork, UT Northwest X X X X -- -- -- X X X09270500 Dry Fork at Mouth near Dry Fork, UT Northwest X X X X X -- -- X X X

44
Regional Regression Equations for Estimation of N
atural Streamflow
Statistics in ColoradoTable 4. Streamflow-gaging stations used in the development of the regional streamflow regression equations.—Continued
[Peak flow, 2-, 5-, 10-, 25-, 50-, 100-, 200-, and 500-year peak flow; Maximum 7Q2, maximum 7-day, 2-year flow; Maximum 7Q10, maximum 7-day, 10-year flow; Maximum 7Q50, maximum 7-day, 50-year flow; Minimum 7Q2, minimum 7-day, 2-year flow; Minimum 7Q10, minimum 7-day, 10-year flow; Minimum 7Q50, minimum 7-day, 50-year flow; Flow duration, 10-, 25-, 50-, 75-, and 90-percent flow duration; X, station used in the development of regional regression equation for the indicated streamflow characteristic and hydrologic region; --, station not used in the development of regional regression equation for the indicated streamflow characteristic and hydrologic region]
Station number
Station nameHydrologic
region (fig. 1)
Streamflow characteristic
Peak flow
Maximum Minimum Mean flow Flow duration7Q2 7Q10 7Q50 7Q2 7Q10 7Q50 Annual Monthly
09271800 Halfway Hollow Tributary near Lapoint, UT Northwest X -- -- -- -- -- -- -- -- --09300500 Uintah River at Fort Duchesne, UT Northwest X X X X X X -- X X X09302450 Lost Creek near Buford, CO Mountain X X X X X X X X X X09302500 Marvine Creek near Buford, CO Mountain X X X X X X X X X X09303000 North Fork White River at Buford, CO Northwest X X X X X X X X X X09303300 South Fork White River at Budges Resort, CO Mountain X X X X X X X X X X09303320 Wagonwheel Creek at Budges Resort, CO Mountain X X X X -- -- -- X X X09304000 South Fork White River at Buford, CO Northwest X X X X -- -- -- X X X09304500 White River near Meeker, CO Northwest X X X X X X X X X X09306007 Piceance Creek below Rio Blanco, CO Northwest X X X X X X X X X X09306036 Sorghum Gulch at mouth, near Rio Blanco, CO Northwest X -- -- -- -- -- -- -- -- X09306039 Cottonwood Gulch near Rio Blanco, CO Northwest X -- -- -- -- -- -- -- -- X09306042 Piceance Creek Tributary near Rio Blanco, CO Northwest X -- -- -- -- -- -- -- X X09306052 Scandard Gulch at Mouth, near Rio Blanco, CO Northwest X -- -- -- -- -- -- -- X X09306058 Willow Creek near Rio Blanco, CO Northwest X X X X -- -- -- X X X09306200 Piceance Creek below Ryan Gulch, near Rio Blanco, CO Northwest X X X X X X X X X X09306240 Box Elder Gulch near Rangely, CO Northwest X X X X -- -- -- X X09306242 Corral Gulch near Rangely, CO Northwest X X X X -- -- -- X X X09306255 Yellow Creek near White River, CO Northwest X X X X X X -- X X X09306800 Bitter Creek near Bonanza, UT Northwest X X X X -- -- -- X X X09307500 Willow Creek above Diversions near Ouray, UT Northwest X X X X X X X X X X09308000 Willow Creek near Ouray, UT Northwest X X X X X -- -- X X X09328900 Cresent Wash near Cresent Junction, UT Southwest X -- -- -- -- -- -- -- -- --09339900 East Fork San Juan River above Sand Creek,
near Pagosa Springs, CO Southwest X X X X X X X X X X
09340000 East Fork San Juan River near Pagosa Springs, CO Southwest X X X X X X X X X X09340500 West Fork San Juan River above Borns Lake,
near Pagosa Springs, CO Southwest X X X X X X X X X X
09341500 West Fork San Juan River near Pagosa Springs, CO Southwest X X X X X X X X X X09342000 Turkey Creek near Pagosa Springs, CO Southwest X X X X X X X X X X09342500 San Juan River at Pagosa Springs, CO Southwest X X X X X X X X X X09343000 Rio Blanco near Pagosa Springs, CO Southwest X X X X X X X X X X09343500 Rito Blanco near Pagosa Springs, CO Southwest X X X X X -- -- X X X09344000 Navajo River at Banded Peak Ranch, near Chromo, CO Southwest X X X X X X X X X X09345200 Little Navajo River Below Lake Oso Diversion Dam,
near Chromo, CO Southwest X X X X X X -- X X X
09346000 Navajo River at Edith, CO Southwest X X X X X X X X X X09346200 Rio Amargo at Dulce, NM Southwest X -- -- -- -- -- -- -- -- --09347500 Piedra R at Bridge Ranger Station, near Pagosa Spgs, CO Southwest X X X X X X X X X X

Supplemental Inform
ation
45Table 4. Streamflow-gaging stations used in the development of the regional streamflow regression equations.—Continued
[Peak flow, 2-, 5-, 10-, 25-, 50-, 100-, 200-, and 500-year peak flow; Maximum 7Q2, maximum 7-day, 2-year flow; Maximum 7Q10, maximum 7-day, 10-year flow; Maximum 7Q50, maximum 7-day, 50-year flow; Minimum 7Q2, minimum 7-day, 2-year flow; Minimum 7Q10, minimum 7-day, 10-year flow; Minimum 7Q50, minimum 7-day, 50-year flow; Flow duration, 10-, 25-, 50-, 75-, and 90-percent flow duration; X, station used in the development of regional regression equation for the indicated streamflow characteristic and hydrologic region; --, station not used in the development of regional regression equation for the indicated streamflow characteristic and hydrologic region]
Station number
Station nameHydrologic
region (fig. 1)
Streamflow characteristic
Peak flow
Maximum Minimum Mean flow Flow duration7Q2 7Q10 7Q50 7Q2 7Q10 7Q50 Annual Monthly
09349800 Piedra River near Arboles, CO Southwest X X X X X X X X X X09350800 Vaqueros Canyon near Gobernador, NM Southwest X -- -- -- -- -- -- -- -- --09352900 Vallecito Creek near Bayfield, CO Southwest X X X X X X X X X X09355000 Spring Creek at La Boca, CO Southwest X X X X X X X X X X09357200 Gallegos Canyon Tributary near Nageezi, NM Southwest X -- -- -- -- -- -- -- -- --09357230 West Draw near Farmington, NM Southwest X -- -- -- -- -- -- -- -- --09357500 Animas River at Howardsville, CO Southwest X X X X -- -- -- X X X09358550 Cement Creek at Silverton, CO Southwest X X X X X X X X X X09359000 Mineral Creek near Silverton, CO Southwest X X X X X X X X X X09361000 Hermosa Creek near Hermosa, CO Southwest X X X X X X X X X X09361400 Junction Creek near Durango, CO Southwest X X X X X X X X X X09361500 Animas River at Durango, CO Southwest X X X X X X X X X X09362000 Lightner Creek near Durango, CO Southwest X X X X X X X X X X09363000 Florida River near Durango, CO Southwest X X X X X X -- X X X09363100 Salt Creek near Oxford, CO Southwest X X X X X -- -- X X X09365500 La Plata River at Hesperus, CO Southwest X X X X X X X X X X09366000 Cherry Creek near Red Mesa, CO Southwest X X X X -- -- -- X X X09366500 La Plata River at CO-NM State Line Southwest X X X X X -- -- X X X09367400 La Plata River Tributary near Farmington, NM Southwest X -- -- -- -- -- -- -- X X09367530 Locke Arroyo near Kirtland, NM Southwest X -- -- -- -- -- -- -- -- --09367550 Stevens Arroyo near Kirtland, NM Southwest X -- -- -- -- -- -- -- -- --09367561 Shumway Arroyo near Waterflow, NM Southwest X X X X -- -- -- X X X09367950 Chaco River near Waterflow , NM Southwest X X X X -- -- -- X X X09367980 Rattlesnake Arroyo near Shiprock, NM Southwest X -- -- -- -- -- -- -- -- --09368020 Malpais Arroyo near Shiprock, NM Southwest X -- -- -- -- -- -- -- -- --09368500 West Mancos River near Mancos, CO Southwest X X X X X X X X X X09369000 East Mancos River near Mancos, CO Southwest X X X X X X -- -- -- --09369500 Middle Mancos River near Mancos, CO Southwest X X X X X -- -- X X X09371000 Mancos River near Towaoc, CO Southwest X X X X -- -- -- X X X09371300 Mcelmo Creek Tributary near Cortez, CO Southwest X -- -- -- -- -- -- -- -- --09372000 Mcelmo Creek near CO-UT State Line Southwest X X X X X X X X X X09378170 South Creek Above Reservoir near Monticello, UT Southwest X X X X X -- -- X X X09378630 Recapture Creek near Blanding, UT Southwest X X X X -- -- -- X X09378650 Recapture Creek below Johnson Creek near Blanding, UT Southwest X X X X -- -- -- X X X09378700 Cottonwood Wash near Blanding, UT Southwest X X X X -- -- -- X X X09379000 Cob Wash near Bluff, UT Southwest X X X X -- -- -- X X X09379030 Black Mountain Wash near Chinle, AZ Southwest X -- -- -- -- -- -- -- -- X09379060 Lukachukai Creek Tributary near Lukachukai, AZ Southwest X -- -- -- -- -- -- -- -- X09379300 Lime Creek near Mexican Hat, UT Southwest X -- -- -- -- -- -- -- -- X

46 Regional Regression Equations for Estimation of Natural Streamflow Statistics in Colorado
Publishing support provided by: Denver Publishing Service Center, Denver, Colorado Manuscript approved for publication, June 17, 2009 Edited by Mary Kidd Graphics and layout by Joy Monson
For more information concerning this publication, contact: Director, USGS Colorado Water Science Center Box 25046, Mail Stop 415 Denver, CO 80225 (303) 236-4882
Or visit the Colorado Water Science Center Web site at: http://co.water.usgs.gov/
This publication is available online at: http://pubs.usgs.gov/sir/2009/5136/

Printed on recycled paper
Capesius, J.P., and Stephens, V.C.—Regional Regression Equations for Estim
ation of Natural Stream
flow Statistics in Colorado—
USGS/SIR 2009–5136
Spine. Width varies. Printer is to determine final width and adjust spine and covers.
Spine. Width varies. Printer is to determine final width and adjust spine and covers.
Front cover 8-1/2" 11"