regional production networks and … · multilateral system will ultimately matter most for gpns...
TRANSCRIPT
1
REGIONAL PRODUCTION NETWORKS AND IMPLICATIONS ON
TRADE AND INVESTMENT POLICIES, AND REGIONAL
COOPERATION: THE CASE OF THE PHILIPPINES
Paulynne Castillo
I. INTRODUCTION
Regional/Global production networks (GPNs) are new only in sense that
participation by local enterprises and state supporting facilities have latched on in
partnership with leading multinational corporations (MNCs). Thus, a conventional
GPN combines a large, multi‐divisional multinational corporation (a.k.a., flagship), its
subsidiaries, affiliates and joint ventures, its suppliers and subcontractors, its
distribution channels and value‐added resellers, as well as its R&D alliances and a
variety of cooperative agreements, such as standards consortia (Ernst, 1997 and Sloan,
2000). The firm (a.k.a., flagship) breaks down the value chain into a variety of discrete
functions and locates them wherever they can be carried out most effectively, where
they improve the firm’s access to resources and capabilities, and where they are needed
to facilitate the penetration of important growth markets.
The main purpose is to gain quick access to lower‐cost foreign capabilities that
are complementary to the flagship´s own competencies. Outsourcing allows firms to
focus on core business and improve efficiency. Outsourcing companies usually
outsource a number of functions and the efficiency gains depend on the ability for the
suppliers to deliver the required quality at the right time.
GPNs are market‐driven based on concentration of trade, proximity, scale
economies and efficiency. Its international dimension particularly that of vertical
specialization, takes advantage of differences in comparative advantage between
countries at a finer level of specialization than trade motivated by comparative
advantage at an industry level.
In a number of industries the vertical stages of production differ largely in their
factor intensity. Some stages are labor‐intensive, others are capital‐intensive while yet
others use skilled labor intensively. In the electrical machinery and electronics sectors,
for example, product development is highly skills‐intensive and could be located in a
2
country rich in skilled and professional workers. GPNs, therefore, influence factor
market relationships as in technology transfer, workforce quality, skills, work attitudes,
institutional relations, industrial relations, civic capacity, civil society, even ecosystems
over and above government‐to‐government interactions.
Meanwhile, the success of networks depends on how network boundaries and
composition are defined, what are the critical ingredients or factors for their
development and success, how to balance autonomy and interdependence, how to
manage public‐private interface and how to evaluate network performance. These
factors can be artificially induced by states as part of industrial policy. In high‐
technology industries, for example, (i.e., electronics and high disk drives) state agencies
have redesigned the domestic architecture of supply infrastructure in critical
technologies to enable domestic firms and MNCs to compete effectively (Mathews, et al,
eds 2000, Gray and Dunning, 2000 and McKendrick, et al, 2000). The defining feature of
GPNs is local participation. Domestic firms ratchet up and leverage themselves more
competitively and securely to partner MNCs.
Given their scope and complexity, GPNs are expected to increasingly influence
the nature and span of regionalism from the institutional and policy perspectives. The
multilateral system will ultimately matter most for GPNs and MNCs. Thus, there is a
need to balance GPNs/regionalization and regionalism on one had, and square off new
regionalism with multilateralism on the other.
II. FRAMEWORK
Value chain analysis provides a framework for understanding the concrete actors
in these Philippine industries. “A production network approach adds to the picture by
encouraging us to focus on the connections between firms and subsidiaries, not only the
vertical linkages that comprise the value chain, but also the horizontal ones between
firms and various other actors” (Sturgeon, 2000).
A final product, before it reaches the end consumers, goes through a sequence of
productive activities in the process of their transformation from raw materials to the
final product. These series of productive activities is called a value chain. A value chain
is formally defined as “the linked set of value‐creating activities all the way from basic
raw material sources for component suppliers through the ultimate end‐use product
delivered into customers’ hands” (Shank, 1989). There are three kinds of value chains.
The simple value chain (Appendix D), the extended value chain (Figure 2) and the
production network, which is a combination of two or more value chains (Figure 3).

3
In this era of rapid globalization to stay in the market producers have to
withstand tough competition. Efficiency in production, meaning an increase in value at
constant price or a decrease in price with the value of the product remaining constant,
and an understanding of the dynamic factors within the value chain are of utmost
importance.
In lieu of this, Value Chain Analysis, which in literature is viewed as a core
analytical tool of strategic management accounting (Porter, 1985), can be used to study
the value chain and have a better position in the market as a result. The basic idea of
the value chain analysis is to break up the chain of activities that runs from basic raw
materials to end‐use customers into strategically relevant segments in order to
understand the behavior of cost and the sources of differentiation” (Shank and
Govindarajan, 1992)
A. Methodology
To meet the abovementioned objectives, the study will make use of descriptive and
statistical analyses and will heavily rely on secondary data, with particular focus on the
patterns of production, subcontracting arrangements, trade and investment. The study
will compare and contrast the development of Philippine industries ‐ the
semiconductor, automotive and garments industries, in particular – with the leading
sectors in Asia and the United States.
B. The Role of Regional Trading Agreements
1. Trade Liberalization and GPNs
The rate of growth in the value of international trade has been strong and since the
mid‐1980s has consistently exceeded that of world output. This has been accompanied
by a growing participation of developing countries in world trade over the past three
decades– between 1970 and 2000, the share of developing countries in global
merchandise trade rose from about one‐fourth to almost one‐third – and by a rapid
transformation in the composition of their exports from primary commodities to
manufactures, particularly since the early 1980s: manufactures now account for 70 per
cent of developing country exports, after stagnating at around 20 per cent in the 1970s
and early 1980s.
Feenstra (1998) suggests four possible factors to explain the growth of world trade:
trade liberalization, falling transportation costs, income convergence among the main
trading economies, and increased vertical international production sharing Several

4
empirical studies have tried to disentangle the relative importance of these factors.
Concentrating on the growth in trade relative to income among a group of 16 developed
countries, and hence not considering the impact of vertical international production
sharing, Baier and Bergstrand (2001: 21), for example, conclude that ‘trade liberalization
appears to have contributed about 75% of the (approximately) 2% annual growth of
world merchandise trade as a share of income in the post‐war period compared with
transport‐cost declines, which have contributed only 25% of the growth in trade relative
to income’.
Moreover, international production sharing appears to be more a product of
bilaterally or multilaterally negotiated preferential agreements. While it is difficult to
determine the impact of tariffs on production sharing, there is evidence to suggest that,
in addition to geographic proximity and significant differences in wage rates, vertical
production sharing has been stimulated by discriminatory country‐specific concessions
for specific products under various preferential trading agreements, rather than by tariff
declines that are the result of multilateral trade negotiations and apply equally to all
countries.
The Philippines, since the beginning of 1980s, has been implementing trade and
investment policies that have been made gradually liberal and open. The reforms were
aimed at fostering greater openness as well as promoting an outward‐oriented
industrialization strategy; carried out in various stages involving unilateral, regional
and multilateral liberalization.
An example of the unilateral trade liberalization program carried out starting 1981 is
the progressive reduction in tariffs known as the Tariff Reform Program (TRP). The
TRP, carried out in three stages, reduced the overall level of protection and the
dispersion of tariff protection within and across sectors and industries. TRP I,
implemented from 1981‐1985, eliminated tariff rate from a peak of 100% to a maximum
of 50%. From 1991 to 1995, under TRP II, the maximum tariff rate of 50% was
maintained. TRP III, carried out from 1996 to 2003, imposed a uniform tariff rate of 5%
by 2004.
Regional efforts included the Philippines’ commitments to the ASEAN Free Trade
Area (AFTA), which reduced intra‐regional tariff rates to 0‐5% from 1993 to 2002. These
rates would be brought down to 0% by 2010 for original ASEAN members and 2015 for
new members. Membership to the Asia Pacific Economic Cooperation (APEC) led to
commitments for free and open trade and investment in the region by 2010 for
developed economies and 2020 for developing economies.

5
Meanwhile, active membership to the World Trade Organization (WTO) paved
the way for the country’s pursuit of liberalization in world arena. Commitments to the
WTO included the binding of tariffs at rate of 10 percentage points above 1995 ceiling
rate from 1994 to 2004. Table 1 shows the level of WTO tariff bindings by product
group.
Table 1: Scope and Level of Tariff Bindings in the WTO, by Product Group, Philippines
Level of Binding
Product Group Scope of
Binding Up to
10% 11%‐20% Above 20%
Above
40%
Agriculture, excl. fish 100.0 3.1 6.2 90.4 68.2
Textiles and clothing 98.6 0.6 4.7 94.7 2.0
Non‐electric machinery 71.8 20.2 66.3 13.5 2.7
Chemicals 71.3 17.4 69.6 13.0 3.1
Electric machinery 58.1 35.1 31.4 33.5 22.6
Minerals 41.9 45.2 20.7 34.1 20.0
Wood, paper, furniture 37.6 21.6 28.0 50.4 8.0
Leather, rubber, footwear, travel goods 36.4 16.2 22.1 61.7 42.6
Transport equipment 32.5 35.8 43.4 20.8 7.5
Metals 31.4 12.7 38.7 48.5 7.3
Fisheries 5.5 30.0 0.0 70.0 40.0
Petroleum, energy 0.0 0.0 0.0 0.0 0.0
Other manufactures 46.0 33.8 30.3 35.9 25.5
Source: Bureau of International Trade Relations–Department of Trade and Industry, 2001
As Medalla (2002:140) puts it, “By ridding market distortions, trade liberalization
would espouse greater reliance on the market, foster competition, and provide an even
playing field which would encourage the development of industries with real
comparative advantage”.
Undeniably, the reforms led to increases in total trade (refer to Appendix A) as well
as to an improved structure of protection as evidenced by the declining overall average
effective protection rates from 38% in 1985 to about 11% 2004 (refer to Table 4).
Table 4: Philippine Average Protection Rates, 1985‐2004
(in percent)
Sectors 1985 1990 1995 2000 2001 2002 2003 2004
Agriculture 9.20 23.63 22.00 14.84 15.68 20.76 20.60 20.08
Mining 6.10 1.67 1.43 0.43 0.36 0.33 0.39 0.42
Manufacturing 55.90 31.02 23.09 17.78 14.31 12.41 11.26 9.94
Overall 38.00 27.86 21.91 16.30 14.10 12.62 11.77 10.76
Source: Philippine Tariff Commission
6
Philippine foreign trade grew at an average of 9% annually from 1980 to 2003.
The highest growth rates, of at most 26%, were posted well after the implementation of
the unilateral trade reforms in 1981. Indeed, except for a few isolated years, Philippine
foreign trade grew at double‐digit rates after 1985. Exports during the same time
period exhibited rapid growth (refer to Appendix B), 29% at its highest point in 1995.
On the average Philippine exports increased at 9.61% per year from 1980 to 2003.
Furthermore, Table 4 shows that while the agricultural sector’s EPR rose from 9% in
1985 to 20% in 2004, the mining and manufacturing sectors experienced significant
reductions in their EPRs for the same period, from 6% to 0.42% and from 55.9% to 9.9%,
respectively.
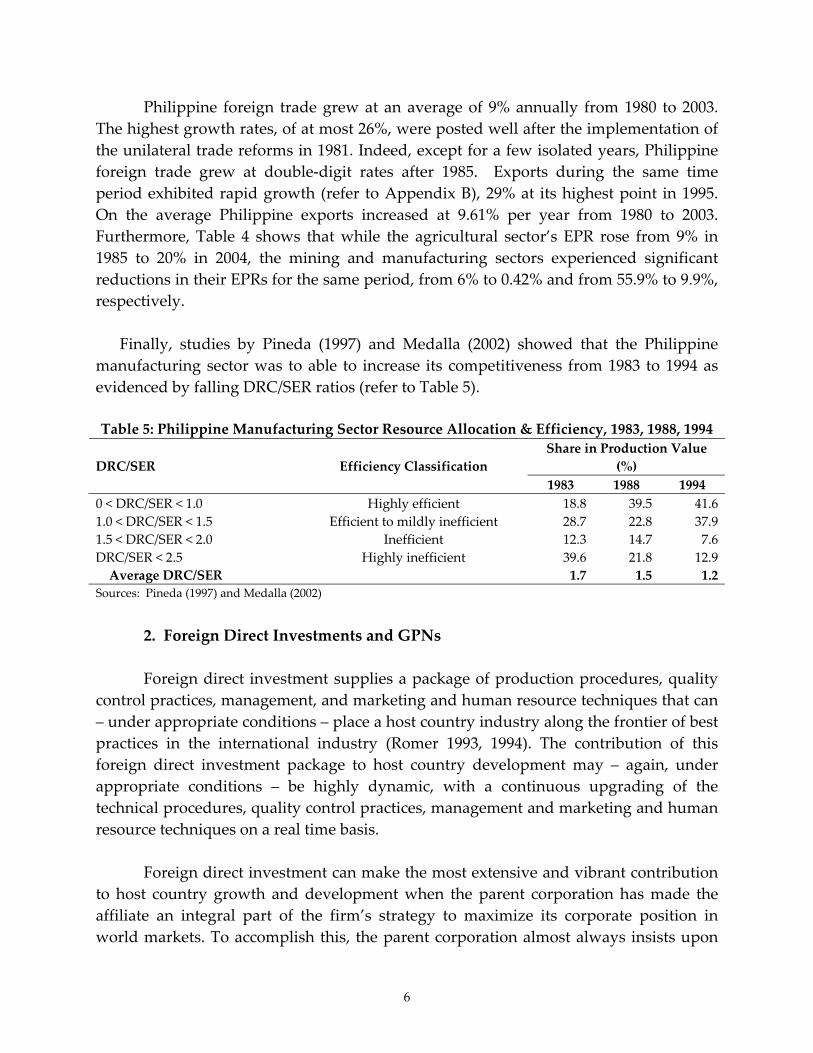
Finally, studies by Pineda (1997) and Medalla (2002) showed that the Philippine
manufacturing sector was to able to increase its competitiveness from 1983 to 1994 as
evidenced by falling DRC/SER ratios (refer to Table 5).
Table 5: Philippine Manufacturing Sector Resource Allocation & Efficiency, 1983, 1988, 1994
Share in Production Value
(%)
DRC/SER Efficiency Classification
1983 1988 1994
0 < DRC/SER < 1.0 Highly efficient 18.8 39.5 41.6
1.0 < DRC/SER < 1.5 Efficient to mildly inefficient 28.7 22.8 37.9
1.5 < DRC/SER < 2.0 Inefficient 12.3 14.7 7.6
DRC/SER < 2.5 Highly inefficient 39.6 21.8 12.9
Average DRC/SER 1.7 1.5 1.2
Sources: Pineda (1997) and Medalla (2002)
2. Foreign Direct Investments and GPNs
Foreign direct investment supplies a package of production procedures, quality
control practices, management, and marketing and human resource techniques that can
– under appropriate conditions – place a host country industry along the frontier of best
practices in the international industry (Romer 1993, 1994). The contribution of this
foreign direct investment package to host country development may – again, under
appropriate conditions – be highly dynamic, with a continuous upgrading of the
technical procedures, quality control practices, management and marketing and human
resource techniques on a real time basis.
Foreign direct investment can make the most extensive and vibrant contribution
to host country growth and development when the parent corporation has made the
affiliate an integral part of the firm’s strategy to maximize its corporate position in
world markets. To accomplish this, the parent corporation almost always insists upon
7
wholly‐owned status for the affiliate, combined with freedom to use inputs from
wherever price, quality, and reliability are most favorable.
The experience of the computer/electronics industry in Southeast Asia has
provided the clearest evidence of the process in which affiliates tightly integrated into
the regional or global sourcing network of the international investor offer greatest
potential to enhance the growth and development of the host country. But similar
dynamics resulting from the potent interaction between parent and local subsidiary are
present in other sectors as well (Gereffi, 1995).
Over the course of the late‐1980s and 1990s, it became apparent that the
computer/electronics industry was starting to structure production in Southeast Asia as
an integral part of the parents’ strategy to advance and defend their competitive
position in home country markets and around the world. The interaction between
design functions and assembly functions became more intimate: the incorporation of
latest technologies, quality control procedures, and management techniques speeded
up; the pace of upgrading production processes and production output responded to
the cycle of innovation in home country markets (Gereffi, 1995).
Borrus, et al. (1999) and others documented a progression in which foreign
multinationals moved their affiliates up the ladder from hand assembly of printed
circuit boards, to responsibility for process design and even product design of complex
subsystems. McKendrick, et al. (2000) provide a particularly vivid analysis of the
increasingly close and brisk interaction between parent and affiliate in the international
disk drive industry. The idea of shopping around for cheap inputs became a less and
less satisfactory way to characterize the parental supervision within multinational
supply chains in computers/electronics.
The impact from foreign direct investment in assembly and processing varies
greatly, of course, by industry sector – from low‐skill intensive footwear and garment
operations in the Philippines and El Salvador, to more sophisticated automobile engine
plants in Thailand and Brazil, to cutting‐edge disk drive factories in Singapore and
Mexico. The creation of integrated international supply chains via foreign direct
investment enables host economies to perform activities they already undertake more
efficiently. More importantly, it allows host economies to enter entirely new realms of
industrial production (Gereffi, 1995).
Indeed, empirical estimates of the benefits from trade and investment
liberalization that permit the establishment of international supplier chains between
developed and developing countries reach 10 to 20 times conventional measurements of
8
the results for trade liberalization alone (Romer 1994). When there are economies of
scale in crossborder production networks, the results are larger still, with the great
majority of the benefits showing up in enhanced efficiency and greater exports from the
developing country economy (Lopez‐de‐Silanes, et al. 1994; Markusen, et al. 1995).
Regional trading agreements, therefore, if the goal is to promote linkages to the
global production network, should focus on commitments that would lower trade
barriers between countries and reduce the restrictions on foreign direct investments for
the industries the economic block would like to promote.
3. Semiconductors and Electronics Industry
The use of electronics in industry dates back to the 1920’s, particularly during the
early days of radio broadcasting in the United States. The “new” technological
innovation led to annual sales of close to $50 billion on consumer electronics in the
United States alone. Almost eight decades later, this technology based on the controlled
flow of electrons or other carriers of electric charge, became the foundation for the
invention electronic products consumers enjoy today such as televisions, cellular
phones, radios, radars, and other products (Columbia Encyclopedia, 2004).
Thus, defining the electronics industry is tricky. Afuah (1997) has shown that
products are insufficient to define an industry when specialized suppliers exist; when
there is complex market segmentation and abrupt change in demand patterns; when
there is intense and unpredictable technical change; and when financial institutions
accelerate the pace of industrial restructuring and increase uncertainty. Not only do all
these conditions prevail in the electronics industry but key sectors are also in turmoil,
with the between sectors boundaries changing incessantly. Given these limitations, the
definition that this paper will adopt will include hardware (i.e. electronics equipment
and components) software, information services, and a variety of newly emerging
markets that result from the convergence of digital information, audio and video, and
communication technologies (i.e., internet services).
Production of semiconductors, and microprocessors, which constitute key
components of most products in the electronics sectors (and other industries as well), is
capital‐intensive. Assemblage of the final products, however, is labor‐intensive and
could be located in a labor‐rich country. The continually expanding market for its
products offered various opportunities for multinational corporations to locate in the
developing world. Subsequent geographical shifts in production of electronic products
can be traced to the decade of the ‘50s. Electronics companies from the United States,
then the world leader in electronics production, first explored prospects in Japan. These

9
companies eventually reached the shores of Hong Kong, the Republic of Korea, Taiwan,
Singapore, Brazil, India, Mexico, and more recently, China and some South East Asian
countries like Indonesia, Malaysia, Thailand, and of course, the Philippines (Salazar,
1998).
Moreover, the nature of electronics production evolved to the specialization we
observe today. Capital‐rich countries like the United States and Japan manufacture the
key components and develop the technology required for its expanded application
while labor‐rich countries concentrate on assembling the final products.
Globalization in the electronics industry combines a massive, yet highly
concentrated, international dispersion of the value chain with an important
organizational innovation, the spread of global production networks (GPN). These
networks are a response to the increasingly demanding coordination requirements of
geographic dispersion, and integrate the dispersed supply and customer bases of a
global network flagship company (e.g., Compaq, IBM or NEC).
The production process of electronic products consists of four main activities:
wafer design, wafer fabrication, assembly, and product testing. Wafer design and wafer
fabrication are capital‐intensive processes which are usually performed by
industrialized countries like the United States. These processes are classified in the
upper segment of the production network.
On the other hand, assembly and product testing are labor‐intensive processes
and are usually conducted by labor‐intensive countries. These processes are classified in
the lower segment of the production network, which are produced by like China and
the Philippines. The reason is that labor is very cheap in these countries compared to
industrialized countries (Salazar, 1998). Figure 4 shows the different processes in the
electronics industry’s value chain.
A critical capability for the creation of GPNs in the semiconductor industry is the
intellectual property and knowledge associated with setting, maintaining and
continuously upgrading a de facto market standard. This requires perpetual
improvements in product features, functionality, performance, cost and quality. It is
such “complementary assets” (Teece, 1986) that the multinational corporation
increasingly outsources. This has given rise to a proliferation of specialized suppliers,
segmenting the industry into separate, yet closely interacting horizontal layers (Grove,
1996).
10
For the semiconductor industry, the availability of standard components, which
allows for a change in computer design away from centralized (IBM mainframe) to
decentralized architectures (PC, and PC‐related networks) served as a vehicle for the
creation of GPNs. Standard components made it possible for new options to emerge for
outsourcing, transforming what was once a vertically integrated industry into
horizontally disintegrated, yet closely interacting market segments (i.e., integrated
circuits, board assembly, disk drives, operating systems, applications software, and
networking equipment). Over time, each of these individual market segments became
rapidly globalized.
A case in point, there is a huge gap between the US share of world exports (18%)
and its market share based on company ownership (32%), which suggests that a very
high share of US production of semiconductors is taking place overseas. The same is
true for Asia, where the gap between ownership‐based and export market shares is
higher at 38% by country of origin, versus 19% by ownership. Asia, seemingly, has
attracted the bulk of investments not only from the US but also from Japan and Europe.
Geographic dispersion however is heavily concentrated on a few specialized
local clusters. The hard disk drive (HDD) industry provides an example both for the
breath‐taking speed of geographic dispersion, as well as for its spatial concentration
(Ernst, 1997, Sloan) Until the early 1980s, almost all HDD production was concentrated
in the U.S., with limited additional production facilities in Japan and Europe.
Today, only 1 percent of the final assembly of HDDs has remained in the US,
while Southeast Asia dominates with almost 70% of world production, based on units
shipped. Slightly less than half of the world’s disk drives come from Singapore, with
most of the rest of the region’s production being concentrated in Malaysia, Thailand,
and the Philippines.
Multinational corporations dominate the Philippine electronics industry. The
key players, the companies with the largest market share, are mostly of American and
Japanese origins (refer to Appendix C). The three largest electronic manufacturers –
Intel Corp., Amkor Technology Inc., and Texas Instruments Inc. – and other chip
companies have invested more than $5 billion in the country since 1996 (Frank, 1999).
Intel Corp., one of the leading electronics manufacturers in the country, a $500
million plant in the late 90’s to assemble Pentium III chip and other leading products.
Amkor’s expansion of one of its assembly‐test plants employed an estimated 10,000
Filipinos. Texas Instruments spent $45 million on expansion in 1997 for its digital
processing signal chips. Other leading companies situated in the Philippines are Fujitsu
11
Computer Products and Gateway Electronics Corporation with investments reaching $1
billion in 1996 (Frank, 1999).
Initially, for foreign investors are attracted to the Philippines due to its supply of
well‐educated laborers. (Frank, 1999) An English speaking country, Filipino workers are
able to communicate effectively with their foreign employers. Moreover, these laborers
are willing to accept wages that are at least 30% lower than wages in Malaysia and other
neighboring countries. Compared to Indonesia, China, Thailand, Malaysia and
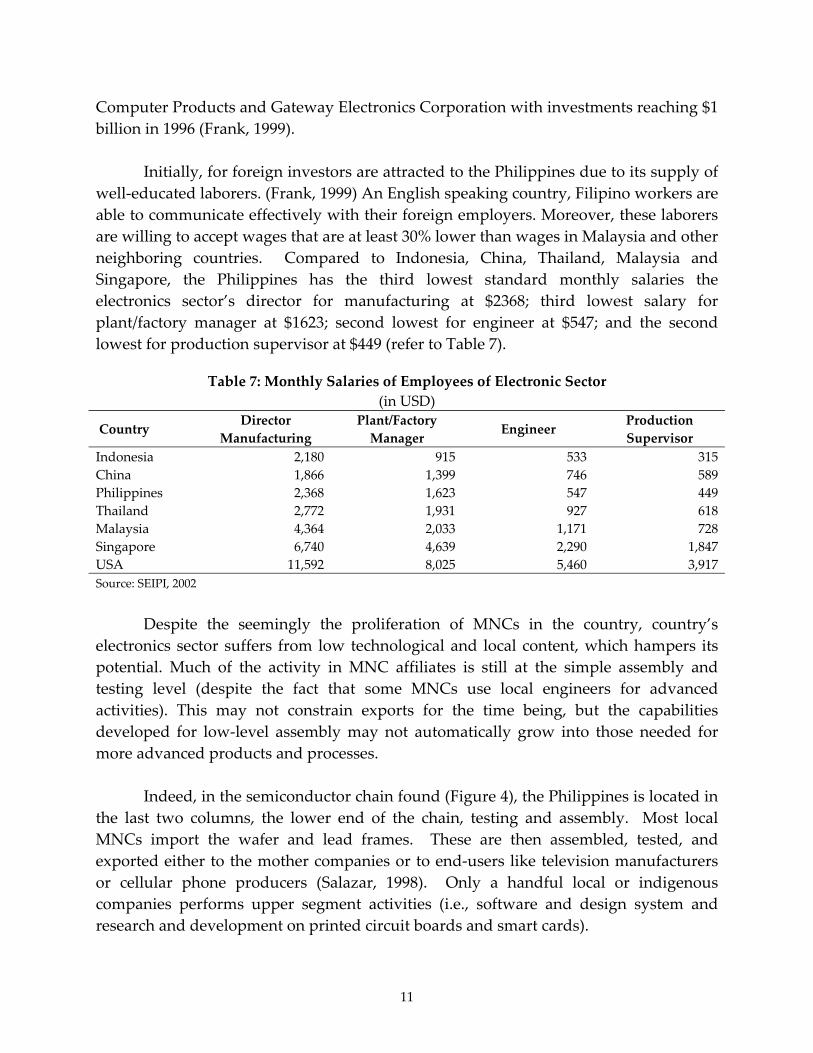
Singapore, the Philippines has the third lowest standard monthly salaries the
electronics sector’s director for manufacturing at $2368; third lowest salary for
plant/factory manager at $1623; second lowest for engineer at $547; and the second
lowest for production supervisor at $449 (refer to Table 7).
Table 7: Monthly Salaries of Employees of Electronic Sector
(in USD)
Country Director
Manufacturing
Plant/Factory
Manager Engineer
Production
Supervisor
Indonesia 2,180 915 533 315
China 1,866 1,399 746 589
Philippines 2,368 1,623 547 449
Thailand 2,772 1,931 927 618
Malaysia 4,364 2,033 1,171 728
Singapore 6,740 4,639 2,290 1,847
USA 11,592 8,025 5,460 3,917
Source: SEIPI, 2002
Despite the seemingly the proliferation of MNCs in the country, country’s
electronics sector suffers from low technological and local content, which hampers its
potential. Much of the activity in MNC affiliates is still at the simple assembly and
testing level (despite the fact that some MNCs use local engineers for advanced
activities). This may not constrain exports for the time being, but the capabilities
developed for low‐level assembly may not automatically grow into those needed for
more advanced products and processes.
Indeed, in the semiconductor chain found (Figure 4), the Philippines is located in
the last two columns, the lower end of the chain, testing and assembly. Most local
MNCs import the wafer and lead frames. These are then assembled, tested, and
exported either to the mother companies or to end‐users like television manufacturers
or cellular phone producers (Salazar, 1998). Only a handful local or indigenous
companies performs upper segment activities (i.e., software and design system and
research and development on printed circuit boards and smart cards).
12
What accounts for the local industry’s inability to advance to the upper segment
of the electronic global production network? According to Delfin Sabido IX, director of
the Advanced Science and Technology Institute (ASTI), one reason is the quality of the
country’s engineering graduates (Ramos, 2003); alluding to a weak academe‐ industry
linkage. Armenia Ballesteros, director of Electronics and Information Technology
Department of the Board of Investments, adds quantity of engineering graduates as a
second reason. Moreover, Ballesteros claims that the Philippines has limited market
access and source of prototyping materials, inadequate incentives to develop new
products, and high cost of raw materials (Burgonio, 2003). Added to the high cost of
power, poor infrastructures, and shaky security (Macaraig, 2003), potential investors in
upper segment processing, therefore, choose alternative host countries.
To illustrate, SEIPI claims that electricity makes up a large percentage of the
electronic industry’s cost. Intel, for example, allots 41% of their budget to electricity;
Texas, 25%; and Team Pacific, 13%. Cost of electricity per kilowatt hour in the
Philippines is YS$0.10. Thailand, Malaysia, China, and Indonesia are $0.08, $0.06, $0.04,
and $0.02 respectively. The cost of power in the Philippines is therefore the highest
among these five countries. SEIPI further reports that electronics companies in Malaysia
are mostly capital‐intensive, upper segment, but their budget for electricity is only 10%
of the total costs (SEIPI, 2002).
As for infrastructure, the Philippines have poor roads, highways, buildings, and
other infrastructures. The sporadic terrorism, hi‐jacking, and other serious criminal
activity drive away investors partially explaining the poor transfer of technology to the
local industry (Macaraig, 2003).
Moreover, unpredictable minimum wage increases discourages potential foreign
investors. According to SEIPI, there has been a 93% increase in minimum wage from
1995 to 2002. This is much too high compared with Thailand that only had a 22%
increase in minimum wage for over 9 years. As of 2002, the labor cost per hour in the
Philippines is $1.70. China’s labor cost per hour is only $0.04, and Indonesia’s is only
$0.01 (SEIPI, 2002). In terms of labor cost, it is reasonable for investors to flock to China
and Indonesia.
Finally, Malaysia, China and Thailand offer lower tax rates and more incentives
than the Philippines. The Philippines has the highest tax rates at 32% compared to
China’s and Thailand’s 30% and Malaysia’s 28%. Furthermore, China offers a 100% tax
refund for export oriented enterprises while Malaysia give a 60‐100% tax allowance for
capital expenditure as well as a 60% allowance for reinvestment. The Philippines has
no such provisions (refer to Table 7).
13
Thus, despite the country’s markets all over the world, in terms of
competitiveness, the Philippines is ranked 40th compared to Singapore at 5th, Malaysia at
26th, China at 31st, Thailand at 34th, and Indonesia at 37th.
Among the perceived weaknesses of the local electronic sector, is its weak
linkage with multinational corporations. Philippine electronics manufacturers are kept
at the assembling stage, which requires little, if any, infusion of new technology. Yet,
with the rapid change in semiconductor technologies are subject to rapid change,
without a flexible and advanced base the Philippines, the local industry may not be able
to prevail over its lower cost competitors. There is also the possibility that new
technologies will not be sensitive to labor costs, but seek locations that offer advanced
production, design and supply capabilities despite higher wages.
Low local value added in the Philippines is another reflection of its weak
technological capabilities. Average local content is only 20% in semiconductors. It is
higher, 25%, in simple items like printed circuit boards and lower, 10‐15%, in complex
products like microprocessors (made by companies like Intel), below the average levels
reached in Malaysia (around 45%) and Taiwan (75%).
It is widely acknowledged that local supplier capabilities (especially among
SMEs) are weak; they need to be strengthened if local content is to keep rising. There
are practically no local producers with the capability to take on original equipment
manufacture (OEM), which was one of the main arrangements used by firms in Korea
and Taiwan to access new technologies and export advanced electronics products.
The most important immediate issue facing the Philippines in the
competitiveness area is clearly the sustainability of the electronics export boom.
However, there are other important, longer‐term, strategic issues related to export
competitiveness: the overwhelming dependence on one activity is risky, labor‐intensive
exports show disturbing signs of declining competitiveness, and institutional support
for the upgrading of enterprise capabilities remains in adequate. It is not possible to
give an unequivocal answer to the issue of electronics export sustainability.
The critical factor is the international sourcing pattern of leading US and
Japanese multinationals, and these are based on economic as well as other factors
(including corporate strategies). It is not immediately obvious why there has been a
regional shift in sourcing of semiconductors towards the Philippines from traditional
centers like Malaysia.

14
Nonetheless, electronics remains to be the Philippines’ major export commodity
since the decade of the 90s. In 2003, electronics products accounted for more than 40%
of the country’s total sales abroad. As contained in Appendix E, except for declines in
2001 and 2003, foreign sales grew on the average of roughly 24% per annum. Bulk of
these products, about 78.5%, is accounted for by components/devices, also known as,
semiconductors (refer to Appendix F). The balance includes foreign sales of electronic
data processing, office equipment, consumer electronics, telecommunications,
communication/radar, control and instrumentation, medical/industrial instrumentation,
and automotive electronics.
Although the latter sub‐industries make up least part of the total electronics
exports, they appear to be among the fastest growing sectors. For example, the office
equipment, which accounts for a mere 0.34% of total electronic exports has largest
growth rate, 2547.80%. Likewise, medical/industrial instrumentation, which has the
least percentage share to total exports, less than 1%, has a growth rate of 54.34% ‐
greater than the components/devices’ growth rate of 22.83% (refer to Appendix G).
The Philippines’ biggest market for electronics is the United States. It absorbs
26% of the country’s foreign sales. Europe is a close at 22%; followed by other Asian
countries at 21%. The ASEAN countries make up 17% of the market, Japan at 11%, and
other countries at 3%. (SEIPI, 2002)
Sustaining the growth of the sector, however, requires an integrated effort in
addressing the problems identified above. The most important of which is
strengthening the local industry’s linkage with the electronics industry’s global
production network. Moving up the chain would lead to the transfer of newer
technologies to the local manufacturers, increased competitiveness and the production
of higher valued added products.
4. Automotive Industry
The manufacture of automobiles in the Philippines used to be a typical import
substitution industry. In the early 70s, the government began to implement policies
geared towards rationalizing production and furthering technological development in
the hopes of taking advantage of the opportunities offered by an increasingly
competitive environment in the world market.
Among the first vehicle manufacturing programs to be employed are the
Progressive Car Manufacturing Program (PCMP), the Progressive Truck Manufacturing
Program (PTMP) and the Progressive Motorcycle Manufacturing Program (PMMP).
15
Designed to protect the more than 20 car companies that made up the industry in the
1970s, they succeeded in producing more than 30 vehicle brands and 100 models.
Moreover, the programs led to the creation of three important policies. First, the
closure of the domestic auto market to CBU imports. Second, they resulted to the
reduction of the total number of car assemblers from more than 20 to five (5). Third,
mandatory local content was required for locally assembled vehicles. Soon after the
implementation of these coordinative programs, the Philippine automotive market
grew strongly.
Since production of automobiles requires a large number of components, the
industry has also developed extensive and sophisticated division of labor and
production networks. These programs attracted foreign car and components
manufacturers to locate in the archipelago.
The early 1980s, however, were a difficult time for the Philippine automobile
market, with international economic crises and a domestic economic slowdown
affecting the industry. Vehicle sales decreased significantly as regulations became more
demanding of automotive companies, especially as it related to foreign exchange
requirements. By the mid‐1980s, the competitive landscape had changed drastically as
many of the assemblers had withdrawn from the country, and only Mitsubishi and
Nissan remained.
In 1987, new Motor Vehicle Development Programs (MVDP), particularly Car
Development Program (CDP), the Commercial Vehicle Development Program (CVDP)
and the Motorcycle Development Program (MDP), were created in recognition of the
sectorʹs potential to spur economic growth. They were instituted in the hopes of
revitalizing the sector.
Meanwhile, within the framework of ASEAN, a number of initiatives to advance
regional cooperation in the automobile industry have been attempted, but their results
have been rather disappointing. For example, Brand‐to‐Brand Complementation (BBC)
was introduced in 1988, and allowed auto assemblers to obtain privileges of a 50
percent tariff reduction for imports of components.
Gradual liberalization continued in last decade of the 20th century both in the
local and regional fronts. The Philippine government created the Peopleʹs Car category
immediately followed by the creation of the luxury car category two years later. In
1994, additional access was granted through the ASEAN Industrial Joint Venture (AIJV)
Scheme. All closed categories, in 1996, such as the Peopleʹs Car category, which
16
includes vehicles with less that 1,200cc, were opened up to new participants, subject to
certain investment requirements for components manufacturing under the MVDP. The
importation of all types of vehicles was, and continues to be, liberalized, with the
intention of dropping all local content requirements in an expeditious manner. The
important vehicle categories in the Philippines include the following: 1) Passenger
Vehicles, which include the People’s Car, Sub‐compact and Compact Cars, and Luxury
cars; and 2) Commercial Vehicles, which include the Asian Utility Vehicle, Light
Commercial Vehicles, and Trucks and Buses.
Although automobiles and automotive components are also subject to AFTA,
tariff reduction in this sector has made little progress. In response to Malaysia’s request
to delay reducing automobile tariffs for two years from 2003 to 2005, ASEAN members
set a protocol in November 2000 establishing the procedure for member countries to
temporarily delay the tariff reduction schedule. It is not clear if Thailand, Indonesia and
the Philippines will reduce their tariffs on automobiles and components to 5 percent by
the year 2003, as originally planned. Reflecting this tariff situation, most of the car
assemblers and components manufacturers currently utilize the ASEAN Industry
Cooperative Organization (AICO) scheme, which succeeded BBC in 1996.
As a result of the BBC scheme, which was succeeded by the AICO, car
manufacturers developed a system of regional complementation of key components.
Under the arrangement, the Indonesian subsidiary specializes in production of gasoline
engines, the Thai subsidiary in diesel engines, the Philippine subsidiary in
transmissions, and the Malaysian subsidiary in steering gears and electrical parts. Each
subsidiary purchases components from suppliers in the respective country, makes a
CKD (completely knocked down) consisting of components manufactured in its own
factory and purchased from suppliers, and the package is then exported to subsidiaries
in other ASEAN countries for final assembly. This form of complementation is widely
adopted by car assemblers utilizing the AICO scheme.
The reason why this form of complementation had to be adopted was because
authorities of respective ASEAN member economies grant AICO privileges to
companies fulfilling certain criteria. One of the criteria is the sharing of resources
among member economies, which implied each of the company’s ASEAN subsidiaries
involved in the AICO arrangement should be engaged in value‐adding activities.
Because of this condition, simple trading of completely‐built‐up‐cars (CBUs) was not
allowed as an AICO arrangement. Automotive assemblers, including Company C,
proposed the scheme of consolidated purchasing of components from suppliers in the
respective countries and regional complementation of CKD packages, in order to meet
this requirement.

17
Each subsidiary specializes in production of semi‐finished components, which
are exported to other regional subsidiaries to assemble finished components. For
instance, its Thai subsidiary specializes in production of several components including
starters and alternators, the Indonesian subsidiary in compressors, the Philippine
subsidiary in meters, and Malaysian subsidiary in condensers. The division of labor
seems to have evolved gradually while the company was expanding its operations in
ASEAN, rather than as an overall restructuring of the regional operations.
The current Philippine excise tax rate for automotive vehicles is based on engine
displacement, as opposed to vehicle value. This system imposes a competitive
disadvantage on imported vehicles with larger engine displacement, including many
U.S. exports. Current tax rates for motor vehicles with gasoline engines are: 15 percent
for engines up to 1600 cubic centimeters (cc), 35 percent for those with engines between
1601‐2000cc; 50 percent for those between 2001‐2700cc; and 100 percent for those with
engines 2701cc and above. For motor vehicles with diesel engines, excise tax rates are
15 percent for engines of up to 1800cc; 35 percent for those with engines between 1801‐
2300cc; 50 percent for those with engines between 2301‐3000cc; and 100 percent for
those with engines 3001cc and above.
At present, the Philippine motor vehicle industry is comprised of two sectors: the
motor vehicle assembly and the motor vehicle parts and components manufacturing.
The motor vehicle assembly sector is grouped based on the type of motor vehicles, such
as passenger cars, commercial vehicles (utility vehicles, pick‐ups, vans, trucks, buses,
special purpose vehicles) and motorcycles. Appendix E lists the number of participants
per sub‐sector as well as each category’s total capacity per year. At this time, the
industry is operating at an estimated 40% of its capacity.
In terms of ownership, the industry is dominated by Japanese automobile
manufacturers (refer to Appendix F). Toyota Motor Philippines, Honda Car
Philippines, Inc. and Isuzu Motor lead the local industry in investments and
employment. Other principal motor vehicle manufacturers are Ford Motor Co. Phils.,
Columbian Autocar Corp., Pilipinas Hino Inc. and Norkis Trading Company.
Domestic sales in the past seven years, 1995 to 2001, have been fluctuating at
best. Rising real income and a general optimism about the future performance of the
Philippine economy led to the most number of passenger cars, 21.1% increase, and
commercial vehicles, up by 10.2%, sold in 1996 (refer to Appendix G). The Asian
financial crisis, which resulted in the depreciation of the Philippine peso in 1997 and a
slowdown in the economy in the succeeding years, resulted in steep declines in
18
domestic automotive sales, particularly in the passenger cars sub‐sector. Consequently,
vehicle sales growth went down by double‐digits. For passenger cars, the drop
continued until 2001, with only 21,728 units sold. The commercial vehicles sub‐sector,
on the other hand, appears to be recovering. Sales in 2001 have already surpassed the
pre‐crisis level.
The parts and components manufacturing sector comprises of 256 companies
producing various parts and components made of metals, plastic, rubber, and
composite materials for both the OEM and replacement markets. The principal
components manufacturers are Yazaki‐Torres Manufacturing Corp. (wiring harness),
United Technologies Automotive Phils. (wiring harness), Temic Automotive (Phils.) Inc.
(anti‐brake lock system), Honda Engine Manufacturing Phils., Inc. (engines), Asian
Transmission Corp. (automotive transmissions), Toyota Autoparts Phils. (automotive
transmission), Fujitsu Ten corp. of the Phils. (car stereos) and Aichi Forging Co., Inc.
(forged parts). By end of 1999, the parts industry contributed investments of
approximately PHP27 billion, employment of 45,000 and export of over US$1.1 billion
(refer to Appendix H), which has increased more than ten‐fold from 1988 level.
Looking toward the future, it is not surprising that the country is increasingly
focusing on the production of exportable components and strengthening ties with
multi‐national suppliers in order to secure global sourcing contracts. The government
plans to further develop its parts industry by attracting new foreign investment in
strategic parts, allowing suppliers to access raw materials at favorable tariff rates and
rationalizing tariff structures.
5. Garments and Textile Industry
A migratory industry, market access, the operations of multinational producers,
and the allocation of quotas under the MFA are significant influences on the pattern of
garment exports. In Asia, the export thrust has come mainly from local (and regional)
firms, while in Latin America foreign (particularly the United States) affiliates have
been predominant. The MFA has long dictated the location of garment exports, and has
sheltered many quota holders from the full force of competition. Its abolition by 2005
will lead to a massive ‘shake‐out’ in all exporting countries.
The OECD market has been moving to higher quality products, where the cost of
labor per se counts for less. Wages will remain the overwhelming consideration for the
slowly diminishing segment of the lowest quality products. In others, technology,
specialization, design, marketing and flexibility will be the dominant competitive
factors.

19
Table 15 shows that in 2001 the world largest garments exporters is a mixture of
labor abundant, subcontractor economies (i.e., China, Mexico, India, Bangladesh and
Indonesia) and advanced economies whose contribution to the production of garments
leaned more on technology, design and marketing (i.e., Italy, Hong Kong and
Germany).
Table 15: World’s Largest Garments Exporters, 2001
Rank Country Value of Exports to the World Market
(in USD million)
1 China 36,108
2 Italy 13,596
3 Hong Kong 9,222
4 Mexico 8,571
5 Germany 7,416
6 Turkey 7,336
7 France 6,697
8 India 6,682
9 Bangladesh 5,153
10 Indonesia 4,589
In order to cope with the strong competition from both domestic and foreign
producers of garments, leading apparel manufacturers in the United States and Europe
are adopting “strategies that will alter the content and scope of their global sourcing
networks” (Gereffi, 2001). The approach includes “shrinking their supply chains and
using fewer but more capable manufacturers”. Moreover, they are “discontinuing
certain support functions (such as pattern grading, marker making, and sample
making), and reassigning them to contractors and adopting more stringent vendor
certification systems to improve performance.” Finally, “they are shifting the
geography of their sourcing configuration from Asia to the western hemisphere”
(Gereffi, 2001).
Thus, “the decision of many larger manufacturers in developed countries is no
longer whether to engage in foreign production, but how to organize and manage it”
(Gereffi, 2001). Similar to other GPNS, flagships supply, or designate a supplier within
the network, intermediate inputs (cut fabric, thread, buttons, and other trim) to
extensive networks of offshore suppliers, “typically located in neighboring countries
with reciprocal trade agreements that allow goods assembled offshore to be re‐imported
with a tariff charged only on the value added by foreign labor” (Gereffi, 2001).
20
This kind of international subcontracting system exists in every region of the
world. It is called the 807/9802 program or “production sharing” in the United States
(USITC, 1997), where the sourcing networks of U.S. manufacturers are predominantly
located in Mexico, Central America, and the Caribbean; in Europe, this is known as
outward processing trade (OPT), and the principal suppliers are located in North Africa
and Eastern Europe; and in Asia, manufacturers from relatively high‐wage economies
like Hong Kong have outward processing arrangements (OPA) with China and other
low‐wage nations (Birnbaum, 1993).
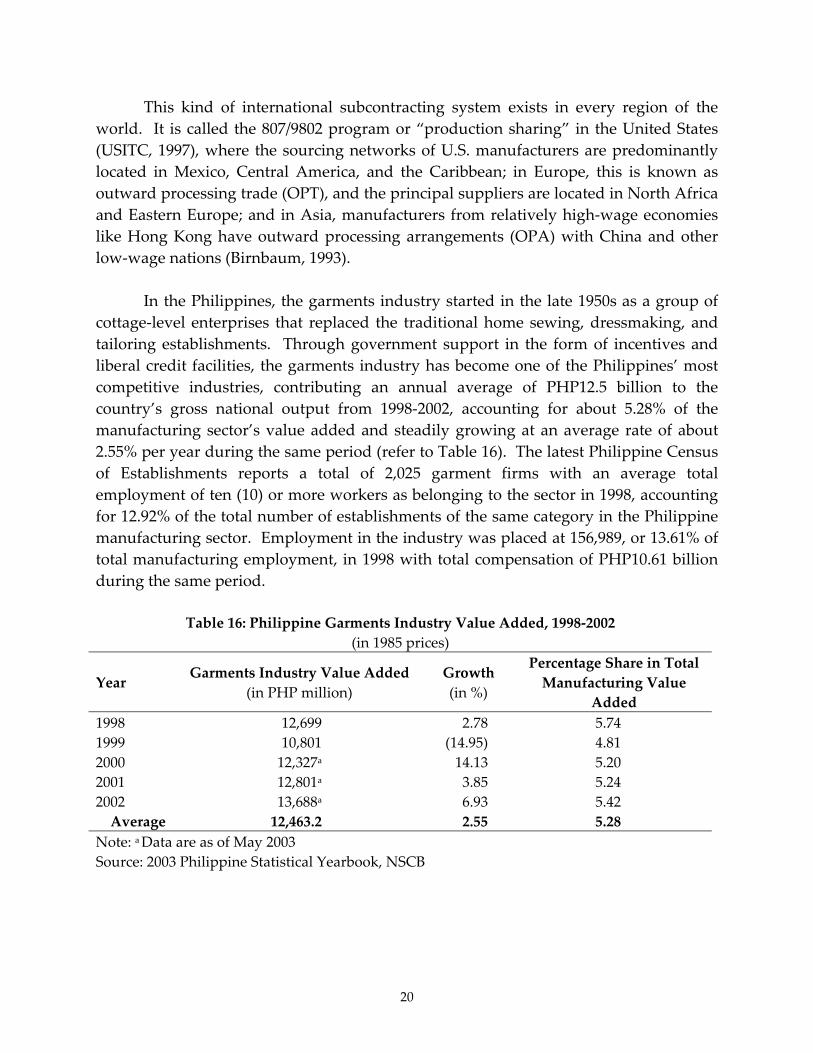
In the Philippines, the garments industry started in the late 1950s as a group of
cottage‐level enterprises that replaced the traditional home sewing, dressmaking, and
tailoring establishments. Through government support in the form of incentives and
liberal credit facilities, the garments industry has become one of the Philippines’ most
competitive industries, contributing an annual average of PHP12.5 billion to the
country’s gross national output from 1998‐2002, accounting for about 5.28% of the
manufacturing sector’s value added and steadily growing at an average rate of about
2.55% per year during the same period (refer to Table 16). The latest Philippine Census
of Establishments reports a total of 2,025 garment firms with an average total
employment of ten (10) or more workers as belonging to the sector in 1998, accounting
for 12.92% of the total number of establishments of the same category in the Philippine
manufacturing sector. Employment in the industry was placed at 156,989, or 13.61% of
total manufacturing employment, in 1998 with total compensation of PHP10.61 billion
during the same period.
Table 16: Philippine Garments Industry Value Added, 1998‐2002
(in 1985 prices)
Year Garments Industry Value Added
(in PHP million)
Growth
(in %)
Percentage Share in Total
Manufacturing Value
Added
1998 12,699 2.78 5.74
1999 10,801 (14.95) 4.81
2000 12,327a 14.13 5.20
2001 12,801a 3.85 5.24
2002 13,688a 6.93 5.42
Average 12,463.2 2.55 5.28
Note: a Data are as of May 2003
Source: 2003 Philippine Statistical Yearbook, NSCB

21
Table 17: Change in the Number of Philippine Garment Firms and its Employment Level,
1997‐1998
Number of Firms Number of Paid Employeesa Year
Garments Manufacturing Garments Manufacturing
1997 2,003 14,734 154,006 1,097,175
1998 2,025 15,674 156,989 1,153,526
Percentage Change 1.10 6.38 1.94 5.14
Note: a Averages for the year
Source: 2003 Philippine Statistical Yearbook, NSCB
Table 18: Philippine Garments Industry Revenue and Costs, 1997‐1998
(in PHP million, current prices)
Year Revenue Total Cost
1997 50,205 33,030
1998 55,472 32,815
Percentage Change 10.49 (0.65)
Source: 2003 Philippine Statistical Yearbook, NSCB
Relative to the manufacturing sector, however, the industry grew at a slower
pace in terms of the number of establishments, 1.1% compared to the manufacturing
sector’s 6.4%, and employment, 1.9% versus 5.1% (refer to Table 17). Revenue,
nonetheless, rose by 10.5% during the period accompanied by a slight reduction in cost,
0.65% (refer to Table 18)
Meanwhile, in general, exporters in the sector are members of the to the
Garments and Textiles Export Board (GTEB). During the period 2001‐2003 these
accounted for about 40% of the total establishments in the industry. At least a third of
these establishments are medium‐sized firms with a capitalization of at least PHP6
million (refer to Table 19).
Table 19: GTEB Registered Firms
Firm Size 2001 2002 2003
<PHP1 million capital 265 292 334
>PHP1 million>PHP6 million capital 268 283 297
>PHP6 million capital 243 252 258
Total 776 827 889
Source: Garments and Textile Exports Board
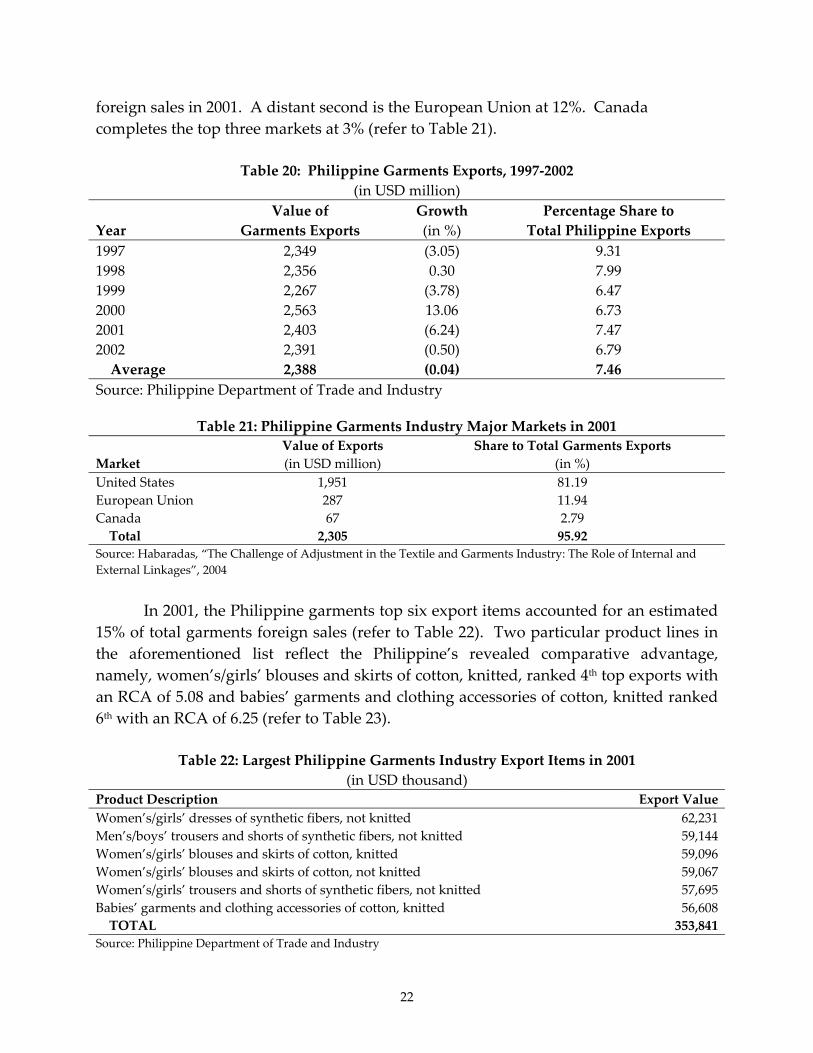
Moreover, garments exports, valued at an average of US$ 2.4 billion, accounted
for about 7.5% of the Philippine’s total exports from 1997 to 2002 (refer to Table 20).
The country’s primary market is the United States accounting for about 81% of total
22
foreign sales in 2001. A distant second is the European Union at 12%. Canada
completes the top three markets at 3% (refer to Table 21).
Table 20: Philippine Garments Exports, 1997‐2002
(in USD million)
Year
Value of
Garments Exports
Growth
(in %)
Percentage Share to
Total Philippine Exports
1997 2,349 (3.05) 9.31
1998 2,356 0.30 7.99
1999 2,267 (3.78) 6.47
2000 2,563 13.06 6.73
2001 2,403 (6.24) 7.47
2002 2,391 (0.50) 6.79
Average 2,388 (0.04) 7.46
Source: Philippine Department of Trade and Industry
Table 21: Philippine Garments Industry Major Markets in 2001
Market
Value of Exports
(in USD million)
Share to Total Garments Exports
(in %)
United States 1,951 81.19
European Union 287 11.94
Canada 67 2.79
Total 2,305 95.92
Source: Habaradas, “The Challenge of Adjustment in the Textile and Garments Industry: The Role of Internal and
External Linkages”, 2004
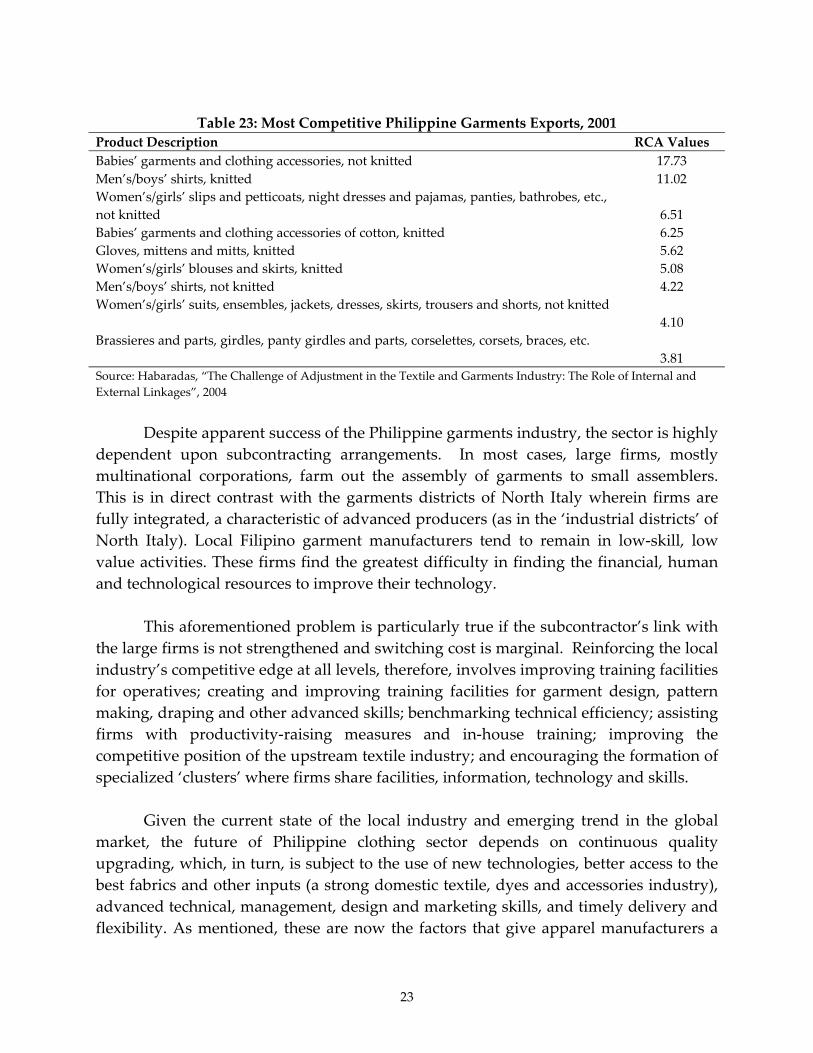
In 2001, the Philippine garments top six export items accounted for an estimated
15% of total garments foreign sales (refer to Table 22). Two particular product lines in
the aforementioned list reflect the Philippine’s revealed comparative advantage,
namely, women’s/girls’ blouses and skirts of cotton, knitted, ranked 4th top exports with
an RCA of 5.08 and babies’ garments and clothing accessories of cotton, knitted ranked
6th with an RCA of 6.25 (refer to Table 23).
Table 22: Largest Philippine Garments Industry Export Items in 2001
(in USD thousand)
Product Description Export Value
Women’s/girls’ dresses of synthetic fibers, not knitted 62,231
Men’s/boys’ trousers and shorts of synthetic fibers, not knitted 59,144
Women’s/girls’ blouses and skirts of cotton, knitted 59,096
Women’s/girls’ blouses and skirts of cotton, not knitted 59,067
Women’s/girls’ trousers and shorts of synthetic fibers, not knitted 57,695
Babies’ garments and clothing accessories of cotton, knitted 56,608
TOTAL 353,841
Source: Philippine Department of Trade and Industry
23
Table 23: Most Competitive Philippine Garments Exports, 2001
Product Description RCA Values
Babies’ garments and clothing accessories, not knitted 17.73
Men’s/boys’ shirts, knitted 11.02
Women’s/girls’ slips and petticoats, night dresses and pajamas, panties, bathrobes, etc.,
not knitted
6.51
Babies’ garments and clothing accessories of cotton, knitted 6.25
Gloves, mittens and mitts, knitted 5.62
Women’s/girls’ blouses and skirts, knitted 5.08
Men’s/boys’ shirts, not knitted 4.22
Women’s/girls’ suits, ensembles, jackets, dresses, skirts, trousers and shorts, not knitted
4.10
Brassieres and parts, girdles, panty girdles and parts, corselettes, corsets, braces, etc.
3.81
Source: Habaradas, “The Challenge of Adjustment in the Textile and Garments Industry: The Role of Internal and
External Linkages”, 2004
Despite apparent success of the Philippine garments industry, the sector is highly
dependent upon subcontracting arrangements. In most cases, large firms, mostly
multinational corporations, farm out the assembly of garments to small assemblers.
This is in direct contrast with the garments districts of North Italy wherein firms are
fully integrated, a characteristic of advanced producers (as in the ‘industrial districts’ of
North Italy). Local Filipino garment manufacturers tend to remain in low‐skill, low
value activities. These firms find the greatest difficulty in finding the financial, human
and technological resources to improve their technology.
This aforementioned problem is particularly true if the subcontractor’s link with
the large firms is not strengthened and switching cost is marginal. Reinforcing the local
industry’s competitive edge at all levels, therefore, involves improving training facilities
for operatives; creating and improving training facilities for garment design, pattern
making, draping and other advanced skills; benchmarking technical efficiency; assisting
firms with productivity‐raising measures and in‐house training; improving the
competitive position of the upstream textile industry; and encouraging the formation of
specialized ‘clusters’ where firms share facilities, information, technology and skills.
Given the current state of the local industry and emerging trend in the global
market, the future of Philippine clothing sector depends on continuous quality
upgrading, which, in turn, is subject to the use of new technologies, better access to the
best fabrics and other inputs (a strong domestic textile, dyes and accessories industry),
advanced technical, management, design and marketing skills, and timely delivery and
flexibility. As mentioned, these are now the factors that give apparel manufacturers a

24
competitive edge in the world market. High degrees of vertical integration, needed in
the past to ensure reliable quality and delivery, is less of an advantage, as higher quality
products tend to require smaller firms and greater inter‐firm specialization and
subcontracting.
Although the local garment sector has reasonable human capital, especially in
fine embroidery (important for infant wear and certain dresses where the Philippines
has a leading position in US markets), it is weak in several specialized technical skills
(pattern making, draping and design). Worker productivity is variable, but there have
been few attempts to raise productivity by benchmarking. Small producers are the
furthest behind world ‘best practice’, but several large producers have also not
introduced appropriate process and quality management techniques. As far as
equipment is concerned, investments and FDI in the industry have fallen behind those
in other industries.
Some large exporters have invested in CAD/CAM equipment, containerization of
shipments and advanced process systems, and so improved their quality and
turnaround times. However, the bulk of the industry remains uncompetitive by best
practice standards. Design capabilities in the Philippines clothing industry, albeit
growing, remain weak. Existing design schools are inadequate and firms often hire
expensive foreign designers. Design weaknesses hold back quality upgrading, since
producers are unable to offer buyers their own collections and find it more difficult to
‘shop around’ for different, more rewarding, markets.
Moreover, the heavy dependence of manufacturers on imported raw materials is
a major industry concern. Increasing the sector’s value added and boosting its
competitive edge requires the development of a “strong forward and backward linkage
between garments and textiles industries” (Austria, 1996). Evidenced by the South
Korean and Chinese experiences, an internationally competitive fabric producing sector
is the backbone of successful garment exporting economies (World Bank. 1987). As
local textiles are relatively more expensive, the Philippine apparel industry sources
more than 90% of its raw material needs abroad.
In addition, delivery times by Philippine exporters are variable: good firms can
deliver products to the EC in 30‐40 days, but most need 60 days for repeat orders. While
this is better than the regional average (for South Asia, China, Indonesia or Thailand) of
90 days, it does not match East Europe or Turkey’s 21‐40 days, or West Europe’s 14‐28
days. In terms of quality as shown by average unit price, Philippine garments fetch
lower prices than those from Hong Kong, Korea, Malaysia, India, China, Thailand,
Indonesia, Mexico or Turkey. The industry suffers from weaknesses in the upstream

25
local textile industry, which has poor dyeing and finishing capabilities. This forces
garment producers to rely heavily upon imports, often adding to their lead times.
Finally, according to the U.S. International Trade Centre, critical to the
continuous growth and development of the garments industry in any country are the
following: business climate, infrastructure conditions, proximity and preferential access
to major world markets, access to a reliable supply of raw materials, availability of low‐
cost skilled workers and skilled management, and level of supplier service and
reliability. Business climate includes macroeconomic factors (i.e., investment,
bureaucracy, etc.). Infrastructure, on the other hand, is not limited to the availability of
road networks but, most importantly, the speed with which information are transmitted
and received (telecommunications). The quality of the labor force is likewise an
important consideration (i.e., factors relating to trainability). Last but not least,
investors need to be assured that there will be a reliable supply of raw materials, which
pertains to the level of development of support industries (i.e., the textile and chemical
sectors to name two).
6. Global Production Networks and Local Development Policy
The extent to which local industrial clusters can take advantage of globalization
to engage in a process of learning and upgrading largely depends on the ability of local
institutions to successfully integrate GPN operations into the local economic activities.
The experience of Third Italy and Silicon Valley, for example, show that regional
industries that succeed in the global economy have built a culture of learning and
innovation supported by local institutions such as governments, community‐based,
employersʹ and workersʹ associations.
Thus, as local enterprises struggle to adapt their mode of operation to build a
sustainable competitive advantage, local institutions, likewise, need to find new and
flexible ways to mediate between GPN needs while supporting industrial
competitiveness. Local institutions can develop policies to simultaneously (1) support
the acquisition of new knowledge and competencies in the industrial community, and
(2) ensure that the gains from learning are distributed on a fair basis among local actors
(Morgan, 1996).
The idea of policy networks can be applied in a variety of ways to support skills
building and upgrading at the local level. First, while their focus remains primarily
local, innovative development policies should be articulated within a global
perspective. A vision of how global production networks are structured, and how
particular sets of firms are integrated within them, will provide a useful set of
26
benchmarks for local policy formulation. Local institutions can help firms, SMEs in
particular, to successfully integrate into global networks by identifying opportunities
and threats in the global environment, and facilitating the establishment of innovative
development policies should be articulated with a global vision.
III. CONCLUSION
There seems to be no question that the type FDI that will benefit developing
countries the most are those that link local industries with the global production
network. Empirical evidence shows that these types of investments promote the
incorporation of latest technologies, quality control procedures in satellite firms.
management techniques speeded up. Likewise, research findings indicate that the pace
of upgrading production processes speeded up and production output responded to
the cycle of innovation in the home country (country of origin) markets of subsidiaries
integrated into the regional or global production network.
Trade and investment liberalization and deregulation policies, whether undertaken
unilaterally, in the regional and/or multilateral levels facilitate the creation of GPNs.
Liberalization and deregulation policies in pursuit of international competitiveness,
however, necessitated the review of industry norms and structure to more fully take
advantage of the opportunities offered by globalization (i.e., the relatively unfettered
flow of information and production resources). Global competition meant efficiency
and productivity just as governance meant transparency and accountability.
Meanwhile, FDI are more and more being undertaken to form strategic alliances,
partnerships and networks. FDI is no longer just grounded on material resources but
now anchored in the supply of intellectual capital as inputs, the ability to spawn
innovations, creations, and inventions (Suarez‐Villa, 2000). Thus, highlighting the
importance of the globalization of technology, which allows the global exploitation of
technology as in patents or intellectual property rights (IPR); global technological
cooperation in resource pooling, complementarities or strategic alliances; and global
generation of technology within a single MNC in laboratories is situated abroad. In this
respect, East Asia may consider the newfound IT competitive advantage of South Asia,
especially India, as part of the Asian network of strategic alliances which have much to
do with GPNs.
These regulations paved the way for the evolution of GPNs as in garments,
automobiles, electronics and hard disk drives. GPNs involve inter‐ and intra‐firm
relationships of MNCs in collaboration with local enterprises creating a virtuous circle.
The relative dynamism and openness of East Asia attracted leading MNCs to relocate

27
part of their production to their shores facilitating their entry to the so‐called global
production networks (GPNs).
In the Philippines, the challenge is to sustain the integration of local firms within
global production networks through the implementation of networking strategies
between local institutions, supporting agencies, and enterprises. The role of these
innovative policy networks is particularly important at the local level, in specialized
industrial clusters where globalization pays more, or hits harder, and where innovative
policy institutions are striving to find new, flexible ways of interacting between
themselves and with businesses.
Finally, although entering global production networks can be an effective vehicle
for local job creation, as illustrated by the substantial increase of employment generated
in Export Processing Zones during the last decades (ILO, 1996), it is only through
industrial upgrading that the quality of jobs can be improved. In general, however,
activities performed in EPZs are typically restricted to the low‐skilled, low‐value
assembly stages of global production chains. Cost‐based competition is achieved by
ʹsweatingʹ labor.
Case studies of Singapore, Malaysia, the Philippines and India, Kuruvilla (1996),
to achieve sustainable competitive advantage and improve living standards, it is
necessary to compete on quality rather than costs, and develop the skills, involvement
and motivation of the workforce that in countries that moved from a low‐cost export‐
oriented strategy to a higher value‐added export‐oriented strategy. The focus of
industrial relations and human resource policies should, therefore, shift from cost
containment to skills development and workforce flexibility.
Evidence shows that higher skilled and motivated workers bring more value to
production activities, which make firms more profitable and allow them to pay higher
wages. This perspective then highlights the importance of industrial relations and
human resource policies implemented by local producers and the need for widespread
improvement of employment conditions as a necessary foundation for local
development. Research findings indicate that competitive forces alone are not likely to
produce such social outcome, so that firm‐based upgrading strategies need to be
complemented by a consistent set of supportive policies.

28
References
Afuah, A.N. (1997), “Responding to Structural Industrial Changes: A Technological Evolution
Perspective”, Industrial and Corporate Change, Vol. 6, #1, 183‐202.
Appelbaum, R.P. and J. Kessler (1997), ˜Transformations in industrial organization, production
and retailing: a challenge to commodity chain analysis”, Occasional Paper, 12, Institute
for Social, Economic and Behavioral Research, University of California at Santa Barbara.
Amin, A., D. Bradley, J. Howells, J. Tomaney and C. Gentle (1994), ˜Regional incentives and the
quality of mobile investment in the less favoured regions of the EC”, Progress in
Planning 41(1): 1‐112
Arndt, Sven. (2002) “Global Production Networks and Regional Integration.” The Lowe
Institute of Political Economy, Claremont McKenna College Working Paper Series No.
wp 2003‐12
Austria, Myrna (1996). Catching Up with Asia’s Tigers, Volume II. Philippine Institute for
Development Studies, p. 73.
________________, (2000). Competitiveness of the Philippine IT Industry: What Lies Ahead.
Philippine Journal of Development 27 (2): 105‐148.
________________, (2002a). Productivity Growth in the Philippines After the Industrial Reforms
in Josef Yap. (editor), Chapter 6, The Philippines Beyond 2000: An Economic
Assessment.. Philippine Institute for Development Studies, Makati City.
________________, (2002b). East Asian Regional Cooperation: Approaches and Processes. Paper
presented at the International Conference on East Asian Cooperation: Progress and
Future Agenda. 22‐23 August 2002, Beijing, China.
________________, and John Lawrence V. Avila (2001). Looking Beyond AFTA: Prospects and
Challenges for Inter‐regional Trade. Philippine Journal of Development.28 (2): 143‐166.
Baier, Scott and Henry Bergstrand (2001), “The Growth of World Trade: Tariffs, Transport
Costs, and Income Similarity,” Journal of International Economics, 53 (1), 1‐27.
Birnbaum, D. (1993), Importing Garments through Hong Kong: Third Horizon.
Blonigen, Bruce and Robert Feenstra. “Protectionist Threats and Foreign Direct Investment.”
National Bureau of Economic Research Working Paper No. wp 5475, Cambridge,
Massachussetts.
Borensztein, Eduardo, Jose De Gregorio and Jong‐Wha Lee. “How does Foreign Direct
Investment Affect Economic Growth?” National Bureau of Economic Research, Working
Paper No. wp 5057, Cambridge Massachusetts
Borrus, M. (1995). “Left for Dead: Asian Production Networks and the Revival of US
Electronics”. University of California at Berkeley: Berkeley Roundtable on the
International Economy Working Paper.
Burgonio, M (2003), “RP Electronics Firms Post 17% Growth in Q1”, IT Matters, Business World.
Clancy, M. (1998), ˜Commodity chains, services and development: theory and preliminary
evidence from the tourism industry”, Review of International Political Economy, 5 (1):
122‐48.
29
De Dios, Loreli, 1998. “Impediments to Trade in the Philippines,” in Impediments to Trade in
APEC: The Case of China, Indonesia and Philippines. APEC Study Center Institute of
Developing Economies, Tokyo, Japan.
Dicken. P., P.F. Kelly, K. Olds and H. W‐C. Yeung (2001), ˜Chains and networks, territories and
scales: towards a relational framework for analysing the global economy”, Global
Networks, 1(2): 89‐112.
Dunning, J. (1993), Multinational Enterprises and the Global Economy. Wokingham, Addison‐
Wesley.
Dyer, J. and W. Chu (2000), ˜The determinants of trust in supplier‐automaker relationships in
the U.S., Japan, and Korea”, Journal of International Business Studies31(2): 259‐85.
Ernst, D. (2000b), ˜Global production networks and the changing geography of innovation
systems: implications for developing countries”, East‐West Centre Working Papers No.9,
Honolulu, Hawaii.
Ernst, D. and L. Kim (2001), ˜Global production networks, knowledge diffusion, and local
capability formation: a conceptual framework”, Paper presented at the Nelson & Winter
Conference, Aalborg, June 12‐15.
Ernst, Dieter. “The Internet’s Effects on Global Production Networks: Challenges and
Opportunities for Managing in Developing Asia.” East‐West Center Working Papers,
Economics Series, no. 33
Ernst, Dieter and Luthje. “Global Production Networks, Innovation, and Work: Why chip and
System Design in the IT Industry are Moving to Asia.” East‐West Working Center,
Honolulu, Hawaii.
“Foreign Direct Investment, Trade, and Global Production Networks in Asia and Europe.”
GPN Working Paper 2. Making the Connections: Global Production Networks in Europe and
East Asia.
Feenstra, R. (1998), “Integration of Trade and Disintegration of Production in the Global
Economy”, Journal of Economic Perspective 12, No 4 (Fall).
Gereffi, G. (1995), ˜Global production systems and third world development” in B. Stallings
(ed.), Global Change, Regional Response. New York, Cambridge University Press: 100‐
42.
Gereffi, G. (1999a), ˜International trade and industrial upgrading in the apparel commodity
chain”, Journal of International Economics, 48(1): 37‐70.
Gereffi, G. (1999b), ˜A commodity chains framework for analysing global industries”, mimeo,
Department of Sociology, Duke University.
Gereffi, G. (2001), “Global Sourcing in the U.S. Apparel Industry”, JTATM, Volume 1, Issue 1,
Fall 2001.
Grove, A.S. (1986), Only the Paranoid Survive, How to Exploit the Crisis that Challenge Every
Company and Career, Harper Collins Business, New York and London.
Habaradas, Raymund (2004). “The Challenge of Adjustment in the Textile and Garments
Industry: The Role of Internal and External Linkages”, IDRC.
Henderson, J. (1989). The Globalisation of High Technology Production. London, Routledge.
Ikenberry, G, John, (2000), ʺThe Political Economy of Asian Regionalismʺ, East Asian Economic
Perspectives, March, Vol 11, pp 35‐61.
30
Intal, Ponciano, 1997. Sustaining the Philippine Economic Resurgence. Paper presented
at a symposium in honor of Dr. Gerardo Sicat and Dr. Jose Encarnacion, Jr. Philippine Institute
for Development Studies, September 23‐25, 1997, Makati City.
Lopez‐de‐Silanes F., J. R. Markusen, and T. F. Rutherford. 1994. Complementarity and
Increasing Returns in Intermediate Inputs. Journal of Development Economics. 45:101‐
19.
Mathews, J. A. (1997). ʺSilicon Valley of the East: Creating a semiconductor industry in Taiwanʺ,
California Management Review, 39 (4), pp. 1‐29.
Mathews, J. A. and Cho, D. S. (2000). Tiger Technology: The Creation of a Semiconductor
Industry in East Asia. Cambridge: Cambridge University Press.
McKendrick, David, G., Doner, Richard, F. and Haggard, Stephan (2000) From Silicon Valley to
Singapore: Location and Competitive Advantage in the High Disk Drive Industry,
Stanford: Stanford University Press.
Medalla, Erlinda, 2002. “Trade and Industrial Policy Beyond 2000: An Assessment of the
Philippine Economy” in Josef Yap, (ed.), Chapter 3, The Philippines Beyond 2000: An
Economic Assessment. Philippine Institute for Development Studies, Makati City.
______________, et. al., 1995. Catching Up with Asia’s Tigers. Vol. I. Philippine Institute for
Development Studies, Makati.
___________________, 1996. Catching Up with Asia’s Tigers. Vol. II. Philippine Institute for
Development Studies, Makati.
Morgan, Kevin (1996), “Learning by Interacting: Inter‐firm Networks and Enterprise Support”
in Network of Enterprises and Local Development, (Paris: Organization for Economic
Cooperation and Development): 53‐66.
Organization for Economic Cooperation and Development, (1998), Migration and Regional
Economic Integration in Asia. Paris: OECD.
Panagariya, Arvind, Quibria, MG and Rao, Narhari, eds, (1997), The Global Trading System
and Developing Asia. New York: Oxford University Press for Asian Development Bank.
Panagariya, Arvind, (1999), Regionalism in Trade Policy: Essays on Preferential Trading.
Singapore, London: World Scientific.
Patalinghug, Epictetus, 1983. Market Concentration in Philippine Food, Home Appliance and
Textile Industries. Philippine Review of Economic and Business.20(2):215‐233.
Pineda, Virginia S., 1997. Effects of the Uniform Five Percent Tariff on Manufacturing. PTTAF‐
PSC, Tariff Commission and Philippine Institute for Development Studies, Project No.
95‐04. Makati City.
Porter, Michael, E, (1990), The Competitive Advantage of Nations. New York: Free Press.
Quibria, MG, (1997), “Labor Market Integration in Asia”, in Panagariya, Arvind, Quibria, MG
and Rao, Narhari, eds, The Global Trading System and Developing Asia. New York:
Oxford University Press for Asian Development Bank. pp 171‐202.
Ramstetter, Eric, (1998), ʺMeasuring the Size of Foreign Multinationals in the Asia‐Pacific ʺ, in
Thompson, Grahame, ed, Economic Dynamism in the Asia‐Pacific: The Growth of
Integration and Competitiveness. London and New York: Routledge, pp 185‐212.
31
Romer, Paul (1993), “Two Strategies for Economic Development: Using Ideas and Producing
Ideas”, in World Bank, Proceedings of the World Bank Annual Conference on
Development Economics 1992 (Washington, World Bank).
Sampson, Gary, P, (2000), Trade, Environment, and the WTO: The Post‐Seattle Agenda.
Washington DC: Overseas Development Council.
Shank, J. (1989), “Strategic Cost Management: New Wine or Just New Bottles”, Journal of
Management Accounting Research (Fall).
Sturgeon, Timothy J. (2000), “How Do We Define Value Chains and Production Networks?
Background paper prepared for the Bellagio Value Chains Workshop, 25 September – 1
October 2000. Rockefeller Conference Centre, Bellagio, Italy.
Suarez‐Villa, Luis, (2000), Invention and the Rise of Technocapitalism. Lanham: Rowman &
Littlefield.
Teece, David (1986), “Profiting from Technological Innovation”, Research Policy, 15, 6, 285‐306.
Timmer, Marcel, (2000), The Dynamics of Asian Manufacturing: A Comparative Perspective in
the Late Twentieth Century. Cheltenham: Edward Elgar.
Tulloch, Peter, (2000), “Asian Trade Policy Choices in a Rapidly Globalizing World Economy”,
paper presented at Asian Development Bank 13th Asian Development Outlook, Manila,
27‐28 November.
World Bank, (1987). The Philippine Issues and Policies in the Industrial Sector, Volume I,
Washington D.C.
_____________, (2000). “Trade Blocs”. New York: Oxford University Press for World Bank.

32
Appendix A: Philippine Foreign Trade, 1980‐2003
(in USD million)
Year Total Trade Growth Rate (in %)
1980 13,518 25.83
1981 13,666 1.09
1982 12,688 (7.16)
1983 12,492 (1.54)
1984 11,460 (8.26)
1985 9,740 (15.01)
1986 9,885 1.49
1987 12,457 26.02
1988 15,234 22.29
1989 18,240 19.73
1990 20,392 11.80
1991 20,891 2.45
1992 24,343 16.52
1993 28,972 19.02
1994 34,815 20.17
1995 43,985 26.34
1996 52,969 20.43
1997 61,162 15.47
1998 59,157 (3.28)
1999 65,779 11.19
2000 72,569 10.32
2001 65,207 (10.14)
2002 70,635 8.32
2003 73,198 3.63
Source: National Statistics Office
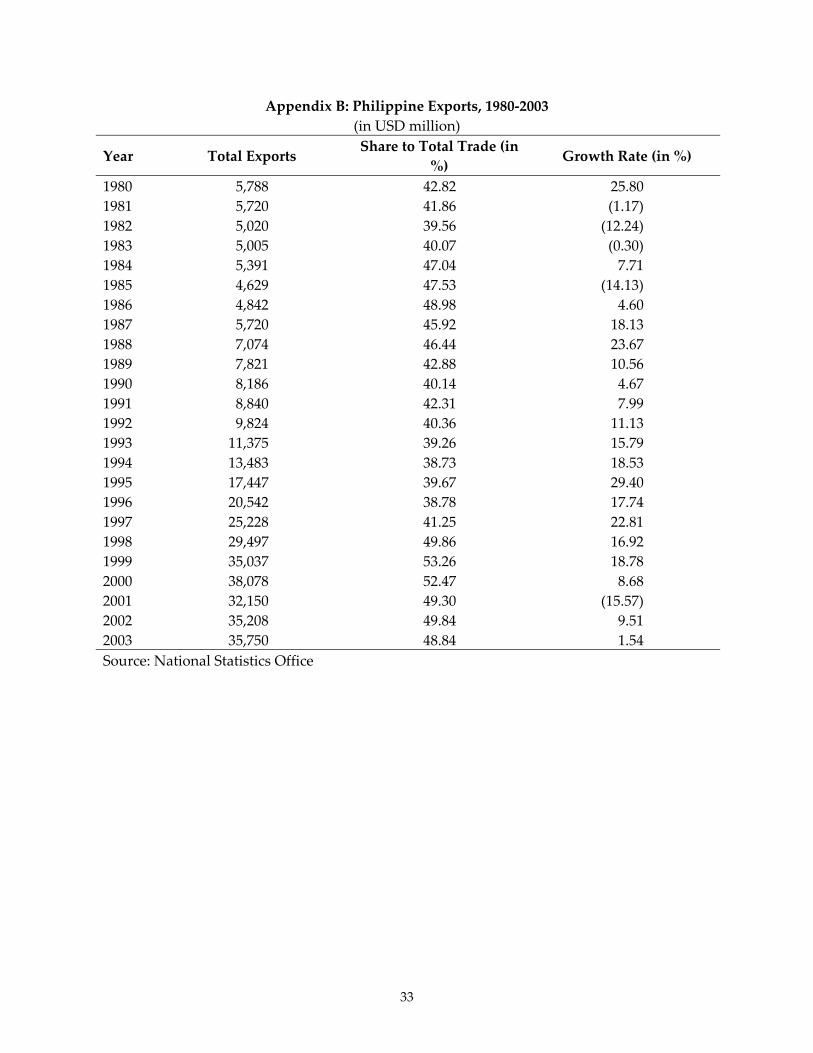
33
Appendix B: Philippine Exports, 1980‐2003
(in USD million)
Year Total Exports Share to Total Trade (in
%) Growth Rate (in %)
1980 5,788 42.82 25.80
1981 5,720 41.86 (1.17)
1982 5,020 39.56 (12.24)
1983 5,005 40.07 (0.30)
1984 5,391 47.04 7.71
1985 4,629 47.53 (14.13)
1986 4,842 48.98 4.60
1987 5,720 45.92 18.13
1988 7,074 46.44 23.67
1989 7,821 42.88 10.56
1990 8,186 40.14 4.67
1991 8,840 42.31 7.99
1992 9,824 40.36 11.13
1993 11,375 39.26 15.79
1994 13,483 38.73 18.53
1995 17,447 39.67 29.40
1996 20,542 38.78 17.74
1997 25,228 41.25 22.81
1998 29,497 49.86 16.92
1999 35,037 53.26 18.78
2000 38,078 52.47 8.68
2001 32,150 49.30 (15.57)
2002 35,208 49.84 9.51
2003 35,750 48.84 1.54
Source: National Statistics Office

34
Appendix C: Top Manufacturers of Semiconductor Devices and Other Electronic Components in the
Philippines
IT (Philippines), Inc. Nanox Philippines, Inc.
Philips Semiconductors Philippines, Inc. Daeduck Philippines, Inc.
Rohm Electronics Philippines, Inc. Fujihiro Philippines, Inc.
Texas Instruments (Philippines), Inc. Tottori Sanyo Electric (Phils.) Corp.
Intel Technology Philippines, Inc. Automated Technology (Phil.), Inc.
Ionics EMS, Inc. Rohm Mechatech Philippines, Inc.
Amkor Technology Philippines (P1/P2), Inc. Analog Devices (Philippines) Inc.
Amkor Technology Philippines (P3/P4), Inc. Shindengen Philippines Corp.
Sanyo Semiconductor Manufacturing Phils. Corp. Ibiden Philippines, Inc.
Intel Philippines Mfg., Inc. Allegro MicroSystems Philippines, Inc.
NEC Components Philippines, Inc. PerkinElmer Optoelectronics Philippines, Inc.
Dae Ryung Ind., Inc. Philippines Cirtek Electronics Corp.
Vishay (Philippines), Inc. Orient Semiconductor Electronics Phils., Inc.
Nidec Copal Philippines Corp. SB Flex Philippines, Inc.
Psi Technologies, Inc. Odawara Custom Manufacturing Service Co., Ltd.
First Sumiden Circuits, Inc. Team Pacific Corp.
Fairchild Semiconductor Hong Kong (Holdings) Ltd. Juntec Corp.
SANYO Capacitor (Philippines) Corp. Heraeus Electronic Materials Philippines, Inc.
SCG Philippines Inc. Ase Holding Electronics (Phils.), Inc.
Electronics Assemblies, Inc. Enomoto Philippine Manufacturing, Inc.
Fuji Electric Philippines, Inc. Itec Corp.
KEC‐Astron Philippines, Corp. Read‐Rite Philippines, Inc.
Dyna Image Corp. Philippines CAM Mechatronic (Phils.), Inc.
Asian Micro Manufacturing Phils., Inc. Ju‐Young Electronics (Philippines), Inc.

35
Appendix D: Value Chain of Semiconductors
Source: SEIPI, 2002
Software
Silicon Technology
Application
Fab Technology
Product
Wafer
R&D
PackageSelection/ Application
Productization Ramp to Production(RTP)
Distribution
Semiconductor Design
*R&D in materials science,
new algorithms,
embedded software
development
Funding Operations
*New Manufacturing
Technology, Process
Efficiencies, Test
Development
Packaging and
Product Design
*Packaging Design
Test
Outsourced SMS
*Assembly Efficiencies,
Inventory Management
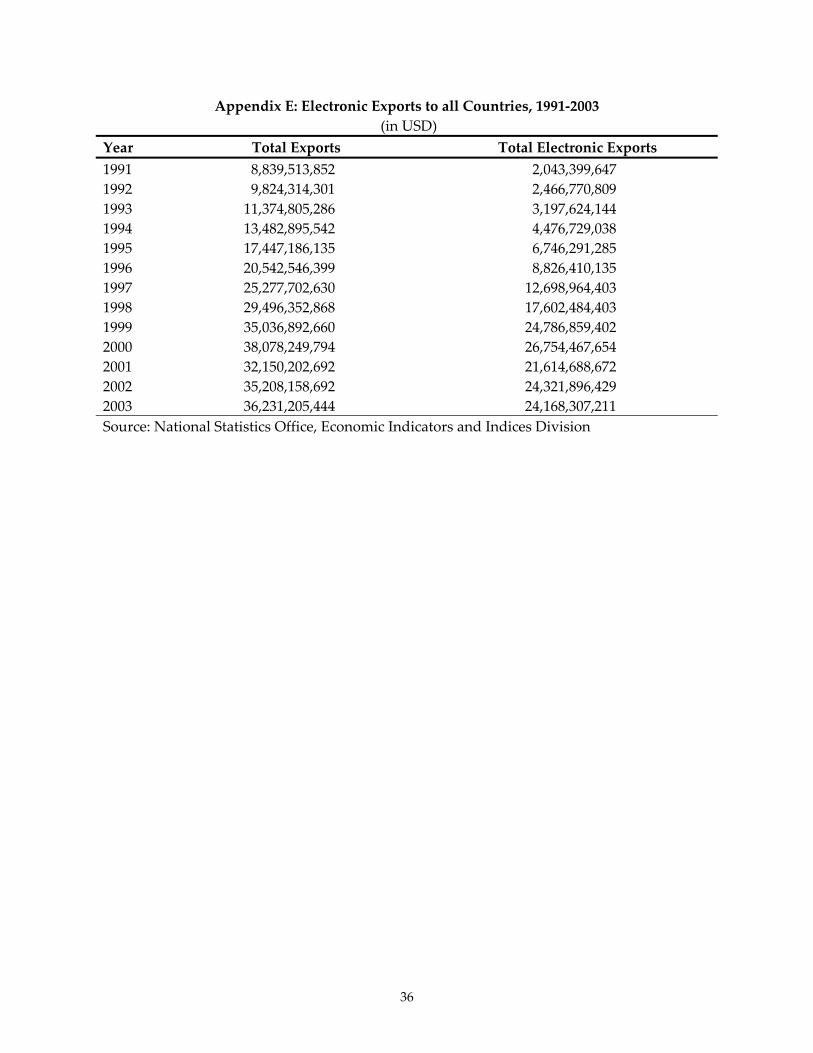
36
Appendix E: Electronic Exports to all Countries, 1991‐2003
(in USD)
Year Total Exports Total Electronic Exports
1991 8,839,513,852 2,043,399,647
1992 9,824,314,301 2,466,770,809
1993 11,374,805,286 3,197,624,144
1994 13,482,895,542 4,476,729,038
1995 17,447,186,135 6,746,291,285
1996 20,542,546,399 8,826,410,135
1997 25,277,702,630 12,698,964,403
1998 29,496,352,868 17,602,484,403
1999 35,036,892,660 24,786,859,402
2000 38,078,249,794 26,754,467,654
2001 32,150,202,692 21,614,688,672
2002 35,208,158,692 24,321,896,429
2003 36,231,205,444 24,168,307,211
Source: National Statistics Office, Economic Indicators and Indices Division
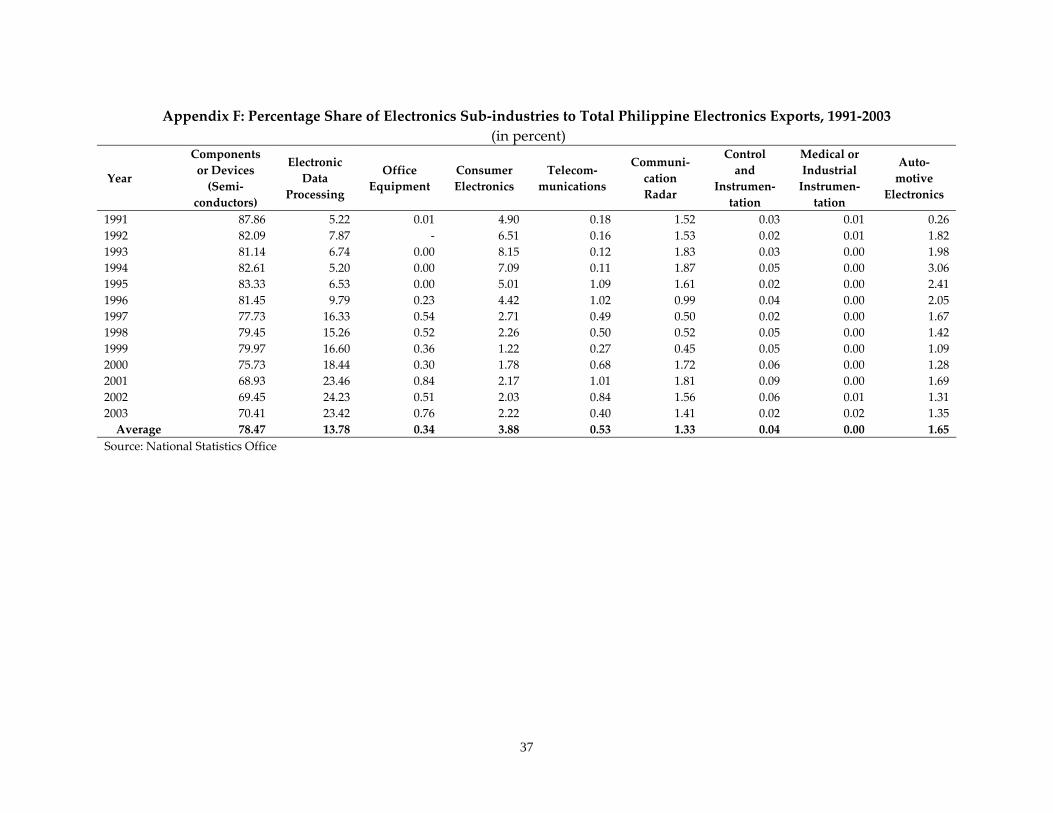
37
Appendix F: Percentage Share of Electronics Sub‐industries to Total Philippine Electronics Exports, 1991‐2003
(in percent)
Year
Components
or Devices
(Semi‐
conductors)
Electronic
Data
Processing
Office
Equipment
Consumer
Electronics
Telecom‐
munications
Communi‐
cation
Radar
Control
and
Instrumen‐
tation
Medical or
Industrial
Instrumen‐
tation
Auto‐
motive
Electronics
1991 87.86 5.22 0.01 4.90 0.18 1.52 0.03 0.01 0.26
1992 82.09 7.87 ‐ 6.51 0.16 1.53 0.02 0.01 1.82
1993 81.14 6.74 0.00 8.15 0.12 1.83 0.03 0.00 1.98
1994 82.61 5.20 0.00 7.09 0.11 1.87 0.05 0.00 3.06
1995 83.33 6.53 0.00 5.01 1.09 1.61 0.02 0.00 2.41
1996 81.45 9.79 0.23 4.42 1.02 0.99 0.04 0.00 2.05
1997 77.73 16.33 0.54 2.71 0.49 0.50 0.02 0.00 1.67
1998 79.45 15.26 0.52 2.26 0.50 0.52 0.05 0.00 1.42
1999 79.97 16.60 0.36 1.22 0.27 0.45 0.05 0.00 1.09
2000 75.73 18.44 0.30 1.78 0.68 1.72 0.06 0.00 1.28
2001 68.93 23.46 0.84 2.17 1.01 1.81 0.09 0.00 1.69
2002 69.45 24.23 0.51 2.03 0.84 1.56 0.06 0.01 1.31
2003 70.41 23.42 0.76 2.22 0.40 1.41 0.02 0.02 1.35
Average 78.47 13.78 0.34 3.88 0.53 1.33 0.04 0.00 1.65
Source: National Statistics Office
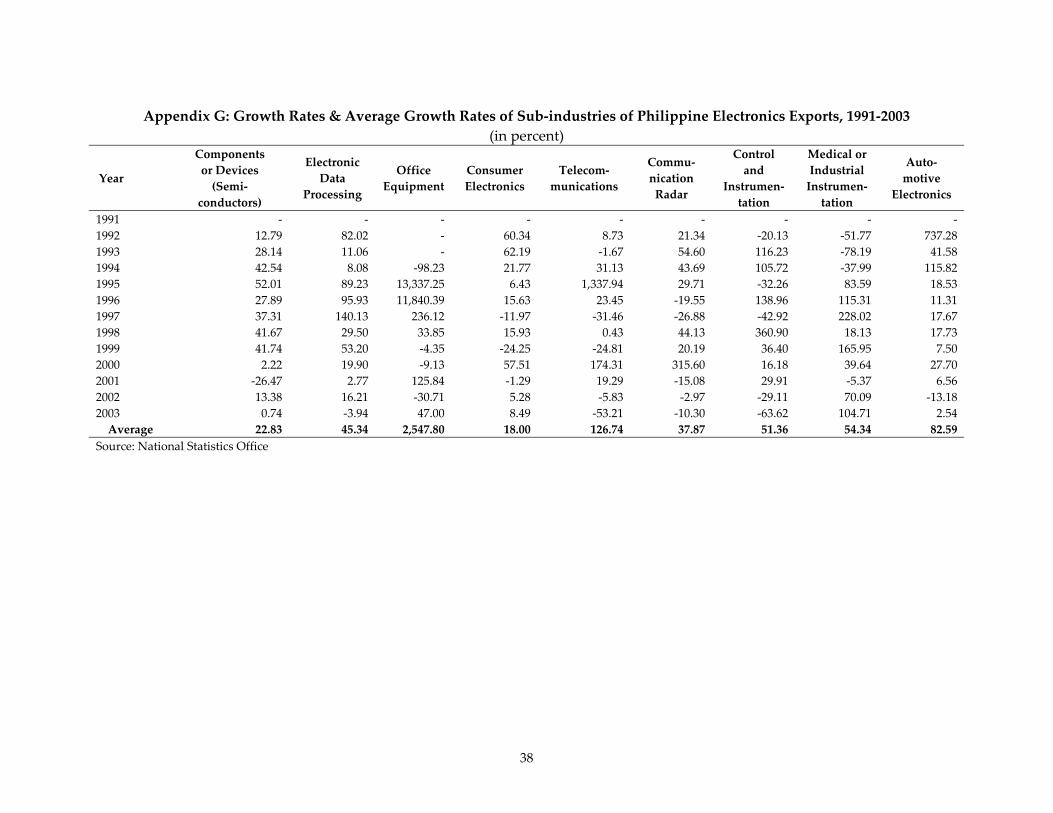
38
Appendix G: Growth Rates & Average Growth Rates of Sub‐industries of Philippine Electronics Exports, 1991‐2003
(in percent)
Year
Components
or Devices
(Semi‐
conductors)
Electronic
Data
Processing
Office
Equipment
Consumer
Electronics
Telecom‐
munications
Commu‐
nication
Radar
Control
and
Instrumen‐
tation
Medical or
Industrial
Instrumen‐
tation
Auto‐
motive
Electronics
1991 ‐ ‐ ‐ ‐ ‐ ‐ ‐ ‐ ‐
1992 12.79 82.02 ‐ 60.34 8.73 21.34 ‐20.13 ‐51.77 737.28
1993 28.14 11.06 ‐ 62.19 ‐1.67 54.60 116.23 ‐78.19 41.58
1994 42.54 8.08 ‐98.23 21.77 31.13 43.69 105.72 ‐37.99 115.82
1995 52.01 89.23 13,337.25 6.43 1,337.94 29.71 ‐32.26 83.59 18.53
1996 27.89 95.93 11,840.39 15.63 23.45 ‐19.55 138.96 115.31 11.31
1997 37.31 140.13 236.12 ‐11.97 ‐31.46 ‐26.88 ‐42.92 228.02 17.67
1998 41.67 29.50 33.85 15.93 0.43 44.13 360.90 18.13 17.73
1999 41.74 53.20 ‐4.35 ‐24.25 ‐24.81 20.19 36.40 165.95 7.50
2000 2.22 19.90 ‐9.13 57.51 174.31 315.60 16.18 39.64 27.70
2001 ‐26.47 2.77 125.84 ‐1.29 19.29 ‐15.08 29.91 ‐5.37 6.56
2002 13.38 16.21 ‐30.71 5.28 ‐5.83 ‐2.97 ‐29.11 70.09 ‐13.18
2003 0.74 ‐3.94 47.00 8.49 ‐53.21 ‐10.30 ‐63.62 104.71 2.54
Average 22.83 45.34 2,547.80 18.00 126.74 37.87 51.36 54.34 82.59
Source: National Statistics Office
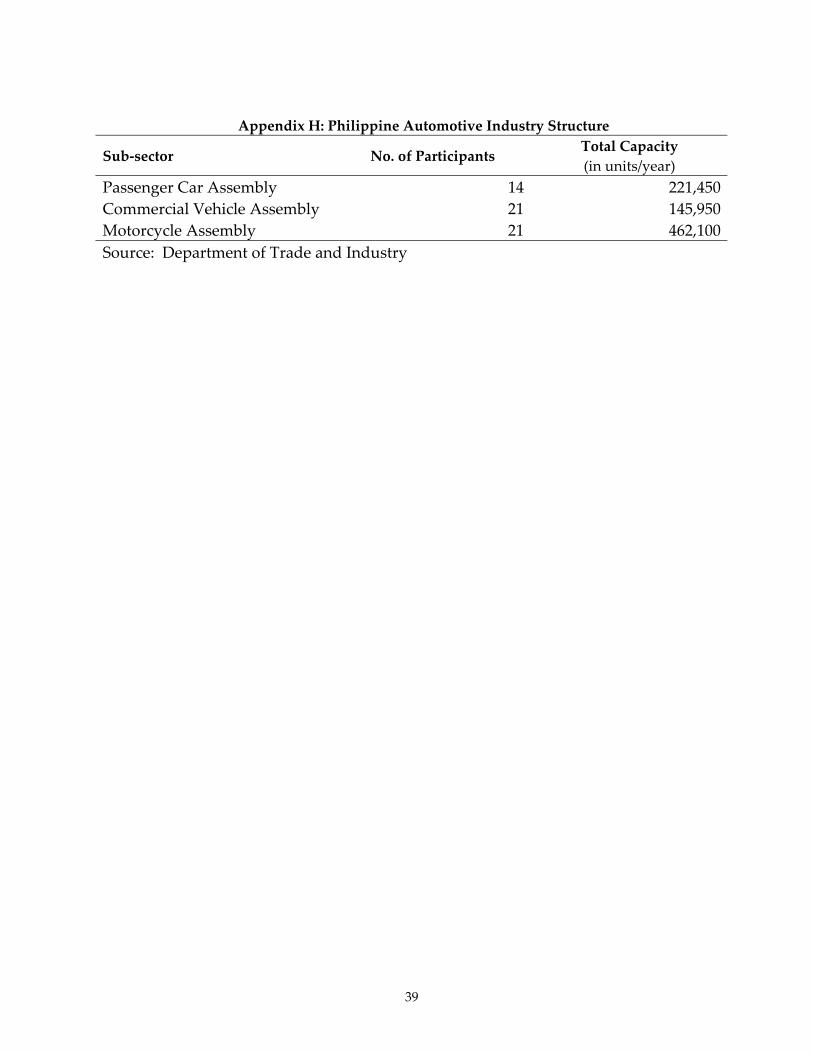
39
Appendix H: Philippine Automotive Industry Structure
Sub‐sector No. of Participants Total Capacity
(in units/year)
Passenger Car Assembly 14 221,450
Commercial Vehicle Assembly 21 145,950
Motorcycle Assembly 21 462,100
Source: Department of Trade and Industry