regional outlook: new eu members from central and eastern europe anchoring policies in uncertain...
TRANSCRIPT
Regional Outlook: New EU members from Central and Eastern Europe
Anchoring Policies in Uncertain Times
Fall 2006
Susan SchadlerEuropean DepartmentInternational Monetary Fund

Questions
I. How does economic performance in the region shape up by emerging market standards
II. Does this performance warrant markets’ relatively favorable perception of risks
III. What are the policy imperatives given the opportunities, risks and uncertainties facing the region?

Conclusions
• By emerging market (EM) standards, economic performance in CECs is good, but not in class of its own.
• Markets, however, view the CECs in something of a class apart.
• Keeping this good will as euro adoption schedules lengthen and risks rise will require strong, clearly communicated policy anchors,
• But euro adoption remains an irreplaceable opportunity to boost trade and growth and exit growing forex risk.

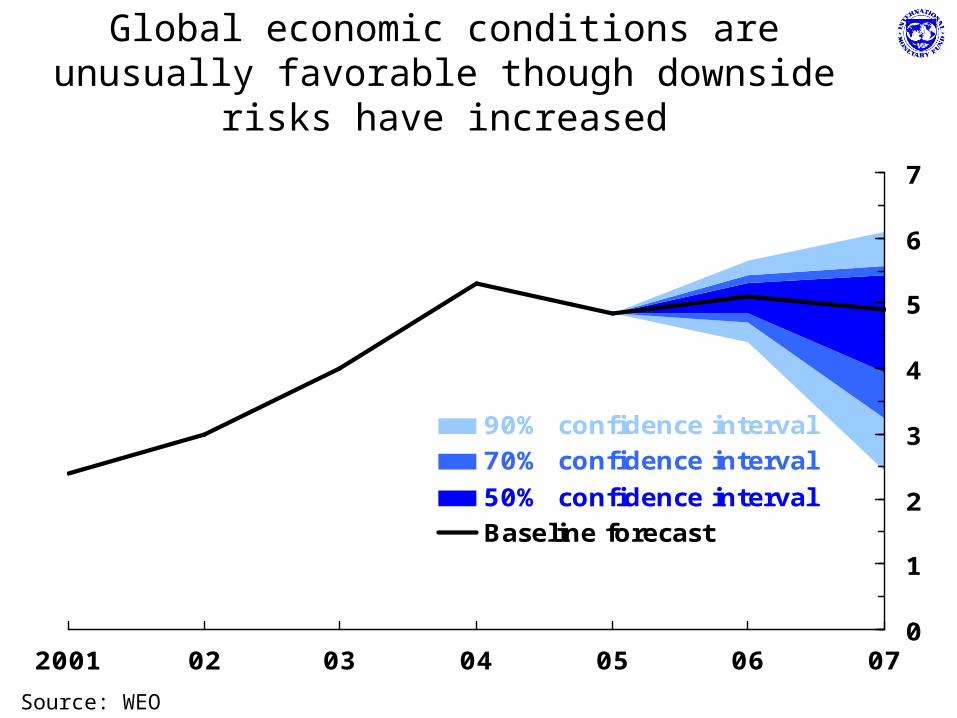
The global environment, though strong, is becoming more uncertain.
0
1
2
3
4
5
6
7
2001 02 03 04 05 06 07
90% confidence interval70% confidence interval
50% confidence intervalBaseline forecast
Global economic conditions are unusually favorable though downside risks have increased
Source: WEO
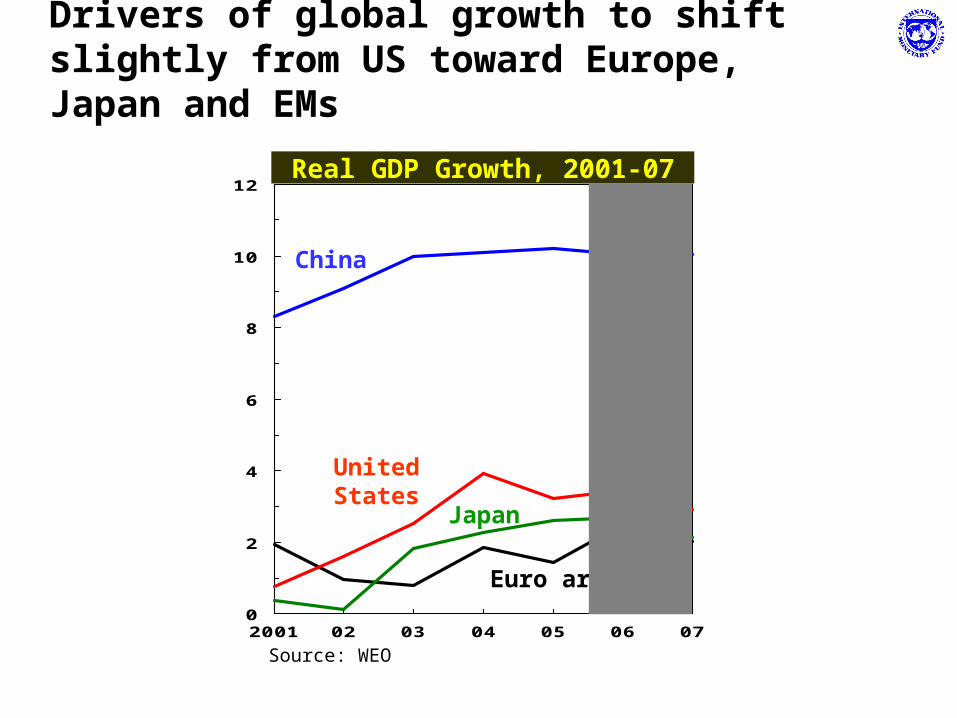
Drivers of global growth to shift slightly from US toward Europe, Japan and EMs
0
2
4
6
8
10
12
2001 02 03 04 05 06 07
UnitedStates
Japan
Euro area
China
Real GDP Growth, 2001-07
Source: WEO
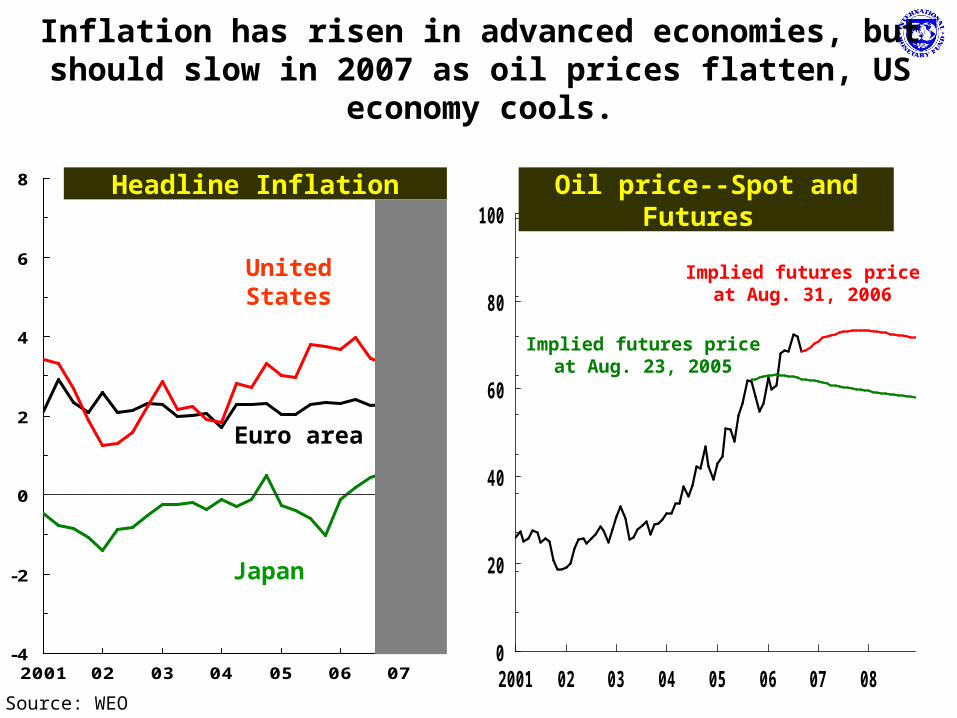
Inflation has risen in advanced economies, but should slow in 2007 as oil prices flatten, US economy cools.
-4
-2
0
2
4
6
8
2001 02 03 04 05 06 07
Headline Inflation
UnitedStates
Euro area
Japan
0
20
40
60
80
100
2001 02 03 04 05 06 07 08
Implied futures priceat Aug. 23, 2005
Implied futures priceat Aug. 31, 2006
Oil price--Spot and Futures
Source: WEO
-15
-10
-5
0
5
10
15
1997 99 2001 03 05 07 09 11-2.0
-1.5
-1.0
-0.5
0.0
0.5
1.0
1.5
2.0
1997 99 2001 03 05 07 09 11
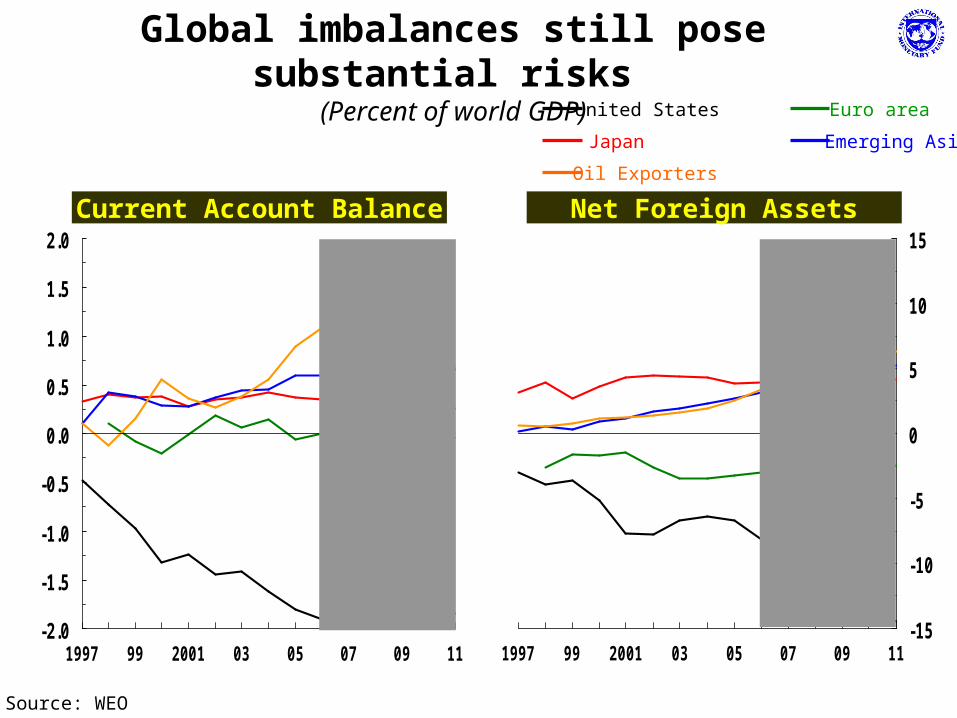
Global imbalances still pose substantial risks (Percent of world GDP)
United States Euro area
Japan Emerging Asia
Oil Exporters
Current Account Balance Net Foreign Assets
Source: WEO
I. How does CEC macro picture compare to other EMs?
• Relatively strong growth and low inflation
• But with low savings and high investment, CECs use foreign savings heavily
• This affects the risk profile in three main ways
-Large current account deficits (as other EMs shift to surpluses)
-CECs attract FDI as in other EMs, but private (mostly bank) inflows outpace other EMs
-Growing external indebtedness, household forex exposure

Growth in the CECs has been impressive …
-20
24
68
10
2001 2004 2007 2001 2004 2007 2001 2004 2007 2001 2004 2007
CEECs East Asia Latin America Other EMs
Gro
wth
of R
egio
nal R
eal G
DP
per
capita (
perc
ent)
Real Growth of Regional GDP per capita
Source: WEO
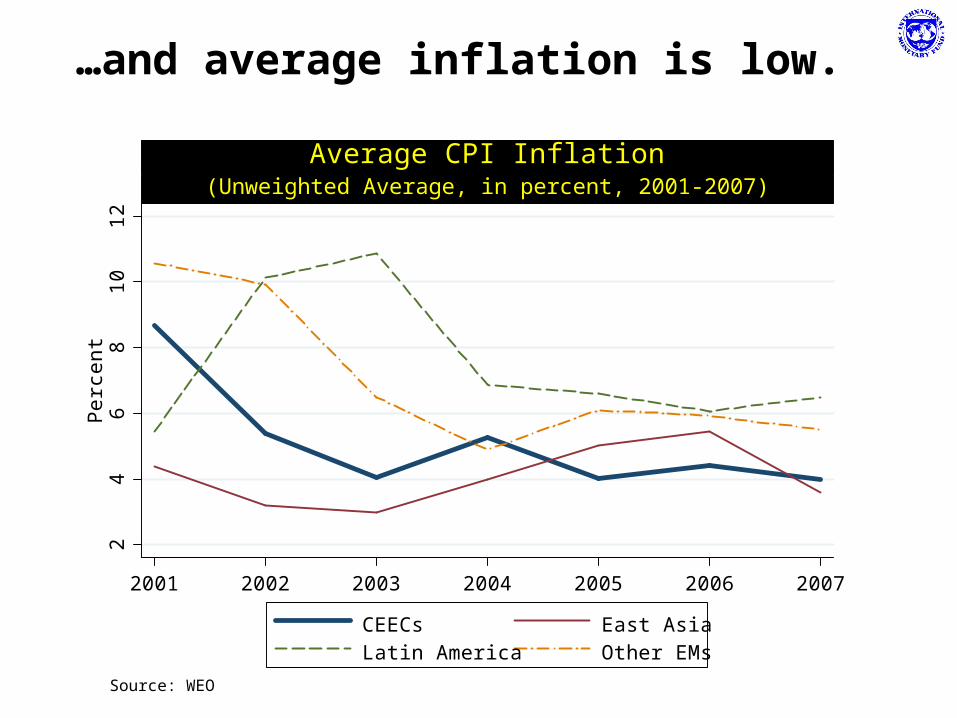
…and average inflation is low.2
46
810
12P
erce
nt
2001 2002 2003 2004 2005 2006 2007
CEECs East AsiaLatin America Other EMs
(Unweighted Average, in percent, 2001-2007)Average CPI Inflation
Source: WEO

Large current account deficits stand out
-50
5-5
05
1998 2001 2004 2007 1998 2001 2004 2007
CEECs East Asia
Latin America Other EMs
Cur
rent
Acc
ount
Bal
ance
(%
of G
DP
)
unweighted average; in percent of GDP; 1998-2007Average Current Account Balance
Source: WEO
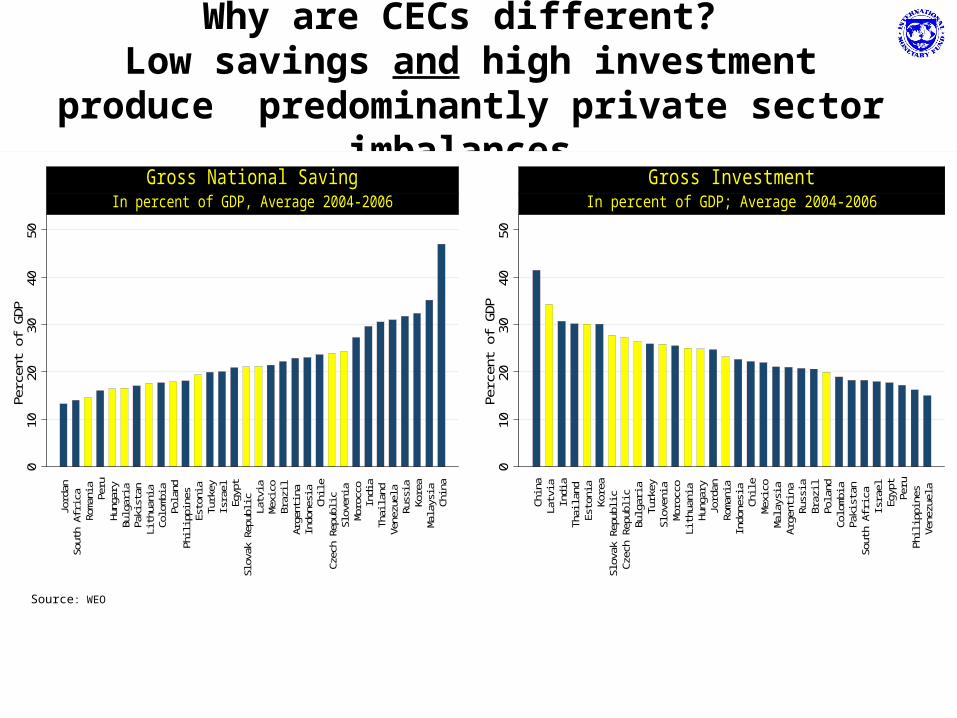
Why are CECs different? Low savings and high investment
produce predominantly private sector imbalances.
Source: WEO
010
2030
4050
Perc
ent o
f GD
P
Jord
anSo
uth
Afric
aR
oman
iaPe
ruH
unga
ryBu
lgar
iaPa
kist
anLi
thua
nia
Col
ombi
aPo
land
Phili
ppin
esEs
toni
aTu
rkey
Isra
elEg
ypt
Slov
ak R
epub
lic Latv
iaM
exic
oBr
azil
Arge
ntin
aIn
done
sia
Chi
leC
zech
Rep
ublic
Slov
enia
Mor
occo
Indi
aTh
aila
ndVe
nezu
ela
Rus
sia
Kore
aM
alay
sia
Chi
na
In percent of GDP, Average 2004-2006Gross National Saving
010
2030
4050
Perc
ent o
f GD
P
Chi
naLa
tvia
Indi
aTh
aila
ndE
ston
iaK
orea
Slo
vak
Rep
ublic
Cze
ch R
epub
licB
ulga
riaTu
rkey
Slo
veni
aM
oroc
coLi
thua
nia
Hun
gary
Jord
anR
oman
iaIn
done
sia
Chi
leM
exic
oM
alay
sia
Arg
entin
aR
ussi
aB
razi
lP
olan
dC
olom
bia
Pak
ista
nS
outh
Afri
caIs
rael
Egy
ptP
eru
Phi
lippi
nes
Vene
zuel
a
In percent of GDP; Average 2004-2006Gross Investment
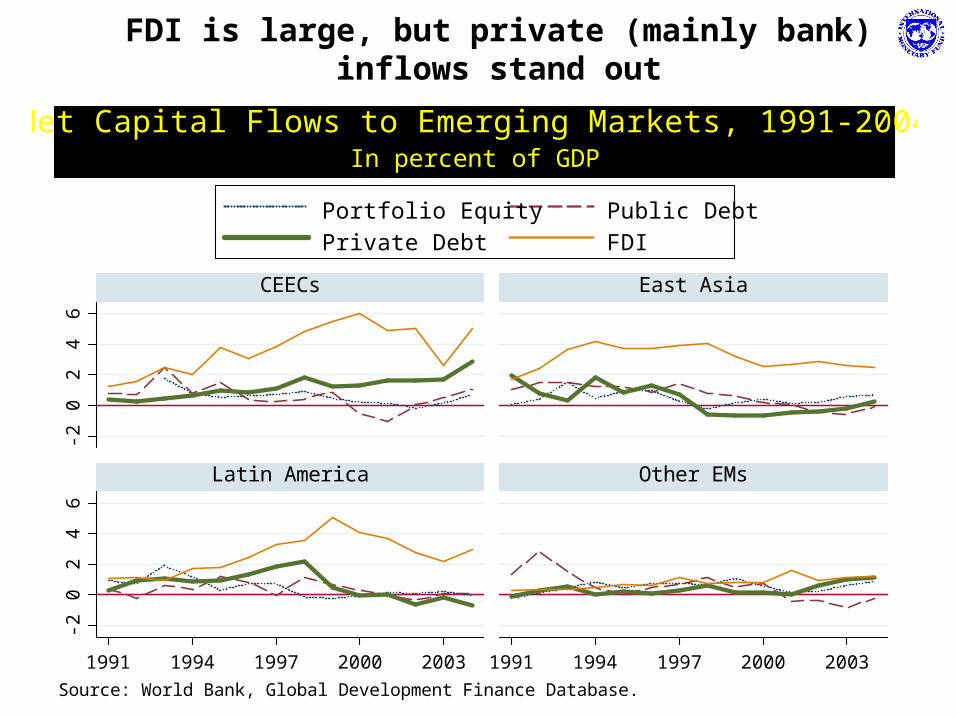
FDI is large, but private (mainly bank) inflows stand out
-20
24
6-2
02
46
1991 1994 1997 2000 2003 1991 1994 1997 2000 2003
CEECs East Asia
Latin America Other EMs
Portfolio Equity Public Debt
Private Debt FDI
Source: World Bank, Global Development Finance Database.
In percent of GDPNet Capital Flows to Emerging Markets, 1991-2004
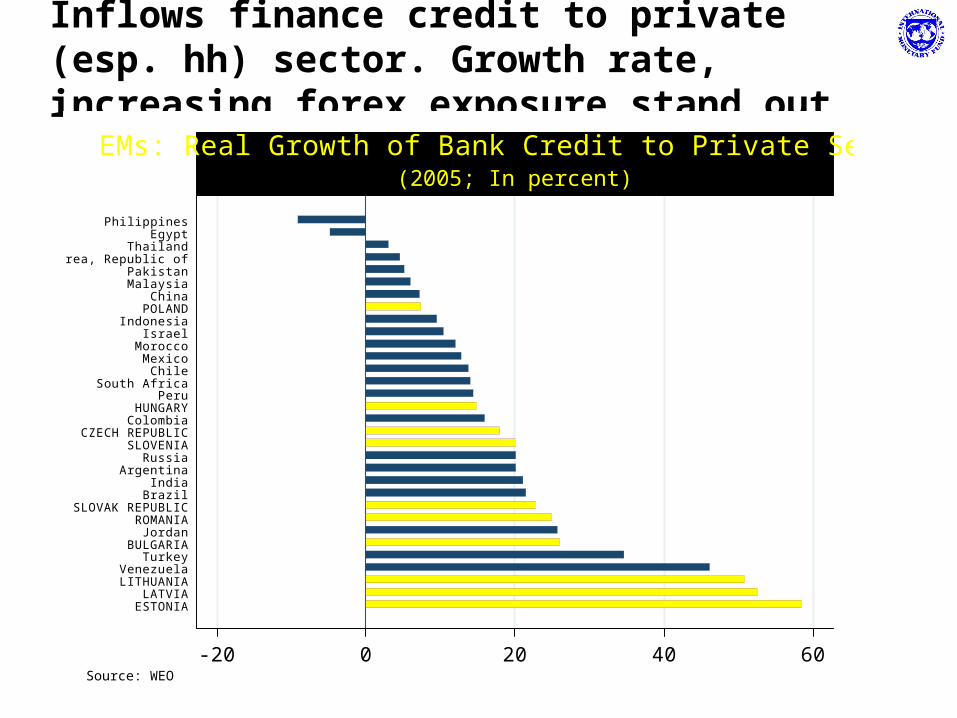
Inflows finance credit to private (esp. hh) sector. Growth rate, increasing forex exposure stand out
-20 0 20 40 60
ESTONIALATVIA
LITHUANIAVenezuela
TurkeyBULGARIA
JordanROMANIA
SLOVAK REPUBLICBrazilIndia
ArgentinaRussia
SLOVENIACZECH REPUBLIC
ColombiaHUNGARY
PeruSouth Africa
ChileMexico
MoroccoIsrael
IndonesiaPOLAND
ChinaMalaysiaPakistan
Korea, Republic ofThailand
EgyptPhilippines
(2005; In percent)EMs: Real Growth of Bank Credit to Private Sector
Source: WEO

External debt is growing in contrast to other EMs(in percent of GDP)
-20
020
4060
-20
020
4060
1998 2001 2004 20071998 2001 2004 2007
CEECs East Asia
Latin America Other EMs
Gross External Debt Net External Debt
Note: Net external debt is the gross external debt net of foreign assets in central banks and the banking sector.Source: WEO and IFS

II. How do markets view the high growth/high private sector imbalance
situation in CECs?
Different markets tell different stories. But broadly
• Market view improved steadily relative to other EMs during 2003-04 (later in Bulgaria, Romania)
• Perception gap leveled off during 2005
• EM sell-off in spring 2006 affected most CECs, but generally not harshly
• CECs maintain an edge over other EM groups (lower spreads on external debt), but this edge has diminished
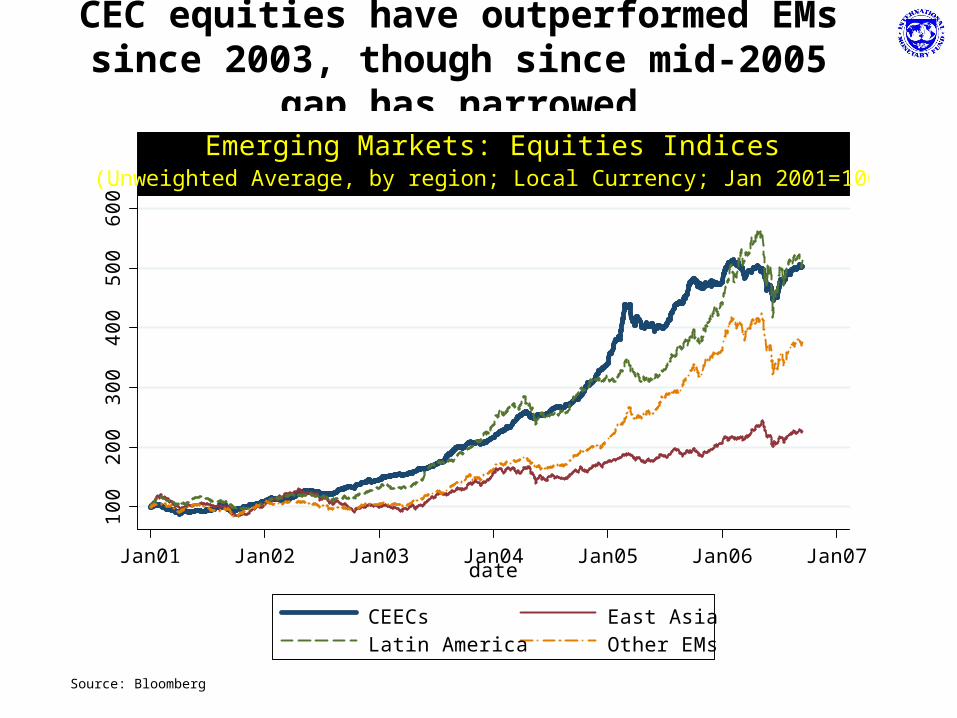
CEC equities have outperformed EMs since 2003, though since mid-2005
gap has narrowed10
020
030
040
050
060
0
Jan01 Jan02 Jan03 Jan04 Jan05 Jan06 Jan07date
CEECs East AsiaLatin America Other EMs
(Unweighted Average, by region; Local Currency; Jan 2001=100)Emerging Markets: Equities Indices
Source: Bloomberg
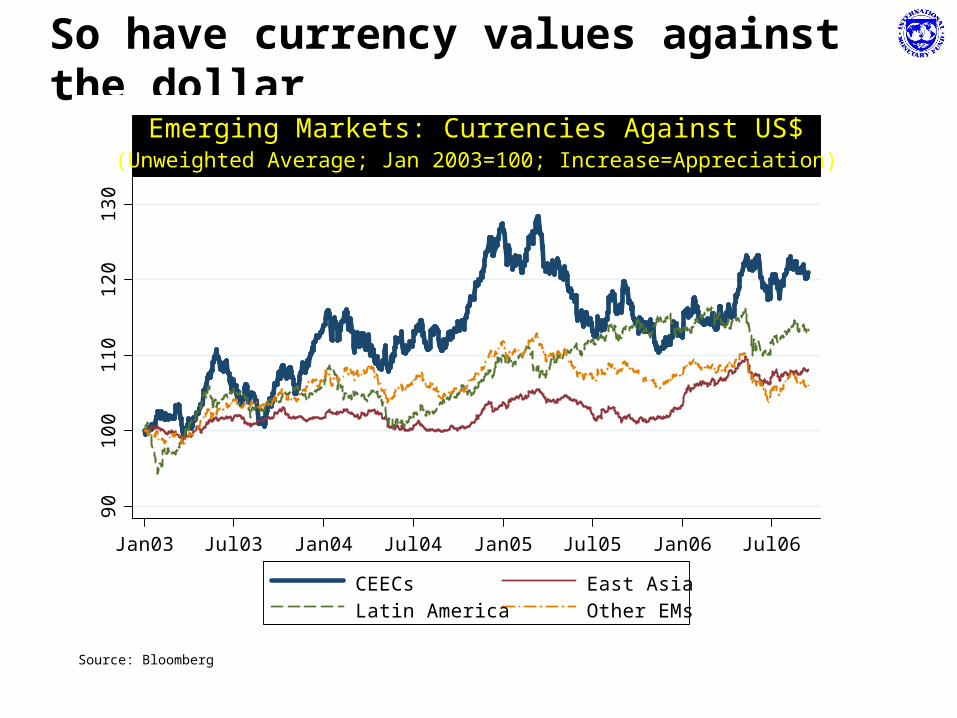
So have currency values against the dollar
9010
011
012
013
0
Jan03 Jul03 Jan04 Jul04 Jan05 Jul05 Jan06 Jul06
CEECs East AsiaLatin America Other EMs
(Unweighted Average; Jan 2003=100; Increase=Appreciation)Emerging Markets: Currencies Against US$
Source: Bloomberg

External debt spreads fell especially rapidly during 2004, but then rose relative to other
EMs25
5010
025
050
010
00E
xter
nal D
ebt S
prea
d (b
asis
poi
nts)
Jan01 Jan02 Jan03 Jan04 Jan05 Jan06 Jan07
NMS East AsiaLatin America Other EMsBulgaria Romania
(Unweighted Average; log scale)Emerging Markets: External Debt Spreads
Source: Bloomberg
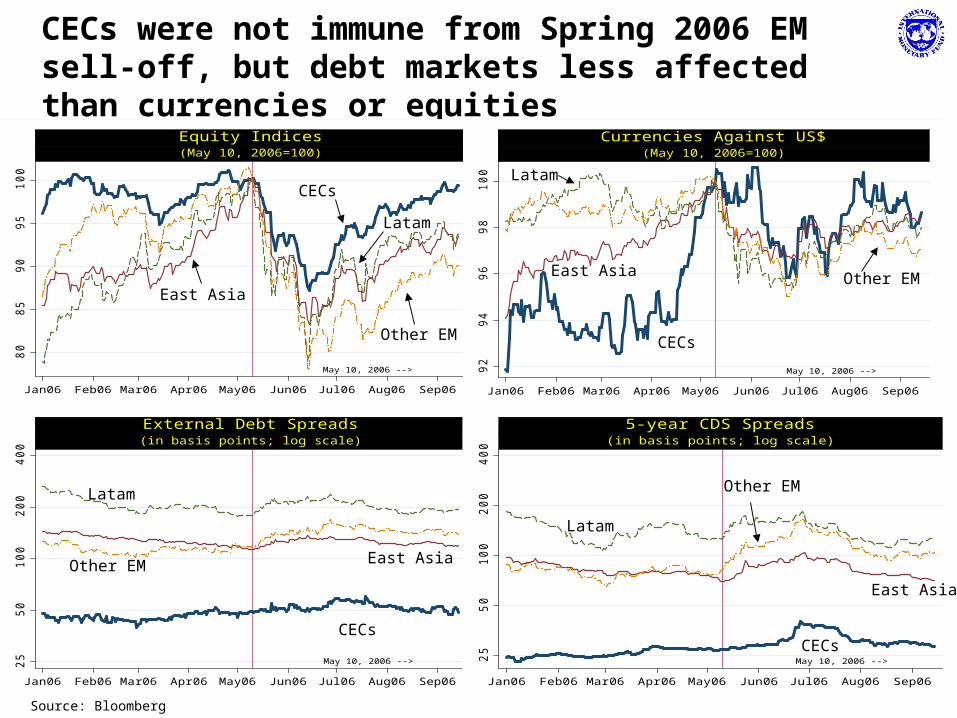
CECs were not immune from Spring 2006 EM sell-off, but debt markets less affected than currencies or equities
Source: Bloomberg
25
50
100
200
400
Jan06 Feb06 Mar06 Apr06 May06 Jun06 Jul06 Aug06 Sep06
May 10, 2006 -->
(in basis points; log scale)External Debt Spreads
25
50
100
200
400
Jan06 Feb06 Mar06 Apr06 May06 Jun06 Jul06 Aug06 Sep06
May 10, 2006 -->
(in basis points; log scale)5-year CDS Spreads
80
85
90
95
100
Jan06 Feb06 Mar06 Apr06 May06 Jun06 Jul06 Aug06 Sep06
May 10, 2006 -->
(May 10, 2006=100)Equity Indices
92
94
96
98
100
Jan06 Feb06 Mar06 Apr06 May06 Jun06 Jul06 Aug06 Sep06
May 10, 2006 -->
(May 10, 2006=100)Currencies Against US$
CECs
East Asia
Other EM
Latam
CECs
Other EMEast Asia
Latam
CECsCECs
East Asia
East Asia
Latam
Latam
Other EM
Other EM
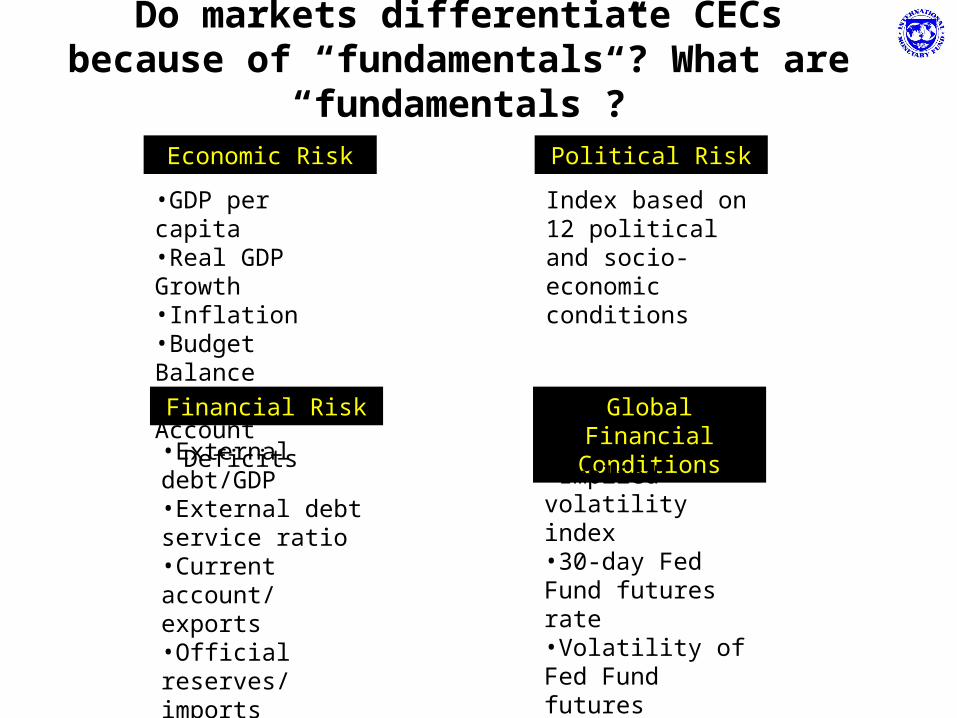
Do markets differentiate CECs because of “fundamentals”? What are
“fundamentals”?Economic Risk
•GDP per capita•Real GDP Growth•Inflation•Budget Balance•Current Account Deficits
Political Risk
Index based on 12 political and socio-economic conditions
Financial Risk
•External debt/GDP•External debt service ratio•Current account/ exports•Official reserves/ imports•Exchange rate stability
Global Financial Conditions
•Implied volatility index•30-day Fed Fund futures rate•Volatility of Fed Fund futures
Econometric analysis asks how much of debt spreads are explained by
“fundamentals”• Analysis establishes relationship of debt spreads to
“fundamentals” using data from 26 Ems
• Separates each country’s spread into two parts:
-that explained by “fundamentals”
-that not explained by “fundamentals”
• The part not explained by fundamentals reflects some non-quantifiable influence on markets’ perception of risk—e.g. EU membership or prospects for euro adoption.
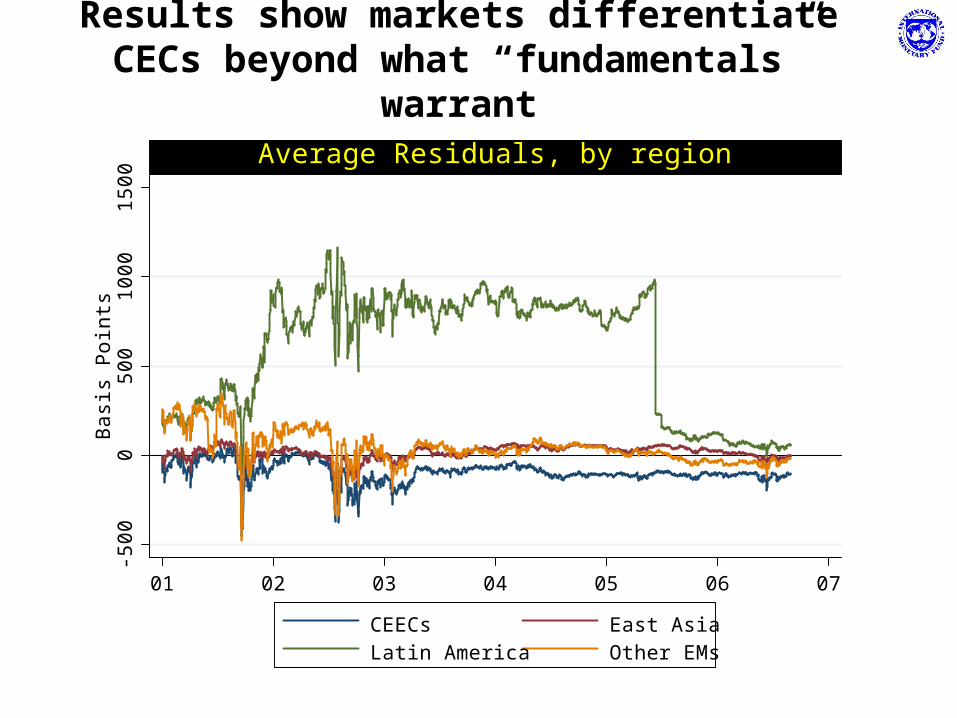
Results show markets differentiate CECs beyond what “fundamentals”
warrant-5
000
500
1000
1500
Bas
is P
oint
s
01 02 03 04 05 06 07
CEECs East AsiaLatin America Other EMs
Average Residuals, by region
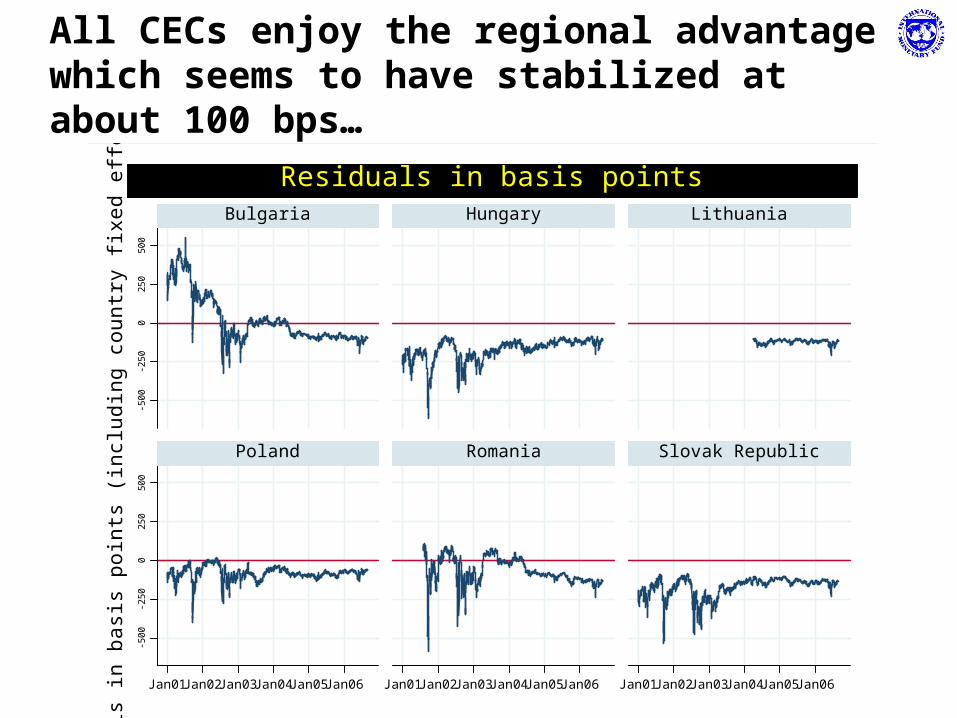
All CECs enjoy the regional advantage which seems to have stabilized at about 100 bps…
-50
0-2
50
02
50
50
0-5
00
-25
00
25
05
00
Jan01Jan02Jan03Jan04Jan05Jan06 Jan01Jan02Jan03Jan04Jan05Jan06 Jan01Jan02Jan03Jan04Jan05Jan06
Bulgaria Hungary Lithuania
Poland Romania Slovak Republic
Res
idua
ls in
bas
is p
oint
s (i
nclu
ding
cou
ntry
fixe
d ef
fect
s)
Residuals in basis points

..and seem not to be influenced by receding euro adoption prospects.
2007 2007 2007 2007 2007 2007 2007 20072008
20092008 2008 2008
2009 2009
2007 2007 20072008
2009 2009 2009 2009 20092010 2010 2010 2010 2010 2010
20102012 2012 2012 2012
20102012 2012 2012
2013
2005
2010
2015
2005
2010
2015
2005
2010
2015
Aug05 Nov05 Feb06 May06 Aug06
Aug05 Nov05 Feb06 May06 Aug06Aug05 Nov05 Feb06 May06 Aug06
Slovenia Lithuania Latvia
Estonia Slovak_Republic Czech_Republic
Poland Hungary
Median Value of the ResponsesREUTERS Polls on Euro Adoption Date
Source: Reuters
Summarizing the picture so far
• Strong economic performance
• Classic risks from private sector imbalances— investment-savings gaps, rising indebtedness fed by rapid growth of bank credit
• Markets appear impressed by the strong growth but not concerned by large imbalances.
• Sine qua non in this high risk/high return strategy is to meet market expectations for sustained, strong growth

III. What policy anchors can reinforce market good will, sustain growth?
• Euro adoption
-medium-long term boost for trade, growth
-eliminate emerging market risk premium
-exit strategy from growing private sector forex exposures
• But with euro adoption schedules receding, it is losing its value as a near-term benchmark
• Markets to judge CECs increasingly on conventional policy anchors

Policy anchors must work in tandem to achieve five policy goals
• Low inflation (inflation targeting/currency board)
• Moderate current account deficits (restraining fiscal policy)
• Financial sector soundness (supervision)
• Transparent risk (transparency of public and private accounts)
• Competitive business environment (low wage and nonwage costs of doing business)

Inflation targeting/currency boards anchor wage/price expectations…
05
1015
Israe
lM
oroc
coPO
LAND Ch
ina
LITH
UANI
ACZ
ECH
REPU
BLIC
Chile
Peru
Mal
aysia
SLOV
ENIA
Kore
a, R
epub
lic o
fSo
uth
Afric
aES
TONI
AM
exico
Thai
land In
dia
HUNG
ARY
Jord
anSL
OVAK
REP
UBLI
CCo
lom
bia
Braz
ilBU
LGAR
IALA
TVIA
Philip
pine
sPa
kista
nEg
ypt
Turk
eyAr
gent
ina
ROM
ANIA
Indo
nesia
Russ
iaVe
nezu
ela
2004-06Average Inflation
Source: WEO

…but, with open capital accounts, are inefficient in
• Curbing surges in capital inflows
• Reducing large current account deficits
• Sustaining competitiveness
• Addressing risks of private sector forex exposure
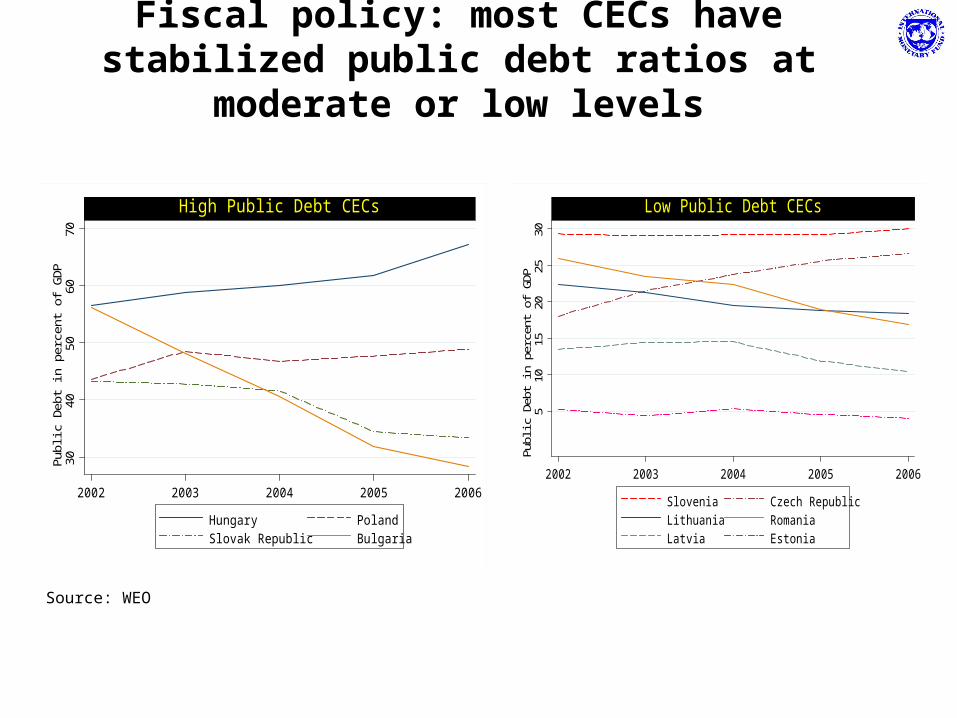
Fiscal policy: most CECs have stabilized public debt ratios at
moderate or low levels
Source: WEO
510
1520
2530
Publ
ic D
ebt i
n pe
rcen
t of G
DP
2002 2003 2004 2005 2006
Slovenia Czech RepublicLithuania RomaniaLatvia Estonia
Low Public Debt CECs
3040
5060
70Pu
blic
Deb
t in
perc
ent o
f GD
P
2002 2003 2004 2005 2006
Hungary PolandSlovak Republic Bulgaria
High Public Debt CECs

But in some, rising debt or insufficient credibility requires more than
discretionary policy
Fiscal responsibility laws are increasingly used in other EMs to sustain/signal
commitment
– Expenditure or deficit ceiling– Fiscal transparency code– Medium-term budgeting commitment

And when growth is strong and private imbalances large, fiscal policy needs to go beyond debt stabilization
In boom conditions fiscal policy becomes the sole macroeconomic policy instrument that can
• Relieve demand pressures
• Contain current account deficit
• Limit appreciation
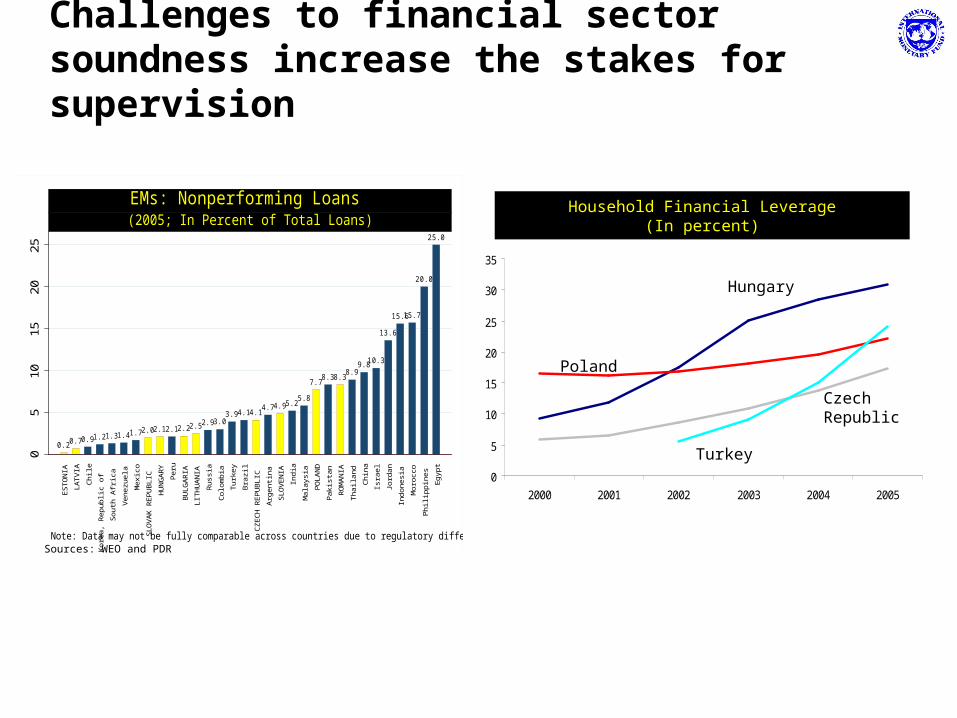
Challenges to financial sector soundness increase the stakes for supervision
0.2 0.7 0.9 1.2 1.3 1.4 1.7 2.0 2.1 2.1 2.2 2.5 2.9 3.03.9 4.1 4.1
4.7 4.9 5.25.8
7.78.3 8.3
8.99.810.3
13.6
15.615.7
20.0
25.0
05
1015
2025
ES
TON
IA
LATV
IA
Chi
le
Kor
ea, R
epub
lic o
f
Sou
th A
frica
Vene
zuel
a
Mex
ico
SLO
VAK
RE
PU
BLI
C
HU
NG
AR
Y
Per
u
BU
LGA
RIA
LITH
UA
NIA
Rus
sia
Col
ombi
a
Turk
ey
Bra
zil
CZE
CH
RE
PU
BLI
C
Arg
entin
a
SLO
VE
NIA
Indi
a
Mal
aysi
a
PO
LAN
D
Pak
ista
n
RO
MA
NIA
Thai
land
Chi
na
Isra
el
Jord
an
Indo
nesi
a
Mor
occo
Phi
lippi
nes
Egy
pt
Note: Data may not be fully comparable across countries due to regulatory differences
(2005; In Percent of Total Loans)EMs: Nonperforming Loans Household Financial Leverage
(In percent)
0
5
10
15
20
25
30
35
2000 2001 2002 2003 2004 2005
Sources: GFSR September 2006Note: Household leverage is defined as the ratio of household liabilities to household assets.Sources: WEO and PDR
Hungary
Czech Republic
Poland
Turkey

Transparency—there can’t be too much
• No ready measures of transparency
• Wide agreement that deficiencies were central to Asian currency crises in the 1990s
• Key is to ensure that risks are clear to investors and leveraged residents
• Ensure that public accounts are clear, complete
• Guard against impressions of implicit guarentees
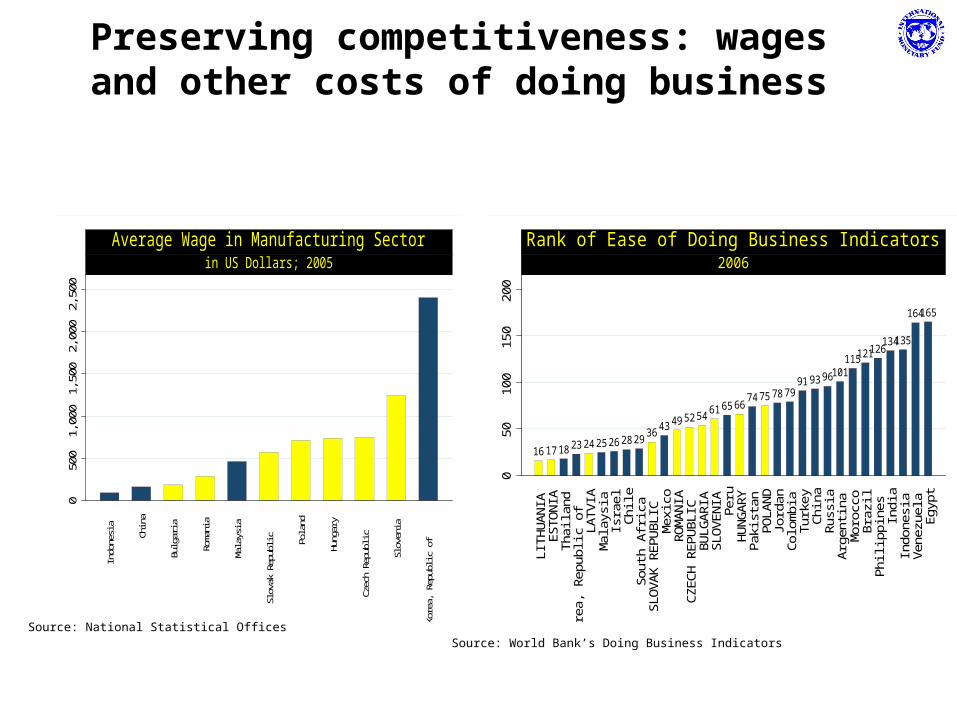
Preserving competitiveness: wages and other costs of doing business
16 17 18 23 24 25 26 28 2936
43 49 52 5461 65 66
74 75 78 7991 93 96101
115121126134135
164165
050
100
150
200
LITH
UAN
IAES
TON
IATh
aila
ndKo
rea,
Rep
ublic
of
LATV
IAM
alay
sia
Isra
elC
hile
Sout
h Af
rica
SLO
VAK
REP
UBL
ICM
exic
oR
OM
ANIA
CZE
CH
REP
UBL
ICBU
LGAR
IASL
OVE
NIA Pe
ruH
UN
GAR
YPa
kist
anPO
LAN
DJo
rdan
Col
ombi
aTu
rkey
Chi
naR
ussi
aAr
gent
ina
Mor
occo
Braz
ilPh
ilipp
ines Indi
aIn
done
sia
Vene
zuel
aEg
ypt
2006Rank of Ease of Doing Business Indicators
050
01,
000
1,50
02,
000
2,50
0
Indo
nesi
a
Chin
a
Bulg
aria
Rom
ania
Mal
aysi
a
Slov
ak R
epub
lic Pola
nd
Hung
ary
Czec
h Re
publ
ic
Slov
enia
Kore
a, R
epub
lic o
f
in US Dollars; 2005Average Wage in Manufacturing Sector
Source: World Bank’s Doing Business IndicatorsSource: National Statistical Offices

Conclusions
• Economic performance in CECs is good by EM standards, but not in class of its own.
• Markets, however, view the CECs in something of a class apart. CEC edge is shrinking but still significant.
• To keep this good will as euro adoption prospects recede, policy anchors need to be clearly communicated/oriented toward sustaining high growth.
• Euro adoption is a major opportunity and should remain a key goal of policy