regional office review of applications (rora) for … · margaret pacious, nancy daughton, dorothy...
TRANSCRIPT

Nutrition Assistance Program Report Series
The Office of Policy Support Special Nutrition Programs Report No. CN-15-RORA15
Regional Office Review of Applications (RORA) for School Meals 2015
Final Report
July 2016

USDA is an Equal Opportunity Provider

July 2016 Special Nutrition Programs
Report Number: CN-15-RORA15
Regional Office Review of Applications (RORA) For School Meals 2015
Final Report Authors:
Mustafa Karakus
Allison Roeser
Submitted By: Submitted to:
Westat Office of Policy Support
1600 Research Boulevard USDA, Food and Nutrition Service
Rockville, MD 20850-3129 3101 Park Center Drive, Room 1014
301-251-1500 Alexandria, VA 22302-1500
Project Director: Project Officer:
Mustafa Karakus Jinee Burdg
This study was conducted under GSA Contract #AG-3198-K-15-0079 with the Food and Nutrition Service. This report is available on the Food and Nutrition Service website: http://www.fns.usda.gov/ops/research-and-analysis Suggested Citation: U.S. Department of Agriculture, Food and Nutrition Service, Office of Policy Support, Regional Office Review of Applications ( RORA) for School Meals 2015, by Mustafa Karakus, Allison Roeser. Project Officer, Jinee Burdg. Alexandria, VA: July 2016

i
Acknowledgements and Disclaimer
This report was prepared by Dr. Mustafa Karakus and Ms. Allison Roeser of Westat for the U.S. Department of Agriculture’s Food and Nutrition Services (FNS), Office of Policy Support. Many individuals contributed to this report. The authors are grateful to Jinee Burdg, John Endahl, Timothy Wepplo and other staff at the FNS Office of Policy Support and Child Nutrition Division for their guidance and insights. All data entry and analysis for this task was supervised by Dr. Mustafa Karakus and Allison Roeser. Margaret Pacious, Nancy Daughton, Dorothy Agwa and Jim Horvath were responsible for data entry and quality control; Adam Chu reviewed the weighting strategy and the final report and Jennifer Kawata worked on statistical programming. Any opinions, findings, conclusions, and recommendations expressed in this report are those of the authors and do not necessarily reflect the views of the U.S. Department of Agriculture.

ii
Executive Summary
This is the eleventh in a series of annual reports to examine administrative errors incurred during the local educational agency’s (LEA) approval process of household applications for free and reduced-price meals in the National School Lunch Program (NSLP). Until 2009, the Food and Nutrition Service (FNS) staff reviewed the applications to make an assessment of administrative errors. Starting in 2010, Westat served as an independent reviewer to assess administrative errors in sampled applications. This report examines administrative error estimates in student certification for free and reduced-price NSLP meals. Due to the unequal probability of selection of LEA and selection of an application, additional analyses were undertaken to assess the effect of applying sample weights on the error estimates. A total of 2,801 students who submitted applications for free or reduced-price meal benefits from the School Year (SY) 2014-15 were included in the independent review. LEA determinations had administrative errors in 190 of these applications corresponding to an overall administrative error rate of 6.8 percent. Of the 190 applications with administrative errors, only 56 applications (or 2.0 percent of all applications reviewed) resulted in incorrect eligibility determination for free or reduced-price meals. Overall, the administrative error rates have stayed within the expected range that has been observed in the last ten years. Among all income-based applications, 97.9 percent of students were certified for the correct level of meal benefits based on information in the application files. Household size and income were accurately calculated for 97.6 and 96.7 percent, respectively. The rate of certification and benefit status errors were comparable to previous years with 1.9 percent and 2.9 percent, respectively. Adjusting for sample weights indicate a possible bias in the unweighted error estimates for determination of certification and benefit status. In terms of incomplete applications, 18 applications did not contain the last four digits of the social security number for the adult household member. Amount and source of current income was left blank for all adult household members in almost one percent of the income-based applications (19 out of 2,460). Seven applications were missing the signature of an adult household member on the application.

iii
Table of Contents
Chapter Page
Acknowledgements and Disclaimer ................................................................. i Executive Summary ............................................................................................ ii 1 Background .......................................................................................................... 1-1 2 Research Questions ............................................................................................ 2-1 3 Data Review Methods ........................................................................................ 3-1 4 Data Review Key Findings ................................................................................ 4-1 5 Summary of Findings and Recommendations ............................................... 5-1 References ............................................................................................................ R-1
Appendixes
A The Strata Totals of the Number of Students Approved for Free
and Reduced-price Meals and Direct Certifications in Each Stratum ................................................................................................................. A-1
B The Number of School Districts Within Each Region by the
Four Strata ........................................................................................................... B-1 C Mean and Standard Errors Estimates for Certification and
Benefit Issuance Errors for All Applications Approved or Denied on the Basis of an Application .......................................................................... C-1
D Data Management Decision Log ...................................................................... D-1

Contents (continued)
iv
Tables Page
1 List of variables that will be obtained from application review ................... 3-4 2 Administrative errors and incorrect certification determinations
on the basis of an approved/denied application, (n=2,801) (Unweighted data for SY 2014-2015) .............................................................. 4-4
3 Certification status determination for income-based applications
(n=2,460), (Unweighted data for SY 2014-15) ............................................... 4-5 4 Benefit issuance status determination for income-based
applications (n=2,460), (Unweighted data for SY 2014-15) ......................... 4-5 5 Comparison of weighted and unweighted estimates:
administrative errors in determination of certification and benefit status among all applications approved or denied on the basis of an application (n=2,797), SY 2014-15 ............................................................. 4-9
6 Rate of processing error due to incomplete applications among
income based applications (n=2,460) , SY 2014-15 ...................................... 4-9 7 Rate of errors by certain characteristics of applications among
income based applications (n=2,796), SY 2014-15 ....................................... 4-10 8 Rate of errors by selected SFA characteristics (n=2,796),
SY 2014-15 ......................................................................................................... 4-11 9 Average Error Rates by Quartiles of Direct Certification Rate ................... 4-14
Figures
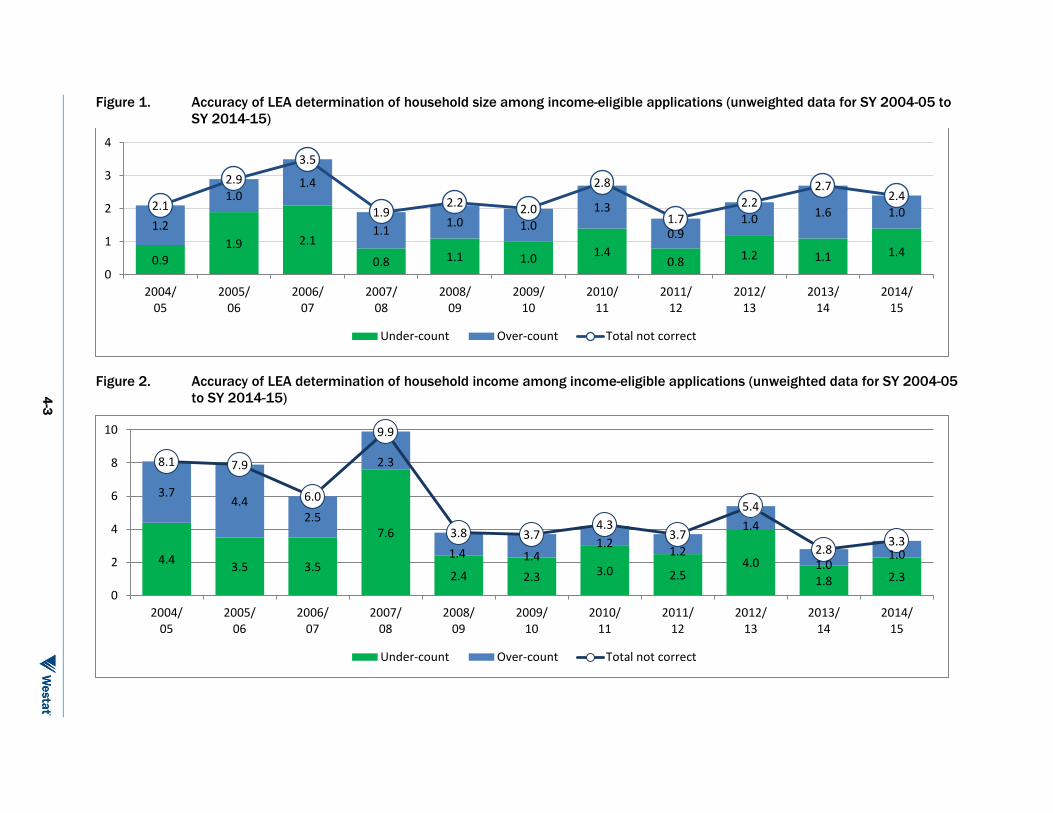
1 Accuracy of LEA determination of household size among income-eligible applications (unweighted data for SY 2004-05 to SY 2014-15) ......................................................................................................... 4-3
2 Accuracy of LEA determination of household income among
income-eligible applications (unweighted data for SY 2004-05 to SY 2014-15) ......................................................................................................... 4-3
3 Certification status determinations for all applications approved
or denied on the basis of an application, (Weighted data for SY 2004-05 to SY 2014-15) ..................................................................................... 4-6

v
4 Benefit status determinations for all applications approved or denied on the basis of an application, (Weighted data for SY 2004-05 to SY 2014-15) ..................................................................................... 4-6
5 Percent of LEAs that directly certified SNAP participants, SY
2004-05 to SY 2013-14 ...................................................................................... 4-12

1-1
The National School Lunch Program (NSLP) and the School Breakfast Program (SBP) are federally funded meal programs operating in public and nonprofit private schools and residential child care institutions. On an average school day in fiscal year (FY) 2014 the National School Lunch Program (NSLP) served lunches to 30.5 million children.1 More than two-thirds (71.1 percent) of these NSLP lunches were served free or at a reduced price to children from low-income households. The SBP is available in approximately 90 percent of all public schools that operate the NSLP. On an average school day in FY 2014, the SBP served breakfasts to 13.6 million students. The program serves a greater proportion of children from low-income households; in FY 2014, 84.7 percent of SBP meals were served free or at a reduced price. The Food and Nutrition Service (FNS) of the United States Department of Agriculture (USDA) administers the NSLP at the federal level. At the State level, State agencies, typically State departments of education operate the program through agreements with local educational agencies (LEA). Federal law, regulations and policies determine eligibility for meal benefits. Based on the federal regulation 7 CFR Part 210, the LEAs have the legal authority to operate the NSLP as well as to certify and verify student eligibility for free and reduced-price benefits under the NSLP. Section 9 of the Richard B. Russell National School Lunch Act and 7 CFR Part 245 provide the requirements relating to determining free or reduced-price meal eligibility including certification and verification requirements and procedures. FNS is required to report annually on the extent of erroneous payments in its programs under the Improper Payments Elimination and Recovery Act of 20102 (IPERA) along with a report on the actions taken or that will be taken to reduce erroneous payments. In the school meal application process, erroneous payments (both under- and over-payments) can occur mainly for two reasons; 1 Food and Nutrition Service. National School Lunch Program: Participation and Lunches Served:
http://www.fns.usda.gov/sites/default/files/pd/slsummar.pdf 2On July 22, 2010, the Improper Payments Elimination and Recovery Act of 2010 (IPERA) was enacted. IPERA
amended the Improper Payments Information Act of 2002 (IPIA) and expanded requirements for recovering overpayments across a broad range of federal programs. http://www.whitehouse.gov/sites/default /files/omb/financial/_improper/PL_111-204.pdf
Background 1

Background 1
1-2
household misreporting and administrative errors. This report focuses on administrative errors incurred during eligibility determinations. FNS administration has publicly stated the agency’s commitment to improving program effectiveness and integrity using the tools provided to them in the Healthy, Hunger-Free Kids Act (HHFKA) of 2010. Such tools include restructuring the review process to assess LEA operations, strengthening direct certification used to determine eligibility for free school meals by rewarding States for improvement in direct certification rates, and establishing additional review requirements for school districts that demonstrate high levels of administrative error (Rowe, 2013). Consistent with the overall efforts to reduce improper payments, FNS awarded Administrative Reviews and Training (ART) grants to support oversight and training efforts to reduce administrative errors. Some uses of these ART grants include training of LEA administrative personnel in application, certification, and verification procedures as well as technology improvements to address administrative errors (USDA, 2013). FNS routinely collects data through the Regional Office Review of Applications (RORA) to track these types of errors. Previously, USDA has issued ten reports examining annual rates of administrative errors (Karakus, Roeser, 2014); this eleventh report presents findings from an independent assessment of applications from the 2014-15 school year. In addition, we also contextualize the relatively stable error rates with recent FNS policy changes that promote simplified, non-application based NSLP certification methods. Such policy changes include, but are not limited to, direct certification and the Community Eligibility Provision (CEP). Assessment of Administrative Errors
In accordance with changes made by the Child Nutrition and WIC Reauthorization Act of 2004 and policy clarifications issued since 2001, FNS published a revised manual, the Eligibility Manual for School Meals: Determining and Verifying Eligibility, in 2008. The manual is now revised annually to include policy memos and additional policy decisions made during the prior year.3 As a result, we used the “August 2014” version of the Eligibility Manual in independent assessment of School Year 2014-2015 applications. In addition, only those non-discretionary provisions addressed through policy memorandum from the Healthy, Hunger-Free Kids Act of 2010 are reflected in this updated manual.
3 Eligibility Manual for School Meals, Determining and Verifying Eligibility. Food and Nutrition Service, USDA 2014.
http://www.fns.usda.gov/sites/default/files/EliMan.pdf

Background 1
1-3
There are two categories of eligibility for meal benefits: (1) household income, (2) categorical eligibility. Eligibility is determined either through direct certification or an application submitted by the household. This study focuses on the application process, not direct certification. Under the “household income” category students may be eligible for free meals (those with a household income at or below 130 percent of the Federal poverty guidelines), or reduced-price meals (those with a household income between 131 and 185 percent of the Federal poverty guidelines). Households must submit an application to the LEA in order for the student(s) to receive free or reduced-price meal benefits under this category. The LEA staff review these household applications and make determinations of eligibility by comparing the self-reported household size and income information with the guidelines published by FNS. During the eligibility determination process, administrative errors can occur in determining gross income, household family size, or assignment of benefit level based on household size and income specific (or relevant) information. Per FNS guidelines (FNS, 2012), approved but incomplete applications (e.g., missing adult signature, missing social security number, etc.) also constitute administrative errors. Inaccurate certifications may result in assignment of higher or lower amounts of benefits than students are entitled to receive. In some instances, administrative errors may not have any impact on the benefit decisions, and therefore do not translate into an error in benefit level. “Categorical eligibility” refers to automatic eligibility for free meals either through directly obtaining information from the relevant program (“direct certification”) or through the submission of an application with an appropriate case number or documentation pertaining to one of the following status:
A member of a household is determined by the administering agency as receiving assistance under the Supplemental Nutrition Assistance Program (SNAP), Food Distribution Programs on Indian Reservations ( FDPIR), or Temporary Assistance for Needy Families (TANF);
Enrollment in a Federally funded Head Start program;
A foster child; or
A homeless, runaway or a migrant child.
Households participating in SNAP, TANF, or FDPIR may bypass the standard application process and can be “directly certified” for benefits. Direct certification involves matching SNAP, TANF, and FDPIR records against student enrollment lists, either at the State or LEA level. Parents or

Background 1
1-4
guardians of children identified through these matching systems are notified of their children’s eligibility for free school meals. They need to take no action for their children to be certified (Ranalli, Harper, et al. 2008). No application is necessary if eligibility is determined through the direct certification process. This matching may be manual or through a computerized system. LEAs are required to directly certify children from SNAP households for free school meals. LEAs may also directly certify children from TANF and FDPIR households, but are not required to do so. Also, based on the algorithms used in the matching process and the timing of the direct certification information update, in rare occurrences, it is possible that some students will not be “directly certified” necessitating them to submit an application with their case number to indicate they are “categorically eligible”. Administrative Errors in Determining Household Income. Common administrative errors in determining gross income may involve computation errors. Such errors include:
LEA reviewer did not convert multiple income frequencies to annual income;
LEA reviewer used a different income frequency than the one indicated by the household; and/or
LEA reviewer conducted incorrect addition or multiplication.
Administrative Errors in Determining Household Size. In determining household size, common errors include:
LEA reviewer did not count students in the list of all household members; or
LEA reviewer double counts either a student or adult on the application.
Other types of Administrative Errors. These include:
Missing signatures;
Missing last four digits of social security numbers or no indication that the applicant does not have an SSN;
Incorrect lookup of eligibility status after correctly establishing household size and household income; or
Other missing information.

2-1
Data abstracted from the review of applications will enable FNS to answer the following questions about administrative errors made by LEAs:
To what extent did LEAs make the correct meal price status determination during certification?
What types of administrative errors were made? What was the prevalence of each type of administrative error?
What percent of applications received the correct meal benefit status? What percent of applications received the incorrect meal benefits at each combination of error (free, reduced-price, paid)?
Has the accuracy of LEA certification and benefit status determinations changed compared with previous years?
How might have the recent FNS policies that promote simplified, non-application based methods such as direct certification and the community eligibility provision, impacted the error rates calculated in RORA?
Research Questions 2

3-1
FNS regional staff selected the free- and reduced-price meal applications for independent review, using a randomized sampling procedure. Photocopies of the selected applications were forwarded to Westat for an independent assessment of eligibility and to document errors in household size, income, and eligibility determinations. This is the sixth year FNS has sought independent assessment. To ensure consistency in review with previous studies, Westat reviewed 500 applications and submitted those found to be in error to FNS for verification of the Westat process, and then continued with the review of the remaining applications. Sampling Design
FNS uses a stratified two-stage cluster sample design to select applications for review. The first stage selects a sample of districts using 28 strata defined by the seven FNS regions and four size categories within each region. This database includes more than 95 percent of all public and private schools participating in the NSLP. Two LEAs are selected from each stratum using probabilities proportional to size (PPS) methods with replacement (eight LEAs are selected from each of the seven FNS regions). The measure of size for each LEA is the number of students approved for free and reduced-price meals obtained from FNS’s School Food Authority Verification Collection Report (FNS-742). This selection process is accomplished in the following steps:
1. Sort the LEAs in each region by the number of students approved for free/reduced-price meals, from the smallest to the largest;
2. In each region, calculate the cumulative number of students approved for free/reduced-price meals for the LEAs sorted in (1);
3. Determine the cutoff values to be ¼, ½, and ¾ of the total number of students approved for free/reduced-price meals in each region;
Data Review Methods 3

Data Review Methods 3
3-2
4. Examine the cumulative frequencies in each region and use the cutoff values to divide the LEAs into four strata (“small”, “medium”, “large” and “very large” school districts); and
5. Randomly select 2 LEAs within each stratum, using probability proportionate to size sampling with replacement with the number of students approved for free/reduced-price meals as the measure of size.
In stage two, FNS regional staff is asked to select students who had applied for meal benefits from the administrative files of the 56 LEAs selected in the first stage using systematic (randomized) sampling. In each of the 56 selected LEAs, applications from about 50 students were selected for review. If an LEA was selected twice (sampling was done with replacement), applications from about 100 students were sampled, so that the sample size in each stratum remained about 100 in all cases. Both approved and denied applications were included in the sample. Those not included in the sample were students: 1) directly certified or, 2) in Provision 2 or 3 SFAs4 schools that were not in their base year. Appendix A includes strata totals of the number of students certified for free and reduced-price meals and direct certifications in each stratum. Appendix B presents the number of school districts within each region by the four strata: “small”, “medium”, “large” and “very large” school districts. Development of Sampling Weights
Sampling weights are required to produce substantially unbiased estimates from the administrative records data by compensating for the unequal probabilities of application selection. The initial component of the sampling weight, called the base weight, corrects for the unequal probabilities of selection and is typically the reciprocal of each unit’s probability of selection into the sample. In mathematical notation, if ‘n’ LEAs are sampled with replacement, with probability 𝑝𝑝𝑖𝑖, on each draw then the base weight, denoted by 𝑤𝑤𝑖𝑖, is given by:
4 SFA stands for “School Food Authority”, the governing body administering one or more schools and has the legal
authority to operate child nutrition programs approved by USDA to operate the Program. SFA and LEA terms are used interchangeably throughout this report. Provision 2 and 3 are alternative methods of counting and claiming meals for reimbursements by school districts. The purpose of both Provisions is to reduce the burden of paperwork on parents and on school districts by reducing the requirements for taking applications, notifying the public and counting meals by category for schools that agree to serve free meals to all enrolled students. Provision 2 allows schools to establish claiming percentages and to serve all meals at no charge for a 4 year period. Provision 3 allows schools to receive the same level of Federal cash and commodity assistance each year, with some adjustments, for a 4 year period. Provision 3 schools must also serve meals to all participating children at no charge for a period of 4 years.

Data Review Methods 3
3-3
wi=1/npi This approach to weighting for sampling with replacement and with unequal probabilities has been widely recognized for some time (Hansen and Hurwitz, 1943; Cochran, 1977, pp. 250-255). In this application, n=2, and 𝑝𝑝𝑖𝑖 for each LEA is the ratio of the number of students approved for free/reduced-price meals in the LEA to the total number of such students in the stratum. Hypothetically, if all students approved for free and reduced-price meals in a sampled LEA were reviewed by Westat, then the LEA base weight could be applied to the student data as well. But in the next stage, about 50 such students were selected from the LEA for review, thereby requiring another weighting component. For multi-stage designs, the base weights must reflect the probabilities of selection or base weights at each stage. For instance, in the case of a two-stage design in which the base weight for the ith LEA is wi = 1/(2 pi), and the jth student is selected within a selected LEA with probability pj(i) at the second stage, then an appropriate weight for each student j(i) in the sample is given by: wij = wi/pj(i)
The estimates presented in this report are reported in four different ways:
1. Using no weight adjustment. We note that unweighted estimates can be biased since applications were not sampled with equal probabilities. Unweighted estimates describe only the characteristics of the sampled applications.
2. Applying a weight for each application using the same formula that FNS used in earlier years (i.e., LEA base weight/probability of student). The following formula will be used to compute this sampling weight (weight as usual):
Weight as usual=Region size
2 X LEA size ÷
50LEA size
3. After discussions with FNS, we were informed that in the past, while directly certified students were excluded in the selection of students at the sample LEAs, the weighting used for the estimates assumed that the selected applications were randomly selected from all free/reduced-price students including those directly certified. However, the weight formula discussed above does not take this information into account. Thus, we will compute weights accounting for the exclusion of directly certified students in the LEA listing and prepare estimates using these revised weights (revised weights).

Data Review Methods 3
3-4
Revised weight=Region size
2 X LEA size ÷
50(LEA size – LEA direct certification size)
4. For this year’s report, we will produce a new set of sampling weights reflecting the
national implementation of CEP and continued use of direct certification. We will compute weights accounting for the exclusion of students covered in CEP schools and prepare estimates using these revised weights (CEP adjusted weights).
CEP adjusted weight=Region size
2 X LEA size ÷
50(LEA size – LEA direct certification size - CEP students)
Data File
Under direction from FNS staff, an EXCEL spreadsheet was created with appropriate data fields (Table 1). Each application was input into the spreadsheet along with the reviewer comments. Table 1. List of variables that will be obtained from application review
Variable name Variable description Value labels Distnum District Number (Region, Strata, District)
SFA SFA Name
State State Abbreviation
Student Student Number (1-50)
CBIS Current Benefit Issuance Status (1) Free (2) Reduced Price (3) Paid
Napps Number of Applications on File
Verify Was the Student Application Selected for Verification?
(1) Yes (2) No
VerDoc Was Documentation Provided for Verification Request?
(1) Yes (2) No
EA Is this an electronic application? (1) Yes, Regular (2) Yes, fillable form (3) No
CatElig Application Categorically Eligible? (1) Yes (2) No (3) Foster Child (4) Other Source Categorically Eligible
MixHH Is this a mixed household application? (1) Yes (2) No
HHSize Household Size as Determined by Reviewer
HHIncome Monthly Household Income as Determined by Reviewer
Inclnc Incomplete Income Information (1) Income frequency missing (2) Income Information left blank (3) Not applicable or No error (4) Both income frequency and income information missing
SSN Was Parent’s/Guardian’s Social Security number provided on Application?
(1) Yes (2) Don't Have SSN (3) No
Signature Was Adult Signature Provided on Application?
(1) Yes (2) No

Data Review Methods 3
3-5
Variable name Variable description Value labels
SFAHHSize Household Size as Determined by SFA
SFAHHInc Monthly Household Income as Determined by SFA
SFAElig Eligibility Status as Determined by SFA (1) Free (2) Reduced Price (3) Paid- Income too High (4) Paid-Incomplete Application (99) No space provided on the application for the SFA to record eligibility status
FNSElig Eligibility Status as Determined by Reviewer (1) Free (2) Reduced Price (3) Paid- Income too High (4) Paid-Incomplete Application
SFAVer Eligibility Status by SFA after Verification (1) Remain F (2) Remain RP (3) Change F to RP (4) Change F to P (5) Change RP to P (6) Change RP to F (7) Non Response to Verification Request
FNSVer Eligibility Status by Reviewer after Verification
(1) Remain F (2) Remain RP (3) Change F to RP (4) Change F to P (5) Change RP to P (6) Change RP to F (7) Non Response to Verification Request
CompP Is there a computer printout attached to the application?
(1) Yes, in addition to the completed SFA section on the application (2) Yes, in place of the SFA information on the application (there is no SFA information on the application) (3) No
CatInc SFA used income based information on a categorically eligible application
(1) Yes (2) No (3) Cannot be determined
ProcErr Was a Processing Error Made in Certification Process?
(1) Yes (2) No
Notes Comments
Application Review Process
Data Abstraction. The first stage of data abstraction included data entry onto hard copy spreadsheets. Any inconsistencies or inquiries were discussed at internal weekly meetings and documented on problem sheets. Issues that were not resolved internally were submitted to FNS for final resolution. All inquiries, internal or from FNS, were recorded in a Data Decision Log and serve as an historical record for future data abstraction and analysis (Appendix D). The second stage of data entry was transferring the data from the hard copy spreadsheet to an electronic database. Quality Control. A rigorous quality control effort was employed at each stage of data abstraction and entry. Hard copy data abstraction received 100 percent review from a separate abstractor with an additional review of a 10 percent sample performed by project management staff. Electronic data entry also received 100 percent review from alternate data entry staff and a 10 percent sample by

Data Review Methods 3
3-6
project management staff. Each case that was categorically eligible or selected for verification also received 100 percent review from project management staff. Lastly, any application that was considered to be an anomaly or raised any questions was discussed thoroughly among all data abstraction staff and documented accordingly. Eligibility Determinations
Following the definitions used in the previous FNS reviews, certification status was considered in error in the following situations:
1. If the LEAs certification determination is different than the independent certification determination.
2. For applications selected for verification (e.g., pay stub verification for reported income), if the LEA certification determination after verification was different than the independent certification determination after verification.
3. The computation of household size and income was not recorded on the application for some LEAs. However, regional FNS staff completed a cover page - including information on current benefit issuance status for each applicant selected for this study. For applications with no information on initial certification decision, certification status was considered in error if LEA certification determination was different than the current benefit issuance status.5
In addition, benefit status was considered in error if the current benefit issuance status (CBIS) provided by the LEA was different than the independent certification determination or if the application was selected for verification and the CBIS was different than the eligibility status determined by the reviewer after verification. Various types of administrative errors can be made by the LEAs in calculating household size and income. Common errors in calculation of household size include:
1. Not counting the student if the applicant inadvertently omitted the child’s name in the list of all household members; and
5 In some instances, the applications were scanned and the certification process was completed using computer software.
In some cases the FNS regional staff failed to collect the information from the data files, so we could only assume that the initial certification status matched the current benefit issuance status. To that end, SFAElig should equal CBIS.

Data Review Methods 3
3-7
2. Double-counting the student if the application called for a list of all adult household members and the student was included in the list as an adult.6
Common errors in the calculation of income include:
1. Incorrect determination of the frequency for receiving income (e.g., biweekly instead of monthly);
2. Not using a standard frequency (i.e., annual) when there are multiple income sources with different frequencies;
3. Incorrect addition or multiplication; and,
4. There can be issues related to inconsistent treatment of income received from child support and alimony payments and income from irregular employment (e.g., substitute teacher). While income from such sources should be most often correctly computed and included in the gross household income, there may be cases where such income may be inadvertently excluded from the household income computation.
Furthermore, administrative errors can occur when LEA staff fails to lookup correct eligibility status while the income and household size are correctly determined. Data Security
In agreement with the Federal Privacy Act and other regulations to protect individual data, hard copy applications were stored in a locked file cabinet secured with a lock bar. This file cabinet was located in a limited access field room controlled by a key pad door lock (with an alarm) and security cameras. All electronic data files were encrypted and password-protected; only staff working on the project had access to these files. All staff signed a confidentiality agreement, in compliance with Westat’s Electronic Data Storage, Transport, and Security Acceptable Use Policy and Guidelines and Electronic Mail and Internet Acceptable Use Policy and Guidelines in addition to the required USDA confidentiality agreement.
6 Some applications have a separate place for the listing of all adult members of the household. Sometimes households
include the children in that list due to misunderstanding and this may cause the reviewer to double count the number of children.

Data Review Key Findings 4
4-1
A total of 2,801 students who submitted applications for free or reduced-price meal benefits from the SY 2014-15 were selected for review. Of these 2,801 students, 336 (12 percent) were categorically eligible applications and 2,460 (87.8 percent) were income-based applications. A cover sheet was provided for five sampled students though applications could not be located; however, LEAs must have documentation that the household of a student receiving benefits has submitted an application or that the student was directly certified for free meals. Of the five students with missing applications, one had a current benefit issuance status of free, resulting in a certification error. The remaining four students did not have any information on certification status, so we were only able to assign an administrative error but could not evaluate the certification error7. Categorically eligible students are eligible for free meals. In order to process the application, a household must provide the name of the child, a SNAP, TANF, or the FDPIR case number, or indicate other categorically eligible designation (e.g., homeless, migrant, foster child) and a signature of an adult household member on the application. In order to process an income-based application, a household must provide the number of children and adults in the house, names of the household members, household income and frequency of receipt, an adult signature and the last four digits of the social security number or an indication that the adult does not have a social security number. In the following section we first present unweighted error estimates and then examine the effect of applying sample weights on the error estimates. The samples under examination include: (1) students with categorically eligible applications (n=336), (2) students with income based applications (n=2,460), and (3) all students with approved/denied applications (sample 1+ sample 2+ 5 missing applications with n=2,801). Among categorically eligible applications the prevalence of certification error during processing was 0.6 percent. All applications were considered categorically eligible if a number was provided in the space for SNAP, TANF, or FDPIR number. The accuracy of the SNAP, TANF, or FDPIR number listed on the application was not verified for this study.
7 These four students were excluded in analysis of certification and benefit issuance errors.
Data Review Key Findings 4

Data Review Key Findings 4
4-2
Two of the 336 categorically eligible applications resulted in an LEA eligibility determination of reduced-price or paid status rather than free status which indicates a certification error. Thus, the certification error rate was 0.6 percent (2/336). The remaining applications included the student name, case number and adult signature, and were processed correctly. All of the certification errors for this set of applications resulted from an LEA determining eligibility status based on household size and income information provided on the application even though a SNAP, TANF, or FDPIR number was included on the application. If LEA staff determined that these students were not on an assistance program as indicated on the application, then eligibility determinations based on household size and income would have been correct. Occasionally the regional staff collecting the information failed to obtain the screen shots from the computer system indicating what information the LEA actually used to make the eligibility determination when such information was not recorded directly on the application. It was also possible that the application lacked space for LEA staff to enter their computation of household size and income or it appeared on a second page that was not copied. Among the 2,460 income based applications, 275 either had no space on the application or did not indicate household size the LEA staff had used when making an eligibility determination. Similarly, 325 (13.2 percent) either had no space on the application or did not indicate gross income levels the LEA staff had used in making its eligibility determination. The majority of such applications did not have the information, most likely because the applications were scanned and computer software output was not clear as to what information the LEA actually used to make the determination. Thus, the sample sizes for the household size and household income error rates are 2,185 and 2,135, respectively.
In SY 2014-2015, household size and household gross income were accurately calculated for 97.6 and 96.7 percent of the applications, respectively. Figures 1 and 2 present the accuracy of household income and household size from income-eligible applications. In terms of household size determination, the under-counts and over-counts of the correct household size were, 1.4 percent and 1.0 percent respectively. In calculating household income, 2.3 percent of applications had gross income under-counted, while 1.0 percent of applications had income over-counted.
Among income-based applications LEAs made more errors in determining gross income than in determining household size.
4-3
Figure 1. Accuracy of LEA determination of household size among income-eligible applications (unweighted data for SY 2004-05 to SY 2014-15)
Figure 2. Accuracy of LEA determination of household income among income-eligible applications (unweighted data for SY 2004-05
to SY 2014-15)
0.9 1.9 2.1
0.8 1.1 1.0 1.4 0.8 1.2 1.1 1.4
1.2
1.0 1.4
1.1 1.0 1.0 1.3
0.9 1.0 1.6 1.0 2.1
2.9 3.5
1.9 2.2 2.0
2.8
1.7 2.2
2.7 2.4
0
1
2
3
4
2004/05
2005/06
2006/07
2007/08
2008/09
2009/10
2010/11
2011/12
2012/13
2013/14
2014/15
Under-count Over-count Total not correct
4.4 3.5 3.5
7.6
2.4 2.3 3.0 2.5 4.0
1.8 2.3
3.7 4.4
2.5
2.3
1.4 1.4 1.2 1.2
1.4
1.0 1.0
8.1 7.9
6.0
9.9
3.8 3.7 4.3
3.7
5.4
2.8 3.3
0
2
4
6
8
10
2004/05
2005/06
2006/07
2007/08
2008/09
2009/10
2010/11
2011/12
2012/13
2013/14
2014/15
Under-count Over-count Total not correct

4-4
This year’s 6.8 percent administrative error rate indicates a decrease of 4.1 percentage points from the previous year’s administrative error rate of 10.9 percent. While overall administrative errors seem to be changing over the years, we believe this is mainly due to the changes in rules and clarifications in eligibility manuals over time. Such changes make it hard to compare processing errors from year to year. Thus, we caution readers to make strong inferences from the comparison of processing error rates over time. Furthermore, administrative errors do
not always result in incorrect eligibility determination. For example, a household size may be incorrectly assessed as four and the student may qualify for free meal. If the correct household size was three, this would indicate an administrative error, but if the student still qualifies for free meal, it does not affect the eligibility determination. Among the 190 applications with administrative errors, 56 applications resulted in incorrect eligibility determination (2 categorically eligible applications8, 1 not found, and 53 from income based applications). As seen in Table 2, there were 51 applications with more benefits and 5 applications with fewer benefits than were justified. Table 2. Administrative errors and incorrect certification determinations on the basis of an
approved/denied application (n=2,801), (Unweighted data for SY 2014-15) Administrative errors N Percent
All administrative errors 190 6.8 Administrative errors that resulted in incorrect certification determination 56 2.0
Higher benefits 51 1.8
Lower benefits 5 0.2
Note: Certification status is considered an administrative error if the LEAs certification determination (SFAElig) is different than independent certification determination (FNSElig). For those students selected for verification, certification status is considered an administrative error if the eligibility status determined by the LEA after verification (SFAVer) is different than the eligibility status determined by the independent reviewer after verification (FNSVer).
The percentage of eligibility determinations in error was 2.2 percent among income based applications. As seen in Table 3, there were 53 applications (2.2 percent) with incorrect certification out of 2,460 income-based applications. Of these 53 applications with certification error, 48 applications were certified for more benefits, and 5 applications, were certified for fewer benefits than justified based on the documentation available.
8 These two applications had “reduced-price” or “paid” status instead of “free” status.
LEA determinations had administrative errors in 6.8 percent of applications approved or denied on the basis of information appearing on an application.

Data Review Key Findings 4
4-5
Table 3. Certification status determination for income-based applications (n=2,460), (Unweighted data for SY 2014-15)
Certification status determination N Percent
Correct determination 2,407 97.9
Incorrect determination 53 2.2
Higher benefits 48 2.0
Lower benefits 5 0.2
Note: Certification status is considered incorrect if the LEAs certification determination (SFAElig) is different than independent certification determination (FNSElig). For those students selected for verification certification status is considered in error if the eligibility status determined by the LEA after verification (SFAVer) is different than the eligibility status determined by the independent reviewer after verification (FNSVer). Numbers may not exactly sum to total due to rounding.
As discussed earlier, benefit status was considered in error if the current benefit issuance status was different than the independent certification determination or the eligibility status determined by the independent reviewer after verification9. Meal benefits issuance status was correct on about 97.0 percent of the applications approved or denied on the basis of income based assessment. As seen in Table 4, there were 74 students (3.0 percent) out of 2,460 income-based
applications approved for the incorrect level of benefits. Of the 74 students with benefit determination error, 59 students (80 percent) were certified for a higher level of benefits, and 15 students (20 percent) were certified for a lower level of benefits than justified based on the documentation available. Table 4. Benefit issuance status determination for income-based applications (n=2,460),
(Unweighted data for SY 2014-15) Benefit issuance determination N Percent
Correct determination 2,386 97.0
Incorrect determination 74 3.0
Higher benefits 59 2.4
Lower benefits 15 0.6 Note: Benefit status was considered in error if the current benefit issuance status provided by the LEA (CBIS) was different than the independent certification determination (FNSElig) or the eligibility status determined by the independent reviewer after verification (FNSVer) for those students selected for verification.
9 This approach assumes that any change in household circumstances that would result in a change in eligibility status would have been recorded somewhere by the LEA. For example, if the household submitted an application at the beginning of the school year and was deemed eligible for reduced-price meals but later in the school year, the household became eligible for SNAP and was directly certified for free meals and the benefit issuance status was changed to free but no documentation was found that tied direct certification to that application, we would record that as an incorrect benefit issuance status.
Accuracy of benefit issuance status was a little lower compared to the accuracy of certification determination.

4-6
Figure 3. Certification status determinations for all applications approved or denied on the basis of an application, (Weighted data for SY 2004-05 to SY 2014-15)
Figure 4. Benefit status determinations for all applications approved or denied on the basis of an application, (Weighted data for SY
2004-05 to SY 2014-15)
.
2.9 2.5 3.0 3.2
1.3 1.5 2.8
2.1 2.6 2.0 1.8
0.6 0.5
0.9 0.7
0.7 0.9
0.9 0.8
1.0
0.6 0.1
3.5 3.0
3.9 3.9
2.0 2.3
3.7
2.9 3.6
2.6 1.9
0.0
1.0
2.0
3.0
4.0
5.0
2004/05
2005/06
2006/07
2007/08
2008/09
2009/10
2010/11
2011/12
2012/13
2013/14
2014/15
Higher benefits Lower benefits Total not correct
3.4 2.8 3.3 3.5
1.9 1.5
3.3 2.6 2.8 2.7 2.3
0.9 1.0
0.9 1.1
1.1 1.5
1.2
0.9 1.0 0.7
0.6
4.3 3.8
4.2 4.6
3.0 3.0
4.5
3.5 3.8
3.4 2.9
0.0
1.0
2.0
3.0
4.0
5.0
2004/05
2005/06
2006/07
2007/08
2008/09
2009/10
2010/11
2011/12
2012/13
2013/14
2014/15
Higher benefits Lower benefits Total not correct

4-7
Figure 3 presents a comparison of error estimates for certification and benefit status determinations for all applications. Consistent with the previous reports, we present weighted estimates because sampling weights are required to produce substantially unbiased estimates from the administrative records data by compensating for the unequal probabilities of application selection
The percentage of applications incorrectly approved or denied for free or reduced-price meal benefits was relatively lower compared to previous years. The percentage of applications that were incorrectly certified due to administrative errors varied from 2.0 to 3.9 percent during the previous ten-year span. As seen in Figure 3, in school year 2014-15, administrative error in certification status determination was at 1.9 percent, down by 2 percentage points relative to the peak of 3.9 percent
in SY 2006-07 and 2007-08. It is also 0.7 percentage points lower than the previous year which is a statistically significant change. The percentage of over-certified was 1.8 percent and the percentage of under-certified was 0.1 percent. The benefit status determination error varied from 3.0 to 4.6 percent during the previous ten-year span. In SY 2014-15, among all applications, 2.9 percent had incorrect benefit status determination, down by 0.5 percentage points relative to last year which is a statistically significant change. The percent of students receiving higher benefits than they were entitled was at 2.3 percent and the percentage of students receiving lower benefits due to benefit issuance error was 0.6 percent.
As seen in Table 5, unweighted estimates for certification and benefit status determination are very similar to estimates using weighted as usual. While unweighted estimates indicate 2.00 percent and 2.79 percent errors, “weighted as usual” estimates show a 1.92 percent and 2.85 percent and “revised weight” estimates indicate 1.87 percent and 2.75 percent and “CEP revised weight” estimates indicate 1.89 and 2.74 percent error rates in determination of certification and benefit status, respectively. 10
10“Weighted as usual” refers to applying a weight for each application using the same formula that FNS used in earlier years (i.e., LEA base weight/probability of student). “Revised weights” refers to accounting for the exclusion of directly
Weighted data indicates that LEA
determinations resulted in a
certification error in 1.9 percent of applications.
Weighted data indicates that 2.9
percent of all applications had a benefit status error.
Adjusting for sample weights indicate a possible bias in the unweighted error estimates for determination of certification and benefit status.

4-8
Table 5. Comparison of weighted and unweighted estimates: administrative errors in determination of certification and benefit status among all applications approved or denied on the basis of an application (n=2,797), SY 2014-15
Incorrect determination Fewer-Benefits More-Benefits
N Percent N Percent N Percent
Certification status determination
Unweighted 56.00 2.00 5.00 0.18 51.00 1.82
Weighted as usual 53.70 1.92 3.92 0.14 49.79 1.78
Revised weights 52.30 1.87 3.08 0.11 49.23 1.76
CEP Revised weights 52.58 1.88 3.08 0.11 49.51 1.77
Benefit status determination
Unweighted 78.00 2.79 16.00 0.57 62.00 2.22
Weighted as usual 79.71 2.85 16.78 0.60 62.93 2.25
Revised weights 76.92 2.75 14.54 0.52 62.37 2.23
CEP Revised Weights 76.64 2.74 13.99 0.50 62.65 2.24
Note: Certification status is considered in error if the LEAs certification determination (SFAElig) is different than independent certification determination (FNSElig). For those students selected for verification certification status is considered in error if the eligibility status determined by the LEA after verification (SFAVer) is different than the eligibility status determined by the independent reviewer after verification (FNSVer). Benefit status was considered in error if the current benefit issuance status provided by the LEA (CBIS) was different than the independent certification determination (FNSElig) or the eligibility status determined by the independent reviewer after verification (FNSVer) for those students selected for verification.
Rate of Incomplete Applications
As part of an effort to decrease certification error during the eligibility determination process, section 304 of the HHFKA requires that certain local education agencies (LEAs) conduct a second, independent review of applications for free and reduced price meal benefits before eligibility determinations are made. Beginning in SY 2014-15, LEAs that demonstrate high levels of, or a high risk for administrative error associated with certification and benefit issuance are required to conduct a second review of applications to determine whether the application is complete by a third party entity. The second review must also confirm the applications were correctly approved based on current income eligibility guidelines or categorical eligibility information, as applicable, and the master list or roster of student names correctly records the student’s eligibility.11
certified students in the LEA listing and prepare estimates using these revised weights (revised weights). CEP Revised Weights also takes into account the number of students in CEP schools. Mean and standard error estimates of certification and benefit errors under three methods (unweighted, weighted as usual, revised weights, and CEP revised weights) can be found in Appendix C. 11 Memo to Regional Directors: Questions and Answers Related to the Independent Review of Applications. Available at: http://www.fns.usda.gov/ sites/default/ files/SP44-2014os.pdf

4-9
A complete income-based application must provide: names of all household members; amount and source of current income as well as the frequency of income for each adult member of the household; signature of an adult household member; and the last four digits of the social security number of the adult household who signs the applications or an indication that the household member does not have one. There were a total of 19 income-based applications that were incomplete. As shown in Table 6, of the 2,460 income-based applications, 18 applications did not contain the last four digits of the social security number for the adult household member or did not have an indication that the adult household did not have a social security number. Further analyses of these 18 applications indicate that, besides missing last four digits of SSN, there were 3 applications with household size and/or income errors. Amount and source of current income was left blank for all adult household members in 0.77 percent of the income-based applications (19 out of 2,460). There were no applications in which the frequency of income was missing or both frequency and income information was left blank for all adults. Seven applications were missing the signature of an adult household member. Among income based applications, 53 applicants had reported no income and wrote “0” for income.12
Table 6. Rate of processing error due to incomplete applications among income-based
applications (n=2,460), SY 2014-15
N % 4-digit SSN Missing 18/2,460 0.73
Signature Missing 7/2,460 0.28
Income Incomplete - Income Left Blank13 19/2,460 0.77
Income Incomplete - Frequency Missing 0/2,460 0.00 Income Incomplete - Both Frequency & Income
Information Left Blank 0/2,460 0.00
LEAs may use paper, computer or web-based systems for their application processes. While the majority of applications reviewed were paper-based (80 percent), electronic applications comprised 20 percent (560/2,796) of all applications. As shown in Table 7, among the electronic applications 12 Applications noting zero income are not considered incomplete. 13 Both income and income frequency were not included in all19 applications.

4-10
submitted, the processing error rate (4.29 percent) was lower than the error rates among non-electronic applications (7.20 percent). Electronic applications also had lower rates of certification and benefit status errors compared to paper-based applications. There seems to be more income, household size and certification related errors among paper-based applications. Mixed household applications include at least one child that is Other Source Categorically Eligible (e.g., homeless, migrant, runaway, enrolled in Head Start) along with non-categorically eligible children. There were a total of 20 mixed household applications. Among mixed household applications, the frequency of processing error seems to be similar (5 percent) to non-mixed household applications (6.63 percent). As mentioned in the previous RORA reports, LEAs are moving more and more towards a computerized application management system. In some instances when providing data for this study, LEAs submitted a computer screen shot with the applicant’s information. These computer printouts are either submitted in addition to a paper or electronic application or in place of an application. The figures in Table 7 show that of the 2,796 applications, computer printouts were provided for 843 applicants to document the certification status and the information that the LEA used to make that certification determination. Of these 843 cases, there was a processing error rate of 8.42 percent which is a little higher than the processing error rate of 5.84 percent among applications that did not provide a computer printout. In addition, there were 84 applications that had a computer printout data submitted by LEAs in addition to paper application. Of those 84 applications, 5.95 percent had processing errors (5/84) (not shown in table). Table 7. Rate of errors by certain characteristics of applications (N=2,796), SY 2014-15
Electronic application submitted
Mixed household with foster child
Computer printout submitted*
YES NO YES NO YES NO
Processing error 4.29%
24/560
7.20%
161/2,236
5.00%
1/20
6.63%
184/2,776
8.42%
71/843
5.84%
109/1,869
Certification status error 1.25%
7/560
2.15%
48/2,236
0.00%
0/20
1.98%
55/2,776
2.14%
18/843
1.71%
32/1,869
Benefit status error 1.96%
11/560
2.95%
66/2,236
0.00%
0/20
2.77%
77/2,776
2.85%
24/843
2.51%
47/1,869
* This number is computer printout in place of LEA information (not in addition to)

4-11
Table 8. Rate of errors by selected SFA characteristics, SY 2014-2015
SFA Used Computer Software to Determine
Eligibility
SFA is required to implement 2nd Review
SFA Accepts Online Applications
YES NO YES NO YES NO
Processing error
6.79% 6.67% 6.58% 6.81% 7.32% 5.54%
180/2,651 10/150 20/304 170/2,497 143/1,953 47/848
Certification status error
2.00% 2.00% 1.97% 2.01% 2.15% 1.65%
53/2,647 3/150 6/304 50/2,493 42/1,949 14/848
Benefit status error
2.87% 1.33% 3.62% 2.69% 3.13% 2.00%
76/2,647 2/150 11/304 67/2,493 61/1,949 17/848
We also examined error types by three SFA characteristics related to application review process. The data were obtained from a survey with the SFAs sampled for the RORA 2015. As shown in Table 8, these characteristics include whether SFA used computer software to determine eligibility, whether SFA is required to implement a 2nd review of applications, and whether SFA accepts online applications. The findings indicate that error rates are very similar by these SFA characteristics. There was no statistically significant difference in error rates. Discussion of Administrative Errors in light of Alternate Certification Provisions
For over two decades, FNS has been implementing policies to promote a more simplified, non-application based certification method such as direct certification and, more recently, the Community Eligibility Provision (CEP). Under direct certification, States and LEAs can use information provided by SNAP, TANF, and FDPIR agencies or other administrative data sources to establish that a student is a member of a household participating in one of these programs and is thus automatically eligible to receive free meals. If a student is not identified through direct certification, categorical eligibility for free meals is still extended to all children in a household if any member of the household receives benefits from an Assistance Program. These children can therefore be certified to receive free meal benefits without the household having to submit an application. Direct certification was first authorized in 1989 as an option and the Child Nutrition and WIC Reauthorization Act of 2004 required direct certification of all SNAP-participant students by SY 2008-2009. Thus, as shown in Figure 5, the percent of LEAs that directly certify SNAP-participant students has been increasing.

4-12
Figure 5. Percent of LEAs that directly certified SNAP participants, SY 2004-05 to SY 2013-14
Source: U.S. Department of Agriculture, Food and Nutrition Service, Office of Policy Support, Direct Certification in the National Lunch Program: State Implementation Progress, School Year 2013–2014 by Quinn Moore, Kevin Conway, Brandon Kyler, and Andrew Gothro. Project Officer Dennis Ranalli. Report CN-13-DC. Alexandria, VA: May 2015.
Other alternate certifications include claiming reimbursement under Provision 2 and Provision 3 (P2/3) and CEP. Under P2/3, schools may use their base year percentages of free, reduced-price, and paid students for purposes of applying for funding throughout subsequent years on a 4-year cycle. The 2007 Access, Participation, Eligibility and Certification (APEC) Study found that the erroneous payments are more common in P2/3 base-year schools than in schools not using these provisions (Ponza, Gleason, et al, 2007). In the study sample, a large proportion of students certified for free meals in the base year of P2/3 schools were over-certified (eligible for a lower level of benefits), and because the claiming percentages in these schools are fixed for at least three years (students are not certified annually at P2/3 schools during non-base years), there was no mechanism for correcting the erroneous claiming percentages unless the schools reestablish them in a new base year. Similarly, Section 104(a) of the Healthy, Hunger-Free Kids Act of 2010 made CEP available to LEAs and schools in high poverty areas. Under CEP, families do not submit applications for free or reduced price meals, and schools must provide free lunch and breakfast to all students. CEP has been

4-13
phased-in by FNS over three school years and it is now available to LEAs that qualify14 nationwide beginning in SY 2014-15. During school year 2014-2015, reimbursement for schools in CEP was based on the percentage of students directly certified multiplied by a set factor (1.6) intended to approximate the total free and reduced price population. Similar to Provisions 2 and 3, the claiming percentages established in the first year of CEP may be used for four school years. As of September 2014, there were approximately 14,000 schools in CEP, serving about 6.5 million students.15 There is some evidence indicating that alternate certification methods reduce the rate of certification errors and associated improper payments. The recent findings on direct certification from the second APEC study (APEC-II) found that improper payments for students certified for free meals through direct certification was at 4 percent. This rate was substantially less than the rate for students certified for free meals by application (9 percent). In APEC-II, significant differences were found in certification errors by type of application. Out of the total of 9.8 percent rate of certification-related improper payments, the rate associated with household applications was 14 percent, compared to about 4 percent and 2 percent for direct certification and CEP, respectively. In addition, a recent study evaluating CEP in seven states found that it reduced the overall rate of certification errors (Logan, Connor, et al. 2014). CEP eliminated application processing errors that, in the comparison schools, resulted in certification errors in 6.6 percent of applications. CEP also eliminated procedural errors in application processing that, in the comparison schools, affected 20.2 percent of approved applicants and 16.9 percent of denied applications. The RORA study is not designed to measure the relationship between administrative errors and alternate certification procedures. The dataset also does not avail itself to identify the relationship between the trend in direct certification rates and changes in error rates. With this caveat in mind, in Table 9, we present average error rates (adjusted and unadjusted) across SFAs by quartiles of direct certification rate for SY 2013, 2014 and 2015. There seems to be some difference in processing error rates between LEAs with low rate of direct certification and LEAs with high rate of direct certification. However, the analyses indicate that the differences in averages by quartiles of direct certification rates are not statistically significant.
14 Available to schools where 40 percent or more of the students are Identified Students (those automatically eligible for
free schools meals, without a paper application – students in households on SNAP, TEFP, FDPIR, homeless, migrant, in foster care or Head Start, etc..).
15 State CEP Election Data. Available at: http://www.fns.usda.gov/sites/default/files/cn/state-cep-election-data.pdf

4-14
Table 9. Average Error Rates by Quartiles of Direct Certification Rate
Direct Certification Rate
Average Error Rates (%)
Processing Error Certification Error Benefit Status Error Unadjusted Means
<25% 10.51 2.15 2.70
26-50% 7.88 1.87 2.67
51-75% 9.32 3.41 3.93
>75% 7.64 2.30 3.19
Adjusted Means
<25% 10.72 2.29 3.18
26-50% 8.15 2.09 3.03
51-75% 9.03 3.27 3.66
>75% 8.00 2.32 3.23
a The RORA data from SY 2013, 2014 and 2015 were included in analysis. Adjusted means were computed controlling for the following variables: LEA enrollment size, location, year dummies.
The alternate certification processes reduce the number of paper applications. It is reasonable to assume that LEA staff is left with a smaller but more homogenous pool of applicants. If the remaining income-based applications present more challenging cases during benefit determination, one can expect that the reduction of the size of applicant pool may increase the probability of administrative errors in income-based applications. In other words, the administrative error rate (number of errors/number of applications) may not decrease if the percentage change in number of errors is not more than the percentage decrease in the numerator.

5-1
For the SY 2014-15, a total of 2,796 applications went through an independent assessment to identify the extent of administrative errors. In general, error rates are on the lower end of the range observed in the previous years. Almost 7 percent (n=190) of all applications had administrative error but a majority did not result in incorrect eligibility level. Among those with administrative errors less than one in three (n=56) applications were found to have a certification error. The rate of certification and benefit status errors were comparable to previous years with 1.9 percent and 2.9 percent, respectively. Overall, rates of administrative error and certification error have stayed within the expected range that has been observed in the last ten years. Among all income-based applications, almost 98 percent of students were certified for the correct level of meal benefits based on information included in the application files. Of those students incorrectly certified, about 90 percent were certified for more benefits than were justified based on the documentation available. Similarly, household size and income were accurately calculated for more than 97 percent of the applications. Adjusting for sample weights indicate a possible bias in the unweighted error estimates for determination of certification and benefit status. Unweighted estimates for certification and benefit status determination are generally higher than the weighted estimates. We found that 18 applications did not contain the last four digits of the social security number for the adult household member who signed the application or an indication that the adult household did not have a social security number and seven applications did not have the signature of an adult household member on the application. Amount and source of current income was left blank for all household members in almost one percent of the income-based applications (19 out of 2,460). In addition, for 53 of the income-based applications, applicants wrote down “0” to indicate they had no income and these are not considered as incomplete application. Recommendations for future studies
This report presents findings of the eleventh annual RORA review. Westat reviewed the applications selected by FNS, entered data, implemented quality control procedures, and conducted data
Summary of Findings and Recommendations 5

5-2
analyses. More LEAs are moving towards a computerized application management system. Most often, when the LEA enters information electronically they may not keep the original application and/or they may prefer to send only the electronic print out for review. This year, we have seen improvement in the type and extent of information included in these electronic printout documents to make an independent assessment of the decision. We observed some discrepancies between the number of household members listed in the documents and the number of household members recorded on the case file. Also, on some applications it was hard to make an assessment because of the unclear time lag or lack of notation when the LEA updates information after hard copy submission. While some of the paperwork issues may be due to electronic applications themselves, we noticed that there were discrepancies between what was written or typed on some applications and the LEA documentation provided as backup. For example, sometimes CBIS would be different and we would not quite determine how things changed from the screen shot that would be attached to the hard copy. It is hard to make an assessment with no clear linking path through a paper trail as to why there were differences. We believe better documentation including all relevant information should be provided for reviewing the application. In terms of future studies, the analysis may be extended to determine differences in error rates and sources of errors between electronic applications and paper based applications. This study shows that there may be less processing errors in electronic applications but for conclusive results, there is a need for further research and expanded data analysis. In addition, one extension of this current project may include independent assessment of Identified Student Percentage (ISP) in SFAs that selected to participate in CEPs. This may be more feasible if a sample of SFAs is selected from those who are in their first year or who are renewing their ISP funding level.

R-1
References
Cochran W.G. 1977. Sampling Techniques. Wiley; 3rd edition. New York.
Endahl, John. “Accuracy of LEA Processing of School Lunch Applications – Regional Office Review of Applications (RORA) 2009.” USDA, Food and Nutrition Service, Alexandria, VA: 2010.
FNS (Food and Nutrition Service at the USDA). 2012. “NSLP Fact Sheet”. Available at http://www.fns.usda.gov/pd/slsummar.htm
FNS (Food and Nutrition Service at the USDA). 2013. Eligibility Manual for School Meals: Determining and Verifying Eligibility. Available at http://www.fns.usda.gov/sites/default/files/EliMan.pdf
Hansen, M.M. and Hurwitz, W.N. (1943). On the theory of sampling from finite populations. Annals of Mathematical Statistics: 14; 333-362.
Karakus M.C., Roeser A. “Accuracy of LEA Processing of School Lunch Applications-Regional Office Review of Applications (RORA) 2013.” A report prepared under contact to USDA, Food and Nutrition Service, Alexandria, VA: 2014.
Logan, CW., Connor P, Harvill EL, Harkness J, Nisar H, Checkoway A, Peck LR, et al. Community Eligibility Provision Evaluation. Project Officer: John R. Endahl. Prepared by Abt Associates for the U.S. Department of Agriculture, Food and Nutrition Service, February 2014.
Long, J. S. (1997). Regression models for categorical and limited dependent variables. Sage
Publications: Thousand Oaks, CA.
Moore, Q., Gleason P., Ponza M. (2008). Econometric Model for Updating Estimates of Erronous Payments in the NSLP and SBP. Contract No. AG-3198-C-06-0008. Alexandria, VA: U.S. Department of Agriculture, Food and Nutrition Service, Office of Policy Support.
Moore, Q., Gothro, A., Conway, K., Kyler B., (2014). National School Lunch Program Direct
Certification Improvement Study. Contract No. AG-3198-D-10-0074. Alexandria, VA: U.S. Department of Agriculture, Food and Nutrition Service, Office of Policy Support.
Moore, Q., Cole, N., Potamites, E. “Modeling high risk indicators of certification error in the
National School Lunch Program.” A report prepared under contract to USDA, Food and Nutrition Service, Alexandria, VA: 2012.
Ponza, M., Gleason, P., Hulsey, L., and Moore, Q. “NSLP/SBP Access, Participation, Eligibility, and Certification Study: Erroneous Payments in the NSLP and SBP.” Special Nutrition Program Report Series, No. CN-07-APEC. USDA, Food and Nutrition Service, Alexandria, VA: 2007.

R-2
Ranalli, D., Harper E., O’Connell R., Hirschman J. 2008., Direct Certification in the National School Lunch Program: State Implementation Progress. CN-08-DC. Alexandria, VA: December 2008.
Rowe, A. “Statement Before the Subcommittee on Agriculture, Rural Development, Food and Drug
Administration and Related Agencies, March 14, 2013” Available at: http://appropriations. house.gov/uploadedfiles/hhrg-113-ap01-wstate-rowea-20130314.pdf
U.S.D.A. “Letter to State Directors on ART Grants” Available at: http://www.fns.usda.gov/sites/
default/files/2013ART2_letter.pdf

Appendix A
The Strata Totals of the Number Students Approved for Free
and Reduced-price Meals and Direct Certifications in Each Stratum

Appendix A
A-1
LEA number LEA size LEA direct
certification size Strata size Strata direct
certification size CEP size
111 449 243 479,457 217,637 0
112 525 170 479,457 217,637 0
121 2,030 1,021 476,670 243,465 0
122 1,000 478 476,670 243,465 0
131 5,053 2,783 490,912 278,657 0
132 86,284 73,990 490,912 278,657 10,887
141 183,308 159,312 471,921 403,535 23,441
142 153,300 136,329 471,921 403,535 20,059
211 174 70 586,983 322,341 0
212 336 141 586,983 322,341 0
221 2,636 1,955 587,797 338,451 0
222 3,840 2,184 587,797 338,451 0
231 7,283 4,946 570,966 337,456 0
232 8,131 3,796 570,966 337,456 0
241 51,842 22,322 604,838 358,040 0
242 50,916 18,257 604,838 358,040 0
311 4,231 2,741 1,365,396 778,836 0
312 2,222 1,575 1,365,396 778,836 0
321 12,193 5,632 1,361,719 793,799 0
322 12,575 8,224 1,361,719 793,799 0
331 20,892 14,433 1,333,891 788,444 70
332 22,325 12,860 1,333,891 788,444 0
341 153,952 76,391 1,410,397 879,876 4,922
342 106,696 78,399 1,410,397 879,876 0
411 388 187 858,412 459,255 0
412 770 125 858,412 459,255 0
421 1,720 1,253 855,953 488,496 0
422 1,693 1,216 855,953 488,496 327
431 2,349 1,489 862,700 495,114 0
432 2,132 1,102 862,700 495,114 0
441 26,860 23,260 859,051 576,901 0
442 10,478 7,708 859,051 576,901 0
511 170 63 1,108,026 454,925 0
512 701 344 1,108,026 454,925 0
521 4,800 2,476 1,102,459 487,035 0
522 4,894 2,284 1,102,459 487,035 0
531 15,232 7,356 1,099,725 448,394 0
532 21,330 10,817 1,099,725 448,394 0

Appendix A
A-2
LEA number LEA size
LEA direct certification
size Strata size
Strata direct certification size
CEP size
541 167,249 85,033 1,127,243 573,010 0
542 33,357 17,289 1,127,243 573,010 0
611 127 40 454,594 193,600 0
612 354 161 454,594 193,600 0
621 808 415 452,862 232,272 0
622 991 633 452,862 232,272 0
631 3,842 1,065 448,044 225,702 0
632 5,457 1,559 448,044 225,702 0
641 14,610 5,028 463,049 216,984 0
642 17,174 1,702 463,049 216,984 0
711 1,913 1,313 1,378,159 520,690 0
712 2,415 1,033 1,378,159 520,690 0
721 5,468 2,007 1,372,148 491,468 0
722 6,339 4,127 1,372,148 491,468 0
731 14,590 6,077 1,382,166 526,520 0
732 14,200 3,892 1,382,166 526,520 0
741 38,473 7,073 1,388,168 442,353 0
742 32,513 5,853 1,388,168 442,353 0

Appendix B
The Number of School Districts Within Each Region by the Four Strata

Appendix B
B-1
The Number of School Districts Within Each Region by the Four Strata16
Strata FNS REGIONS NERO MARO SERO MWRO SWRO MPRO WRO TOTAL
Small 1,830 1,641 1,105 3,920 2,063 2,641 2,309 15,509 Medium 261 228 151 695 207 270 189 2,001
Large 37 66 44 269 61 70 79 626 Very Large 3 14 12 69 20 21 19 158
Total 2,131 1,949 1,312 4,953 2,351 3,002 2,596 18,294
NERO: Northeast Regional Office MARO: Mid-Atlantic Regional Office SERO: Southeast Regional Office MWRO: Midwest Regional Office SWRO: Southwest Regional Office MPRO: Mountain Plains Regional Office WRO: Western Regional Office
16 LEAs are divided into four strata (“small”, “medium”, “large” and “very large” school districts) based on the
cumulative frequencies of the number of free and reduced-price students in each region.

Appendix C
Mean and Standard Errors Estimates
for Certification and Benefit Issuance Errors for All Applications Approved or Denied on
the Basis of an Application

Mean and Standard Errors Estimates for Certification and Benefit Issuance Errors for all applications approved or denied on the basis of an application Unweighted statistics, n=2,797
Variable Label Mean Standard Error CERTERROR Is there a certification error? 0.02000 0.002649 CERTMOREB Certification error – receiving more
benefits? 0.01820 0.002530
CERTLESSB Certification error – receiving less benefits?
0.00180 0.000799
BENERROR Is there a benefit issuance error? 0.02790 0.003114 BENMOREB Benefit issuance error – receiving more
benefits? 0.02220 0.002784
BENLESSB Benefit issuance error – receiving less benefits?
0.00570 0.001426
Statistics using weights as usual, n=2,797
Variable Label Mean Standard Error CERTERROR Is there a certification error? 0.01920 0.002596 CERTMOREB Certification error – receiving more
benefits? 0.01780 0.002500
CERTLESSB Certification error – receiving less benefits?
0.00140 0.000711
BENERROR Is there a benefit issuance error? 0.02850 0.003145 BENMOREB Benefit issuance error – receiving more
benefits? 0.02250 0.002803
BENLESSB Benefit issuance error – receiving less benefits?
0.00600 0.001459
Statistics using adjusted weights, n=2,797
Variable Label Mean Standard Error CERTERROR Is there a certification error? 0.01870 0.002563 CERTMOREB Certification error – receiving more
benefits? 0.01760 0.002484
CERTLESSB Certification error – receiving less benefits?
0.00110 0.000641
BENERROR Is there a benefit issuance error? 0.02750 0.003090 BENMOREB Benefit issuance error – receiving more
benefits? 0.02230 0.002791
BENLESSB Benefit issuance error – receiving less benefits?
0.00520 0.001356
Statistics using CEP adjusted weights, n=2,797
Variable Label Mean Standard Error CERTERROR Is there a certification error? 0.01880 0.002567 CERTMOREB Certification error – receiving more
benefits? 0.01770 0.002491
CERTLESSB Certification error – receiving less 0.00110 0.000631

benefits? BENERROR Is there a benefit issuance error? 0.02740 0.003087 BENMOREB Benefit issuance error – receiving more
benefits? 0.02240 0.002797
BENLESSB Benefit issuance error – receiving less benefits?
0.00500 0.001335

