regional of orange county 2022 performance contract
TRANSCRIPT

RegionalCenterofOrangeCounty2022PerformanceContract
1

Performance Contract is an outcome-based performance plan that must be developed through meaningful participation with each regional center’s local community.
The community is essential to help prioritize the performance areas and also the possible outcomes for those served by regional centers.
In order to ensure involvement, regional centers must conduct at least one public meeting, collect information from the community through focus groups or surveys, and solicit feedback whenever possible on the services and supports available.
2

EvaluationCriteriaforRegionalCenterPerformance
The Department reviews baseline and year-end information to evaluate performance. Success is demonstrated when:
1. The outcome has improved over the prior year’s baseline, or
2. The performance exceeds the statewide average, or3. The performance equals a standard that has been
defined by the Department
3
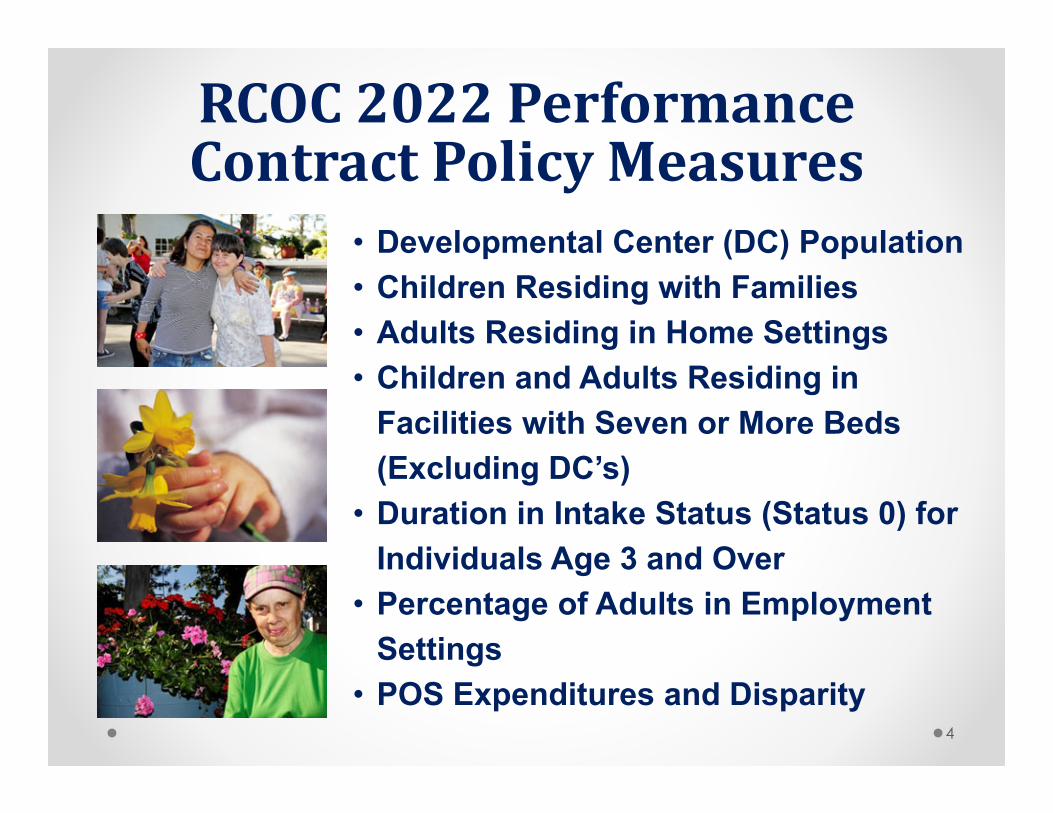
RCOC2022PerformanceContractPolicyMeasures
• Developmental Center (DC) Population• Children Residing with Families• Adults Residing in Home Settings• Children and Adults Residing in
Facilities with Seven or More Beds (Excluding DC’s)
• Duration in Intake Status (Status 0) for Individuals Age 3 and Over
• Percentage of Adults in Employment Settings
• POS Expenditures and Disparity4

RCOCMandatesUnderTheLantermanAct
• Review Eligibility• Develop and Monitor
Services• Coordination of Services• Funding Source• Due Process
5

RCOCToday• 442 employees (300 SCs and
nine Lead SC positions)
• 22,691 persons served
• Approximately 1,600 service providers
• 14 member public Board of Directors made up of persons served and family members
6
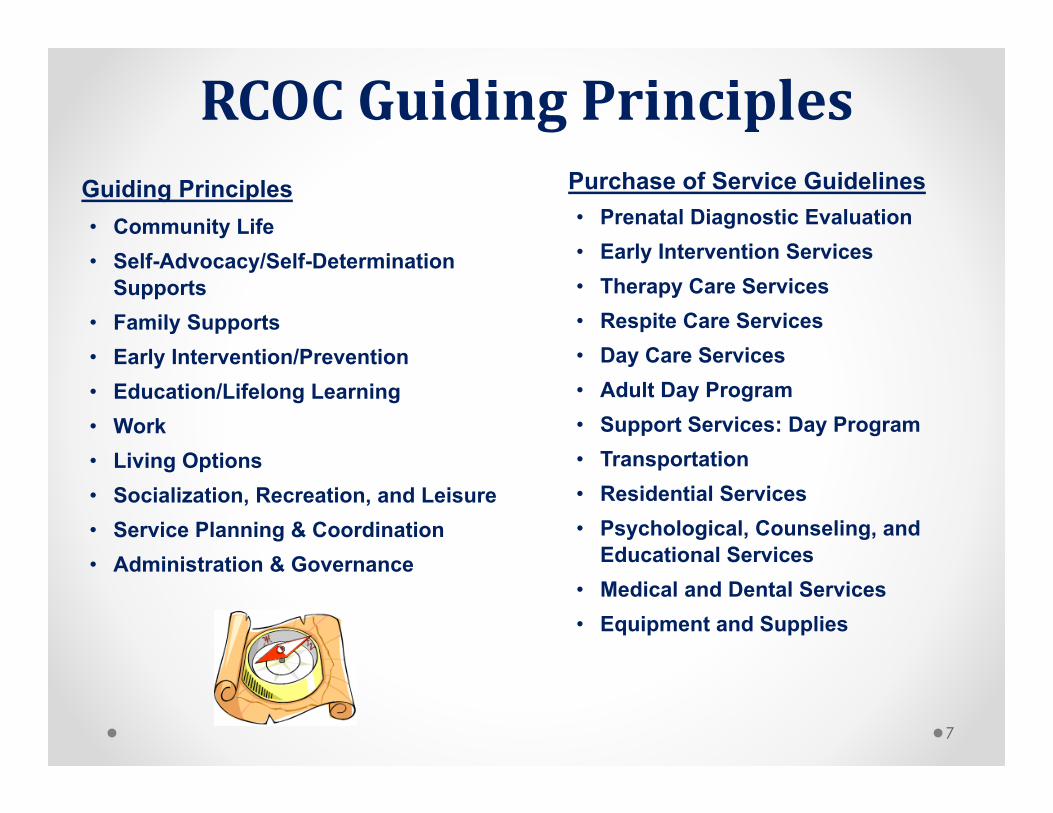
RCOCGuidingPrinciples
• Prenatal Diagnostic Evaluation• Early Intervention Services• Therapy Care Services• Respite Care Services• Day Care Services• Adult Day Program• Support Services: Day Program• Transportation• Residential Services• Psychological, Counseling, and
Educational Services • Medical and Dental Services• Equipment and Supplies
• Community Life• Self-Advocacy/Self-Determination
Supports• Family Supports• Early Intervention/Prevention• Education/Lifelong Learning• Work• Living Options• Socialization, Recreation, and Leisure• Service Planning & Coordination• Administration & Governance
Guiding Principles Purchase of Service Guidelines
7

RCOC’sDollars2021‐2022
Preliminary Allocation
PURCHASE OF SERVICE:$399 Million
OPERATIONS:$43.5 Million
8

9
Adult Day Programs, $97.6, 22%
Living Options / Program Support,
$149.2, 33%
Early Start, $23.9, 5%
Respite / Day Care, $44.2, 10%
Transportation, $6.1, 1%
Supported Living, $44.8, 10%
Behavior Services, $5.0, 1%
Other, $79.5, 18%
Fiscal Year 2020-21 Year to DateExpenditures in Millions

10
Regional Center Total ChildrenStatus 1 and 2
Total AdultsStatus 2
Total DCStatus 8
Total Active CaseloadStatus 1, 2, 8
Inland 19,031 19,798 16 38,845San Diego 17,936 14,852 20 32,808North L. A. County 15,364 12,170 14 27,548Alta 12,411 13,740 39 26,190
Orange County 10,482 12,201 8 22,691East Bay 10,692 11,592 22 22,306Central Valley 11,396 10,768 30 22,194South Central L. A. 9,972 8,021 13 18,006San Andreas 7,993 9,492 9 17,494Valley Mountain 8,975 7,045 13 16,033Tri-Counties 8,163 7,497 7 15,667Harbor 8,229 7,231 2 15,462San Gabriel Pomona 6,584 7,263 4 13,851East Los Angeles 6,555 6,072 4 12,631Lanterman 6,161 4,838 1 11,000Kern 5,480 5,106 11 10,597Golden Gate 3,773 5,813 11 9,597North Bay 3,899 5,390 11 9,300Westside 4,509 4,650 6 9,165Far Northern 3,632 4,542 11 8,185Redwood Coast 1,765 2,311 3 4,079
183,002 180,392 255 363,649

11
Number and Percent of Total Population with Active Status (Status 1, 2 & 8)Who Are In Developmental Centers (Status 8) as of June 2021
(Based on CMF Status Codes)
Regional Center Developmental Center Caseload Total Active CaseloadNumber Percent
Alta 39 0.15% 26,190Central Valley 30 0.14% 22,194East Bay 22 0.10% 22,306East Los Angeles 4 0.03% 12,631Far Northern 11 0.13% 8,185Golden Gate 11 0.11% 9,597Harbor 2 0.01% 15,462Inland 16 0.04% 38,845Kern 11 0.10% 10,597Lanterman 1 0.01% 11,000North Bay 11 0.12% 9,300North L. A. County 14 0.05% 27,548Orange County 8 0.04% 22,691Redwood Coast 3 0.07% 4,079San Andreas 9 0.05% 17,494San Diego 20 0.06% 32,808San Gabriel/Pomona 4 0.03% 13,851South Central L. A. 13 0.07% 18,006Tri-Counties 7 0.04% 15,667Valley Mountain 13 0.08% 16,033Westside 6 0.07% 9,165
Statewide Average Percent 255 0.07% 363,649

12
Children* Residing with Families*Individuals Under Age 18 with Status 1 or 2 on CMF as of June 2021
Regional CenterFoster Home
(Child)Own Home
Parent/GuardianTotal Children
in Homes Total ChildrenStatus 1 and 2
Number Percent Number Percent Number PercentAlta 144 1.16% 12,222 98.48% 12,366 99.64% 12,411Central Valley 200 1.76% 11,135 97.71% 11,335 99.46% 11,396East Bay 138 1.29% 10,480 98.02% 10,618 99.31% 10,692East Los Angeles 115 1.75% 6,389 97.47% 6,504 99.22% 6,555Far Northern 142 3.91% 3,476 95.70% 3,618 99.61% 3,632Golden Gate 26 0.69% 3,722 98.65% 3,748 99.34% 3,773Harbor 375 4.56% 7,842 95.30% 8,217 99.85% 8,229Inland 905 4.76% 18,014 94.66% 18,919 99.41% 19,031Kern 147 2.68% 5,312 96.93% 5,459 99.62% 5,480Lanterman 96 1.56% 6,054 98.26% 6,150 99.82% 6,161North Bay 85 2.18% 3,796 97.36% 3,881 99.54% 3,899North L. A. County 720 4.69% 14,590 94.96% 15,310 99.65% 15,364Orange County 248 2.37% 10,175 97.07% 10,423 99.44% 10,482Redwood Coast 54 3.06% 1,702 96.43% 1,756 99.49% 1,765San Andreas 87 1.09% 7,845 98.15% 7,932 99.24% 7,993San Diego 352 1.96% 17,500 97.57% 17,852 99.53% 17,936San Gabriel/Pomona 262 3.98% 6,290 95.53% 6,552 99.51% 6,584South Central L. A. 509 5.10% 9,430 94.56% 9,939 99.67% 9,972Tri-Counties 159 1.95% 7,978 97.73% 8,137 99.68% 8,163Valley Mountain 228 2.54% 8,698 96.91% 8,926 99.45% 8,975Westside 178 3.95% 4,319 95.79% 4,497 99.73% 4,509
Statewide Average Percent 5,170 2.83% 176,969 96.70% 182,139 99.53% 183,002

13
Adults* Residing in Home Settings*Individuals Ages 18 and Over with Status 2 on CMF as of June 2021
Regional Center Adult FHAIndependent
LivingOwn Home
ParentSupported
LivingTotal Adults inHome Settings
Total Adults
Status 2Number Percent Number Percent Number Percent Number Percent Number PercentAlta 137 1.00% 2,464 17.93% 8,424 61.31% 641 4.67% 11,666 84.91% 13,740Central Valley 315 2.93% 1,532 14.23% 6,772 62.89% 229 2.13% 8,848 82.17% 10,768East Bay 20 0.17% 1,424 12.28% 7,181 61.95% 448 3.86% 9,073 78.27% 11,592East Los Angeles 18 0.30% 257 4.23% 4,821 79.40% 272 4.48% 5,368 88.41% 6,072Far Northern 27 0.59% 1,255 27.63% 2,130 46.90% 279 6.14% 3,691 81.26% 4,542Golden Gate 145 2.49% 461 7.93% 3,465 59.61% 423 7.28% 4,494 77.31% 5,813Harbor 10 0.14% 258 3.57% 5,230 72.33% 646 8.93% 6,144 84.97% 7,231Inland 79 0.40% 1,237 6.25% 14,507 73.28% 472 2.38% 16,295 82.31% 19,798Kern 216 4.23% 409 8.01% 3,294 64.51% 498 9.75% 4,417 86.51% 5,106Lanterman 2 0.04% 378 7.81% 3,480 71.93% 96 1.98% 3,956 81.77% 4,838North Bay 83 1.54% 633 11.74% 3,004 55.73% 649 12.04% 4,369 81.06% 5,390North L. A. County 51 0.42% 1,133 9.31% 8,730 71.73% 418 3.43% 10,332 84.90% 12,170Orange County 104 0.85% 882 7.23% 8,310 68.11% 499 4.09% 9,795 80.28% 12,201Redwood Coast 73 3.16% 469 20.29% 1,058 45.78% 544 23.54% 2,144 92.77% 2,311San Andreas 50 0.53% 661 6.96% 6,443 67.88% 517 5.45% 7,671 80.82% 9,492San Diego 86 0.58% 1,622 10.92% 9,918 66.78% 292 1.97% 11,918 80.25% 14,852San Gabriel/Pomona 47 0.65% 438 6.03% 4,893 67.37% 125 1.72% 5,503 75.77% 7,263South Central L. A. 41 0.51% 290 3.62% 5,833 72.72% 555 6.92% 6,719 83.77% 8,021Tri-Counties 23 0.31% 805 10.74% 4,655 62.09% 750 10.00% 6,233 83.14% 7,497Valley Mountain 60 0.85% 538 7.64% 4,433 62.92% 531 7.54% 5,562 78.95% 7,045Westside 22 0.47% 462 9.94% 3,131 67.33% 464 9.98% 4,079 87.72% 4,650
StatewideAverage Percent 1,609 0.89% 17,608 9.76% 119,712 66.36% 9,348 5.18% 148,277 82.20% 180,392

14
Children* Residing in Facilities with Seven or More Beds (Excluding DCs)*Individuals Under Age 18 with Status 1 or 2 on CMF as of June 2021
Regional Center CCF (7+ Beds) ICF (7+ Beds) Nursing Facility Total Children7+ Beds Total Children
Status 1 and 2Number Percent Number Percent Number Percent Number Percent
Alta 0 0.00% 0 0.00% 0 0.00% 0 0.00% 12,411Central Valley 0 0.00% 0 0.00% 0 0.00% 0 0.00% 11,396East Bay 0 0.00% 0 0.00% 0 0.00% 0 0.00% 10,692East Los Angeles 0 0.00% 1 0.02% 0 0.00% 1 0.02% 6,555Far Northern 0 0.00% 0 0.00% 0 0.00% 0 0.00% 3,632Golden Gate 0 0.00% 0 0.00% 0 0.00% 0 0.00% 3,773Harbor 0 0.00% 0 0.00% 0 0.00% 0 0.00% 8,229Inland 1 0.01% 17 0.09% 1 0.01% 19 0.10% 19,031Kern 0 0.00% 0 0.00% 0 0.00% 0 0.00% 5,480Lanterman 1 0.02% 0 0.00% 1 0.02% 2 0.03% 6,161North Bay 0 0.00% 0 0.00% 0 0.00% 0 0.00% 3,899North L. A. County 1 0.01% 0 0.00% 1 0.01% 2 0.01% 15,364Orange County 1 0.01% 1 0.01% 0 0.00% 2 0.02% 10,482Redwood Coast 1 0.06% 0 0.00% 0 0.00% 1 0.06% 1,765San Andreas 0 0.00% 0 0.00% 0 0.00% 0 0.00% 7,993San Diego 10 0.06% 1 0.01% 4 0.02% 15 0.08% 17,936San Gabriel/Pomona 2 0.03% 5 0.08% 0 0.00% 7 0.11% 6,584South Central L. A. 4 0.04% 3 0.03% 0 0.00% 7 0.07% 9,972Tri-Counties 0 0.00% 0 0.00% 0 0.00% 0 0.00% 8,163Valley Mountain 1 0.01% 2 0.02% 0 0.00% 3 0.03% 8,975Westside 0 0.00% 0 0.00% 0 0.00% 0 0.00% 4,509StatewideAverage Percent 22 0.01% 30 0.02% 7 0.00% 59 0.03% 183,002

15
Adults* Residing in Facilities with Seven or More Beds (Excluding DCs)*Individuals Ages 18 and Over with Status 2 on CMF as of June 2021
Regional Center CCF (7+ Beds) ICF (7+ Beds) Nursing Facility Total Adults7+ Beds Total Adults
Status 2Number Percent Number Percent Number Percent Number Percent
Alta 126 0.92% 36 0.26% 73 0.53% 235 1.71% 13,740Central Valley 15 0.14% 1 0.01% 39 0.36% 55 0.51% 10,768East Bay 161 1.39% 4 0.03% 60 0.52% 225 1.94% 11,592East Los Angeles 7 0.12% 3 0.05% 27 0.44% 37 0.61% 6,072Far Northern 20 0.44% 0 0.00% 13 0.29% 33 0.73% 4,542Golden Gate 103 1.77% 9 0.15% 31 0.53% 143 2.46% 5,813Harbor 9 0.12% 13 0.18% 28 0.39% 50 0.69% 7,231Inland 56 0.28% 63 0.32% 69 0.35% 188 0.95% 19,798Kern 16 0.31% 2 0.04% 31 0.61% 49 0.96% 5,106Lanterman 149 3.08% 44 0.91% 75 1.55% 268 5.54% 4,838North Bay 3 0.06% 6 0.11% 34 0.63% 43 0.80% 5,390North L. A. County 84 0.69% 122 1.00% 65 0.53% 271 2.23% 12,170Orange County 124 1.02% 10 0.08% 77 0.63% 211 1.73% 12,201Redwood Coast 14 0.61% 0 0.00% 12 0.52% 26 1.13% 2,311San Andreas 86 0.91% 32 0.34% 36 0.38% 154 1.62% 9,492San Diego 118 0.79% 79 0.53% 109 0.73% 306 2.06% 14,852San Gabriel/Pomona 171 2.35% 190 2.62% 47 0.65% 408 5.62% 7,263South Central L. A. 63 0.79% 49 0.61% 67 0.84% 179 2.23% 8,021Tri-Counties 34 0.45% 129 1.72% 26 0.35% 189 2.52% 7,497Valley Mountain 157 2.23% 15 0.21% 47 0.67% 219 3.11% 7,045Westside 10 0.22% 5 0.11% 19 0.41% 34 0.73% 4,650StatewideAverage Percent 1,526 0.85% 812 0.45% 985 0.55% 3,323 1.84% 180,392

16
Duration in Intake Status (Status 0) for Individuals Ages 3 and OverBased on CMF as of June 2021
Regional Center <= 142 DAYS 143-240 DAYS OVER 240 DAYS GRAND TOTALNumber Percent Number Percent Number Percent
Alta 338 98.26% 3 0.87% 3 0.87% 344Central Valley 400 99.75% 0 0.00% 1 0.25% 401East Bay 379 98.70% 4 1.04% 1 0.26% 384East Los Angeles 132 100.00% 0 0.00% 0 0.00% 132Far Northern 130 99.24% 1 0.76% 0 0.00% 131Golden Gate 190 95.00% 9 4.50% 1 0.50% 200Harbor 293 98.32% 2 0.67% 3 1.01% 298Inland 510 95.33% 9 1.68% 16 2.99% 535Kern 164 99.39% 1 0.61% 0 0.00% 165Lanterman 182 95.79% 4 2.11% 4 2.11% 190North Bay 124 94.66% 3 2.29% 4 3.05% 131North L. A. County 736 100.00% 0 0.00% 0 0.00% 736Orange County 227 100.00% 0 0.00% 0 0.00% 227Redwood Coast 126 94.74% 7 5.26% 0 0.00% 133San Andreas 140 99.29% 0 0.00% 1 0.71% 141San Diego 427 99.77% 1 0.23% 0 0.00% 428San Gabriel/Pomona 187 98.94% 1 0.53% 1 0.53% 189South Central L. A. 578 98.97% 3 0.51% 3 0.51% 584Tri-Counties 189 100.00% 0 0.00% 0 0.00% 189Valley Mountain 243 95.67% 2 0.79% 9 3.54% 254Westside 118 99.16% 0 0.00% 1 0.84% 119
Statewide Totals and Average Percents 5,813 98.34% 50 0.85% 48 0.81% 5,911

17
Individuals with Status 2 on CMF as of June 2021with Current CDER*
Regional CenterHave Current CDER Grand Total Persons
with Status 2Number PercentAlta 23,431 98.44% 23,803Central Valley 18,373 97.92% 18,764East Bay 19,689 98.12% 20,067East Los Angeles 10,727 98.74% 10,864Far Northern 7,347 99.50% 7,384Golden Gate 8,179 98.90% 8,270Harbor 13,560 99.45% 13,635Inland 32,855 96.46% 34,061Kern 9,107 98.35% 9,260Lanterman 8,779 94.47% 9,293North Bay 8,002 98.39% 8,133North L. A. County 23,778 99.13% 23,986Orange County 19,373 99.89% 19,395Redwood Coast 3,497 94.18% 3,713San Andreas 15,081 99.18% 15,206San Diego 27,906 98.66% 28,285San Gabriel/Pomona 11,823 99.47% 11,886South Central L. A. 15,168 99.15% 15,298Tri-Counties 12,713 99.20% 12,816Valley Mountain 13,451 98.22% 13,695Westside 7,876 98.62% 7,986StatewideAverage Percent 310,715 98.39% 315,800

DisparityMeasuresIn 2018 regional centers added information related to reducing disparities and improving equity in purchase of service expenditures. Regional Center of Orange County elected to include three of four possible measures.
These measures look at expenditures related to three age groups, based on race and ethnicity, primary language, and those persons served who primarily receive case management services.
18

19
BirthtoTwoYearsofAgePOSbyEthnicity
Fiscal Year 2019-2020Birth to 2 Years
Ethnicity
TotalPersons
PercentageOf
Expenditures
TotalAuthorized Utilized
American Indian or Alaska Native 5 0.3% $13,560 58.2%
Asian 769 18.9% $7,658,368 62.6%
Black/African American 66 1.2% $501,877 60.2%
Hispanic 2,010 34.2% $13,896,359 58.7%
Native Hawaiian or Other Pacific Islander 8 0.1% $71,938 59.2%
Other Ethnicity or Race / Multi-Cultural 1,449 27.0% $11,132,262 60.6%
White 1,004 18.0% $7,413,103 60.6%
Totals 5,311 $40,687,467

20
AgeThreeto21YearsPOSbyEthnicity
Fiscal Year 2019-20203 to 21 Years
Ethnicity
TotalPersons
PercentageOf
Expenditures
TotalAuthorized Utilized
American Indian or Alaska Native 15 0.2% $127,020 79.3%
Asian 1,868 17.9% $14,747,888 58.5%
Black/African American 178 2.0% $1,739,150 67.1%
Hispanic 3,901 27.0% $24,127,465 63.6%
Native Hawaiian or Other Pacific Islander 19 0.1% $124,438 61.9%
Other Ethnicity or Race / Multi-Cultural 1,810 19.1% $16,998,364 61.8%
White 2,256 35.0% $31,354,831 71.7%
Totals 10,047 $89,219,156

Age22YearsandOlderPOSbyEthnicity
21
Fiscal Year 2019-202022 Years and Older
Ethnicity
TotalPersons
PercentageOf
Expenditures
TotalAuthorized Utilized
American Indian or Alaska Native 23 0.3% $1,209,523 89.3%
Asian 1,381 11.4% $47,680,128 81.7%
Black/African American 251 2.8% $11,614,140 86.6%
Hispanic 2,644 18.9% $78,479,414 81.0%
Native Hawaiian or Other Pacific Islander 11 0.1% $297,683 84.4%
Other Ethnicity or Race / Multi-Cultural 793 7.5% $31,229,761 82.4%
White 4,702 59.2% $246,278,710 85.5%
Totals 9,805 $416,789,360

BirthtoTwoYearsofAgeCaseManagementOnly
22
Fiscal Year 2019-2020Birth to 2 Years
Ethnicity
TotalPersons
CaseManagement
PercentNo
Services
American Indian or Alaska Native 5 1 20.0%
Asian 769 18 2.3%
Black/African American 66 2 3.0%
Hispanic 2,010 82 4.1%
Native Hawaiian or Other Pacific Islander 8 0 0.0%
Other Ethnicity or Race / Multi-Cultural 1,449 53 3.7%
White 1,004 46 4.6%
Totals 5,311 202 3.8%

AgeThreeto21YearsCaseManagementOnly
23
Fiscal Year 2019-2020Ages 3 to 21 Years
Ethnicity
TotalPersons
CaseManagement
PercentNo
Services
American Indian or Alaska Native 15 3 20.0%
Asian 1,868 550 29.4%
Black/African American 178 69 38.8%
Hispanic 3,901 1,847 47.4%
Native Hawaiian or Other Pacific Islander 19 11 57.9%
Other Ethnicity or Race / Multi-Cultural 1,810 529 29.2%
White 2,256 585 25.9%
Totals 10,047 3,594 35.8%

Age22YearsandOlderCaseManagementOnly
24
Fiscal Year 2019-202022 Years and Older
Ethnicity
TotalPersons
CaseManagement
PercentNo
Services
American Indian or Alaska Native 23 4 17.4%
Asian 1,381 284 20.6%
Black/African American 251 42 16.7%
Hispanic 2,644 586 22.2%
Native Hawaiian or Other Pacific Islander 11 3 27.3%
Other Ethnicity or Race / Multi-Cultural 793 157 19.8%
White 4,702 589 12.5%
Totals 9,805 1,665 17.0%

PerCapitaPOSExpendituresbyPrimaryLanguage
25
Fiscal Year 2019-2020Primary Language
TotalPersons
Per CapitaExpenses
PercentageUtilized
ASL (American Sign Language) 27 $53,426 84.0%
English 19,020 $19,569 80.1%
Spanish 4,574 $8,844 72.7%
Mandarin Chinese 74 $10,029 68.2%
Vietnamese 1,114 $10,551 75.9%
Korean 143 $22,092 80.3%
Tagalog 24 $29,026 81.4%
Arabic 49 $7,234 68.1%
Farsi (Persian) 46 $9,784 68.5%

EmploymentandVocationalMeasures
ArturoCazaresAssociateDirectorofEmployment

EmploymentFirst
27
California’s Policy- signed into law on October 9, 2013. The policy states that “opportunities for integrated, competitive employment shall be given the highest priority for working age individuals with developmental disabilities, regardless of the severity of their disabilities.”
RCOC’s Policy- endorsed by RCOC’s Board of Directors on March 6, 2014. The policy states that competitive integrated employment will be the first option considered by planning teams for every working age adult served by RCOC.
• RCOC stopped referrals to Workshops in July of 2014
• RCOC developed the Employment First program model

CompetitiveIntegratedEmployment
28
• Full-time or part-time work for which an individual served is paid minimum wage or greater directly by the employer, in a setting with others who do not have disabilities.
This will also include the individuals served having the same opportunities for advancement and receiving the same benefits as their co-workers who do not have disabilities and are in the same or similar positions.

California’sMinimumWageHistory
Effective Date Old Minimum Wage New Minimum Wage
1/1/2008 $7.50 / hour $8.00 / hour
1/1/2014 $8.00 / hour $9.00 / hour
1/1/2016 $9.00 / hour $10.00 / hour
1/1/2017 $10.00 / hour $10.50 / hour
1/1/2018 $10.50 / hour $11.00 / hour
1/1/2019 $11.00 / hour $12.00 / hour
1/1/2020 $12.00 / hour $13.00 / hour
1/1/2021 $13.00 / hour $14.00 / hour

30
ImportantPoints:• Morepersonsareemployed,butsomemaybeworkingfewerhours• Personsbetweentheagesof16‐22arestilleligibleforschooldistrictservices• Personsovertheageof64arestillworking
Employment Development Department*Based on Persons Served between the ages of 16-64
Average Number ofPersons Served with
Earned Income per Quarter
Percentage ofPersons Served with
Earned Income
Average Annual Wages forPersons Served
Year RCOCAverage
StatewideAverage
RCOCAverage
StatewideAverage
RCOCAverage
StatewideAverage
2013 1,207 839 12.8% 12% $6,691 $6,697
2014 1,754 906 17.9% 13.1% $6,086 $7,044
2015 2,175 962 27% 16% $5,681 $7,248
2016 2,345 25,236 22% 17% $6,613 $8,327
2017 2,341 27,182 21% 17% $7,580 $9,033
2018 3,336 27,526 21% 16% $8,806 $10,317
2019 2,335 28,170 20% 16% $9,578 $11,327

31
Adults with Competitive Integrated EmploymentNational Core Indicators
Adults withPaid Employment
Adults WhoDesire Employment
Adults WithEmployment IPP Goal
FY 10/11 10% 40% 22%
FY 11/12 18% 46% 30%
FY 14/15 18% 47% 33%
FY 17/18 20% 57% 43%
Statewide Average for FY2017-18 15% 47% 29%

ImportantPoint:• DataforProjectSEARCHinternsisnotincluded,asinternsarenotpaid
32
Paid Internship Program
FY 2018-2019 FY 2019-2020
CA RCOC CA RCOC
Number of adults who were placed in competitive, integrated employment following participation in a Paid Internship Program
9 7 8 11
Percentage of adults who were placed in competitive, integrated employment following participation in a Paid Internship Program
13% 21% 9% 14%
Average hourly or salaried wages for adults who participated in a Paid Internship Program $12.45 $12.34 $13.31 $13.43
Average hours worked per week for adults who participated in a Paid Internship Program 17 18 16 13

ImportantPoints:• IncreaseinCAminimumwage• Delayedeligibilityforreimbursement
33
Competitive Integrated EmploymentIncentive Payments Program FY 2019-2020
2018-2019 2019-2020
CA RCOC CA RCOC
Average Wages for adults engaged in competitive integrated employment $12.76 $12.06 $13.52 $13.06
Average hours per week worked by adults engaged in competitive integrated employment 22 21 21 22
Total number of $1,000 incentive payments made 43 151 34 131
Total number of $1,250 incentive payments made 39 128 28 115
Total number of $1,500 payments made 27 83 22 90

34

35

RCOCVirtualChartData
36

ThankYou
37