regional integration under the east african … customs union has been resurrected to improve trade...
TRANSCRIPT
Regional Integration under the East African Community: An
Assessment of the Trade and Welfare Effects for Uganda
Sangeeta Khorana, Kato Kimbugwe and Nicholas Perdikis
ABSTRACT Regional trade arrangements have become a popular vehicle for the promotion of trade and growth. This is particularly so in Africa where a number of over lapping arrangements have come into existence. In East Africa the previously defunct East Africa Customs Union has been resurrected to improve trade between Kenya, Tanzania and Uganda. To facilitate the development of the East African Community and to smooth the economic relationships between the partners, transitional arrangements have been put in place. Using a partial equilibrium model, this paper examines the implications of the transitional measures for Uganda, questions whether these arrangements confer any real benefits on the stakeholders and suggests alternative approaches so that Uganda benefits from trade liberalisation within the customs union.
Keywords: economic integration, international trade simulation, customs union JEL Classification: F15, F17
Affiliation: School of Management and Business University of Wales Aberystwyth SY23 3DD United Kingdom Tel: +44 1970 622 502 Fax: +44 1970 622 409 Website: www.aber.ac.uk/smba This paper has been prepared for the International Conference on Policy Modeling (EcoMod2007) being held in Sao Paulo, Brazil on 11-13 July 2007. The views expressed are personal and should not be attributed to any person or organisation. Comments are welcome. Email: [email protected].
May 2007 draft (Preliminary version)

- 2 -
1. INTRODUCTION
Regional integration arrangements (RIAs) constitute an increasingly significant feature of the world trade system. Africa and East Africa in particular is not an exception to this phenomenon. Estimates show that more than half of total world trade occurs through regional trade blocs/agreements and that world trade under RIAs grew from 43 % to 60 % of the total between 2001 and 2005 (OECD, 2005). By 1st December 2006, 211 RIAs have been notified to the WTO1, of which 14 are in Africa. Among the African RIAs eight are regional economic communities (RECs). These are the Arab Maghreb Union (UMA), Community of Sahel-Saharan States (CEN-SAD), Common Market for Eastern and Southern Africa (COMESA), East African Community (EAC), Economic Community of West African States (ECOWAS), Economic Community of Central African States (ECCAS), Inter-Governmental Authority on Development (IGAD), and Southern African Development Community (SADC). In addition, there are six inter-governmental organisations; these are Central African Monetary and Economic Community (CEMAC), the Economic Community of the Great Lakes States (CEPGL), Indian Ocean Commission (IOC), Mano River Union (MRU), Southern African Customs Union (SACU), and West African Economic and Monetary Union (UEMOA). A key distinguishing feature of most of the African RIAs is overlapping membership with potentially conflicting goals (UNECA, 2004).
The resurrected East African Community (EAC) is among the most recent RIA notified to the WTO. Although a previous unsuccessful EAC was established in 1919 it ceased to function in the 1970s (UNECA, 2006). The treaty establishing the current EAC was signed on 30 November 1999 and came into force on 7 July 2001 upon its ratification by the Republics of Kenya, Uganda and Tanzania. The main objective of the EAC is to promote cooperation in the “political, economic and social fields” through encouraging economic development (including trade liberalisation, monetary and financial integration, and the free movement of persons, capital, goods and services); science and technology (including infrastructure, health and education); as well as political and legal matters. It envisages deepening regional integration by establishing a customs union (CU), common market, a monetary union and, ultimately a political federation among the partner countries (Article 5.2: EAC Treaty, 2001).
The EAC customs union protocol, aims to liberalise inter and intra regional trade. Products originating in third countries will be subject to a common external tariff (CET) covering approximately 99 % of all tariff lines. This will be implemented in two phases. The first phase groups all products into three bands, each having its own tariff rate. There is a zero rate for raw materials, a 10 % rate for intermediate products and a 25 % rate for finished goods (EAC, 2005). The second phase of CET implementation comes in 2010 when the 25 % rate is reduced to 20 % subject to consultation amongst and approval by the member states (EAC, 2005).
For intra-EAC trade, the protocol splits traded products into category A and B goods. Tariffs were completely eliminated on category A goods when the customs union agreement came into force in January 2005. Category B goods are though subject to a transition period of five years from 2005 and the agreement allows for an annual reduction of 2 % per annum before the 10 % tariff is eliminated in 2010. The products 1 Source: http://www.wto.org/english/tratop_e/region_e/summary_e.xls.
- 3 -
that appear on the category B list are agricultural products, building materials, plastics, wood and paper through to textiles, iron and steel and other manufactures. These products are from Uganda’s view the most sensitive in terms of not being able to withstand the immediate competitive pressure from the Kenyan producers. The inclusion of category B good in the agreement not only recognises the differences in competitiveness between the countries but also the damage that could be done to the integration process in the longer term. In short it is perceived that without accepting some flexibility the EAC could fail again as in the past. Whether this policy is appropriate to achieve its aims is open to question. This paper aims to quantify and evaluate the perceived benefits to Uganda arising from these transitional arrangements.
The structure of the paper is as follows: Section II provides some background on the EAC and its members economies. It comments on the trade patters and flows between the member states, in particular Uganda and Kenya. Section III provides an overview of the growth of African regionalism and concentrates on the development of the EAC and its intra regional trade policy. Section IV discusses the partial equilibrium WITS-SMART model, estimates trade, welfare and revenue effects under the CU and analyses the impact of tariff reductions on different product groups. Section V discusses the policy implications of the results and suggests the way forward for the Ugandan policy makers.
2. AN OVERVIEW OF THE EAC ECONOMIES GDP, TRADE STRUCTURE AND PATTERN
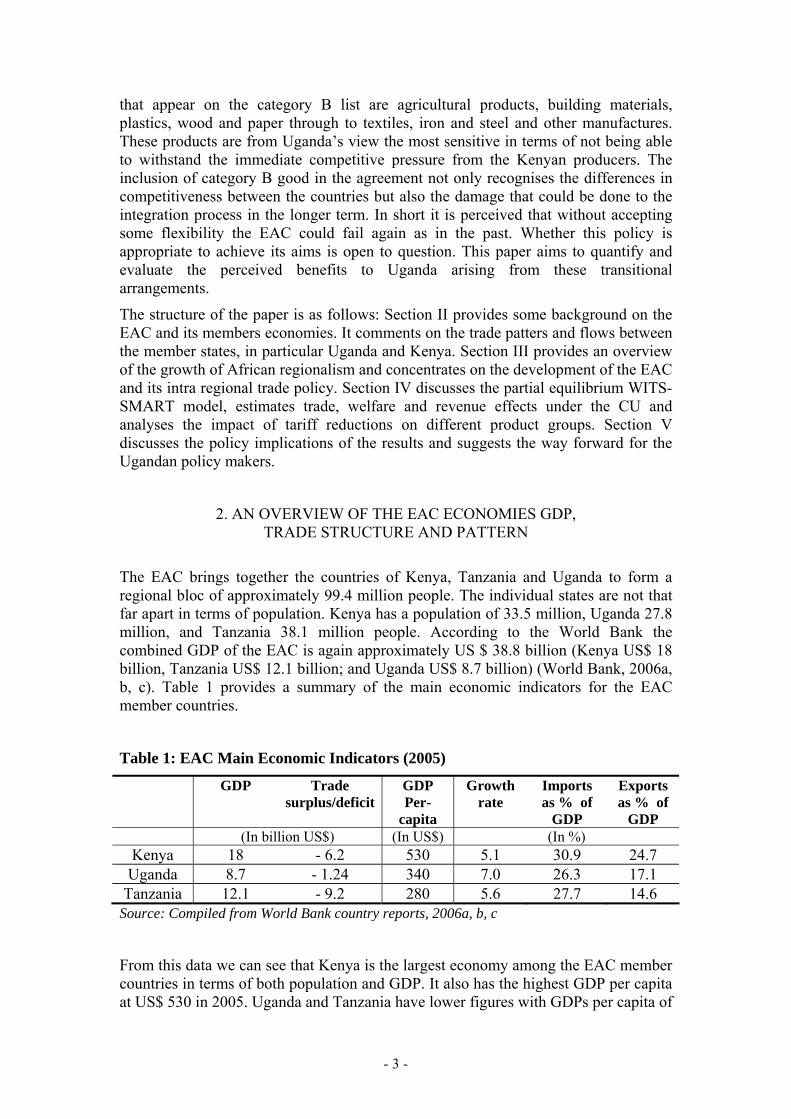
The EAC brings together the countries of Kenya, Tanzania and Uganda to form a regional bloc of approximately 99.4 million people. The individual states are not that far apart in terms of population. Kenya has a population of 33.5 million, Uganda 27.8 million, and Tanzania 38.1 million people. According to the World Bank the combined GDP of the EAC is again approximately US $ 38.8 billion (Kenya US$ 18 billion, Tanzania US$ 12.1 billion; and Uganda US$ 8.7 billion) (World Bank, 2006a, b, c). Table 1 provides a summary of the main economic indicators for the EAC member countries.
Table 1: EAC Main Economic Indicators (2005)
GDP Trade surplus/deficit
GDP Per-
capita
Growth rate
Imports as % of
GDP
Exports as % of
GDP (In billion US$) (In US$) (In %)
Kenya 18 - 6.2 530 5.1 30.9 24.7 Uganda 8.7 - 1.24 340 7.0 26.3 17.1
Tanzania 12.1 - 9.2 280 5.6 27.7 14.6 Source: Compiled from World Bank country reports, 2006a, b, c
From this data we can see that Kenya is the largest economy among the EAC member countries in terms of both population and GDP. It also has the highest GDP per capita at US$ 530 in 2005. Uganda and Tanzania have lower figures with GDPs per capita of
- 4 -
US$ 340 and US$ 280 respectively. Some convergence in the economic indicators between richer Kenya and poorer Uganda and Tanzania has taken place recently. This is due to the higher growth rates experienced in both Uganda (7 %) and Tanzania (5.6 %) compared to that of Kenya (5.1 %). The higher growth rates may in turn be the result of economic reforms in Uganda and Tanzania and the level of economic mismanagement and corruption found in Kenya (World Bank, 2006a).
Regional trade among the EAC member countries has shown a steady increase. One can class the EAC economies as fairly open given their high import and export GDP ratios. Their overall trade imbalances can be accounted for by their higher import ratios relative to their export ratios. At present, Kenya is the largest exporter of intermediate and finished goods to both Uganda and Tanzania. Trade between Uganda and Tanzania is relatively small. The analysis of trade data in 2005 shows that Kenya accounted for 25.35 % of Uganda’s total imports while Tanzania accounted for only 1.44 %; the remaining 74.65 % came from the rest of the world, mainly the EU (Ugandan Bureau of Statistics, 2006).
Overall Uganda’s trade registered an increase between 2000 and 2005. Total imports were US$ 958 million in 2000 which grew to US$ 2.05 billion by 2005. Similarly, exports nearly doubled from US$ 401 million in 2000 to US$ 812 million in 2005. As a result of this imbalance in import and export growth, Uganda’s trade deficit with Kenya and the rest of the world (RoW) nearly doubled, from US$ 556 million in 2000 to US$ 1241 million in 2005. The composition of trade flows shows that the total exports by Uganda were US$ 0.81 billion in 2005 and the main products were coffee and tea (US $ 224 million), fish products (US $ 140 million), gold (US$ 73 million) and cotton (US $ 39.2 million). Total imports were US$ 2.05 billion and consisted mainly of petroleum products, road vehicles, cereals, as well as iron and steel products. Imports of finished goods, however, registered the largest increase at 55.69% followed by intermediate products.
The trade statistics (Table 2) show that after the EAC customs union came into force, Uganda’s imports of category B products increased overall reflecting Uganda’s economic growth over the period. From Kenya, the imports of Uganda increased by 56.6 % while imports of these products under the CET from third countries and RoW grew by only 9.2 % during 2005. This suggests that some trade creation and diversion took place as a result of the changes in tariff rates. Most individual product groups also showed an overall increase apart from plastics, wood and textile products which showed a decline. Why this is the case is difficult to see. In the case of textile products, it could be due to the high CET of 100 % placed on imports of second hand clothes given that the underlying objective of a high CET was to protect the infant textile industry in the EAC countries.

- 5 -
Table 2: Uganda’s Category B imports from Kenya and the Rest of the World (2004-2005) (In thousand US$)
Imports Product groups 2004 2005
% change in imports from
Kenya RoW Kenya RoW Kenya RoW Agricultural products 6,538 97,591 9,954 112,607 52.2 15.4 Processed food products 1,213 2,923 1,911 2,579 57.5 -11.8 Tobacco products 926 2,208 819 3,210 -11.7 45.4 Building materials 14,747 204 29,828 291 102.3 42.7 Detergent and its products 4,263 3,085 6,448 3,121 51.2 1.2 Plastic products 3,026 4,544 2,775 2,787 -8.3 -38.7 Wood products 780 2,139 699 2,134 -10.4 -0.2 Paper products 1,414 1,299 2,354 335 66.5 -74.2 Textile products 783 12,849 363 9,318 -53.7 -27.5 Textile-manufactured products
410 3,594 469 3,996 14.3 11.2
Iron and steel products 2,742 12,027 3,258 14,843 18.8 23.4 Other manufactured products
1,372 4,230 957 4,940 -30.2 16.8
Total (All product groups) 38,214 146,692 59,833 160,160 56.6 9.2 (Base year: 2004)
Source: Compiled from the UBOS database, 2004 and 2005.
Product groups imported from Kenya that registered an increase larger than that from the RoW (with 2004 as the base year) were building materials particularly cement (102.3 %) followed by paper (66.5 %), processed food products like flour (57.5 %), agricultural products like rice and sugar (52.2 %), detergent and its products (51.2%) and textile manufactured products. The rapid growth in imports of building materials, agricultural products and iron and steel products can easily be explained by the rapid growth of the Ugandan economy. These statistics also suggest trade creation and diversion have taken place with the trade from the RoW. Those products where import growth from the RoW was less than from Kenya were processed food products (11.8 %), plastics (38.7 %), paper products (74.2 %) and textile products (27.5 %).
3. REGIONAL INTEGRATION IN EAST AFRICA
Regional integration initiatives in Africa date back to the establishment of the South African Customs Union (SACU) in 1910. In East Africa, regional integration initiatives were launched in 1919 with the formation of the EAC customs union between Uganda, Kenya and Tanzania. This cooperation, however, lasted only until 1977. The main factors that contributed to the collapse and the ultimate failure of the EAC were both, political and economic. The literature indicates that the centralisation of the administrative facilities in Kenya and the growing animosity between the
- 6 -
member countries were important political factors that led to the disintegration of the RIA (McKay et al., 1998). The dismal economic performance of the then EAC led to trade diversion under the RIA, which with the lack of compensatory arrangements for Tanzania and Uganda contributed to the failure of the integration efforts in the region (Hazelwood, 1975; UNECA, 2004). Given that coordination mechanisms envisaged in the then treaty failed to achieve regional balance between the member countries, the treaty on the one hand led to high inflation and massive trade deficits in Tanzania and Uganda while on the other, Kenya gained industrial dominance (Newlyn, 1971; Nixon, 1973; Robson, 1998; Maasdrop, 1999; Venebles, 1999; Mair, 2000; Schiff, 2000; Shams, 2003). The contradictory economic systems in each country further added momentum to the disintegration of the EAC (McKay et al., 1998). When the new treaty was drafted in 1999, the economic factors that led to the break-up of the EAC in 1977 were specifically addressed so that trade liberalisation under the revamped EAC would not again lead to current account deficits for Uganda and Tanzania with Kenya.
Studies show that the African countries have pursued regional integration to overcome the fundamental development constraints that are characteristic of the African economies, i.e., small economic size; lack of structural complementarities as manifested in the narrow set of similar low-value primary export products and basic minerals produced; and, dependence on imports of intermediate and final goods (ADB, 2000). In addition, Kwaku (1995) suggests that the main driver for the increasing number of RIAs on the African sub-continent is the need to increase regional cooperation by creating a unified economic bloc. The African countries also envisage that the RECs will be the building blocks for stronger integration between the countries that will lead to the eventual creation of an African Economic Community (WTO, 2005; UNECA, 2004). Some are of the view that regional integration will increase intra-regional trade, which will in turn spur economic growth and development through the economies of scale (Kasekende & Ng’eno, 2000; Mistry 2000). The study by the World Bank (2004) suggests that regionalism in Africa will pool the under-utilised resources and the fragmented African markets, promote industrialisation and act as a useful alternative to unilateral trade liberalisation. All these objectives provide the main motivation behind the establishment of the new EAC.
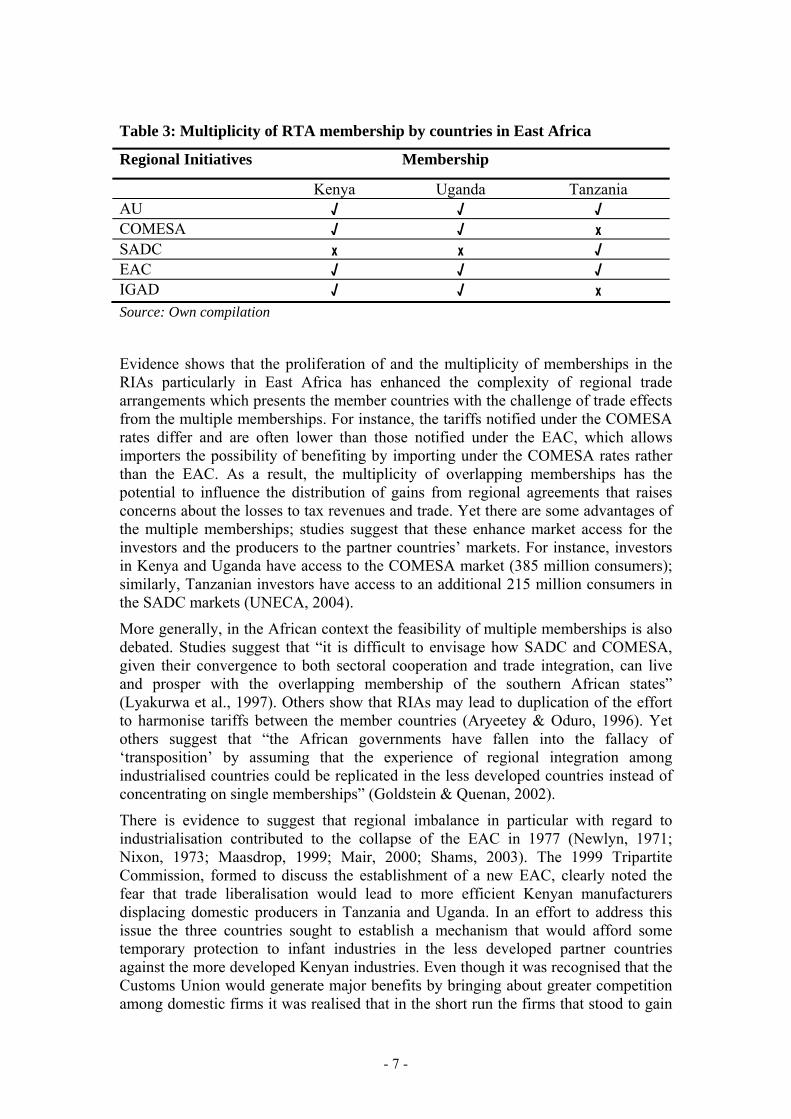
Overlapping membership of more than one regional agreement characterises the present RIAs in East Africa. Table 3 presents an overview on all the existing regional trade agreements in East Africa. Both, Kenya and Uganda are members of the EAC, COMESA, IGAD and the African Union (AU) but these countries have opted to remain out of the SADC. Similarly, Tanzania is a member of the EAC, AU and the SADC2 though not that of the IGAD. In addition to the preferential regional access, all the three EAC members enjoy preferential access to the EU and the U.S. markets under the Cotonou Agreement3 and the African Growth and Opportunity Act (AGOA), respectively.4
2 It withdrew its membership from the COMESA in favour of the southern African RTA-SADC. 3 The Cotonou Agreement allows non-reciprocal preferential tariffs on agricultural products to 77
African, Caribbean and Pacific countries. This was concluded for a twenty-year period from March 2000 to February 2020. It entered into force in April 2003 by replacing the Lomé Agreement. Available at: http://europa.eu.int/comm/development/body/cotonou/agreement/agr10_en.htm
4 The AGOA is a market initiative of the U.S. that allows duty-free treatment on 94 % of the total tariff lines under the GSP programme to LDCs in the sub-Saharan Africa till September 2015.
- 7 -
Table 3: Multiplicity of RTA membership by countries in East Africa
Regional Initiatives Membership
Kenya Uganda Tanzania AU √ √ √ COMESA √ √ x SADC x x √ EAC √ √ √ IGAD √ √ x Source: Own compilation
Evidence shows that the proliferation of and the multiplicity of memberships in the RIAs particularly in East Africa has enhanced the complexity of regional trade arrangements which presents the member countries with the challenge of trade effects from the multiple memberships. For instance, the tariffs notified under the COMESA rates differ and are often lower than those notified under the EAC, which allows importers the possibility of benefiting by importing under the COMESA rates rather than the EAC. As a result, the multiplicity of overlapping memberships has the potential to influence the distribution of gains from regional agreements that raises concerns about the losses to tax revenues and trade. Yet there are some advantages of the multiple memberships; studies suggest that these enhance market access for the investors and the producers to the partner countries’ markets. For instance, investors in Kenya and Uganda have access to the COMESA market (385 million consumers); similarly, Tanzanian investors have access to an additional 215 million consumers in the SADC markets (UNECA, 2004).
More generally, in the African context the feasibility of multiple memberships is also debated. Studies suggest that “it is difficult to envisage how SADC and COMESA, given their convergence to both sectoral cooperation and trade integration, can live and prosper with the overlapping membership of the southern African states” (Lyakurwa et al., 1997). Others show that RIAs may lead to duplication of the effort to harmonise tariffs between the member countries (Aryeetey & Oduro, 1996). Yet others suggest that “the African governments have fallen into the fallacy of ‘transposition’ by assuming that the experience of regional integration among industrialised countries could be replicated in the less developed countries instead of concentrating on single memberships” (Goldstein & Quenan, 2002).
There is evidence to suggest that regional imbalance in particular with regard to industrialisation contributed to the collapse of the EAC in 1977 (Newlyn, 1971; Nixon, 1973; Maasdrop, 1999; Mair, 2000; Shams, 2003). The 1999 Tripartite Commission, formed to discuss the establishment of a new EAC, clearly noted the fear that trade liberalisation would lead to more efficient Kenyan manufacturers displacing domestic producers in Tanzania and Uganda. In an effort to address this issue the three countries sought to establish a mechanism that would afford some temporary protection to infant industries in the less developed partner countries against the more developed Kenyan industries. Even though it was recognised that the Customs Union would generate major benefits by bringing about greater competition among domestic firms it was realised that in the short run the firms that stood to gain

- 8 -
most were those that were already competitive (EAC, 2000). It was with this consideration in mind that the principle of asymmetry5 was adopted in the phasing out of internal tariffs by providing firms located in Uganda and Tanzania with an adjustment period of five years. This form of protection, it was believed, would give those Tanzanian and Ugandan firms lagging behind an opportunity to adjust their cost base and eventually compete with their Kenyan rivals.
There has been a recent revival of support for this type of infant industry protection (Shafeaddin, 2000). The “Zedillo Report” has, furthermore, advocated the legitimisation of time-bound protection for certain industries by countries in the early stages of industrialisation (United Nations, 2001). First, it suggests that protection should be given to those industries that are able to become competitive in the long-term. Second, the protection given should be time bound (temporary) as the long-term costs of protection are not welfare enhancing. Third, it asks if the aim is to achieve scale economies as a route to competitiveness can this be successfully achieved in countries with small domestic markets? If the answer is no then protection should not be offered. Finally, do governments have the ability to identify the appropriate industries and the self-discipline to confine protection to them while resisting pressure from other sector lobby groups?
From an EAC perspective, these questions are pertinent and have to be addressed in light of the previous integration experience. However, it is also important to note that there are other dissenting voices against industry protection policies. Kemp (1960) and Grubel (1966) pointed out that where skills and knowledge are specific to a firm, there is no need for tariff protection as a way of justifying investment in human resources. Baldwin (1969) concurs with this view by asserting that that a protective duty is no guarantee that individual entrepreneurs will undertake greater investments in acquiring technological knowledge. Johnson (1965) also pointed out that despite industry protection being designed to correct domestic distortions it causes welfare loss by raising domestic prices above world prices. Other opponents (Luzio & Greenstein, 1995; Bora, Lloyd & Pangesti, 2000) of the infant industry argument doubt that any government (developed or developing) has the ability to select the right industries or appropriate degree of protection. This also raises more doubt that as to whether domestic firms may respond to the protection as desire or simply become even more inefficient and less competitive. Other critics argue that political pressures make it difficult for government to implement an infant industry protection policy effectively without succumbing to various lobbies.
The evidence from, both, historical and empirical studies (Kruger & Tuncer, 1982) have not been conclusive and hence the debate has often merged with the general one on the merits of free trade. From a historical perspective, proponents of the infant industry argument cite the experience of the US and Germany in the 19th century as evidence of its merits. However, seen from an African perspective several World Bank inspired structural adjustment plans have failed to deliver the import substitution industries that these countries had desired. Most examples of industry protection in Africa have focussed on manufacturing with the aim of fostering industrialisation. Empirical studies of individual industries however seem to suggest that past protection has in general not succeeded. For example Bora et al. (2000) note that “there has been a plethora of studies of studies which show that industrialisation
5 This addresses variances in the implementation of measures in an economic integration process for
purposes of achieving a common objective.
- 9 -
behind protective walls has often extended beyond reasonable grounds of infancy and has led to efficiency and welfare losses and entrenched vested interests”. In addition, recent evidence from Africa seems to suggest that these policies have not achieved what they were set out to do (Morrissey & Rudaheranwa, 1998). Besides, Tybout (2000) found that “unexploited economies of scale in developing countries were modest and as a result protection simply reduces the average efficiency levels at the margin.” This in essence casts some doubt on the infant industry argument whether protection will lead to more efficient and competitive firms.
Despite these doubts, in East Africa a case can be made for temporary and limited industry protection based on the historical lessons of previous integration attempts. A USAID study (Fox, 2004) concurs with this view by stressing that the failure of past RTAs to support the infant industry rationale should not be interpreted as a failure in the short-run. The report goes on to offer the experience of the Asian tigers that have shown how the governmental promotion and subsidization of firms can produce dramatic and positive cumulative change over the long-term. Shafaeddin (2000) argues that infant industry protection is valid and in present conditions more relevant owing to recent technological changes and innovations in the organisation of production. Thus, it is within this context that internal tariffs and non-tariff barriers, that could hinder trade between the partner states, have to be evaluated, in order to facilitate the awareness of their cost to business and investment in the region.
After years of negotiations on 1 January 2005, the EAC Customs Union was launched. The objectives of the Customs Union, as stipulated in the EAC treaty, included the liberalisation of intra-regional trade in goods; promoting production efficiency in the Community; enhancing domestic, cross-border and foreign investment; and promoting economic development and industrial diversification (EAC, 1999). There are two broad areas of cooperation highlighted in the Customs Union: (i) customs management and general trade matters; and (ii) establishing and adopting uniform and common trade procedures in the Community. The Customs union is underpinned by a common EAC Customs Management Act and a Common External Tariff. The CET has three tariffs bands of 0, 10 and 25 % for raw materials, intermediate goods and finished goods respectively. In line with the CET set the EAC council reserves the right to review the CET structure and approve measures aimed at remedying any adverse effects that a partner State may experience as a result of implementing the CET (Article 12: EAC, 1999). There are, in addition, a number of sensitive products that are exempt from the CET and may be imported at other specific tariff levels which are higher than 25 %. These include wheat, rice, maize (not for seed), some cotton clothing, jute bags and sugar.
As outlined under Articles 11 and 12 of the Protocol, the provisional structure and application of internal tariffs is asymmetrical thus reflecting the fact that Kenya’s economy is more developed than the economies of its EAC partners. Beehnick et al., (2003) argue that this principle of asymmetry should be carefully applied and in designing of compensation mechanisms it should take cognizance of the changes that would occur with regard to winners and losers in trade and thus keep changing over time. On the implementation of the Protocol, goods exported by Tanzania and Uganda within the community were to have a duty-free status. While selected exports from Kenya to the other member countries would attract a variation of tariffs during a 5 year transitional period. However the key aim was to achieve intra-regional tariff liberalization by gradually phasing out tariffs on the selected list of Kenyan imports by 2009. Thus, this study addresses the impact of the transitional arrangements on

- 10 -
Uganda (a 2 % tariff reduction per year starting from 2005 - 2009) on trade and welfare. In addition to this new preferential tariff framework, Article 37 (3a) provides for the convergence of the EAC protocol with the existing regional trade agreements that member states have agreed upon i.e. COMESA and SADC. This raises questions with regard to the management and interpretation of the treaty and most importantly the difficulty in ascertaining and implementing the rules of origin.
4. ESTIMATION OF TRADE EFFECTS AFTER TARIFF LIBERALISATION WITHIN THE EAC CU ON UGANDA
This paper uses a partial equilibrium approach to estimate the effects of the transitional arrangements on Uganda in the CU protocol. The computable general equilibrium (CGE) models like the GTAP lack data disaggregation at a country level and lists African countries under composite blocs such as “rest of Africa” or “rest of sub-Saharan Africa”. Given that the GTAP region coverage includes Uganda and Tanzania but not Kenya, the general equilibrium models cannot be employed to analyse trade effects of the EAC (Lang, 2006). The literature shows that the partial equilibrium model, mainly the World Integrated Trade Solution (WITS-SMART) model6, has been extensively and successfully used to quantify the static effects of various RIA’s and market liberalisation policies in Africa (DeRosa, Obwona & Roningen, 2002; Busse & Shams, 2005; Stahl, 2005). This paper also employs the WITS-SMART model to quantify trade creation, trade diversion as well as the welfare and revenue effects within the EAC CU.
A. Description of the model
The following are the main assumptions of the model:
a) Export supply elasticities are assumed to be infinite since Uganda is a small country and given its burgeoning trade deficit with Kenya the Armington assumption7 on the substitutability between suppliers applies.
b) The import demand elasticities for Uganda are taken at the HS-6 digit level from the World Bank survey conducted by Kee, Nicita & Olarreaga (2004, 2005).8 The rationale for updating the import demand elasticities in the WITS-SMART model is that these were originally based on the calculations by Stern et al. (1976) and they no longer reflect the present economic and trade conditions.
c) The import substitution elasticity is assumed at 1.5. In the previous studies, Hoekman et al. (2001) assume that products are perfect substitutes and the elasticity parameters are, therefore, smaller in SMART. However, a more recent development of the SMART model is the GSIM variant that places the import
6 The WITS/SMART model uses the COMTRADE, TRAINS, IDB and CTS databases and provides
integrated analytical tools to simulate tariff reductions. 7 Armington elasticities are based on the differentiation of products with respect to their origin and the
imperfect substitution in demand between imports and the domestic supply (Armington, 1969). 8 This is a modification of the GDP function approach that was employed to estimate demand
elasticities (Kohli, 1991).

- 11 -
substitution elasticity at 5 (Francois & Reinhardt, 1997; Francois & Hall, 2003). For this analysis we have assumed the import substitution elasticity at 1.5 which implies that similar products from different countries are imperfect substitutes.
The model measures trade creation effect as follows:
)/(1(*)1/((**1 βηη −+Δ= ijkijkijkijk ttMTC (1)
TCijk – Trade creation on commodity i imported from country k into country j
Mijk – Imports of commodity i to country j from exporting country k
η – Import elasticity of demand in the importing country
tijk - Tariff
β – Export supply elasticity
Equation (2) presents the trade diversion effect; this is the change in Kenyan duty paid prices relative to other prices from the RoW sources after the implementation of the CU protocol with Kenya. The extent of trade diversion depends on the elasticity of substitution and is estimated with:
λ
λ
*)1))1()1(((
*)1))1()1(
((*
0
1111
0
111
−++
++
−++
=
ttMMM
tt
MMTD
rowrowke
rowke
ijk (2)
TDijk – Trade diversion on commodity i imported from country k into country j
Mke – Imports from Kenya
Mrow – Imports from the Rest of the world
tijk - Tariff ( t1 & t0 refer to post and pre integration tariffs)
λ – Substitution elasticity
The net trade effect (TE) is a summation of the total trade creation and trade diversion and represented as:
TDTCTE += (3)
The net revenue effect (RE), which is the total differential of revenue with respect to the import price and the volume of imports after the tariff change, is:
- 12 -
)/()1((**))1/((/ ηββη −++Δ=Δ ijkijkikjikj ttRR (4)
Rijk - the revenue effect of the tariff change
η – Import elasticity of demand in the importing country
tijk - Tariff
β – Export supply elasticity
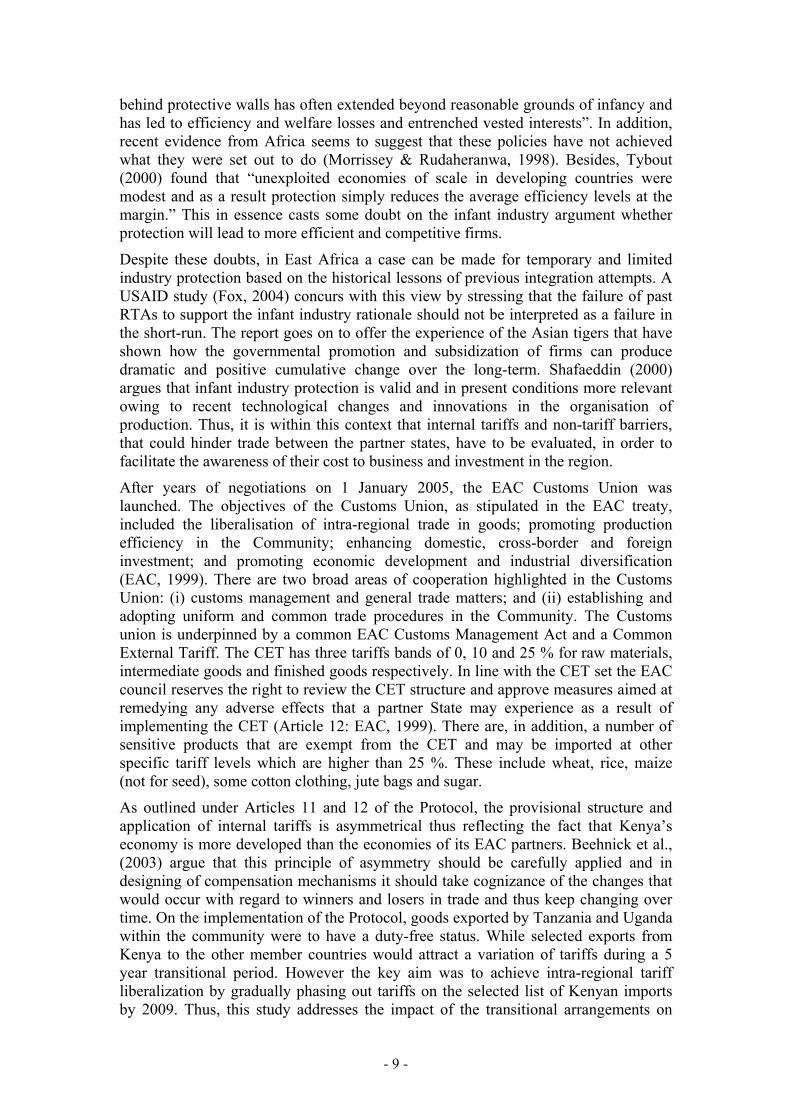
The welfare effect, which is a summation of consumers and producers’ surplus (equation 5), presents only the net welfare effect9 of the tariff reduction in Uganda:
)*(5.0 ijkijkijk MtW ΔΔ= (5)
Mijk – Imports of commodity i to country j from exporting country k
tijk - Tariff
Detailed equations and the derivations on trade creation, trade diversion, welfare and the revenue effect are provided in Annex I.
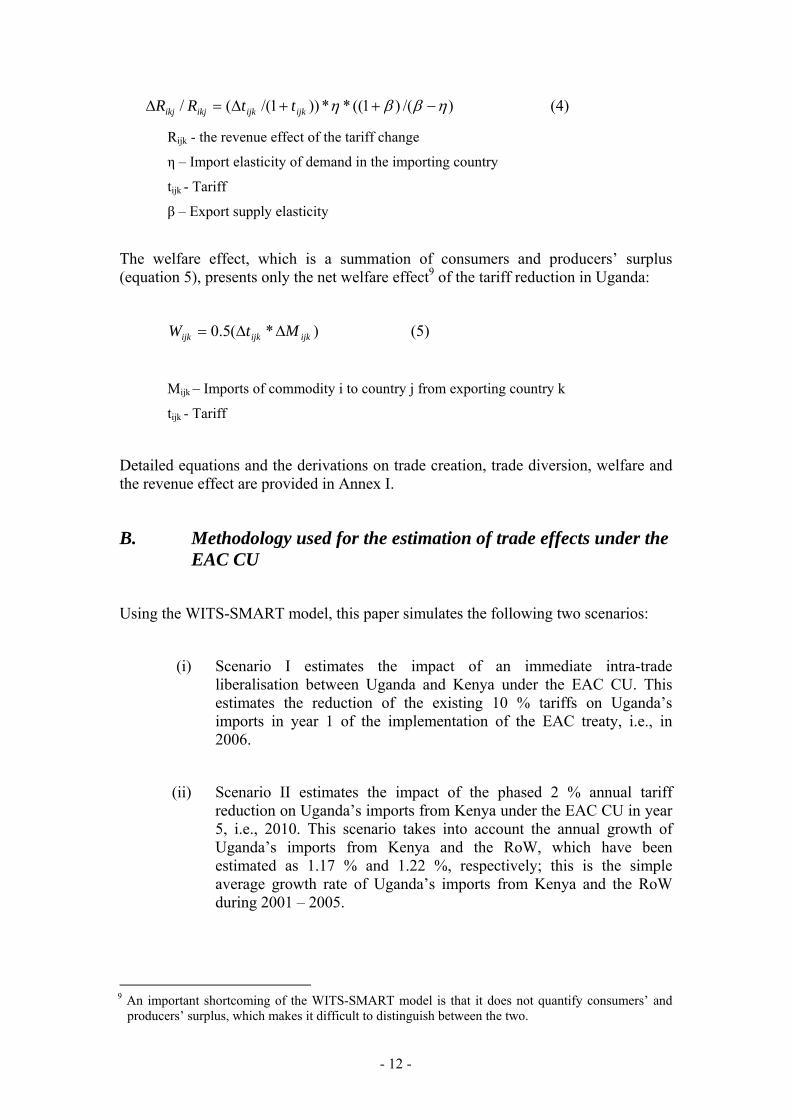
B. Methodology used for the estimation of trade effects under the EAC CU
Using the WITS-SMART model, this paper simulates the following two scenarios:
(i) Scenario I estimates the impact of an immediate intra-trade liberalisation between Uganda and Kenya under the EAC CU. This estimates the reduction of the existing 10 % tariffs on Uganda’s imports in year 1 of the implementation of the EAC treaty, i.e., in 2006.
(ii) Scenario II estimates the impact of the phased 2 % annual tariff reduction on Uganda’s imports from Kenya under the EAC CU in year 5, i.e., 2010. This scenario takes into account the annual growth of Uganda’s imports from Kenya and the RoW, which have been estimated as 1.17 % and 1.22 %, respectively; this is the simple average growth rate of Uganda’s imports from Kenya and the RoW during 2001 – 2005.
9 An important shortcoming of the WITS-SMART model is that it does not quantify consumers’ and
producers’ surplus, which makes it difficult to distinguish between the two.
- 13 -
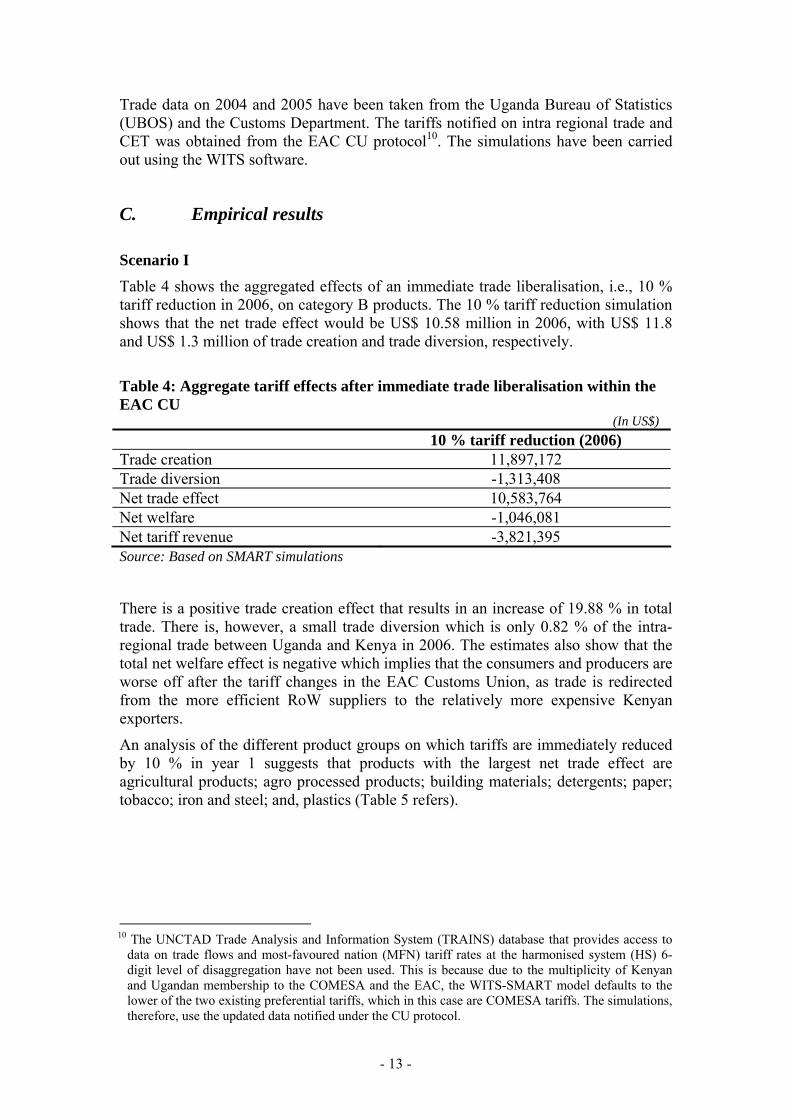
Trade data on 2004 and 2005 have been taken from the Uganda Bureau of Statistics (UBOS) and the Customs Department. The tariffs notified on intra regional trade and CET was obtained from the EAC CU protocol10. The simulations have been carried out using the WITS software.
C. Empirical results Scenario I
Table 4 shows the aggregated effects of an immediate trade liberalisation, i.e., 10 % tariff reduction in 2006, on category B products. The 10 % tariff reduction simulation shows that the net trade effect would be US$ 10.58 million in 2006, with US$ 11.8 and US$ 1.3 million of trade creation and trade diversion, respectively.
Table 4: Aggregate tariff effects after immediate trade liberalisation within the EAC CU
(In US$) 10 % tariff reduction (2006) Trade creation 11,897,172 Trade diversion -1,313,408 Net trade effect 10,583,764 Net welfare -1,046,081 Net tariff revenue -3,821,395 Source: Based on SMART simulations
There is a positive trade creation effect that results in an increase of 19.88 % in total trade. There is, however, a small trade diversion which is only 0.82 % of the intra-regional trade between Uganda and Kenya in 2006. The estimates also show that the total net welfare effect is negative which implies that the consumers and producers are worse off after the tariff changes in the EAC Customs Union, as trade is redirected from the more efficient RoW suppliers to the relatively more expensive Kenyan exporters.
An analysis of the different product groups on which tariffs are immediately reduced by 10 % in year 1 suggests that products with the largest net trade effect are agricultural products; agro processed products; building materials; detergents; paper; tobacco; iron and steel; and, plastics (Table 5 refers).
10 The UNCTAD Trade Analysis and Information System (TRAINS) database that provides access to
data on trade flows and most-favoured nation (MFN) tariff rates at the harmonised system (HS) 6-digit level of disaggregation have not been used. This is because due to the multiplicity of Kenyan and Ugandan membership to the COMESA and the EAC, the WITS-SMART model defaults to the lower of the two existing preferential tariffs, which in this case are COMESA tariffs. The simulations, therefore, use the updated data notified under the CU protocol.

- 14 -
Table 5: An overview of the total net trade and welfare effects of an immediate 10% tariff cut in 2006 (In US$)
Scenario I Product groups Trade
creation Trade
diversion Trade effect
Welfare Effect
Agricultural products 1,216,589 - 252,117 964,472 - 170,804 Processed food products 250,134 - 133,819 116,315 - 34,895 Tobacco products 350,142 - 25,279 324,863 5,401 Building materials 7,764,619 - 24,398 7,740,221 - 754,050 Detergent products 862,105 - 270,379 591,726 - 109,223 Plastic products 282,172 - 173,259 108,913 12,546 Wood products 117,208 - 37,452 79,756 4,053 Paper products 348,914 - 22,558 326,357 - 47,009 Textile products 56,806 - 41,811 14,995 21,001 Textile-manufactured products 44,944 - 40,278 4,666 - 2,938 Iron and Steel products 506,961 - 206,190 300,772 - 25,800 Other manufactured products 96,577 - 85,869 10,708 20,743 Total 11,897,172 - 1,313,408 10,583,764 - 1,046,081 Source: Based on SMART simulations
The highest net trade effect is in building materials, agricultural and agro-processed products as well as detergents. Paper, tobacco and iron and steel products follow. There are is an overall net negative welfare effect which suggests that consumers and producers lose under the EAC CU; the magnitude of which cannot be separately identified with the WITS-SMART model. Welfare losses suggest the presence of supply side rigidities, infrastructural problems, non-tariff barriers (NTBs), which have the potential to impede trade, that increase the landed and final price for the producers and consumers, respectively. This is discussed later in this section.
Scenario II Table 6 shows the aggregated effects of the phased trade liberalisation, i.e., reducing 2 % tariffs annually, from 10 % tariffs in 2005 to 0 % in 2010. The simulation results indicate that the 2 % reduction by Uganda in year 1, i.e., 2006 (on the basis of the average import growth rate of 1.17 % and 1.22 % during 2001-2005) will have a positive net trade effect of US$ 2.53 million with trade creation estimated at US$ 2.84 million and trade diversion at US$ 0.303 million in 2006. In terms of the total percentage, this is less than 7 % of the imports from Kenya while the value of total trade diverted as a percentage of the RoW imports is 0.18 %.

- 15 -
Table 6: Aggregate tariff effects of a phased trade liberalisation within the EAC CU over 2005 - 2010
(In US$) Year Trade
creation Trade
diversion
Trade effect
Welfare Effect
Revenue Effect
2005 2,379,434 - 250,200 2,129,235 - 209,216 - 1,158,451 2006 2,835,493 - 303,412 2,532,080 - 98,468 - 1,355,388 2007 3,380,121 - 368,014 3,012,107 - 115,208 - 1,585,804 2008 4,030,795 - 446,463 3,584,331 - 134,793 - 1,855,391 2009 4,808,501 - 541,754 4,266,747 - 157,708 - 2,170,807
Estimated in 2010
17,434,343 - 1,909,843 15,524,501 - 715,394 - 8,125,842
Source: Based on SMART simulations
Similarly, full tariff liberalisation in year 5, i.e., 2010 shows that the net trade effect would be US$ 15.52 million, with US$ 17.43 and US$ 1.91 million trade creation and trade diversion, respectively. A positive trade creation effect suggests that inter-regional trade has grown under the EAC since imports from Kenya are now cheaper after the imposition of the CET on trade with the RoW which suggests that tariff reduction between the member countries will lead to trade creation within the EAC CU. The total trade diversion is, however, less than 10 % of the total trade created which questions the rationale for the pessimism expressed by the EAC treaty negotiators. There is a negative total net welfare effect; this implies that the consumers and producers are worse off in the EAC Customs Union, as a result of trade being redirected from the RoW suppliers to the more expensive Kenyan producers. One of the main factors that result in high prices is the presence of non-tariff barriers (NTBs). The main underlying explanation to welfare losses is the existing cost disadvantage of the Ugandan producers which is aggravated by the existing NTBs. Some of the main NTBs that are faced by the importers are inadequate information on the customs formalities like the inability of the exporters to provide the relevant customs documentation under the rules of origin requirement specified under the CU protocol; lack of trained staff to certify products at the point of entry; corrupt bureaucracy; underdeveloped telecommunications; energy shortages and restrictions; high tolls; and so on. Yet other important NTBs are the existing governmental regulations, as for instance the Kenyan Revenue Authority’s (KRA) regulation that all products being transported to Uganda have to travel in escorted convoys from Mombasa to the Malaba border. Thirdly, supply side rigidities and the existing infrastructural bottlenecks lead to high transport costs that in turn inflate the domestic prices in Uganda. These factors increase the overall costs for the importers and are reflected through trade diversion. The modalities for reducing the impact of the NTBs are discussed in section 5.
There is, however, negative total customs revenue effect; its total magnitude is US$ 8.12 million. But this is marginal, given that it consists of a small share of the total Ugandan trade. The main reason for revenue losses is that Uganda is a member of COMESA, IGAD and the AU, and since the preferential tariffs under each of these regional agreements are different, the importers are free to choose to import products

- 16 -
under any regime. As a result, the Ugandan importers mostly declare their imports under the COMESA because the notified COMESA tariffs are lower than the EAC. This leads to customs fraud and revenue losses. In the long term, the revenue losses can be compensated by lowering tariffs under the different tariff regimes together with an eventual harmonisation of the customs procedures across the various RIAs. This will also address the problem of informal trade, which is an important drawback of the present regime leading to revenue losses for the Ugandan government.
Table 7 disaggregates the simulation results of a phased tariff reduction on a product group basis. Products with the largest net trade effect are agricultural products; agro processed products; building materials; detergents; paper; tobacco; iron and steel; and, plastics. The tariff reduction simulations on a product category basis show that the highest net trade effect is in building materials (73.1 %) followed by agricultural products (9.1 %) and detergents (5.6 %). These product groups, therefore, comprise 87.8 % of the total net trade effect of all B product categories imported by Uganda under the EAC protocol from Kenya. The welfare and revenue losses are also the highest for these product groups.
Table 7: An overview of the total net trade and welfare effects of the phased tariff cuts (2005 – 2009)
(In US$)
Scenario II
Product groups Trade
creation Trade
diversion Trade effect
Welfare effect
Revenue effect
Agricultural products 1782813 -367912 1414901 -121148 - 1396435 Manufactured food Products 366551 -194383 172168 -23678 - 268077 Tobacco products 513104 -36608 476496 -6067 - 114737 Building materials 11378422 -35183 11343239 -411473 - 4184511 Detergent products 1263345 -391890 871455 -78192 - 904558 Plastic products 413501 -251470 162031 -21743 - 389325 Wood products 171759 -54322 117437 -5295 - 98011 Paper products 511306 -32663 478643 -29976 - 330280 Textiles sector 83245 -61100 22145 1030 - 50887 Textile manufactured products 65861 -58675 7187 -4684 - 65752 Iron and steel sector 742911 -300492 442419 -33635 - 457117 Other manufactured products 141526 -125145 16380 -4213 - 134229 Total for all sectors 17,434,343 -1,909,843 15,524,501 -715,394 - 8,125,842 Source: Based on SMART simulations
The cement industry shows the largest net trade effect under full tariff liberalisation scenario in 2010. The main factors that explain massive trade creation effect in cement under the EAC are firstly, the large disparity between the current CET rate (55 %) on cement and the preferential tariff (10 %) levied on imports from Kenya under the CU Protocol. Second, Uganda has been historically dependent on Kenya for its cement imports. The current boom in the Ugandan building industry has led to an
- 17 -
increased demand11 of building materials, in particular cement. Given that, there are high volumes of trade under the CU (at 8 %), there are obvious welfare losses since cement imports become costly under the CU.
Agricultural and agro-processed products, mainly milk and dairy products, broken rice, vegetable fats and palm oil are the main products affected by the CU. The simulation results show large trade creation and trade effects. The main explanation for this is that in the pre-EAC period, nearly 65 % of the total vegetable fats and palm oils were imported from Indonesia and Malaysia at the MFN tariff rate (15 %). At present, most vegetable oils are imported from Kenya under the preferential tariff (8 %) given that the existing CET is 17 percentage points higher (25 %). An increase in imports of agricultural products from Kenya, of which it is not the main producer, hints at the possibility of indirect trade though this cannot be substantiated due to lack of re-export figures.
Another product group with an overall net positive trade effect but with the largest trade diversion are detergents. At present, Uganda imports detergents from Kenya. Recently, the Ugandan government has taken initiatives to foster growth of the local industries with the objective to make it competitive in the long term; one such policy decision has been to list detergents under Category B products. The analysis shows that before the formation of the EAC CU, detergents were imported under the COMESA rate, which was 6 %, compared to the MFN rate of 15 %. Since the EAC CU allows preferential access to Kenyan products at 8 % in 2005 (which will be progressively reduced to zero tariffs in 2010), this leads to trade diversion under the full trade liberalisation scenario. The overall welfare effect is also negative given that all the demand is being met through imports.
Similarly, paper and its products have a positive trade effect; trade diversion under the EAC is small and consists of only 0.002 % of the total trade in paper during 2006. Uganda has no paper mills and over 90 % of inputs of the paper industry are imported from Kenya. Given that the imports from Kenya enjoy the benefit of lower preferential tariffs under the EAC (compared to the 25 % CET imposed on paper), the simulations reveal a positive trade effect. There are, however, welfare losses though small because the pre-EAC MFN tariffs on paper and its products were 7 % (compared to the 8 % preferential tariffs under the EAC CU), as a result the Ugandan consumers pay more under the EAC CU.
The tariff reduction simulations for tobacco show large positive net trade but negative welfare effect. Uganda is heavily reliant on Kenya for the supply of cigarettes to its domestic market as a result, despite the reduction in tariffs under the CU there is negative welfare because trade is diverted from the cheaper RoW suppliers. The underlying reason for trade diversion is high notified CET tariffs (25 %) compared to the 8 % tariff notified under the CU. In addition, the excise duties on cigarettes in Uganda is very high; the study by Obwona et al. (2005) suggests that this has led to smuggling of the cigarettes from Kenya, which is another factor that has magnified the extent of the total welfare losses under the EAC CU.
The imports of iron and steel, mainly tools under the EAC also shows positive trade effects, the magnitude of trade diversion is however nearly 25 - 30 % of the total trade created, under the tariff liberalisation simulation scenario. The explanation for
11 Against the annual demand between 600,000 – 700,000 metric tons the annual domestic production
of cement was 350,000 tonnes in 2005, this gap was filled by imports from Kenya.

- 18 -
massive trade diversion is that since the tariffs notified under the pre-EAC were 7 % (compared to the CET of 25 % under the EAC CU), trade is redirected from the more efficient supply sources to the more expensive Kenyan suppliers. Given that this sector lacks the infrastructure for the production of plates, sheets or rolled iron and steel products, the existing iron and steel sector in Uganda relies heavily on imports of rolled iron and steel products from Kenya which leads to an overall welfare loss within the EAC CU.
The Ugandan plastic industry is also heavily dependant on Kenya since Uganda does not have its petrochemical industry. As a result the simulations suggest an overall positive trade effect but a higher trade diversion under the EAC CU. The tariffs notified under the CET again explain large trade diversion; under the pre-EAC, the notified MFN tariffs were 15 % which has been revised to the CET rate of 25 % for the third countries. Given that under the EAC CU, the imports from Kenya enjoy preferential tariffs at present that will progressively be reduced to zero in 2010; these products are imported by Uganda from the Kenyan suppliers, that are most costly than the other existing suppliers.
A comparative analysis of both the scenarios
The analysis of tariff reductions in Scenario I and II clearly shows that there is a positive net trade effect with small trade diversionary effects for Uganda under the EAC CU. Table 8 compares the two scenarios and shows that an immediate tariff reduction on category B products would not have massively adverse trade diversionary impact from the Ugandan perspective.
Table 8: Comparison between immediate and phased trade liberalisation by Uganda within the EAC CU
(In US$) Immediate tariff reduction Phased tariff reduction Trade creation 11,897,172 17,434,343 Trade diversion -1,313,408 - 1,909,843 Net trade effect 10,583,764 15,524,501 Net welfare losses -1,046,081 - 715,394 Net revenue losses -3,821,395 - 8,125,842 Source: Based on SMART simulations
The simulation results of the phased intra-regional tariff liberalisation between Uganda and Kenya show positive trade effects of US$ 15.52 million in 2010, with trade creation of US$ 17.43 million and diversion of US$ 1.91 million. However, the simulation of an immediate 10 % tariff reduction in 2006 suggests net trade effect of US$ 10.58 million, with US$ 11.8 and US$ 1.3 million trade creation and trade diversion, respectively.
The net welfare effect under an immediate tariff reduction scenario is marginally higher unlike the revenue losses that double from US$ 3.81 million in immediate tariff reduction to US$ 8.13 million under the phased tariff reduction scenarios clearly highlighting the need to harmonise tariffs and customs procedures under the different
- 19 -
trade regimes, to which Uganda is a presently a member. The overall results, therefore, hint that the rationale of the policy makers to opt in for a phased tariff liberalisation on category B products under the EAC CU is highly debateable, given that the overall trade diversion and revenue effects increase over time and that Uganda is better off in a fully liberalised EAC CU.
5. CONCLUSIONS AND THE WAY FORWARD
In light of the findings, it is difficult to justify the fear of large trade imbalances in Uganda after full liberalization of the intra-EAC tariffs which questions the rationale for advocating domestic industry protection by Uganda. At present Uganda has a relatively developed industrial base that cannot be used as a yardstick to compare the level of industrialisation two and a half decades after the collapse of the first EAC. The results of the simulations also do not show adverse trades impact of the EAC CU from the Ugandan perspective. The fears of the policy makers and the regional integration stakeholders (industrialists) that trade liberalisation will negate the benefits of regional integration are therefore, completely unfounded.
The benefits of the RIA can only be reaped by Uganda to the fullest possible extent by addressing the existing factors that negate the benefits from the EAC CU. An important issue that the Ugandan policy makers need to address to benefit from the existing EAC CU in the long term is differential tariffs under the multiple RTAs to which it is a member. At present this lead to import mismanagement and often customs fraud that negates the benefits of preferential access allowed to the member countries’ products. Given the variance between the COMESA and Kenyan preferential tariffs, under the present system the importers often declare goods under the COMESA rules of origin to benefit from lower tariffs. This has significant implications – first, it has an adverse impact on the revenue collection in Uganda; and, second, hampers domestic production and the development of the local industry in Uganda. To maximise the benefits of the EAC membership, policy makers, therefore, need to initiate measures to lower and eventually harmonise tariffs under COMESA and the EAC and also under the different RIA to address the shortcomings of shared jurisdiction between the different regional initiatives since the present responsibility for enforcement is not demarcated precisely.
Another suggestion is that for Uganda to be able to reap the benefits of regional integration efforts, the existing supply side rigidities and infrastructural constraints as well as the NTBs that at present impede the benefits of liberation under the EAC CU need to be addressed. Some of the main examples of supply side constraints that limit the present capacity of the Ugandan industries are the lack of technical knowledge and expertise to design production structures. Besides there are institutional weaknesses that lead to transaction costs and impede the incentive structure for regional development. Some of the main supply side rigidities and institutional weaknesses in Uganda are for instance unreliable business partners, unstable macro-political environment; corrupt bureaucracy; high costs to get access to business development measures like trade finance and limited capacity of the manufacturing plants add to the cost disadvantage of the domestic producers. The infrastructural and energy constraints further restrict the benefits of the RIA. Since Uganda is landlocked the

- 20 -
importers have to incur substantial transport costs which place them at a comparative cost disadvantage in terms of the Kenyan or Tanzanian industries. The East African Business survey in 2005 also highlights these issues; it shows that the inability of exporters to provide the relevant customs documentation under the rules of origin requirement; lack of trained staff to certify products at the points of entry; lack of uniform direct taxation policies in the EAC countries; border delays; lack of adequate infrastructure; poor condition of the roads; high tolls for the use of roadways; underdeveloped telecommunications; and, energy restrictions inflate the prices of products for the Ugandan consumers. Addressing the existing NTBs are a priority since liberalising tariffs without addressing the existence of NTBs will limit the benefits of regional integration.
Additional capacity building measures are also proposed as this will strengthen the competitive environment which will help Uganda overcome the market entry barriers which at present restricts exports to the rest of the world. Initiating measures like training and providing additional information to the producers and importers in Uganda will initiate momentum to removing barriers within the EAC which will allow the domestic industry to redirect resources towards greater regional cooperation. In this context, Busse & Shams (2005) have suggested a transitional fund to finance infrastructure and private industrial projects. Additionally we suggest that this fund can be used to impart training to the customs officials and importers in Uganda through conducting seminars on customs formalities at the national and regional level. These seminars will provide useful information to the customs officials and the importers/producers about the existing rules and regulations. In the long run, such measures will reduce the high administrative costs that, under the present system, are a disincentive. A transitional fund would, therefore, enhance the overall regional competitiveness in the EAC CU and make regional integration in East Africa successful.
To conclude, Uganda will be better off under full and immediate tariff liberalisation in the EAC CU. Tariff liberalisation will have both direct and indirect effects and will manifest itself in a competitive Ugandan economy. The harmonisation of tariffs under the different RIAs to which Uganda is a member complemented with the lifting of barriers, both tariff and non-tariffs, will lower costs and lead to an overall increased welfare. This in turn will improve the overall industrial competitiveness of the Ugandan industries and make the developmental strategy sustainable in the long term.

- 21 -
References
ADB (2000), ‘Economic Cooperation and Regional Integration Policy’, Policy Working Paper February 2000 (Tunis: African Development Bank). Available at: http://esa.un.org/ffd/policydb/PolicyTexts/adb-3.pdf
Armington, P.S. (1969), ‘A Theory of Demand for Products Distinguished by Place of Production’, IMF Staff Papers, 16, 1,159-176.
Aryeetey, E. and A. Oduro (1996), ‘Regional Integration Efforts in Africa: An Overview’, in J. J. Teunissen (ed.), Regionalism and the Global Economy: The Case of Africa (The Hague: FONDAD).
Baldwin, R. E. (1969), ‘The Case against Infant Industry Tariff Protection’, The Journal of Political Economy, 77, 3, 295-305.
Bora, B., P. J. Lloyd, and M. Pangestu (2000), “Industrial Policy and the WTO”, The World Economy, 23, 4, 543-559.
Busse, M. and R. Shams (2005), ‘Trade Effects of the East African Community’, The Estey Center Journal of International Law and Trade Policy, 6, 1, 62 - 83.
DeRosa, D. A., M. Obwona and V. O. Roningen (2002), The New EAC Customs Union: Implications for Ugandan Trade, Industry, Competitiveness, and Economic Welfare, (Kampala: MFPED and USAID).
East African Business Council (2005), ‘A Study on Non-Tariff Barriers and Development of a Business Climate Index in the East Africa Region’, (Arusha: GTZ / Daima Associates).
EAC (2000), The Second EAC Development Strategy 2001-2005, (Arusha: East African Community Secretariat).
EAC (2001), Treaty Establishing the East African Community, (Arusha: East African Community Secretariat).
EAC (2005), ‘East African Community Customs Union: Common External Tariff: Annex 1’, in ‘The EAC Customs Union Protocol’, (Arusha: East African Community Secretariat).
Fox, J. (2004), ‘An Evaluation of Trade Capacity Building Programs:Regional Trade Agreements: A Tool for Development’, PPC Evaluation Working Paper: 5, 1-13, October.
Francois, J. and K. H. Hall (2003), ‘Global Simulation Analysis of Industry-Level Trade Policy’, Technical Paper, Version 3.0: 21 April 2003, mimeo (Washington D.C.: World Bank).
Francois, J. F. and A. K. Reinhardt (1997), ‘Applied Methods for Trade Policy Analysis: An Overview’, in J. F. Francois and A. K. Reinhardt (eds.), Applied Methods for Trade Policy Analysis: A Handbook (Cambridge: Cambridge University Press).
Goldstein, A. and C. Quenan (2002), ‘Regionalism and Development in Latin America: What implications for Sub-Saharan Africa?’, 2nd International Forum
- 22 -
on African Perspectives, (Paris: African Development Bank & OECD Development Centre).
Grubel, H. G. (1966), ‘The Anatomy of Classical and Modern Infant Industry Arguments’, Weltwirtschaftliches Archiv, 97, 325-42, December.
Hazelwood, A. (1975), Economic Integration: The East African Experience. (Nairobi: Heinemann Publishers).
Hoekman, B., F. Ng and M. Olarreaga (2001), ‘Eliminating Excessive Tariffs on Exports of Least Developed Countries’, Policy Research Working Paper 2604 (Washington D.C: World Bank).
Johnson, H. G. (1965), ‘The Theory of Tariff Structure, With Special Reference to World Trade and Development,’ in H. G. Johnson and P. Kenen: Trade and Development (Geneva: Librairie Droz).
Kasekende, L. and N. K. Ng’eno (2000), ‘Regional Integration and Economic Integration in Eastern and Southern Africa’, in A. E. Oyejide, I. Collier, P. (eds.), Regional Integration and Trade Liberalization in Sub-Saharan Africa: Framework, Issues and Methodological Perspectives: Volume 1 (London: Macmillan Press Ltd).
Kee, H. L., A. Nicita and M. Olarreaga (2004), ‘Import Demand Elasticities and Trade Distortions’, World Bank Policy Research, Working Paper Series No 3452.
Kee, H. L., A. Nicita and M. Olarreaga (2005), ‘Estimating Import Demand and Export Supply Elasticities’, Econometric Society 2004 North American Summer Meetings No: 368.
Kemp, M. C. (1960), ‘The Mill-Bastable Infant Industry Dogma’, Journal of Political Economy, 68, 65-67.
Kohli, U. (1991), ‘Technology, Duality and Foreign Trade’, (London: Harvester Whetsheaf).
Krueger, A. O. and B. Tuncer (1982), ‘An Empirical Test of the Infant Industry Argument’, The American Economic Review, 72, 5, 1142-1152.
Kwaku, D. (1995), ‘The African Economic Community: Problems and Prospects’, Africa Today, 42, 4, 1-35.
Lang, R. (2006), ‘A Partial Equilibrium Analysis of the Impact of the ECOWAS-EU Economic Partnership Agreement’, paper presented on Multilateralism, Bilateralism, and Development, 9th GTAP Annual Conference on Global Economic Analysis (Addis Ababa: 14-18 June 2006).
Luzio, E. and S. Greenstein (1995), ‘Measuring the Performance of a Protected Infant Industry: The Case of Brazilian Microcomputers’, The Review of Economics and Statistics, 77, 4, 622-633.
Lyakurwa, W., MacKay, A., N’geno, N., and K.W. Kennes (1997), ‘Regional Integration in Sub-Saharan Africa: A Review of Experiences and Issues’, in A. E. Oyejide and I. Collier (eds.), Regional Integration and Trade Liberalisation in Sub-Saharan Africa: Framework, Issues and Methodological Perspectives: Volume I (London: Macmillan Press Ltd).
- 23 -
Maasdorp, G. (1999), ‘The Establishment of an East African Trade Regime’, final report prepared for the Secretariat of the Commission for East African Co-operation (Arusha: East African Community Secretariat).
Mair, S. (2000), Regionale Integration und Kooperation in Afrika Südlich der Sahara: Fallstudie East African Kooperation (Ebenhausen: Stiftung für Wissenschaft und Politik).
McKay, Milner A, C., Morrissey, W.O. (1998), ‘Study on the Economic Impact of Introducing Reciprocity into the Trade Relations between the EC and EAC Countries’ (CREDIT: University of Nottingham).
Mistry, P.S. (2000), ‘Africa’s Record of Regional Cooperation and Integration,’ African Affairs, 99, 553 – 557.
Morrissey, O. and N. Rudaheranwa (1998), ‘Uganda’s Trade Policy and Export Performance in the 1990s,’ CREDIT Research Paper, 12, 98.
Newlyn, W. (1971), ‘Gains and losses in the East African Common Market’, in Robson, P. (ed.), International Economic Integration (Harmondsworth: Penguin Books Ltd).
Nixon, F. I. (1973), Economic Integration and Industrial Location: An East African Case Study (Nairobi: Longman Publishers).
Obwona, M., F. Wasswa and Nabwaayo, V. (2005), ‘Taxation of the Tobacco Industry in Uganda: The case for excise duty on cigarettes’ EPRC Research series No 44.
Robson, P. (1998), The Economics of International Integration (London: Routledge Press).
Schiff, M. (2000), ‘Multilateral Trade Liberalization, Political Disintegration, and the Choice of Free Trade Areas versus Customs Unions’, Policy Research Working Paper Series No. 2501 (Washington D.C: World Bank).
Shafaeddin, M. (2000), ‘What Did Fredrick List Actually Say’, UNCTAD Discussion Papers, 153, 1-22, December.
Shams, R. (2003), ‘Trade Imbalances and the Political Economy of a Transitional Fund in the EAC’, HWWA Discussion Paper No 242, 1-18 (Hamburg Institute of International Economics).
Stahl, H. M. (2005), ‘Tariff Liberalization Impacts of the EAC Customs Union in Perspective’, TRALAC Working Paper, No. 4, 1-36 (Trade Law Centre for Southern Africa).
Stern, R. M., Francois, J. and B. Schumacher (1976), ‘Price Elasticities in International Trade: An Annotated Bibliography’ (London: Macmillan Press Ltd).
Tybout, J. R. (2000), ‘Manufacturing Firms in Developing Countries: How Well Do They Do, and Why?,’ Journal of Economic Literature, 38, 1, 11-44, March.
Ugandan Bureau of Statistics (2004), 2004 Statistics (Kampala: Uganda Bureau of Statistics).
Ugandan Bureau of Statistics (2005), 2005 Statistics (Kampala: Uganda Bureau of Statistics).
- 24 -
Ugandan Bureau of Statistics (2006), 2006 Statistical Abstract (Kampala: Uganda Bureau of Statistics).
United Nations (2001) ‘Recommendations of the High-level Panel on Financing for Development’, Report commissioned by the Secretary-General of the United Nations. June 22, 2001. At http://www.un.org/reports/financing/full_report.pdf
UNECA (2004), Assessing Regional Integration in Africa (Addis Ababa: United Nations Economic Commission for Africa).
UNECA (2006), Assessing Regional Integration in Africa II: Rationalising Regional Economic Communities (Addis Ababa: United Nations Economic Commission for Africa).
Venebles, A. J. (1999), ‘Integration Agreements: A force for Convergence or Divergence: Proceedings of the World Bank ABCD Conference’, Policy Research Working Paper Series No. 2260.
World Bank (2000), Trade Blocs (Oxford: Oxford University Press).
World Bank (2004), Global Economic Prospects 2005: Trade, Regionalism, and Development. Washington, D.C.
World Bank (2006a), Kenya Country Data Profile: At http://devdata.worldbank.org/external/CPProfile.asp?CCODE=KEN&PTYPE=CP
World Bank (2006b), Tanzania Country Data Profile. At http://devdata.worldbank.org/external/CPProfile.asp?CCODE=TZA&PTYPE=CP
World Bank (2006c), Uganda Country Data Profile: http://devdata.worldbank.org/external/CPProfile.asp?CCODE=UGA&PTYPE=CP
WTO (2005), Quantitative Economics in WTO Dispute Settlement: Thematic Essays, World Trade Report 2005, 171-211, Geneva.
- 25 -
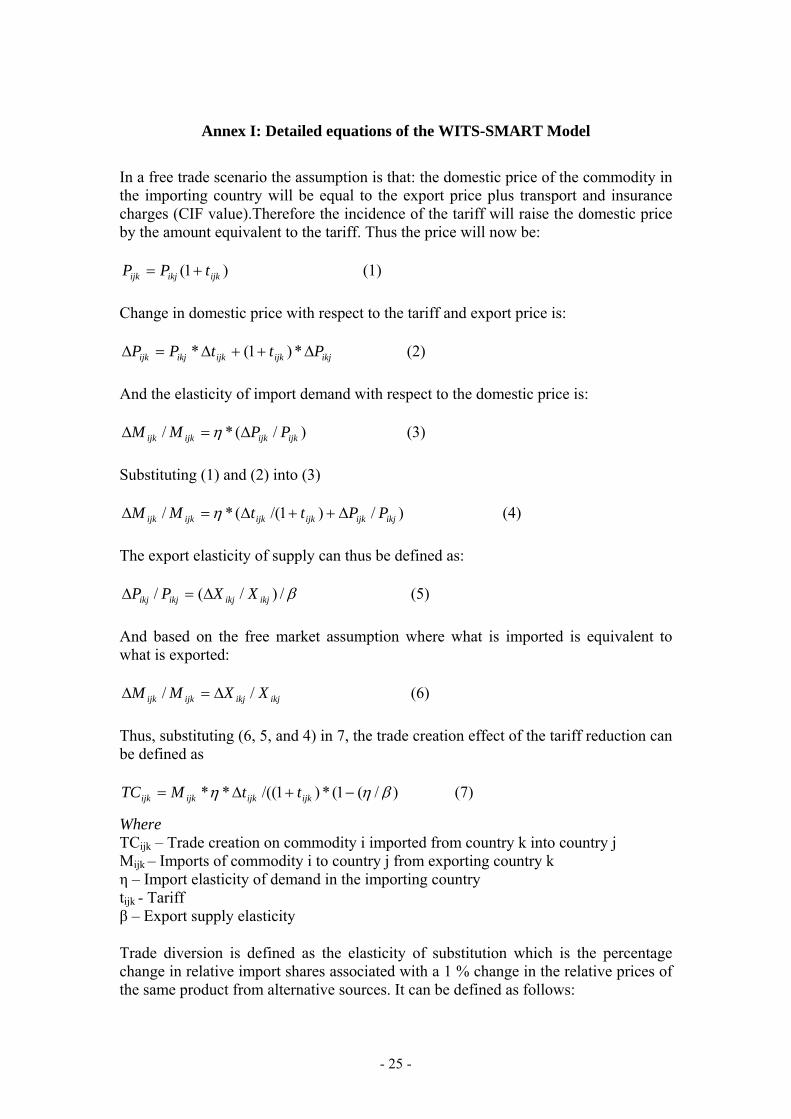
Annex I: Detailed equations of the WITS-SMART Model
In a free trade scenario the assumption is that: the domestic price of the commodity in the importing country will be equal to the export price plus transport and insurance charges (CIF value).Therefore the incidence of the tariff will raise the domestic price by the amount equivalent to the tariff. Thus the price will now be:
)1( ijkikjijk tPP += (1)
Change in domestic price with respect to the tariff and export price is:
ikjijkijkikjijk PttPP Δ++Δ=Δ *)1(* (2)
And the elasticity of import demand with respect to the domestic price is:
)/(*/ ijkijkijkijk PPMM Δ=Δ η (3)
Substituting (1) and (2) into (3)
)/)1/((*/ ikjijkijkijkijkijk PPttMM Δ++Δ=Δ η (4)
The export elasticity of supply can thus be defined as:
β/)/(/ ikjikjikjikj XXPP Δ=Δ (5)
And based on the free market assumption where what is imported is equivalent to what is exported:
ikjikjijkijk XXMM // Δ=Δ (6)
Thus, substituting (6, 5, and 4) in 7, the trade creation effect of the tariff reduction can be defined as
)/(1(*)1/((** βηη −+Δ= ijkijkijkijk ttMTC (7)
Where TCijk – Trade creation on commodity i imported from country k into country j Mijk – Imports of commodity i to country j from exporting country k η – Import elasticity of demand in the importing country tijk - Tariff β – Export supply elasticity
Trade diversion is defined as the elasticity of substitution which is the percentage change in relative import shares associated with a 1 % change in the relative prices of the same product from alternative sources. It can be defined as follows:

- 26 -
)//()/()//()/(
ijKijkijKijk
ijKijkijKijk
PPPPMMMM
Δ
∑∑∑∑Δ=λ (8)
Where k and K denotes imports and prices from one group of foreign suppliers and from another group of foreign suppliers respectively and the summation is across country groups and not product groups. Thus from (8) it is possible to express the percentage change in relative shares in terms of λ, the change in relative prices and the original relative shares of imports from the alternative sources and therefore compute the trade diversion effect (loss or gain).
ijKijk
ijKijkijkijKijk
ijKijk
ijKijkijKijk
ijk
ijkijk
PPPP
MMM
PPPP
MM
MM
TD
/)/(
**
/)/(
****
Δ∑+∑+∑
Δ∑∑
=λ
λ (9)
This can be simplified as follows:
λ
λ
*)1))1()1(((
*)1))1()1(
((*
0
1111
0
111
−++
++
−++
=
ttMMM
tt
MMTD
rowrowke
rowke
ijk (10)
Where TDijk – Trade diversion on commodity i imported from country k into country j Mke – Imports from Kenya Mrow – Imports from the Rest of the world tijk - Tariff ( t1 & t0 refer to post and pre integration tariffs) λ – Substitution elasticity
Under the EAC Treaty, the net trade effect can thus be defined as a summation of total trade creation and diversion and represented by the following equation:
TDTCTE += (11)
Since in our study, the export supply elasticities have been defined, the price effect can be defined by substituting (5) and (6) into
))/((*))1/((/ βηη −+Δ=Δ ijkijkikjikj ttPP (12)
Revenue effect is defined as the percentage increase in revenue, which is equal to the percentage increase in exports plus the percentage increase in prices. However if the export elasticity is infinite then there is no price effect and revenue increases in proportion to the increase in exports. Export revenue earned by k would be
ikjikikj PXR *= (11)
The percentage increase in revenue is:
- 27 -
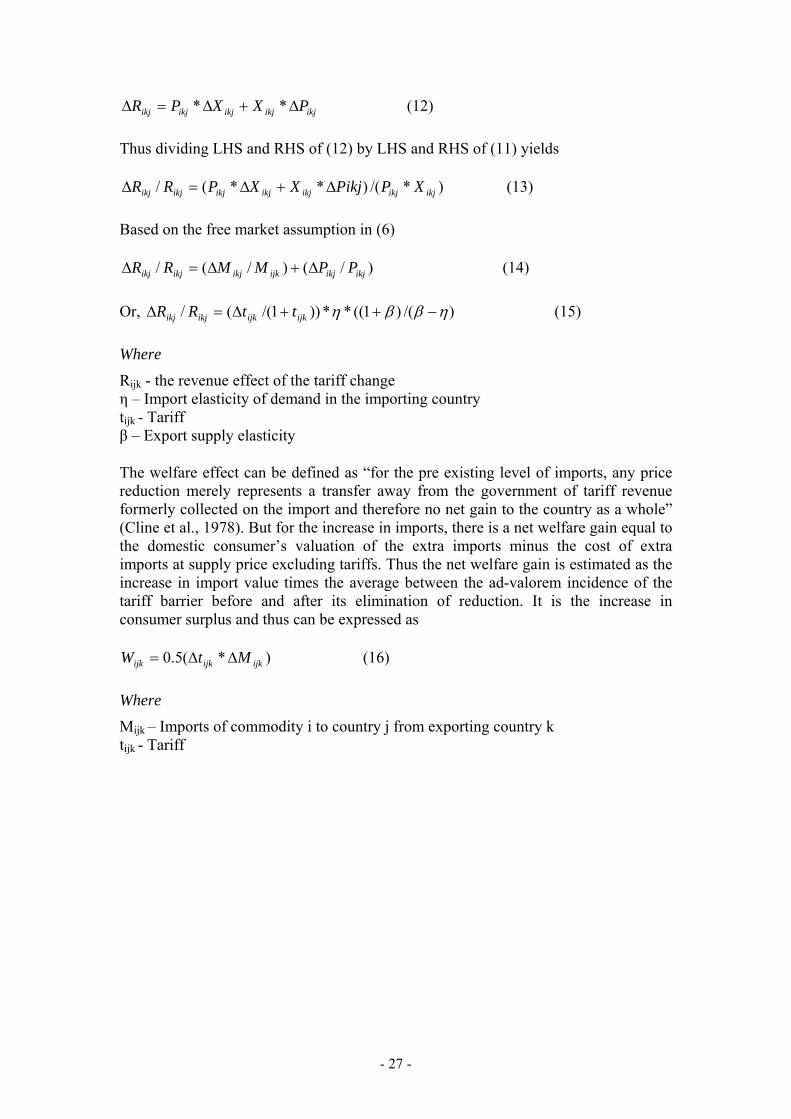
ikjikjikjikjikj PXXPR Δ+Δ=Δ ** (12)
Thus dividing LHS and RHS of (12) by LHS and RHS of (11) yields
)*/()**(/ ikjikjikjikjikjikjikj XPPikjXXPRR Δ+Δ=Δ (13)
Based on the free market assumption in (6)
)/()/(/ ikjikjijkikjikjikj PPMMRR Δ+Δ=Δ (14)
Or, )/()1((**))1/((/ ηββη −++Δ=Δ ijkijkikjikj ttRR (15)
Where
Rijk - the revenue effect of the tariff change η – Import elasticity of demand in the importing country tijk - Tariff β – Export supply elasticity
The welfare effect can be defined as “for the pre existing level of imports, any price reduction merely represents a transfer away from the government of tariff revenue formerly collected on the import and therefore no net gain to the country as a whole” (Cline et al., 1978). But for the increase in imports, there is a net welfare gain equal to the domestic consumer’s valuation of the extra imports minus the cost of extra imports at supply price excluding tariffs. Thus the net welfare gain is estimated as the increase in import value times the average between the ad-valorem incidence of the tariff barrier before and after its elimination of reduction. It is the increase in consumer surplus and thus can be expressed as
)*(5.0 ijkijkijk MtW ΔΔ= (16)
Where Mijk – Imports of commodity i to country j from exporting country k tijk - Tariff