regional inequality in china: trends, scales and...
TRANSCRIPT

WORKING PAPER SERIES
Document Nº 202
Territorial Cohesion for Development Working Group
Regional Inequality in China: Trends, Scales and Mechanisms
Felix Haifeng Liao and Yehua Dennis Wei
September 2016

An earlier version of this document was prepared for presentation at the International Conference on Territorial Inequality and Development (Puebla, Mexico, January 25-27, 2016) hosted by the Territorial Cohesion for Development Program of Rimisp – Latin American Center for Rural Development and sponsored by the International Development Research Centre (IDRC, Canada). Copyright under Creative Commons License Attribution-NonCommercial-ShareAlike 4.0 International (CC BY-NC-SA 4.0)
Citation
Liao, Felix Haifeng and Wei, Yehua Dennis. 2016. Sixty Years of Regional Inequality in China: Trends, Scales and Mechanisms. Working Paper Series N° 202. Rimisp, Santiago, Chile.
Authors: Felix Haifeng Liao, Department of Geography, University of Idaho, Moscow, Idaho, 83844, USA;
Email: [email protected]
Yehua Dennis Wei, Department of Geography, University of Utah, Salt Lake City, 84112, USA;
Email: [email protected]
Rimisp in Latin America www.rimisp.org
Chile: Huelén 10, piso 6, Providencia, Santiago, Región Metropolitana
| Tel. (56-2)2 236 45 57 / Fax (56-2) 2236 45 58
Ecuador: Pasaje El Jardín N-171 y Av. 6 de Diciembre, Edificio Century Plaza II, Piso 3, Oficina 7, Quito
| (593 2) 500 6792
México: Yosemite 13 Colonia Nápoles Delegación Benito Juárez, México, Distrito Federal
| Tel/Fax (52) 55 5096 6592 Colombia: Calle 75 No 8 - 34 piso 2, Bogotá
| Tel. (57-1) 3837523

TABLE OF CONTENTS
ABSTRACT ............................................................................................................................................ 1
1. INTRODUCTION............................................................................................................................ 2
2. REGIONAL INEQUALITY IN CHINA: AN OVERVIEW ...................................................................... 3
3. DATA AND METHODOLOGY ......................................................................................................... 4
4. MULTISCALAR PATTERNS OF REGIONAL INEQUALITY, 1952-2013 ............................................. 5
4.1 Interprovincial inequalities ............................................................................................................... 5
4.2 Interregional and intraregional inequalities ..................................................................................... 7
5. CHANGING STATUSES OF PROVINCES AND MUNICIPALITIES ..................................................... 9
6. UNDERLYING MECHANISMS OF REGIONAL INEQUALITY .......................................................... 14
7. CONCLUDING REMARKS AND FUTURE STUDIES ....................................................................... 16
REFERENCES ....................................................................................................................................... 17
Appendix ............................................................................................................................................ 20

1
Regional Inequality in China: Trends, Scales and Mechanisms
ABSTRACT Regional inequality has long been the subject of intensive academic debates in China, and is an important concern to the Chinese government because it poses serious challenges to national unity and political stability. This paper reviews the copious research on regional inequality in China over the past three decades. We find that previous studies are greatly concerned about the evolution of regional inequality in China and its underlying mechanisms. Recent studies have reached a consensus that the coastal-inland divide has largely been widened during the reform period, but the discussion on the effectiveness of recent development programs for reducing regional inequality (e.g., the “Go West” program) is still inconclusive. The paper further constructs and analyzes a long-term time series for regional inequality from the establishment of the People’s Republic of China (PRC) to the present, and documents changes and level of regional inequality over the past six decades. It reveals multiple peaks of regional inequality during the past sixty years, which coincides with different phases of China’s development strategies, but the trend for regional inequality shows no clear divergent, convergent or inverted-U patterns. Regional inequality is sensitive to geographical scales. While regional inequality between provinces fluctuates more strongly, interregional inequality between the Eastern, Western, and Central regions keeps increasing. However, both interregional and interprovincial inequalities have declined substantially since the global economic crisis in 2008. Econometric analysis further unfolds that regional inequality is influenced by multiple mechanisms, and in particular by China’s triple transitions—decentralization, marketization, and globalization. Overall, the paper holds that uneven regional development in China is embedded in its specific political contexts and rooted in the transitional nature of the reform. It has been increasingly subject to global economic integration and external shocks. The paper calls for a new round of studies of multi-scalar regional inequality and investigations of the dynamics and the various mechanisms that affect regional inequality in China.

2
1. INTRODUCTION
Inequality has long been a major issue troubling the human society, and is a core academic inquiry in social sciences. Interests in spatial dimension of inequality and regional inequality can be traced back to the debates among such renown development specialists as Myrdal and Williamson in the 1950s and the 1960s. As theories of local and regional economic development evolve from neoclassical thoughts, neo-Marxist perspectives to political-economy and institutional approaches, scholars have been debating over inequality and how inequality affects human well-beings (Jones, 2015; Pike, Rodríguez-Pose and Tomaney, 2016). The uneven impact and recovery of the recent global economic crisis has made inequality an even more pressing issue (Stiglitz, 2012), and spatial inequality has received renewed interests (Wei, 2015). Regional inequality has long been a burning issue in China, as it poses serious challenges to national unity and societal stability, conflicting with the socialist ideology. During the first five-year plan, Marx’s socialist ideology and egalitarian thoughts prioritize the importance of national defense and security for regional development (Wei, 2002). Since the launch of reform in the late 1970s, Deng’s regime considered growth as a more important objective (Fan, 1995). In the 1980s, regional development had been experimental and encouraging regions to “get rich first” was a more critical concern. Consequently, the economic reform unleashed new forces that led to spatial restructuring of industries, whereas coastal provinces have benefited more from them (Fan, 2006; Wei and Ma, 1996). The rapid growth of export-oriented manufacturing in the coastal region was accompanied by intensive regional development disparities between coastal and inland regions. Therefore, the Ninth Five Year Plan (FYP) (1996—2000) considers regional inequality and polarization as a most important issue in policy making, which is, for the first time, the central government has given such a high priority to regional inequality (Wei, 2002). Since the late 1990s, the central government promulgated a number of specific spatial policies towards inequality reduction. Examples include the Western China Development (xibu dakaifa) announced in 1999 during the Ninth FYP, and reviving the Northeastern Region (zhenxing dongbei) and the resurgence of the Central Region (or Zhongbu Jueqi, both during the tenth FYP, 2000—2005). In the early 2000s, following the concept of “harmonious society” (Fan, Kanbur and Zhang, 2011), inequality and poverty alleviation have received more attention in China’s Eleventh Five-Year Plan (Fan, 2006). One of the key element in Hu’s “harmonious society” strategy was the battle with inequality and solving the problem of underdevelopment in rural China (Li, Sato and Sicular, 2013). Under Xi’s regime, ambitious international development program called “one belt one road” strategy came to the fore, aiming at collaboration with countries in central Asia (Li, 2016). These programs have been associated with large scale infrastructure development to support development in inland regions (Shi and Huang, 2014). Scholars once again disagree over the efficacy of these policies for reducing regional inequality and debate over whether the massive investment made to these regions have had observable effects (Chen and Groenewold, 2010; Chen, 2010). This paper aims to make a timely contribution for a comprehensive understanding of regional (economic) inequality in China, with a focus on its trends, spatiality and scales, and underlying mechanisms. After a brief summary of a large body of literature on regional inequality in China, the paper constructs and analyzes a long-run time series for regional inequality from the establishment of the People’s Republic of China (PRC) to the present. We document the changes and the level of regional inequality at multiple geographical scales over the past sixty years. Econometric techniques are employed to test the significance of underlying mechanisms following a triple-process conceptualization of economic transition. The last section summarizes major findings and discusses further studies.

3
2. REGIONAL INEQUALITY IN CHINA: AN OVERVIEW Given its size, diversity, history and identity as a transitional and developing country, the case of China provides one of the best laboratories in studies of uneven regional development, and has drawn worldwide attention. The previous literature has covered the oscillation in regional inequality through the journey from central planning to the reform. Scholars have found that before the establishment of the PRC in the 1949, the uneven development in China was already evident, characterized by a more developed coastal region due to its geographical location and legacy of colonialism (Wei, 2007; Yu and Wei, 2003). In the early 1970s, coined as the Lardy-Donnithorne debate, scholars disagreed over the impact of central planning on regional inequality, while there was no consensus regarding the change of regional inequality partly due to data constrains (Wei, 1999). Using newly released data, works in the mid-1990s depicted a more complete landscape of regional inequality in China and extended to data in the 1980s (Wei and Ma, 1996). Along with economists and scholars in China, geographers had significantly contributed to publications in the 1990s. Economic geographers have uncovered the increases of interregional inequalities after the reform, but a noticeable drop of interprovincial inequality in the 1980s (Fan, 1997; Fan, 1995). These publications challenge the popular thought that there was a convergence (the poor has been catching up with the rich, resulting in declining level of regional inequality) process under central planning and divergence (the gap between the rich and the poor is widening) should be prevalent in the reform era (Wei, 2007). It is argued that there is no clear evidence about the convergence or divergence processes or even inverted-U (regional inequality tends to rise in the early stage of economic development and declines over the long run) patterns as suggested by Kuznets (1955) and Williamson (1965). Uneven regional development in China is essentially rooted into thick local institutions and sensitive to the experimental and gradual nature of the reform (Wei and Fan, 2000). Since the late 1990s, scholars have advanced the study of regional inequality by revealing recent developments, down-scaling, and using more vigorous methods (Wei, 2007). First, although convergence or divergence following the neo-classical thoughts are still prevalent (Yao and Zhang, 2001), researchers tend to reach a consensus that the coastal and inland divide has been widened especially during the reform era. In addition, economic geographers’ works emphasize the importance of space and scale in analyzing regional development and inequality, which presents more evidence regarding the complexity of regional inequality (Yu and Wei, 2003; Li and Wei, 2010). Recent literature on regional inequality has also scaled down the focus to spatial inequality under provinces, and more studies apply rigorous GIS spatial analysis methods (Yu and Wei, 2008; Wei and Ye, 2009; Wei, Yu and Chen, 2011; Ye and Wei, 2005; Wei and Kim, 2002; Wei and Fan, 2000; Liao and Wei, 2012). Second, researchers have strived to search for the causes of regional inequality in China. The literature has investigated the links between regional inequality and fiscal decentralization (Song, 2013; Tsui, 2007; Wang, 2010), industrial restructuring (Li and Haynes, 2011), human capital (Fleisher, Li and Zhao, 2010), financial mediation (Chen, Liu and Zhang, 2010), foreign direct investment (Yao, Wei and Liu, 2010), industrial agglomeration (Ke, 2010; Ge, 2009), and infrastructure investments (Yu et al., 2011; Wang and Zhang, 2003). Alternative frameworks are also proposed. As Wei (2002) summarizes, economic transition in China can be hardly explained by neoclassical and equilibrium frameworks, but it is better conceptualized into by a triple-transition process of globalization, decentralization and marketization (Wei, 2002). The notion of multi-mechanisms argues for the articulation of global force, nation-states and local factors in the understanding of uneven regional development in China (Wei, 2007). Such processes have benefited the development of coastal regions and provinces based on the growth of non-state owned enterprises and export oriented manufacturing, which act as structural forces behind the change of regional inequality at different spatial scales (Wei et al., 2011). The third strand of literature addresses the impact of alternative regional development policies on spatial inequality (Chen, 2010; Chen and Groenewold, 2010; Fan et al., 2011). Most studies could not find a strong effect of these development programs on minimizing the gap between the coastal (rich) and the inland (poor) regions, but poverty and inequality persists in the reform era. Some recent studies suggest

4
there have been some positive impacts of the “Go West” program on regional development in Western provinces (Fan and Sun, 2008; Sakamoto and Islam, 2008), while the findings are still inconclusive (Li and Wei, 2010). Notably, driven by the concern about the uneven impact of global economic crisis, there has been a renewed interest in imbalances of economic development in China. The literature has raised the question that whether and how the state policy can play a role in rebalancing the Chinese economy (Yang, 2014; Li and Gibson, 2013). Recent studies mostly done by economists also employ advanced econometric techniques (e.g., the VAR model) (Groenewold, Lee and Chen, 2007; Herrerias and Monfort, 2015) to detect the “structural breaks” of regional inequality (Ho and Li, 2008; Chen, 2010; Chen and Groenewold, 2010). Drawing upon the notion of “policy shocks”, this new literature echoes some pioneering works done in the 1990s, when economic geographers argued for a conceptualization of some mechanisms that are more applicable to the case of China beyond a singular focus on labor or capital in the free market system (Wei and Fan, 2000; Wei, 1999; Fan, 1997).
3. DATA AND METHODOLOGY
This study is mainly based on the 31 provincial level administrative units (hereafter provinces) in China. Previous studies have employed different grouping schemes of the provinces. In our analyses, 31 provinces are grouped into three regions: Western, Central and Eastern (Figure 1). Eastern provinces include Beijing, Tianjin, Hebei, Shanghai, Jiangsu, Zhejiang, Guangdong, Fujian, Shandong, Hainan and Liaoning. The Central region consists of Shanxi, Jilin, Heilongjiang, Anhui, Jiangxi, Henan, Hubei and Hunan. Provinces in the Western region include Guangxi, Sichuan, Guizhou, Yunan, Xizang, Shaanxi, Gansu, Qinghai, Ningxia, Xinjiang and Inner Mongolia.
Figure 1. Regions in China
A comprehensive set of data using statistical yearbooks of China on GDP and hukou (household registration system) population were compiled for the study period of 1952-2013. Recent literature suggest hukou population based GDPPC may overestimate the level of regional inequality (Li and Gibson,

5
2013; Chan and Wang, 2008). While permanent population or resident population (hereafter) represents the real population residing in a city, hukou population is also important since it represents the people living in cities who can fully benefit from services provided by local governments. Most rural migrants have their household registration in the countryside, and they are largely excluded from formal jobs and public services in the cities where they live. For the analysis of regional inequality in the post-reform era, we employ both hukou and resident population data to explore multi-scalar characteristics of regional inequality in China. The second issue involves the GDP data. Constant prices are comparable over time so are more often used in the study of regional inequality and GDP data at the provincial level were converted to the 1978 constant price. To explore regional inequality, several statistical indexes, such as coefficient of variation (CV), the Gini coefficient, and the Theil index, have been widely employed in previous studies. These indexes are different in terms of their properties and sensitivity to outliners. One advantage of the Theil index is that as a type of entropy indices, it can be decomposed into additive terms that quantify the inequality among and within groups (Fan and Sun, 2008). Therefore, we use the Theil index to decompose regional inequality into interregional and intraregional inequalities based on the three groups of provinces. Besides indicators that measure regional inequality, location quotient (LQ), which is a quantitative measure of how concentrated a particular industry, occupation, or demographic groups are in a region as compared to nations’, is also employed to reveal how development trajectories of individual regions and provinces can have an influence on regional inequality. A detailed discussion of the three inequality indexes and the LQ index is provided in the Appendix.
4. MULTISCALAR PATTERNS OF REGIONAL INEQUALITY, 1952-2013
This section aims at documenting changes in regional inequality among provinces, among regions and within regions. Several regression exercises are also carried out to analyze the effects of globalization, marketization and decentralization on uneven development in China over the past six decades.
4.1 Interprovincial inequalities
Interprovincial inequalities, measured by CV, the Theil index and the Gini coefficient, suggest that over the past sixty years, regional inequality at the provincial level has generally exhibited a triple-peak pattern (Figure 2), matching the different phases of China’s economic development. As compared to those based on the Gini coefficient and the Theil index, the values of CV fluctuated more strongly during the whole study period (1952 – 2013). Interprovincial inequality was relatively low and increased during the first five-year plan (1953 – 1957) and the Great Leap Forward (1958 –1960), reaching a peak in 1960. The extent of interprovincial inequality experienced an abrupt decline after 1961, partly owning to the Great Famine (1959 – 61). This crisis led to relatively sluggish statuses of Beijing, Shanghai, and other provincial economies dominated by State Owned Enterprises (SOEs), resulting in declining regional inequality (Figure 2). During the 1960s and the Cultural Revolution (1966 – 1976), regional inequality increased and peaked in the late 1970s. The CV for the year of 1978 is the second highest in the past six decades, which implies that income gaps among China’s provinces actually widened during the Maoist period (Wei and Ma, 1996). The earlier years of economic reforms and rural reforms in the early 1980s benefitted some less developed coastal provinces in China, and regional inequality declined (Figure 2). China’s deeper reform in the early 1990s, triggered by Deng’s South China trip in 1992 and the accession to WTO in 2001 marked changes of interprovincial inequality in the 1990s and the 2000s. Coastal provinces that benefited from marketization and liberalization during this period and regional inequality rose until the mid-2000s (Fujita and Hu, 2001; Hao and Wei, 2010; Ezcurra and Rodríguez-Pose, 2013). This result also echoes recent work on the association between globalization or trade liberalization and the magnitude of regional inequality in low- and middle-income countries (Rodríguez-Pose, 2012). Nevertheless, Figure 2 shows that since the mid-2000s, facilitated by several development programs toward reducing regional disparities, on par with the rise of production cost in coastal provinces, regional inequality at the provincial level has declined (Li
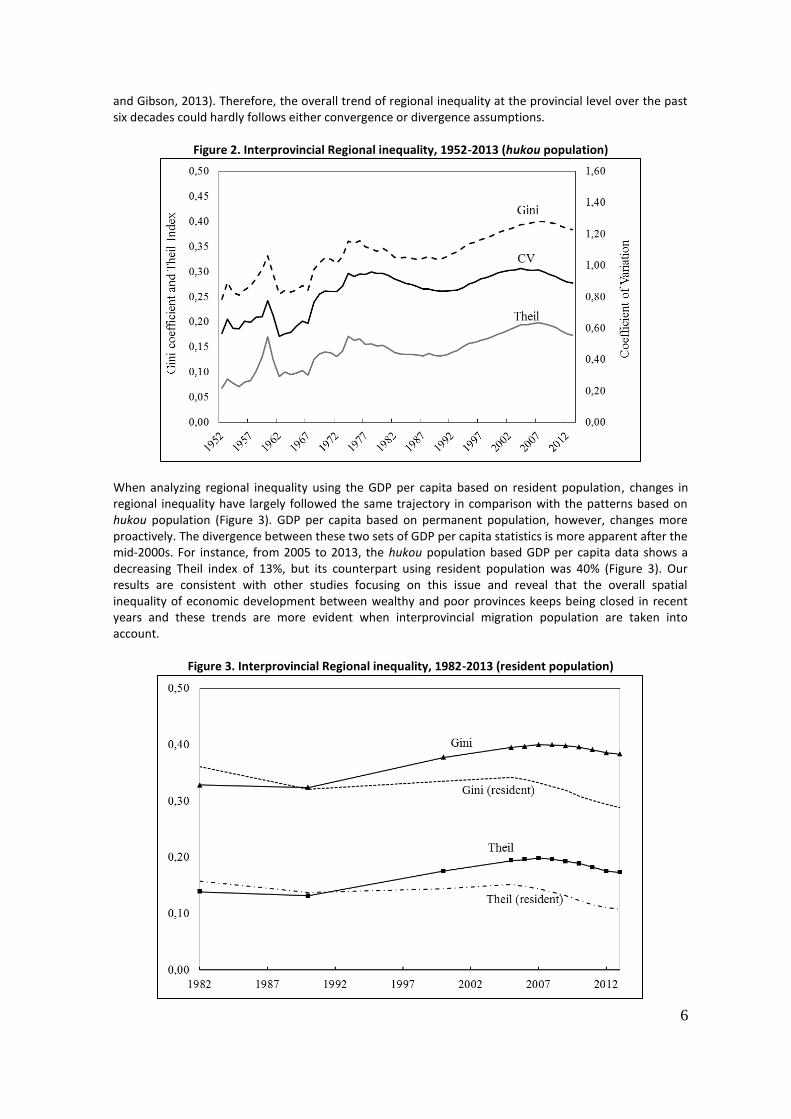
6
and Gibson, 2013). Therefore, the overall trend of regional inequality at the provincial level over the past six decades could hardly follows either convergence or divergence assumptions.
Figure 2. Interprovincial Regional inequality, 1952-2013 (hukou population)
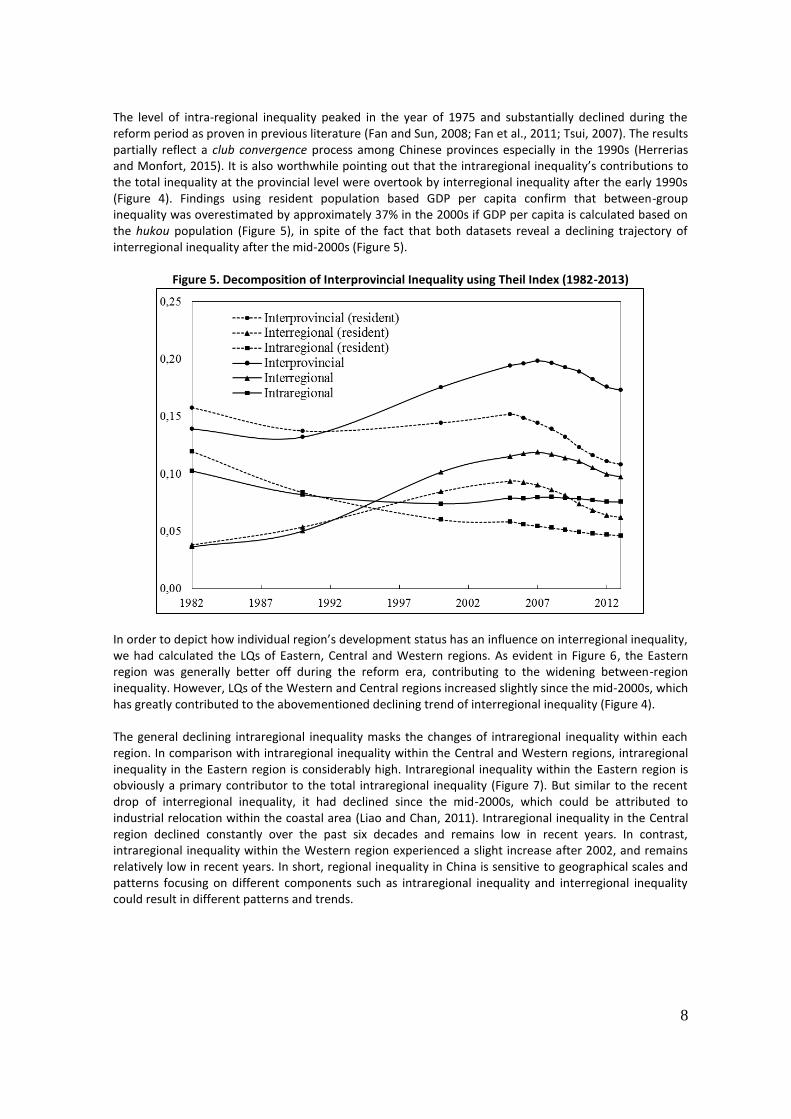
When analyzing regional inequality using the GDP per capita based on resident population, changes in regional inequality have largely followed the same trajectory in comparison with the patterns based on hukou population (Figure 3). GDP per capita based on permanent population, however, changes more proactively. The divergence between these two sets of GDP per capita statistics is more apparent after the mid-2000s. For instance, from 2005 to 2013, the hukou population based GDP per capita data shows a decreasing Theil index of 13%, but its counterpart using resident population was 40% (Figure 3). Our results are consistent with other studies focusing on this issue and reveal that the overall spatial inequality of economic development between wealthy and poor provinces keeps being closed in recent years and these trends are more evident when interprovincial migration population are taken into account.
Figure 3. Interprovincial Regional inequality, 1982-2013 (resident population)

7
4.2 Interregional and intraregional inequalities In addition to interprovincial inequality level, regional inequality between the three macro-regions in China is of particular concern given its significance for regional development policies. In comparison with regional income gaps among provinces, interregional inequality consistently increases over the past sixty years. Values of the Theil index, CV, and the Gini coefficient increased by 798%, 284%, and 276% during the period of 1952—2013 (Table 1). In contrast, interprovincial inequality rose by 253%, 157% and 156% with respect to the values of the Theil index, CV, and the Gini coefficient. Table 1. Interprovincial and interregional inequalities in China, 1952-2013
Year Interprovincial Inequality Interregional Inequality Theil CV GINI Theil CV GINI
1952 0.068 0.566 0.245 0.012 0.162 0.081 1960 0.171 0.775 0.331 0.019 0.199 0.108 1965 0.098 0.612 0.263 0.010 0.142 0.077 1970 0.140 0.837 0.328 0.023 0.222 0.121 1975 0.163 0.929 0.356 0.033 0.265 0.141 1980 0.154 0.949 0.346 0.038 0.282 0.146 1985 0.135 0.879 0.327 0.041 0.295 0.152 1990 0.132 0.837 0.324 0.050 0.326 0.164 1995 0.158 0.880 0.355 0.089 0.438 0.217 2000 0.175 0.951 0.377 0.102 0.469 0.232 2005 0.194 0.970 0.395 0.115 0.501 0.246 2010 0.189 0.928 0.396 0.111 0.490 0.240 2013 0.173 0.887 0.383 0.097 0.458 0.223
Notes: GDP per capita is calculated based on 1978 constant price GDP and hukou population Decomposition analysis using the Theil index quantifies contributions of interregional and intraregional inequalities to the regional inequality at the provincial level. As evident in Figure 4, interprovincial inequality actually fluctuated but interregional inequality tended to increase consistently since 1952, despite a noticeable drop after 2007. Moreover, interregional inequality increased in most of the time during the past six decades (Figure 4), but due to the recent decrease after 2007, interregional inequality in 2013 returned to the same level of 1998. Figure 4 also shows that the level of spatial inequality within regions also fluctuates in the pre-reform era (1952—1978) and generally follows the trajectory of interprovincial inequalities before the reform.
Figure 4. Decomposition of Interprovincial Inequality using Theil Index, 1952-2013
8
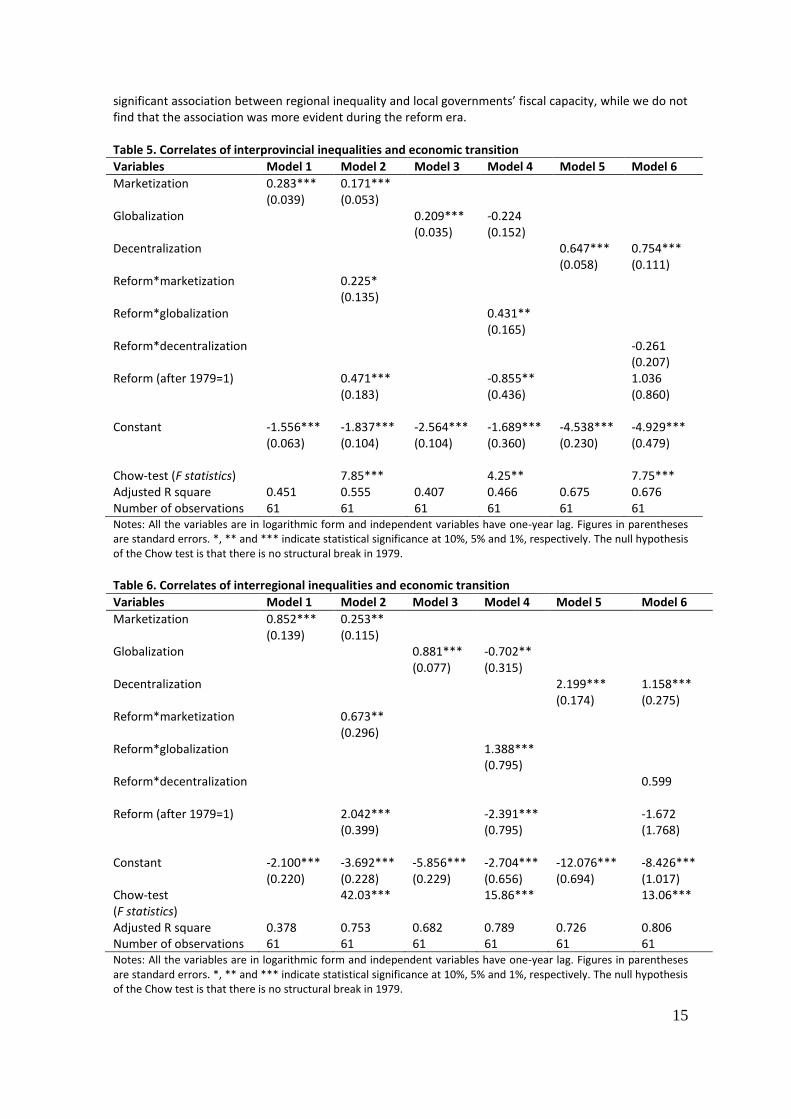
The level of intra-regional inequality peaked in the year of 1975 and substantially declined during the reform period as proven in previous literature (Fan and Sun, 2008; Fan et al., 2011; Tsui, 2007). The results partially reflect a club convergence process among Chinese provinces especially in the 1990s (Herrerias and Monfort, 2015). It is also worthwhile pointing out that the intraregional inequality’s contributions to the total inequality at the provincial level were overtook by interregional inequality after the early 1990s (Figure 4). Findings using resident population based GDP per capita confirm that between-group inequality was overestimated by approximately 37% in the 2000s if GDP per capita is calculated based on the hukou population (Figure 5), in spite of the fact that both datasets reveal a declining trajectory of interregional inequality after the mid-2000s (Figure 5).
Figure 5. Decomposition of Interprovincial Inequality using Theil Index (1982-2013)
In order to depict how individual region’s development status has an influence on interregional inequality, we had calculated the LQs of Eastern, Central and Western regions. As evident in Figure 6, the Eastern region was generally better off during the reform era, contributing to the widening between-region inequality. However, LQs of the Western and Central regions increased slightly since the mid-2000s, which has greatly contributed to the abovementioned declining trend of interregional inequality (Figure 4). The general declining intraregional inequality masks the changes of intraregional inequality within each region. In comparison with intraregional inequality within the Central and Western regions, intraregional inequality in the Eastern region is considerably high. Intraregional inequality within the Eastern region is obviously a primary contributor to the total intraregional inequality (Figure 7). But similar to the recent drop of interregional inequality, it had declined since the mid-2000s, which could be attributed to industrial relocation within the coastal area (Liao and Chan, 2011). Intraregional inequality in the Central region declined constantly over the past six decades and remains low in recent years. In contrast, intraregional inequality within the Western region experienced a slight increase after 2002, and remains relatively low in recent years. In short, regional inequality in China is sensitive to geographical scales and patterns focusing on different components such as intraregional inequality and interregional inequality could result in different patterns and trends.

9
Figure 6. Location quotients of different regions in China
Figure 7. Decomposition of intraregional inequality, 1952-2013
5. CHANGING STATUSES OF PROVINCES AND MUNICIPALITIES Development trajectories of individual provinces have a profound influence on regional inequality in China. In this section, LQs of GDP per capita for specific provincial units were calculated to elaborate how individual provinces could have an impact on regional inequality (Table 2). These provinces are selected based on their geographical location and significance for regional inequality as discussed in the previous literature (Wei and Ma, 1996; Yu and Wei, 2003). Table 2. Representative Provincial Level Units
Region Centrally-Administered Municipalities
Provinces
Eastern Beijing, Shanghai Jiangsu, Guangdong Central Heilongjiang, Henan, Hunan, Jiangxi Western Sichuan, Guizhou, Gansu, Inner Mongolia

10
In the pre-reform era (1952—1978), economic statuses of municipalities such as Beijing and Shanghai had been superior to other coastal provinces (Figure 8), and the LQs of Eastern provinces are also much higher than those in the Western and Central regions (Figure 9 and Figure 10). This actually contributes to the increases of interregional inequalities (Figure 2). Within the Eastern region, partly due to the central planning system and interests of national defense during the pre-reform period, LQs of Jiangsu and Guangdong provinces were approximately 1 between 1952 and the late 1970s (Figure 8). In contrast, LQs of specific inland provinces such as Hunan in the Central region and Gansu in the Western region had maintained their positions (Figure 9 and Figure 10). However, a number of provinces that are located at the border, such as Heilongjiang and Inner Mongolia, fell in the pre-reform period (Figure 9 and Figure 10). The evident spatial variations of regional development trajectories resulted in the significant high level of intraregional spatial inequalities of economic development in the pre-reform period (Figure 4). In the 1980s and 1990s, Jiangsu and Guangdong provinces within the Eastern region had relatively higher growth rates in comparison with the two most developed municipalities, i.e., Shanghai and Beijing. The rise of these coastal provinces contributed to declining intraregional inequality and interprovincial inequality in the 1980s and the 1990s (Figure 4). As evident in Figure 9 and Figure 10, LQs of some provinces in the Eastern and Western regions declined substantially in the reform era. For example, the LQ of Gansu province dropped from 0.91 in 1952 to 0.63 in 2013. Heilongjiang in the Central region, which used to be an important industrial province, suffered from the historic burden of State Owned Enterprises (SOE), and its LQ descended from 2.28 in the 1952 to 0.88 in 2013 (Figure 9). However, individual provinces with abundance of natural resources have gained particular momentum due to the increased demand for energy from the booming manufacturing industries in the coastal region (Figure 10). A typical case would be Inner Mongolia, whose LQ rose from 0.84 in 2002 to 1.37 in 2013.
Figure 8. LQ changes of selected provinces in the Eastern region

11
Figure 9. LQ changes in selected provinces in the Central region
Figure 10. LQ changes in selected provinces in the Western China
To shed further light on regional development in China, we also calculated growth rates of provincial GDP per capita (Table 3) and mapped the provincial GDP per capita in specific cross-sections (Figures 11—14). Four important sub-periods were selected: (1) 1952—1978, which was the pre-reform era; (2) 1980—1990 when the economic reform was implemented in specific regions and provinces; (3) 1990—2000, which marked the deepening of market reform; and (4) 2000—2013, when economy grew fast after China’s accession into WTO.

12
Table 3. Level and Growth of Per Capita GDP in Chinese provinces
level (1978 constant yuan) Annual growth rate (%)
Provinces 1952 1978 1990 2000 2013 1952-1978
1978-1990
1990-2000
2000-2013
Eastern Region 154 485 1,262 4,031 15,790 4.52 8.29 12.31 11.07 Beijing 140 1,249 3,000 7,953 25,161 8.79 7.58 10.24 9.26 Tianjin 304 1,141 2,315 6,525 35,893 5.22 6.07 10.92 14.01 Hebei 129 362 794 2,431 8,439 4.04 6.77 11.83 10.05 Liaoning 178 675 1,495 3,479 14,639 5.25 6.85 8.81 11.69 Shanghai 537 2,484 5,035 15,614 53,005 6.07 6.06 11.98 9.86 Jiangsu 180 427 1,311 4,605 19,764 3.39 9.80 13.38 11.86 Zhejiang 133 330 1,105 4,197 16,122 3.56 10.60 14.28 10.91 Fujian 116 271 817 2,961 11,910 3.33 9.62 13.74 11.30 Shandong 100 315 837 2,810 12,010 4.50 8.49 12.88 11.82 Guangdong 171 367 1,256 4,308 15,830 2.99 10.80 13.12 10.53 Hainan - 310 795 2,211 7,368 - 8.15 10.77 9.70 Central Region 149 311 718 1,758 6,821 2.86 7.23 9.37 10.99 Shanxi 130 363 799 1,869 7,061 4.03 6.79 8.88 10.76 Jilin 181 382 938 2,239 10,067 2.92 7.78 9.09 12.26 Heilongjiang 319 559 1,103 2,293 8,729 2.18 5.83 7.59 10.83 Anhui 157 242 586 1,528 6,016 1.68 7.64 10.07 11.12 Jiangxi 175 273 651 1,508 5,726 1.73 7.49 8.77 10.81 Henan 122 231 613 1,641 5,982 2.49 8.49 10.35 10.46 Hubei 138 330 829 2,108 8,806 3.42 7.98 9.78 11.63 Hunan 115 285 587 1,439 5,577 3.54 6.22 9.38 10.98 Western Region 106 262 621 1,494 6,151 3.56 7.44 9.18 11.50 Inner Mongolia 179 318 827 2,132 13,600 2.23 8.28 9.94 15.32 Guangxi 74 223 408 1,113 4,280 4.34 5.17 10.54 10.92 Chongqing 113 255 609 1,667 7,620 3.17 7.51 10.60 12.40 Sichuan 106 261 630 1,569 6,524 3.53 7.61 9.56 11.58 Guizhou 85 174 415 843 3,033 2.77 7.53 7.34 10.35 Yunnan 88 223 570 1,293 4,458 3.63 8.13 8.53 9.99 Tibet 123 372 745 1,928 6,927 4.35 5.97 9.97 10.34 Shaanxi 96 292 741 1,769 7,681 4.37 8.08 9.09 11.96 Gansu 133 346 749 1,689 6,234 3.76 6.64 8.48 10.57 Qinghai 116 426 759 1,503 5,675 5.12 4.93 7.08 10.76 Ningxia 98 366 805 1,567 5,443 5.21 6.80 6.89 10.05 Xinjiang 190 317 906 1,914 5,622 1.98 9.15 7.77 8.64
Notes: GDP per capita is calculated based on 1978 constant price GDP and hukou population. In 1952, municipalities and some industrial provinces in the northern part of China had higher GDP per capita, followed by coastal provinces in the southeastern region (Figure 11). This pattern remained largely the same in the 1980 when the reform just begun (Figure 12). In the 1980s, average growth rates of Beijing and Tianjing were much lower than coastal provinces. Growth rate of Shanghai was even lower than the national average, which results in declining interprovincial inequality in the 1980s (Figure 4). Since the 1990, economic growth in Shanghai accelerated and growth rates of most coastal provinces were higher than the growth rates of other provinces in the Western and Central regions (Table 3). This contributes to the increase of both interprovincial and interregional inequalities in the 1990s. By 2000, the provinces with the highest GDP per capita were mostly located in the coastal region (Figure 13). The spatial pattern of provincial level GDP per capita in 2013 was similar to that in 2000 and most Western provinces remained the poorest provinces in China (Figure 14). Therefore, the gap between the coastal and interior regions increased consistently in most of the reform period.

13
Figure 11. GDP per capita in 1952 Figure 12. GDP per capita in 1980
Figure 13. GDP per capita in 2000 Figure 14. GDP per capita in 2013
Nevertheless, it is worth highlighting that in the 2000s, provinces in the Western region had grew faster than the provinces in the Eastern region (Table 3). Average growth rate of per capita GDP was 11.50, as compared to the number of 11.07 in the Eastern provinces. The highest growth rate of GDP per capita occurred in such Western provinces as Inner Mongolia where natural resources such as coal and oil are abundant (Table 3 and Figure 10). As the only centrally administrated municipality in the Western region, Chongqing has exhibited a catching-up trajectory in recent years, with an annual growth rate of 12.40%. Although recent growth rates of some Western provinces had been apparently high, we hold that the noticeable decline of interregional and interprovincial inequalities after 2005 may be caused by both development policies and changing status of the coastal region. On the other hand, under global economic crisis, the central government did invest heavily in infrastructure development and those inland areas benefited from these giant infrastructure projects such as the construction of high-speed railway (Shi and Huang, 2014). Meanwhile, the 2008 global economic crisis has negatively affected the development status of coastal provinces where exports played a key role in their economic growth. In short, recent declining regional inequality should be more carefully examined when longer-time data series become available. The efforts made by the Chinese government may only have a certain impact on regional development in specific localities such as Chongqing in the Western and Central regions, but the coastal areas have still been far ahead of the inland regions as a whole in terms of economic development (Li and Wei, 2010).

14
6. UNDERLYING MECHANISMS OF REGIONAL INEQUALITY As discussed in the second section, the evolution of regional inequalities in China especially since the implementation of reform has been driven by economic transition and market reform (Wei, 2002). Recent studies found that the three policy variables including globalization, marketization and decentralization are also fundamental causes of inland-costal disparities or regional inequality across both pre-reform and post-reform periods (Kanbur and Zhang, 2005; Hao and Wei, 2010). Two regression exercises are carried out using the up-to-date time series data in the period of 1952—2013. Table 4 presents the major independent variables based on the triple-process transition framework mentioned above. Decentralization is measured by the ratio of local government expenditure to the total government expenditure. The effect of globalization is represented by the ratio of total trade volume to total GDP in each year. We also employ the share of total employment from non-stated owned enterprises to capture the process of marketization. Table 4. Trends of trade, marketization and decentralization in China, 1952-2013
Year Globalization (trade ratio or total trade volume divided by GDP)
Decentralization (% of local governmental expenditure)
Marketization (% of employment from state owned enterprises)
1952 9.51 25.90 98.57 1960 8.81 56.71 84.50 1965 6.89 23.48 75.29 1970 4.99 41.12 77.09 1975 10.18 50.13 78.38 1980 12.54 45.74 76.78 1985 22.92 60.32 72.75 1990 29.78 67.43 73.59 1995 38.66 70.76 73.48 2000 39.58 65.25 69.97 2005 63.82 74.14 57.44 2010 49.33 82.21 49.93 2013 43.90 85.40 35.15
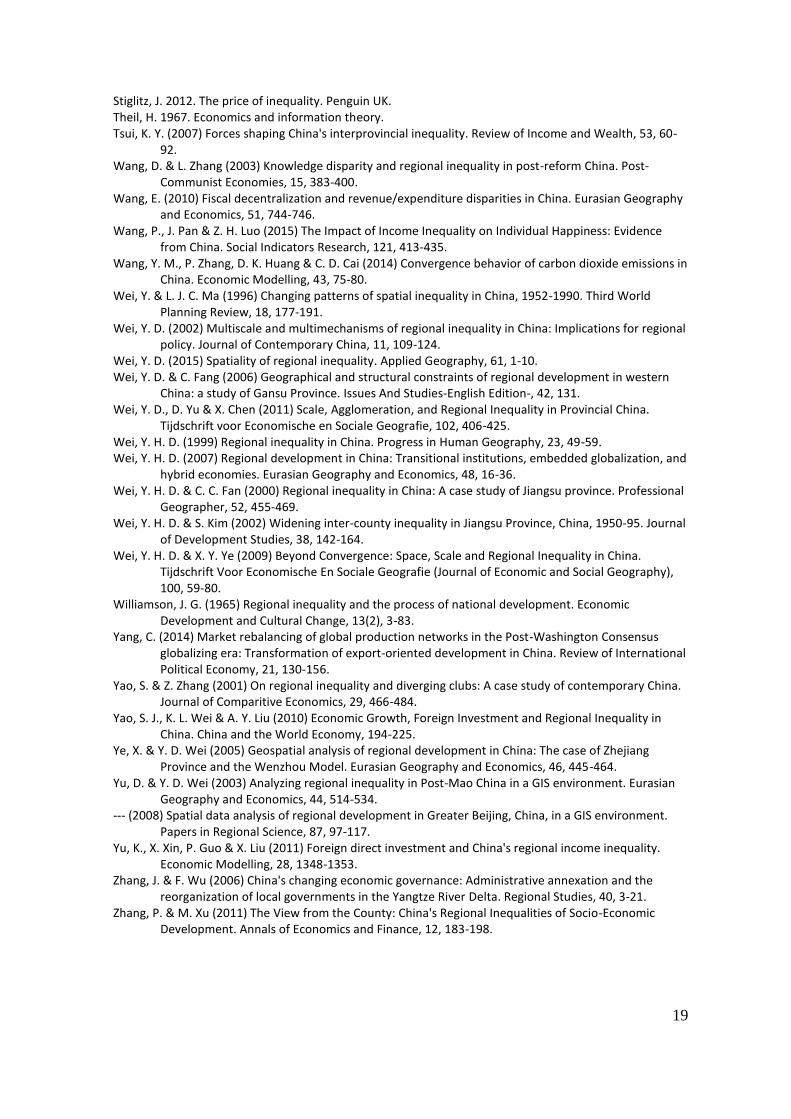
Our models are to test the association between regional inequality (at both provincial and regional levels) and the triple-process economic transition in China over the past sixty years. We use one-period lagged values of the independent variables as regressors to reduce potential endogeneity problems, while all independent variables are in logarithms. We have found that the log-level models give a better fit on R2. One important issue in the long-run time series analysis is the structural break. We locate the break at the start of the reform in the late 1970s, and add specific interaction terms to depict the influences of reform on these associations. The correlation analyses reveal potential multicollinearity problems due to strong correlations between the three independent variables, with a correlation coefficient greater than 0.75. To test the significance of the three underlying mechanisms, the proxies of the triple-process of economic transition are introduced separately into the models. Several findings emerge based on our modeling results. First, models focusing on interregional inequality can better capture the influences of economic transition on regional inequality, with a higher value of R2. The Chow tests indicate a significant break in 1979. Second, the variables representing decentralization, marketization and globalization are significant drivers of regional inequalities at both provincial and regional levels (Table 5 and Table 6), with expected coefficient signs. Third, results suggest that there has been a possible association between globalization and regional inequality at both provincial and regional levels. In particular, results of interaction terms demonstrate that this relationship has been strengthened during the reform period. Therefore, when China opened up, the coastal region had found itself with comparative advantage in exporting sectors and the faster growth in the coastal region contributed to a widening gap between regions and provinces. Coefficients for marketization also tell the same story and these findings are consistent with previous works (Fujita and Hu, 2001). With respect to the effect of decentralization, results suggest a positive and
15
significant association between regional inequality and local governments’ fiscal capacity, while we do not find that the association was more evident during the reform era. Table 5. Correlates of interprovincial inequalities and economic transition
Variables Model 1 Model 2 Model 3 Model 4 Model 5 Model 6
Marketization 0.283*** 0.171*** (0.039) (0.053) Globalization 0.209*** -0.224 (0.035) (0.152) Decentralization 0.647*** 0.754*** (0.058) (0.111) Reform*marketization 0.225* (0.135) Reform*globalization 0.431** (0.165) Reform*decentralization -0.261 (0.207) Reform (after 1979=1) 0.471*** -0.855** 1.036 (0.183) (0.436) (0.860) Constant -1.556*** -1.837*** -2.564*** -1.689*** -4.538*** -4.929*** (0.063) (0.104) (0.104) (0.360) (0.230) (0.479) Chow-test (F statistics) 7.85*** 4.25** 7.75*** Adjusted R square 0.451 0.555 0.407 0.466 0.675 0.676 Number of observations 61 61 61 61 61 61 Notes: All the variables are in logarithmic form and independent variables have one-year lag. Figures in parentheses are standard errors. *, ** and *** indicate statistical significance at 10%, 5% and 1%, respectively. The null hypothesis of the Chow test is that there is no structural break in 1979. Table 6. Correlates of interregional inequalities and economic transition
Variables Model 1 Model 2 Model 3 Model 4 Model 5 Model 6
Marketization 0.852*** 0.253** (0.139) (0.115) Globalization 0.881*** -0.702** (0.077) (0.315) Decentralization 2.199*** 1.158*** (0.174) (0.275) Reform*marketization 0.673** (0.296) Reform*globalization 1.388*** (0.795) Reform*decentralization 0.599 Reform (after 1979=1) 2.042*** -2.391*** -1.672 (0.399) (0.795) (1.768) Constant -2.100*** -3.692*** -5.856*** -2.704*** -12.076*** -8.426*** (0.220) (0.228) (0.229) (0.656) (0.694) (1.017) Chow-test (F statistics)
42.03*** 15.86*** 13.06***
Adjusted R square 0.378 0.753 0.682 0.789 0.726 0.806 Number of observations 61 61 61 61 61 61 Notes: All the variables are in logarithmic form and independent variables have one-year lag. Figures in parentheses are standard errors. *, ** and *** indicate statistical significance at 10%, 5% and 1%, respectively. The null hypothesis of the Chow test is that there is no structural break in 1979.

16
Lastly, underlying forces shaping regional inequality do not only differ from time to time but also from region to region in China (Knight, 2013; Li and Fang, 2014). As shown in the Table 7, intra-provincial inequalities vary from province to province. In the case of Guangdong, the globalization force has become a primary driver of rising inequality between the Pearl River Delta and the rest of the province (Liao and Wei, 2015; Liao and Wei, 2012). In contrast, in Gansu, an inland province in the Western region, regional inequality, measured by CV, is even more evident than that of Guangdong province (Table 7). However, the high level of regional disparities in Gansu province is more essentially rooted into the geographical blessing that development in inland areas has been hindered by remoteness and lack of basic infrastructure (Wei and Fang, 2006). Table 7. Regional inequalities in selected provinces in China (CV), 1990-2012
Provinces 1990 1995 2000 2005 2012 Total numbers of counties
Guangdong 0.71 0.70 0.72 0.83 0.67 82
Zhejiang 0.45 0.54 0.56 0.56 0.53 67
Jiangsu 0.63 0.75 0.78 0.91 0.92 65
Henan 0.64 0.59 0.58 0.60 0.56 127
Gansu 1.12 1.14 1.11 1.19 1.13 86 Source: GSB, 1991-2009, 2010, 2013; ZSB, 2010, 2013; JSB, 2010, 2013; HSB, 1996-2010, 2013; GaSB, 1996-2013. Notes: the calculation in this table is based on 1990 constant prices. CV = coefficient of variation.
7. CONCLUDING REMARKS AND FUTURE STUDIES
Regional inequality has been a heatedly debated issue associated with poverty reduction and sustainable economic growth in China (Glauben et al., 2012). This paper examines the evolution of regional inequality in China over the past six decades. We have found that changes of regional inequality coincide with different phases of China’s regional development. The evolution of regional inequality could hardly be simplified into convergence or divergence patterns and regional inequality is sensitive to geographical scales. For example, interprovincial inequality fluctuated and by 2013 it was similar to the magnitude of regional inequality at the provincial level in the 1960. In contrast, interregional inequality has risen despite a noticeable drop after 2005. As China has become the second largest economy in the world, empirical analysis of regional inequality in China has provided an excellent testing ground for theories of regional inequality that are mostly grounded in the Western countries. Our results show that convergence, divergence and inverted-U theories are rarely applicable in the case of China. Regional inequality studies in China are facing a lot of challenges in terms of methodologies and data quality. This is particularly true as the scope of the research has been broadened, expanding to social and environmental issues (Li and Wei, 2014; Wang et al., 2014). Moreover, the neo-classical account for uneven development that was founded upon assumptions of economic rationality, perfect mobility, and information and competition or the scale economies are basically drawing upon the thinking of equilibrium (Chen, 2010). The role of policies should be more thoroughly analyzed and understood in order to promote equitable economic growth in the future. Our regression analyses have highlighted the three key variables of globalization, decentralization and marketization and the importance of bringing economic transition as a fundamental mechanism when examining the underlying causes of changes in regional inequality. Given its complexity, scale and significance, this paper calls for a new round of multi-scalar analyses of regional inequality and lays out several promising directions for future works. First, despite that recent down-scale analysis at the county level has been informative (Zhang and Xu, 2011; Li and Fang, 2014), the scale of regional inequality has by no means been thoroughly explored (Lu et al., 2015). As previous literature has documented the importance of geographical scale for empirical analysis of regional

17
inequality, more works are needed to facilitate a more comprehensive understanding of the multi-scalar dynamics of regional inequality. Second, regional inequality analyses should be advanced from a methodological point of view. For example, network analysis or spatial temporal networks of regional development deserve more attention (Li, 2012). Resource flows, trade activities and other type of connection data when they became available should be further analyzed. In this regard, recent advances in GIS and network analysis methodology may fuel the studies of regional inequality in the next decades. Third, the studies of regional inequality have been constrained by the data inconsistence. This work echoes the concern about the discrepancy between GDP per capita using resident population and hukou population. Another interesting issue may refer to changes in administrative boundaries that would be critical for future analyses. For example, there has been a trend of merging suburban counties into central urban districts since the early 2000s (Zhang and Wu 2006). These changes result in fundamental changes in administrative boundaries and also GDP and population statistics. How this affect the measurement of regional inequality would be of great importance especially for studies focusing on intra-provincial inequalities. Fourth, regional inequality in other aspects of regional development deserve more attention. For example, in addition to economic development disparities, environmental and health inequalities have been of great concern in recent studies (Wang, Pan and Luo, 2015; Huang and Meng, 2013). Similarly, when China’s economy becomes more innovation or knowledge based, new form of regional inequality could be generated (Lu and Wei, 2007; Fan, Wan and Lu, 2012). Other studies in developed countries have shown a positive relationship between inequality and innovation (Breau, Kogler and Bolton, 2014). More works are needed along this line of inquiry.
REFERENCES Breau, S., D. F. Kogler & K. C. Bolton (2014) On the Relationship between Innovation and Wage Inequality:
New Evidence from Canadian Cities. Economic Geography, 90, 351-373. Chan, K. W. & M. Wang (2008) Remapping China's regional inequalities, 1990-2006: A new assessment of
de facto and de jure population data. Eurasian Geography and Economics, 49, 21-56. Chen, A. (2010) Reducing China's regional disparities: Is there a growth cost? China Economic Review, 21,
2-13. Chen, A. P. & N. Groenewold (2010) Reducing regional disparities in China: An evaluation of alternative
policies. Journal of Comparative Economics, 38, 189-198. Chen, Y. P., M. Liu & Q. Zhang (2010) Development of financial intermediation and the dynamics of urban-
rural disparity in China, 1978-1998. Regional Studies, 44, 1171-1187. Ezcurra, R. & A. Rodríguez-Pose (2013) Does Economic Globalization affect Regional Inequality? A Cross-
country Analysis. World Development, 52, 92-103. Fan, C. C. (1995) Of belts and ladders: state policy and uneven regional development in Post-Mao China.
Annals - Association of American Geographers, 85, 421-449. --- (1997) Uneven development and beyond: Regional development theory in post-Mao China.
International Journal of Urban and Regional Research, 21, 620-+. --- (2006) China's Eleventh Five-Year Plan (2006-2010): From 'Getting Rich First' to 'Common Prosperity'.
Eurasian Geography and Economics, 47, 708-723. Fan, C. C. & M. Sun (2008) Regional inequality in China, 1978-2006. Eurasian Geography and Economics,
49, 1-20. Fan, P. L., G. H. Wan & M. Lu (2012) China's Regional Inequality in Innovation Capability, 1995-2006. China
& World Economy, 20, 16-36. Fan, S., R. Kanbur & X. Zhang (2011) China's regional disparities: Experience and policy. Review of
Development Finance, 1, 47-56. Fleisher, B., H. Li & M. Q. Zhao (2010) Human capital, economic growth, and regional inequality in China.
Journal of Development Economics, 92, 215-231. Fujita, M. & D. Hu (2001) Regional disparity in China 1985-1994: The effects of globalization and economic
liberalization. Annals of Regional Science, 35, 3-37. Ge, Y. (2009) Globalization and Industry Agglomeration in China. World Development, 37, 550-559.

18
Glauben, T., T. Herzfeld, S. Rozelle & X. B. Wang (2012) Persistent Poverty in Rural China: Where, Why, and How to Escape? World Development, 40, 784-795.
Groenewold, N., G. Lee & A. Chen (2007) Regional output spillovers in China: Estimates from a VAR model. Papers in Regional Science, 86, 101-122.
Hao, R. & Z. Wei (2010) Fundamental causes of inland-coastal income inequality in post-reform China. Annals of Regional Science, 45, 181-206.
Herrerias, M. J. & J. O. Monfort (2015) Testing Stochastic Convergence across Chinese Provinces, 1952-2008. Regional Studies, 49, 485-501.
Ho, C. Y. & D. Li (2008) Rising regional inequality in China: Policy regimes and structural changes. Papers in Regional Science, 87, 245-259.
Huang, B. & L. Meng (2013) Convergence of per capita carbon dioxide emissions in urban China: A spatio-temporal perspective. Applied Geography, 40, 21-29.
Jones, A. (2015) Geographies of production II: Political economic geographies: A pluralist direction? Progress in Human Geography.
Kanbur, R. & X. B. Zhang (2005) Fifty years of regional inequality in China: a journey through central planning, reform, and openness. Review of Development Economics, 9, 87-106.
Ke, S. (2010) Agglomeration, productivity, and spatial spillovers across Chinese cities. Annals of Regional Science, 45, 157-179.
Knight, J. (2013) Inequality in China: An Overview. The World Bank Research Observer. Kuznets, S. (1955) Economic growth and income inequality. American Economic Review, 45, 1-28. Li, C. & J. Gibson (2013) Rising Regional Inequality in China: Fact or Artifact? World Development, 47, 16-
29. Li, G. D. & C. L. Fang (2014) Analyzing the multi-mechanism of regional inequality in China. Annals of
Regional Science, 52, 155-182. Li, H. & K. E. Haynes (2011) Economic structure and regional disparity in China: Beyond the Kuznets
transition. International Regional Science Review, 34, 157-190. Li, M. (2016) From Look-West to Act-West: Xinjiang’s role in China–Central Asian relations. Journal of
Contemporary China, 1-14. Li, S., H. Sato & T. Sicular. 2013. Rising inequality in China: Challenges to a harmonious society. Cambridge
University Press. Li, Y. (2012) Resource Flows and the Decomposition of Regional Inequality in the Beijing–Tianjin–Hebei
Metropolitan Region, 1990–2004. Growth and Change, 43, 335-357. Li, Y. R. & Y. D. Wei (2014) Multidimensional Inequalities In Health Care Distribution In Provincial China: A
Case Study Of Henan Province. Tijdschrift Voor Economische En Sociale Geografie, 105, 91-106. Li, Y. R. & Y. H. D. Wei (2010) The spatial-temporal hierarchy of regional inequality of China. Applied
Geography, 30, 303-316. Liao, F. H. & Y. D. Wei (2015) Space, scale, and regional inequality in provincial China: A spatial filtering
approach. Applied Geography, 61, 94-104. Liao, F. H. F. & Y. D. Wei (2012) Dynamics, space, and regional inequality in provincial China: A case study
of Guangdong province. Applied Geography, 35, 71-83. Liao, H. F. & R. C. Chan (2011) Industrial relocation of Hong Kong manufacturing firms: towards an
expanding industrial space beyond the Pearl river delta. GeoJournal, 76, 623-639. Lu, L. & Y. D. Wei (2007) Domesticating globalisation, new economic spaces and regional polarisation in
Guangdong Province, China. Tijdschrift voor Economische en Sociale Geografie, 98, 225-244. Lu, S. S., X. L. Guan, D. L. Yu, Y. Deng & L. J. Zhou (2015) Multi-Scale Analysis of Regional Inequality based
on Spatial Field Model: A Case Study of China from 2000 to 2012. Isprs International Journal of Geo-Information, 4, 1982-2003.
Pike, A., A. Rodríguez-Pose & J. Tomaney (2016) Shifting horizons in local and regional development. Regional Studies, 1-12.
Rodríguez-Pose, A. (2012) Trade and Regional Inequality. Economic Geography, 88, 109-136. Sakamoto, H. & N. Islam (2008) Convergence across Chinese provinces: An analysis using Markov
transition matrix. China Economic Review, 19, 66-79. Shi, H. & S. Huang (2014) How Much Infrastructure Is Too Much? A New Approach and Evidence from
China. World Development, 56, 272-286. Song, Y. (2013) Rising Chinese regional income inequality: The role of fiscal decentralization. China
Economic Review, 27, 294-309.
19
Stiglitz, J. 2012. The price of inequality. Penguin UK. Theil, H. 1967. Economics and information theory. Tsui, K. Y. (2007) Forces shaping China's interprovincial inequality. Review of Income and Wealth, 53, 60-
92. Wang, D. & L. Zhang (2003) Knowledge disparity and regional inequality in post-reform China. Post-
Communist Economies, 15, 383-400. Wang, E. (2010) Fiscal decentralization and revenue/expenditure disparities in China. Eurasian Geography
and Economics, 51, 744-746. Wang, P., J. Pan & Z. H. Luo (2015) The Impact of Income Inequality on Individual Happiness: Evidence
from China. Social Indicators Research, 121, 413-435. Wang, Y. M., P. Zhang, D. K. Huang & C. D. Cai (2014) Convergence behavior of carbon dioxide emissions in
China. Economic Modelling, 43, 75-80. Wei, Y. & L. J. C. Ma (1996) Changing patterns of spatial inequality in China, 1952-1990. Third World
Planning Review, 18, 177-191. Wei, Y. D. (2002) Multiscale and multimechanisms of regional inequality in China: Implications for regional
policy. Journal of Contemporary China, 11, 109-124. Wei, Y. D. (2015) Spatiality of regional inequality. Applied Geography, 61, 1-10. Wei, Y. D. & C. Fang (2006) Geographical and structural constraints of regional development in western
China: a study of Gansu Province. Issues And Studies-English Edition-, 42, 131. Wei, Y. D., D. Yu & X. Chen (2011) Scale, Agglomeration, and Regional Inequality in Provincial China.
Tijdschrift voor Economische en Sociale Geografie, 102, 406-425. Wei, Y. H. D. (1999) Regional inequality in China. Progress in Human Geography, 23, 49-59. Wei, Y. H. D. (2007) Regional development in China: Transitional institutions, embedded globalization, and
hybrid economies. Eurasian Geography and Economics, 48, 16-36. Wei, Y. H. D. & C. C. Fan (2000) Regional inequality in China: A case study of Jiangsu province. Professional
Geographer, 52, 455-469. Wei, Y. H. D. & S. Kim (2002) Widening inter-county inequality in Jiangsu Province, China, 1950-95. Journal
of Development Studies, 38, 142-164. Wei, Y. H. D. & X. Y. Ye (2009) Beyond Convergence: Space, Scale and Regional Inequality in China.
Tijdschrift Voor Economische En Sociale Geografie (Journal of Economic and Social Geography), 100, 59-80.
Williamson, J. G. (1965) Regional inequality and the process of national development. Economic Development and Cultural Change, 13(2), 3-83.
Yang, C. (2014) Market rebalancing of global production networks in the Post-Washington Consensus globalizing era: Transformation of export-oriented development in China. Review of International Political Economy, 21, 130-156.
Yao, S. & Z. Zhang (2001) On regional inequality and diverging clubs: A case study of contemporary China. Journal of Comparitive Economics, 29, 466-484.
Yao, S. J., K. L. Wei & A. Y. Liu (2010) Economic Growth, Foreign Investment and Regional Inequality in China. China and the World Economy, 194-225.
Ye, X. & Y. D. Wei (2005) Geospatial analysis of regional development in China: The case of Zhejiang Province and the Wenzhou Model. Eurasian Geography and Economics, 46, 445-464.
Yu, D. & Y. D. Wei (2003) Analyzing regional inequality in Post-Mao China in a GIS environment. Eurasian Geography and Economics, 44, 514-534.
--- (2008) Spatial data analysis of regional development in Greater Beijing, China, in a GIS environment. Papers in Regional Science, 87, 97-117.
Yu, K., X. Xin, P. Guo & X. Liu (2011) Foreign direct investment and China's regional income inequality. Economic Modelling, 28, 1348-1353.
Zhang, J. & F. Wu (2006) China's changing economic governance: Administrative annexation and the reorganization of local governments in the Yangtze River Delta. Regional Studies, 40, 3-21.
Zhang, P. & M. Xu (2011) The View from the County: China's Regional Inequalities of Socio-Economic Development. Annals of Economics and Finance, 12, 183-198.

20
Appendix
The most widely used measures of regional inequality include dispersion indices, Lorenz Curve indices, and entropy or information theoretic indices. Among the dispersion indices, the coefficient of variation (CV) is the most popular index, which is expresssed as:
𝐶𝑉 =𝜎𝑍𝜇𝑍
where 𝑍 is the per capita GDP, 𝜎 is the standard deviation and μ is the mean.
The Lorenz curve indices are associated with Gini coefficient and most frequently used by economists and geographers, but they are difficult to compute and unduly influenced by high values at the upper end of Lorenz curve. The Gini coefficient represents twice of the area between the Lorenz curve, a cumulative proportion curve of overall income distribution, and the equality curve when individuals have the same income:
𝐺𝑖𝑛𝑖 =1
2𝑛2𝜇𝑍∑∑|𝑍𝑖 − 𝑍𝑗|
𝑛
𝑗=1
𝑛
𝑖=1
where n is the number of areas, 𝑍𝑖 and 𝑍𝑗 are the per capita GDP of 𝑖th and 𝑗th area.
Compared to the dispersion indices and Lorenz Curve indices, the entropy indices are reasonably tractable and not affected by extreme values. Besides, the indices, like Theil index, are readily decomposable into components that measure the inequality between and within groups of observations by regions (Theil, 1967). The Theil index and its decomposition could be depicted as:
𝑇 =∑𝑦𝑖log(𝑦𝑖𝑥𝑖)
𝑛
𝑖=1
𝑇 = 𝑇𝑤𝑔 + 𝑇𝑏𝑔 = ∑𝑌𝑔 ∑𝑦𝑖𝑌𝑖
𝑖∈𝑆𝑔
log(𝑦𝑖 𝑌𝑔⁄
𝑥𝑖/𝑋𝑔)
𝐺
𝑔=1
+∑𝑌𝑔log(𝑌𝑔
𝑋𝑔)
𝐺
𝑔=1
where 𝑦𝑖 and 𝑥𝑖 are the GDP and population share of 𝑖th area, and 𝑌𝑔 and 𝑋𝑔 are the GDP and population
share of 𝑔th group of areas(say, 𝑔th region) LQ index is expressed as follows:
𝐿𝑄𝑖 =𝐺𝐷𝑃𝑖/𝐺𝐷𝑃𝑛𝑃𝑂𝑃𝑖/𝑃𝑂𝑃𝑛
where𝐺𝐷𝑃𝑖 and 𝐺𝐷𝑃𝑛 are GDP counted regionally and nationally; 𝑃𝑂𝑃𝑖 and 𝑃𝑂𝑃𝑛 are the population in the 𝑖th region or province and the nation. Thus the 𝐿𝑄𝑖 is the division between regional or provincial and national average GDP per capita. With 𝐿𝑄𝑖 = 1 representing the region or the province is in line with the national level of development, LQi < 1 means the below average development level in the region, while LQi > 1 indicates the opposite.