regional economic outlook: middle east and … · regional economic outlook. middle east and...
TRANSCRIPT


Cataloging-in-Publication Data
Regional economic outlook. Middle East and Central Asia. – Washington, D.C. : International Monetary Fund, 2004-
v. ; cm. – (World economic and fi nancial surveys, 0258-7440)
Twice a year.Began in 2004.Some issues have also thematic titles.
1. Economic forecasting – Middle East – Periodicals. 2. Economic forecasting – Asia, Central – Periodicals. 3. Middle East – Economic conditions – Periodicals. 4. Asia, Central – Economic conditions – Periodicals. 5. Economic development – Middle East – Periodicals. 6. Economic development – Asia, Central – Periodicals. I. Title: Middle East and Central Asia. II. International Monetary Fund. III. Series: World economic and fi nancial surveys.
HC412.R445
ISBN-13 978-1-61635-064-2
Please send orders to:International Monetary Fund
Publication ServicesPO Box 92780
Washington, DC 20090, U.S.A.Tel.: (202) 623-7430 Fax: (202) 623-7201
E-mail: [email protected]: www.imfbookstore.org
©2011 International Monetary FundSecond printing (revised), May 2011

iii
Conten tsPreface vii
Assumptions and Conventions viii
Country and Regional Groupings ix
World Economic Outlook 1
MIDDLE EAST, NORTH AFRICA, AFGHANISTAN, AND PAKISTAN 3
MENAP Highlights 5
10
Principaux points 11
1. MENAP Oil Exporters: Opportunity to Pursue Fundamental Reforms 15
Increased Uncertainty, But Financial Windfalls 15
Despite the Windfalls, Near-Term Policy Challenges Remain 17
Medium Term: Outlook Good, But Deep Structural Reforms Needed 22
2. MENAP Oil Importers: Winds of Change 27
Before the Protests 27
Temporary Toll on Region’s Economies 28
Higher Commodity Prices Add to Challenges 30
Policy Responses Come at a Fiscal Cost… 31
…But Higher Spending Will Support Near-Term Growth 31
Economic Policy Space Is Tight 34
The Road Ahead 35
3. Policy Challenges 39
3.1. MENA Oil Importers: Creating Jobs for the Young Workforce 39
Unemployment: Largely a Youth Phenomenon 39
Quick Wins with Long-Term Benefi ts: Lessons from Elsewhere 40
Pillars of a Comprehensive Job Strategy 41
3.2. Moving from Subsidizing Products to Protecting People: Strengthening Social Protection in MENAP 44
The Cost of Reliance on Subsidies for Social Protection 44
Why Is Price Subsidy Reform So Diffi cult? 46
Steps to Strengthen Social Protection in the Short Term 46
Advancing Subsidy Reform with Broad Ownership 46

CONTENTS
iv
3.3. The Impact of Financial Development on Economic Growth in the Middle East and North Africa 50
Financial Depth Is Adequate Overall… 50
…But Banks Have Not Delivered 51
Policy Actions Going Forward 52
CAUCASUS AND CENTRAL ASIA 53
CCA Highlights 55
Основные положения по странам КЦА 57
4. Caucasus and Central Asia: Sustaining the Recovery 59
Growth Continued to Recover But Infl ation Picked Up 59
Continuing Recovery at a Moderating Pace 60
Risks to the Outlook 62
Policy Challenges: Achieving Sustainable and Inclusive Growth 62
Is Infl ation a Concern? 63
Resisting Fiscal Pressures, Improving Expenditure Quality 65
Strengthening Bank Balance Sheets 66
Improving the Business Climate to Create Job Opportunities 66
Boxes
1.1 Stabilizing Global Oil Markets 16
1.2 Sudan: Economic Challenges for North and South Sudan 18
1.3 Employment Creation in Oil Exporters 19
1.4 Spillovers from the GCC 21
2.1 Political Unrest Shakes Egyptian and Tunisian Economies 28
2.2 Tourism Takes a Break 29
2.3 Oil Prices and Intraregional Linkages 32
2.4 Monetary Policy Response to MENAP Food Infl ation 35
3.2.1 Social Protection Instruments 45
3.2.2 Examples of Successful Subsidy Reforms 47
3.2.3 Replacing Subsidies with Cash Transfers: Subsidy Reform in the Islamic Republic of Iran 48
4.1 Poverty and Social Context in the CCA 63
4.2 What Is Driving Infl ation in the CCA? 64
4.3 How Integrated Are CCA Countries? 68
4.4 New Pipelines in the Caucasus and Central Asia Region 70

CONTENTS
v
Figures
1.1 Crude Oil Prices Rise Sharply 15
1.2 Growth Is Progressing in MENAP Oil Exporters 17
1.3 Non-Oil Sector Activity Remains Robust 17
1.4 Stock Markets Have Fallen 20
1.5 CDS Spreads Have Widened 20
1.6 Current Accounts Improve Across the Board 20
1.7 Current Accounts Under Alternative Price Scenarios 20
1.8 Fiscal Balances Improve 20
1.9 Non-Oil Fiscal Balances Expansionary 20
1.10 Non-GCC Headline Infl ation 23
1.11 GCC Headline Infl ation 23
2.1 Real GDP Growth Largely Flat in 2010 27
2.2 Income Growth Lagging Other Emerging Markets 27
2.3 Stock Market Indices Lower 30
2.4 Sovereign Bond Spreads Higher 30
2.5 Real GDP Growth of Trading Partners Differs 31
2.6 New Fiscal Costs 33
2.7 Infl ationary Pressures 34
2.8 Nominal Exchange Rates Have Depreciated 34
3.1.1 Unemployment Rates by Region 39
3.1.2 Employment-to-Working-Age Population Ratios and Labor Force Participation Rates by Region 40
3.2.1 Cost of Price Subsidies versus Cash Transfers 44
3.2.2 Distribution of Subsidies Across Income Groups 45
3.3.1 Private Credit by Deposit Money Banks/GDP 50
3.3.2 Stock Market Depth by Region 51
3.3.3 Financial Depth in MENA Countries 51
3.3.4 Growth Impact of Raising Credit/GDP to Emerging Country Average 52
4.1 Real GDP 59
4.2a Exports of CCA Oil and Gas Exporters 60
4.2b Exports and Net Remittances of CCA Oil and Gas Importers 60
4.3a Aggregated Headline and Nonfood Infl ation, CCA Oil and Gas Exporters 60
4.3b Aggregated Headline and Nonfood Infl ation, CCA Oil and Gas Importers 60
4.4a Fiscal Balances in Oil and Gas Importers 61
4.4b Non-Oil-Gas Fiscal Balances in Oil and Gas Exporters 61
4.5 Adjustment in Policy Rates, 2010–11 62
4.6 High and Mostly Rising Levels of Nonperforming Loans 62

CONTENTS
vi
4.7 Public Spending Growth 66
4.8 Governance Indicators 67
Tables
1.1 Summary of Recent Fiscal Policy Measures 22
2.1 Impact of Higher Fuel and Food Prices 30
2.2 Fiscal Policy Measures Announced Since Late 2010 33
Statistical Appendix
1. Real GDP Growth 74
2. Nominal GDP 75
3. Oil and Non-Oil Real GDP Growth 76
4. Crude Oil Production and Exports 77
5. Consumer Price Infl ation 78
6. Broad Money Growth 79
7. General Government Fiscal Balance 80
8. General Government Total Revenue, Excluding Grants 81
9. Oil Exporters: General Government Non-Oil Fiscal Balance 82
10. Oil Exporters: General Government Non-Oil Revenue 83
11. General Government Total Expenditure and Net Lending 84
12. Total Government Gross Debt 85
13. Selected MENAP Countries: Total Government Net Debt 86
14. Exports of Goods and Services 87
15. Imports of Goods and Services 88
16. Current Account Balance 89
17. Current Account Balance 90
18. Gross Offi cial Reserves 91
19. Total Gross External Debt 92
20. Capital Adequacy Ratios 93
21. Return on Assets 94
22. Nonperforming Loans 95

vii
The Middle East and Central Asia Regional Economic Outlook (REO) is prepared biannually by the IMF’s Middle East and Central Asia Department (MCD). The analysis and projections contained in the MCD REO are integral elements of the Department’s surveillance of economic developments and policies in 30 member countries. It draws primarily on information gathered by IMF staff through their consultations with member countries.
The analysis in this report was coordinated under the general supervision of Masood Ahmed (Director of MCD). The project was directed by Ratna Sahay (Deputy Director in MCD) and Ralph Chami (Division Chief in MCD).
The primary contributors to this report are Yasser Abdih, Adolfo Barajas, Andreas Bauer, Paul Cashin, Ana Lucía Coronel, Mark Horton, Ananthakrishnan Prasad, Tobias Rasmussen, David Robinson, and Axel Schimmelpfennig. Other contributors include Ali Al-Eyd, David Amaglobeli, Veronica Bacalu, Svetlana Cerovic, Joshua Charap, Jemma Dridi, Dominique Guillaume, Nadeem Ilahi, Annette Kyobe, Agustín Roitman, Dmitriy Rozhkov, Niklas Westelius, and Roman Zytek.
Jaime Espinosa provided research assistance and managed the database and the computer systems, with support from Gohar Abajyan, Arthur Ribeiro, Renas Sidahmed, and Chunfang Yang. Jasmine Lief was responsible for word processing and document management, with support from Naghmeh Djahanyekta and Sanaa Farid. In close collaboration with Joanne Blake and Martha Bonilla of the External Relations Department, Kia Penso edited the manuscript, and Christine Ebrahimzadeh managed the production of the publication.
Preface

viii
Assumptions and Conventions
A number of assumptions have been adopted for the projections presented in the Regional Economic Outlook: Middle East and Central Asia. It has been assumed that established policies of national authorities will be maintained; that the price of oil1 will average US$107.16 per barrel in 2011 and US$108 in 2012; and that the six-month London interbank offered rate (LIBOR) on U.S. dollar deposits will average 0.6 percent in 2011 and 0.9 percent in 2012. These are, of course, working hypotheses rather than forecasts, and the uncertainties surrounding them add to the margin of error that would in any event be involved in the projections. The estimates and projections are based on statistical information available through late March 2011.
The following conventions are used in this publication:
• In tables, ellipsis points (. . .) indicate “not available,” and 0 or 0.0 indicates “zero” or “negligible.” Minor discrepancies between sums of constituent fi gures and totals are due to rounding.
• An en dash (–) between years or months (for example, 2009–10 or January–June) indicates the years or months covered, including the beginning and ending years or months; a slash or virgule (/) between years or months (for example, 2009/10) indicates a fi scal or fi nancial year, as does the abbreviation FY (for example, FY2010).
• “Billion” means a thousand million; “trillion” means a thousand billion.
• “Basis points (bps)” refer to hundredths of 1 percentage point (for example, 25 basis points are equivalent to ¼ of 1 percentage point).
As used in this publication, the term “country” does not in all cases refer to a territorial entity that is a state as understood by international law and practice. As used here, the term also covers some territorial entities that are not states but for which statistical data are maintained on a separate and independent basis.
1Simple average of prices of U.K. Brent, Dubai, and West Texas Intermediate crude oil.

ix
The April 2011 Regional Economic Outlook: Middle East and Central Asia (REO), covering countries in the Middle East and Central Asia Department (MCD) of the International Monetary Fund (IMF), provides a broad overview of recent economic developments in 2010 and prospects and policy issues for the remainder of 2011. To facilitate the analysis, the 30 MCD countries covered in this report are divided into two groups: (1) countries of the Middle East, North Africa, Afghanistan, and Pakistan (MENAP)—which are further subdivided into oil exporters and oil importers; and (2) countries of the Caucasus and Central Asia (CCA). The country acronyms used in some fi gures are included in parentheses.
MENAP oil exporters1 comprise Algeria (ALG), Bahrain (BHR), Iran (IRN), Iraq (IRQ), Kuwait (KWT), Libya (LBY), Oman (OMN), Qatar (QAT), Saudi Arabia (SAU), Sudan (SDN), the United Arab Emirates (UAE), and Yemen (YMN).
MENAP oil importers comprise Afghanistan (AFG), Djibouti (DJI), Egypt (EGY), Jordan (JOR), Lebanon (LBN), Mauritania (MRT), Morocco (MAR), Pakistan (PAK), Syria (SYR), and Tunisia (TUN).
CCA countries comprise Armenia (ARM), Azerbaijan (AZE), Georgia (GEO), Kazakhstan (KAZ), the Kyrgyz Republic (KGZ), Tajikistan (TJK), Turkmenistan (TKM), and Uzbekistan (UZB).
In addition, the following geographical groupings are used:
MENA comprises Algeria, Bahrain, Djibouti, Egypt, Iran, Iraq, Jordan, Kuwait, Lebanon, Libya, Oman, Mauritania, Morocco, Qatar, Saudi Arabia, Sudan, Syria, Tunisia, the United Arab Emirates, and Yemen.
The GCC (Gulf Cooperation Council) comprises Bahrain, Kuwait, Oman, Qatar, Saudi Arabia, and the United Arab Emirates.
The Maghreb comprises Algeria, Libya, Mauritania, Morocco, and Tunisia.
The Mashreq comprises Egypt, Jordan, Lebanon, and Syria.
The CIS (Commonwealth of Independent States) comprises Armenia, Azerbaijan, Belarus, Georgia, Kazakhstan, the Kyrgyz Republic, Moldova, Mongolia, Russia, Tajikistan, Turkmenistan, Ukraine, and Uzbekistan. Georgia and Mongolia, which are not members of the CIS, are included in this group for reasons of geography and similarities in economic structure.
1Due to the uncertain economic situation, Libya is excluded from the projection years of REO aggregates.
Country and Regional Groupings


1
World Economic Outlook1
The global economic recovery is gaining strength, but unemployment remains high in advanced economies, and new macroeconomic risks are building in emerging market economies. World growth is forecast to be about 4½ percent in 2011, down modestly from 5 percent in 2010 (see table). Real GDP in advanced economies and emerging and developing economies is expected to expand by about 2½ percent and 6½ percent, respectively. Downside risks have diminished but continue to outweigh upside risks.
In advanced economies, the handoff from public to private demand is advancing, reducing concerns that diminishing fi scal policy support might cause a “double-dip” recession. Financial conditions are improving, but weak sovereign balance sheets and still-moribund real estate markets continue to present major concerns, especially in certain euro area economies. Financial risks are also to the downside as a result of the high funding requirements of banks and sovereigns. New downside risks are building on account of rising commodity prices, notably for oil, and, relatedly, geopolitical uncertainty, as well as overheating and booming asset markets in emerging market economies. However, there is also the potential for upside surprises to growth in the short term, owing to strong corporate balance sheets in advanced economies and buoyant demand in emerging and developing economies.
In many emerging market economies, demand is robust, and overheating is a growing policy concern. Developing economies, particularly in sub-Saharan Africa, have also resumed fast and sustainable growth. However, rising food and commodity prices pose a threat to the real incomes of poor households, adding to social and economic tensions, notably in the Middle East and North Africa. Oil price increases since January 2011 and information on supply, including on spare capacity, suggest that the latest supply disruptions so far would have only mild effects on economic activity.
In advanced economies, strengthening the recovery will require keeping monetary policy accommodative as long as wage pressures are subdued, infl ation expectations are well anchored, and bank credit is sluggish. At the same time, fi scal positions need to be placed on sustainable medium-term paths by implementing fi scal consolidation plans and entitlement reforms supported by stronger fi scal rules and institutions. The need is particularly urgent in the United States to stem the risk of globally destabilizing changes in bond markets. More generally, greater trust needs to be reestablished in euro area banks through ambitious stress tests and restructuring and recapitalization programs. In Japan, where an earthquake has exacted a terrible human toll, the immediate fi scal priority is to support reconstruction. The challenge for many emerging and some developing economies is to ensure that present boom-like conditions do not develop into overheating over the coming year. Many of these economies will also need to provide well-targeted support for poor households that struggle with high food prices.
Greater progress in advancing global demand rebalancing is essential to put the recovery on a stronger footing over the medium term. This will require action by many countries, notably fi scal adjustment in key external defi cit economies and greater exchange rate fl exibility and structural reforms that eliminate distortions that boost savings in key surplus economies.
1 See IMF, World Economic Outlook and Global Financial Stability Report (both April 2011) for more information.
Overview of the World Economic Outlook Projections(Percent change)
Year-over-YearProjections
2009 2010 2011World output -0.5 5.0 4.4 Advanced economies -3.4 3.0 2.4 Of which: United States -2.6 2.8 2.8 European Union -4.1 1.8 1.8 Emerging and developing economies 2.7 7.3 6.5 Of which: MENAP 2.1 3.9 3.9 CCA 3.7 6.6 5.7 Commonwealth of Independent States -6.4 4.6 5.0 Of which: Russia -7.8 4.0 4.8
World trade volume (goods and services)
Commodity prices
-10.9 12.4 7.4
Oil1 -36.3 27.9 35.6 Nonfuel2 -15.8 26.3 25.1
Sources: IMF, World Economic Outlook and Regional Economic Outlook (April 2011).1Simple average of prices of U.K. Brent, Dubai, and West Texas Intermediate crude oil. The average price of oil in U.S. dollars a barrel was $79.0 in 2010; the assumed price based on future markets is $107.2 in 2011 and $108.0 in 2012.2Average (measured in U.S. dollars) based on world commodity export weights.


3
Middle East, North Africa, Afghanistan, and PakistanPopulation, millions (2010)GDP per capita, U.S. dollars (2010)
Tunisia10.5
4,201
Syria20.62,877
Jordan6.1
4,500
Kuwait3.6
36,412
Morocco31.9
3,249
Lebanon3.9
10,044Afghanistan
30.2517
Iraq32.0
2,564
Iran75.3
4,741
Egypt78.3
2,789
Pakistan166.61,050
Algeria36.1
4,435Libya6.6
11,314 Saudi Arabia 26.1
Mauritania3.2
1,195
Qatar1.7
76,168
16,996
Bahrain
Oman
1.120,475
Sudan40.1
1,705United Arab Emirates
5.159,717
Djibouti0.8
1,383
3.018,657
Yemen24.41,282
Oil importers
Oil exporters
Sources: IMF Regional Economic Outlook database; and Microsoft Map Land. Note: The country names and borders on this map do not necessarily reflect the IMF's official position.


5
MENAP HighlightsThe Middle East and North Africa is going through a period of unprecedented change. Even though it is clear today that the popular uprisings are born of a desire for greater political, social, and economic freedom, their timing came as a surprise to everyone, including the IMF. The roots of these uprisings are political, but economic causes are inextricably entwined.
Until late 2010, the region was on track for a recovery from the global crisis. Growth accelerated to 3.9 percent in 2010 from 2.1 percent in 2009, mainly driven by the region’s oil exporters. Nevertheless, the slow growth equilibrium of the past years did not generate enough jobs for the growing labor force.
The unfolding events make it clear that reforms, and even rapid economic growth as seen periodically in Tunisia and Egypt, cannot be sustained unless they create jobs for the rapidly growing labor force and are accompanied by social policies for the most vulnerable. For growth to be sustainable, it must be inclusive and broadly shared, and not just captured by a privileged few. Endemic corruption in the region is an unacceptable affront to the dignity of its citizens, and the absence of transparent and fair rules of the game will inevitably undermine inclusive growth.
At the same time, a socially inclusive agenda will not survive unless macroeconomic and fi nancial stability prevails. Its absence can test even countries with strong institutions, as the recent global crisis has shown. During the current period of turmoil and uncertainty in the region, it is all the more vital to contain rising fi scal imbalances, growing debt and debt-servicing costs, infl ation, and capital fl ight. These threats to macroeconomic and fi nancial stability—if not arrested quickly—could undermine confi dence and derail the pursuit of any new social agenda.
Two developments mark the outlook: the unrest in the region and the surge in global fuel and food prices. As a result, the near-term economic outlook is subject to unusually large uncertainties stemming from the fl uid political and security situation in a number of countries.
For most oil exporters, the expected increase in oil prices—from US$79 per barrel to US$107 per barrel—and production volumes will lead to higher growth in 2011 and stronger fi scal and external balances, notwithstanding recent increases in government spending. Average real GDP growth (excluding Libya) is projected to reach 4.9 percent in 2011 compared with 3.5 percent in 2010, while non-oil growth is projected to stay at 3.5 percent in 2011. For the GCC, growth is projected to reach 7.8 percent in 2011 as oil production expands to stabilize global oil supply in the face of supply disruptions elsewhere. GCC non-oil growth is set to accelerate by more than 1 percentage point to 5.3 percent in 2011. The oil exporters’ combined external current account surplus is estimated to increase from US$172 billion to US$378 billion (excluding Libya), and for the GCC from US$136 billion to US$304 billion.
The economic outlook for the oil importers is mixed. For Egypt and Tunisia we project this year’s growth to be 2½–4 percentage points lower than in 2010, refl ecting disruptions to economic activity during the protests, a decline in tourism, and lower investment. Political uncertainty is also weighing on Lebanon’s economy, and growth in Pakistan is still held back by the effects of last year’s fl oods. In most other countries, however, growth has continued to pick up, with Jordan, Mauritania, and Morocco benefi ting from high prices for phosphate and iron ore.
Governments across the region are responding to political developments—and higher commodity prices—with expansions of fuel and food subsidies, civil service wage and pension increases, additional cash transfers, tax reductions, and other spending increases. The size of the national fi scal packages in 2011 ranges from less than ½ percent of GDP in some MENA oil importers to about 22 percent of GDP in Saudi Arabia

REGIONAL ECONOMIC OUTLOOK: MI DDLE EAST AND CENTRAL ASIA
6
(with the spending spread over several years). While some countries can easily afford this extra spending, others will fi nd it straining public fi nances and debt levels: support from the international community would help bridge fi nancing needs and contain the buildup of debt.
Headline infl ation has accelerated across the region, mainly driven by higher international commodity prices. However, there are indications that food and fuel infl ation are spilling over into core infl ation. More generally, with food and fuel accounting for about half of MCD countries’ consumer price indices, and commodity price shocks likely to be rather persistent, regional central banks will need to pay greater attention to headline infl ation when setting policy rates and the overall stance of monetary policy. Upward pressure on policy rates will also come from a rising global interest rate environment and increasing sovereign risk premiums.
Beyond the immediate challenges, the recent uprisings provide a great opportunity to lay the foundation for a socially inclusive growth agenda for the Middle East. Each country must fi nd its own homegrown path for change that is broadly owned, but all will need to respond to some common goals to realize the region’s longer-term potential: a stable macroeconomic environment to provide confi dence and attract investment; enough private-sector jobs to absorb the currently unemployed and a fast-growing labor force; access to economic opportunity for citizens to realize their potential; social protection for the vulnerable; and strong and transparent institutions that ensure accountability and good governance. The aim is not just sustained high growth, but also growth that is more inclusive and results in broadly shared development gains.
At the time of writing this Regional Economic Outlook, there were many uncertainties about the MENA region’s future. Nonetheless, the region has many strengths on which to build: a dynamic and young population, vast natural resources, a large regional market, an advantageous geographic position, and access to key markets. While the months ahead will be challenging and inevitably marked by setbacks, there is a momentum for change to build upon.

HIGHLIGHTS
7
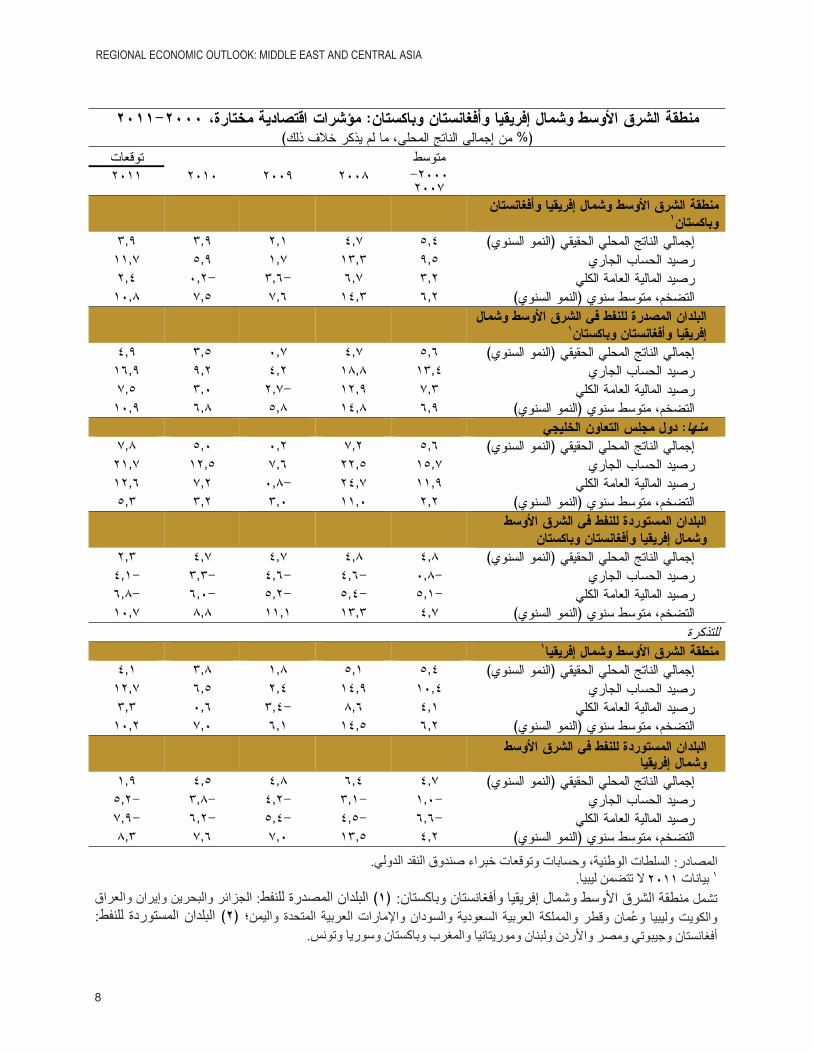
MENAP Region: Selected Economic Indicators, 2000–11(Percent of GDP, unless otherwise indicated)
Average Proj.2000–07 2008 2009 2010 2011
MENAP¹Real GDP (annual growth) 5.4 4.7 2.1 3.9 3.9
Current Account Balance 9.5 13.3 1.7 5.9 11.7
Overall Fiscal Balance 3.2 6.7 -3.6 -0.2 2.4
Inflation, p.a. (annual growth) 6.2 14.3 7.6 7.5 10.8
MENAP Oil Exporters¹Real GDP (annual growth) 5.6 4.7 0.7 3.5 4.9
Current Account Balance 13.4 18.8 4.2 9.2 16.9
Overall Fiscal Balance 7.3 12.9 -2.7 3.0 7.5
Inflation, p.a. (annual growth) 6.9 14.8 5.8 6.8 10.9
Of Which: Gulf Cooperation CouncilReal GDP (annual growth) 5.6 7.2 0.2 5.0 7.8
Current Account Balance 15.7 22.5 7.6 12.5 21.7
Overall Fiscal Balance 11.9 24.7 -0.8 7.2 12.6
Inflation, p.a. (annual growth) 2.2 11.0 3.0 3.2 5.3
MENAP Oil ImportersReal GDP (annual growth) 4.8 4.8 4.7 4.7 2.3
Current Account Balance -0.8 -4.6 -4.6 -3.3 -4.1
Overall Fiscal Balance -5.1 -5.4 -5.2 -6.0 -6.8
Inflation, p.a. (annual growth) 4.7 13.3 11.1 8.8 10.7
Memorandum
MENA¹Real GDP (annual growth) 5.4 5.1 1.8 3.8 4.1
Current Account Balance 10.4 14.9 2.4 6.5 12.7
Overall Fiscal Balance 4.1 8.6 -3.4 0.6 3.3
Inflation, p.a. (annual growth) 6.2 14.5 6.1 7.0 10.2
MENA Oil ImportersReal GDP (annual growth) 4.7 6.4 4.8 4.5 1.9
Current Account Balance -1.0 -3.1 -4.2 -3.8 -5.2
Overall Fiscal Balance -6.6 -4.5 -5.4 -6.2 -7.9
Inflation, p.a. (annual growth) 4.2 13.5 7.0 7.6 8.3
Sources: National authorities; and IMF staff calculations and projections.¹2011 data exclude Libya. MENAP: (1) Oil Exporters: Algeria, Bahrain, Iran, Iraq, Kuwait, Libya, Oman, Qatar, Saudi Arabia, Sudan, the United Arab Emirates, and Yemen; (2) Oil Importers: Afghanistan, Djibouti, Egypt, Jordan, Lebanon, Mauritania, Morocco, Pakistan, Syria, and Tunisia. MENA: MENAP excluding Afghanistan and Pakistan.
8
REGIONAL ECONOMIC OUTLOOK: MI DDLE EAST AND CENTRAL ASIA

HIGHLIGHTS
9

10

11
Principaux pointsLa région du Moyen-Orient et de l’Afrique du Nord (MOAN) traverse une période de transformation sans précédent. Bien qu’il soit clair aujourd’hui que les soulèvements populaires sont nés de l’aspiration à plus de liberté politique, sociale et économique, tout le monde, y compris le FMI, a été pris par surprise. Les raisons profondes de ces soulèvements sont politiques, mais elles sont inextricablement liées à des causes économiques.
Jusqu’aux derniers mois de 2010, la région était en bonne voie pour se relever de la crise mondiale. La croissance, principalement tirée par les pays exportateurs de pétrole de la région, est passé d’un taux de 2,1 pour cent en 2009 à 3,9 pour cent en 2010. Néanmoins, la croissance tendancielle lente des années précédentes n’a pas créé suffi samment d’emplois pour la population active grandissante.
Les événements actuels montrent clairement que les réformes, voire les périodes de croissance rapide observées en Tunisie et en Égypte, ne peuvent être durables à moins qu’elles ne créent des emplois pour une population active qui augmente à vive allure et ne s’accompagnent de mesures sociales pour les couches les plus vulnérables. Pour que la croissance soit durable, il faut qu’elle soit inclusive et largement partagée, et non accaparée par quelques privilégiés. La corruption endémique dans la région constitue un affront inacceptable à la dignité de ses citoyens, et l’absence de règles du jeu transparentes et équitables mine inévitablement la croissance inclusive.
Cependant, un programme social et inclusif ne peut survivre sans que la stabilité macroéconomique et fi nancière ne soit au rendez-vous. Si elle fait défaut, même les pays dotés de solides institutions peuvent être mis à rude épreuve, comme l’a montré la récente crise mondiale. En ces temps de turbulences et d’incertitudes dans la région, il n’est que plus crucial de contenir la vague montante des déséquilibres budgétaires, de la dette et du service y afférent, de l’infl ation et de la fuite de capitaux. Ces menaces qui pèsent sur la stabilité macroéconomique et fi nancière pourraient — si elles ne sont pas stoppées rapidement — saper la confi ance et faire dérailler les nouvelles réformes sociales.
Les perspectives sont marquées par deux courants d’évolution : l’agitation qui règne dans la région et l’envolée des cours mondiaux des produits pétroliers et des denrées alimentaires. La conjoncture économique à court terme est donc inhabituellement incertaine à cause de la situation politique et sécuritaire très fl uide présente dans un certain nombre de pays.
Pour la plupart des pays exportateurs de pétrole, la hausse prévisible des cours pétroliers — de 79 à 107 dollars EU le baril — et des volumes de production se traduira par une accélération de la croissance en 2011 et une amélioration des soldes budgétaires et extérieurs, en dépit de l’augmentation récente des dépenses publiques. Les projections tablent sur un taux de progression moyen du PIB réel (Libye non comprise) à 4,9 pour cent en 2011, contre 3,5 pour cent en 2010, le taux de croissance hors pétrole restant à 3,5 pour cent en 2011. Pour le Conseil de Coopération du Golfe (CCG), la prévision de croissance est de 7,8 pour cent en 2011, du fait que la production de pétrole va être accrue pour stabiliser l’offre perturbée ailleurs par des ruptures d’approvisionnement. Le taux de croissance hors pétrole du CCG gagnerait 1 pour cent, passant à 5,3 pour cent en 2011. D’après les estimations, l’excédent global des comptes extérieurs courants des pays exportateurs de pétrole passerait de 172 à 378 milliards de dollars EU (Libye non comprise) et celui du CCG de 136 à 304 milliards de dollars EU.
L’évolution économique des pays importateurs de pétrole s’annonce plus nuancée. Pour l’Égypte et la Tunisie, nos projections donnent la croissance en recul de 2½ à 4 points de pourcentage par rapport à 2010, en raison des perturbations de l’activité économique pendant les protestations, de la diminution du tourisme et de

REGIONAL ECONOMIC OUTLOOK: MI DDLE EAST AND CENTRAL ASIA
12
la baisse des investissements. L’incertitude politique pèse aussi sur l’économie du Liban et la croissance du Pakistan qui est encore freinée par les effets des inondations de l’an dernier. Dans la plupart des autres pays, toutefois, la croissance continue à progresser, la hausse des cours des phosphates et du minerai de fer jouant au profi t de la Jordanie, du Maroc et de la Mauritanie.
Face aux événements politiques — ainsi qu’à la hausse des cours des matières de base — les autorités gouvernementales de l’ensemble de la région ont réagi en accroissant les subventions des produits pétroliers et alimentaires, en relevant les salaires et les retraites des fonctionnaires, en augmentant les transferts en espèces, en réduisant les impôts et en accroissant les dépenses publiques dans d’autres domaines. Les plans nationaux de relance budgétaire pour 2011 se situent entre moins de 0,5 pour cent du PIB dans certains pays importateurs de pétrole du Moyen-Orient et d’Afrique du Nord à 22 pour cent du PIB environ en Arabie Saoudite (les dépenses s’étalant sur plusieurs années). Alors que certains pays peuvent facilement se permettre ce surcroît de dépenses, d’autres en ressentiront le poids sur la dette et les fi nances publiques : le soutien de la communauté internationale aiderait à combler les besoins de fi nancement et à contenir la hausse de l’endettement.
L’infl ation globale s’est accélérée dans l’ensemble de la région, principalement sous l’effet de la hausse des cours internationaux des matières de base. Il semble toutefois que la hausse des prix des denrées alimentaires et des produits pétroliers déteigne sur l’infl ation de base. Plus généralement, étant donné que les denrées alimentaires et produits pétroliers pèsent pour près de la moitié dans les indices des prix à la consommation des pays du Moyen-Orient et d’Asie centrale, et que le renchérissement des produits de base risque d’être assez persistant, les banques centrales de la région vont devoir prêter davantage d’attention à l’infl ation globale lors de la fi xation de leurs taux directeurs et de l’orientation générale de la politique monétaire. Les taux directeurs seront aussi poussés à la hausse par le contexte d’augmentation des taux d’intérêt mondiaux et des primes de risque sur les emprunts souverains.
Au-delà des enjeux immédiats, les récents soulèvements offrent une belle occasion de jeter les bases d’un programme de croissance inclusive et respectueux de la solidarité sociale au Moyen-Orient. Chaque pays devra défi nir sa propre feuille de route en vue d’une transformation largement consensuelle, mais ils devront tous tendre vers des objectifs communs pour réaliser le potentiel à long terme de la région : un climat de stabilité macroéconomique pour inspirer la confi ance et attirer les investissements; la création de suffi samment d’emplois dans le secteur privé pour résorber le chômage et absorber la population active en rapide essor; des débouchés économiques pour que l’ensemble des citoyens puissent réaliser leur potentiel; la protection sociale des plus vulnérables; et des institutions solides et transparentes tenues de rendre compte de leurs actions et de garantir une bonne gouvernance. Le but n’est pas seulement une croissance plus vigoureuse, mais aussi une croissance plus inclusive et des gains en matière de développement qui soient largement partagés.
Au moment de la préparation de cette édition du Rapport sur les perspectives économiques régionales, de nombreuses incertitudes pesaient sur l’évolution future de la région MOAN. Elle a cependant de nombreux points forts sur lesquels construire son avenir : une population jeune et dynamique, d’abondantes ressources naturelles, un vaste marché régional, une situation géographique avantageuse et des débouchés sur les principaux marchés mondiaux. Alors que les mois à venir seront diffi ciles et inévitablement marqués par des revers, il y a une dynamique de changement prometteuse à développer.

HIGHLIGHTS
13
Région MOANAP : Principaux indicateurs économiques, 2000―11(En pourcentage du PIB, sauf indication contraire)
Moyenne Proj.
2000–07 2008 2009 2010 2011
MOANAP1
PIB réel (croissance annuelle) 5.4 4.7 2.1 3.9 3.9
Solde des transactions courantes 9.5 13.3 1.7 5.9 11.7
Solde budgétaire global 3.2 6.7 -3.6 -0.2 2.4
Inflation (croissance annuelle) 6.2 14.3 7.6 7.5 10.8
Pays exportateurs de pétrole de la région MOANAP1
PIB réel (croissance annuelle) 5.6 4.7 0.7 3.5 4.9
Solde des transactions courantes 13.4 18.8 4.2 9.2 16.9
Solde budgétaire global 7.3 12.9 -2.7 3.0 7.5
Inflation (croissance annuelle) 6.9 14.8 5.8 6.8 10.9
Dont : Conseil de Coopération du GolfePIB réel (croissance annuelle) 5.6 7.2 0.2 5.0 7.8
Solde des transactions courantes 15.7 22.5 7.6 12.5 21.7
Solde budgétaire global 11.9 24.7 -0.8 7.2 12.6
Inflation (croissance annuelle) 2.2 11.0 3.0 3.2 5.3
Pays importateurs de pétrole de la région MOANAPPIB réel (croissance annuelle) 4.8 4.8 4.7 4.7 2.3
Solde des transactions courantes -0.8 -4.6 -4.6 -3.3 -4.1
Solde budgétaire global -5.1 -5.4 -5.2 -6.0 -6.8
Inflation (croissance annuelle) 4.7 13.3 11.1 8.8 10.7
Pour mémoire
MOAN1
PIB réel (croissance annuelle) 5.4 5.1 1.8 3.8 4.1
Solde des transactions courantes 10.4 14.9 2.4 6.5 12.7
Solde budgétaire global 4.1 8.6 -3.4 0.6 3.3
Inflation (croissance annuelle) 6.2 14.5 6.1 7.0 10.2
Pays importateurs de pétrole de la région MOANPIB réel (croissance annuelle) 4.7 6.4 4.8 4.5 1.9
Solde des transactions courantes -1.0 -3.1 -4.2 -3.8 -5.2
Solde budgétaire global -6.6 -4.5 -5.4 -6.2 -7.9
Inflation (croissance annuelle) 4.2 13.5 7.0 7.6 8.3
Sources: autorités nationales; et calculs et projections des services du FMI.¹Les données de 2011 excluent la Libye. MOANAP: (1) Exportateurs de pétrole: Algérie, Arabie Saoudite, Bahreïn, Émirats arabes unis, Iran, Iraq, Koweït, Libye, Oman, Qatar, Soudan et Yémen; (2) Importateurs de pétrole: Afghanistan, Djibouti, Égypte, Jordanie, Liban, Maroc, Mauritanie, Pakistan, Syrie et Tunisie. MOAN: MOANAP à l’exclusion de l’Afghanistan et du Pakistan.


15
1. MENAP Oil Exporters: Opportunity to Pursue Fundamental Reforms
Sharp increases in oil prices, particularly after the beginning of the recent events in the region, have benefi ted the MENAP oil exporters’ fi scal and current account surpluses. Part of the increased oil revenues has been used to respond to social tensions. In managing the short-term uncertainties, oil exporters should not lose sight of their longer-term challenges: achieving strong and sustainable inclusive growth to provide employment for the rapidly growing labor force, especially for the youth; better fi scal management; and further development of the fi nancial system.
Increased Uncertainty, But Financial Windfalls The ripple effects of the political events in Tunisia and Egypt have spread in varying degrees to the oil exporters in the region, and many of these countries are responding with public spending and job-creation measures to alleviate social tensions. The social unrest also highlights the need to pursue fundamental economic reforms—social policy, fi scal management, governance, business environment, labor markets, fi nancial sector access—to facilitate more inclusive economic growth. The unrest has increased the assessment of risk in the region, but the consequential hike in oil prices has brought in windfall fi nancial benefi ts. Average spot oil prices, which had steadily increased by 25 percent to US$95 per barrel between August 2010 and January 2011, underpinned by fundamentals, shot up amid greater volatility to over US$110 per barrel during March (Figure 1.1). Prices increased further in early April, as social and political unrest intensifi ed in Libya, also placing increased emphasis on the role of other oil producers in stabilizing oil supplies (Box 1.1).1
Growth is likely to be uneven in 2011, but the GCC as a group is racing ahead. Average economic growth is expected to increase to 4.9 percent in 2011 for the MENAP oil exporters (excluding
Prepared by Ananthakrishnan Prasad and David Robinson with input from country teams.1 The earthquake in Japan in early March and subsequent concerns about the safety of nuclear energy plants add more uncertainty to the path for oil.
Libya) (Figure 1.2). Bahrain, Iran, Libya, Sudan, and Yemen are likely to be negatively affected, but the rest are expected to grow well above trend.2 In particular, the GCC is expected to show particularly strong growth of 7.8 percent in 2011, driven mainly by the oil sector as countries expand production, but also supported by high levels of public spending. The strongest performer is expected to be Qatar at 20 percent, underpinned by continued gas expansion and large public investments, followed by Saudi Arabia at 7.5 percent, where much of the increase is from enhanced oil production.3 Among the non-GCC countries, growth is expected to decline sharply in Libya, where the confl ict has severely disrupted the
2 The projections for the MENAP oil exporters for 2011 exclude Libya for all economic variables.3 If Saudi Arabia’s oil production were to remain unchanged at the level of January 2011, its forecasted growth rate would decline to 4.7 percent.
Figure 1.1Crude Oil Prices Rise Sharply(Millions of barrels per day)
96
106
116
30.0
30.5
31.0OPEC Supply
Oil Price (U.S. dollars per barrel, right scale)
Post Libya
56
66
76
86
28.0
28.5
29.0
29.5
Jan-10
Sources: International Energy Agency; and IMF staff estimates.
Mar-10 May-10 Jul-10 Sep-10 Nov-10 Jan-11 Mar-11

REGIONAL ECONOMIC OUTLOOK: MI DDLE EAST AND CENTRAL ASIA
16
hydrocarbon sector (accounting for over 70 percent of GDP and 90 percent or more of Libyan exports and government revenue).
Non-oil growth is expected to remain robust across countries (except in Iran), mainly as a result of additional fi scal spending (Figure 1.3). Growth in Iran is likely to remain below trend in 2011 as the economy responds to the implementation of energy subsidy reform that began in December 2010 and which is expected to have positive
long-term benefi ts (Box 3.2.3). In Sudan, the six-month transition period prior to the July 2011 independence of South Sudan could result in lower growth rates in 2011 (Box 1.2). The performance of the GCC countries will remain strong in 2011, with the exception of Bahrain, where uncertainties prevail. Robust non-oil growth in the region partly refl ects implementation of plans to promote economic diversifi cation—by amending foreign direct investment (FDI) laws, initiating public–private partnerships, and encouraging joint
Box 1.1
Stabilizing Global Oil Markets
The GCC has 41 percent of the world’s proven crude oil reserves, of which Saudi Arabia alone accounts for 21 percent. The GCC countries, particularly Saudi Arabia, have undertaken substantial investments to increase crude oil capacity—including in 2008 when oil prices fell sharply—providing a supply-side buffer to help smooth shocks in global oil markets. Indeed, OPEC and Saudi Arabia have stated that oil production will be expanded to meet any global shortfalls from supply disruptions. Several MENAP oil exporters (Algeria, Iraq, Kuwait, Saudi Arabia, the United Arab Emirates) have already responded to the global shortfall in oil supply following the unrest in Libya.
OPEC Crude Production(Millions of barrels per day)
Nov. 2010 Dec. 2010Change in Production (Dec. 2010–Feb. 2011)
Sustainable Capacity1
Spare Capacity vs. Feb. 2011
Algeria 1.27 1.27 0.01 1.31 0.03
Angola 1.66 1.62 -0.02 1.84 0.24
Ecuador 0.47 0.48 0.01 0.50 0.01
Iran 3.68 3.68 0.00 3.70 0.02
Iraq 2.42 2.45 0.23 2.75 0.07
Kuwait 2.29 2.30 0.08 2.55 0.17
Libya 1.56 1.56 -0.17 1.80 0.41
Nigeria 2.18 2.26 -0.10 2.50 0.34
Qatar 0.82 0.82 0.00 1.00 0.18
Saudi Arabia 8.50 8.50 0.40 12.10 3.20
United Arab Emirates 2.29 2.38 0.10 2.70 0.22
Venezuela 2.19 2.20 0.00 2.35 0.15
Memorandum ItemsTotal OPEC2 29.33 29.52 0.54 35.10 5.04Non-OPEC Supply3 53.00 0.11Global Oil Supply4 88.10 88.97Global Oil Demand5 87.90 89.40
Source: International Energy Agency.1Capacity levels can be reached within 30 days and sustained for 90 days.2Crude oil.3Includes crude oil, condensates, natural gas liquids, and oil from nonconventional sources.4Data relate to December 2010 and February 2011.5Average oil demand for the years 2010 and 2011.

1. MENAP OIL EXPORTERS: OPPORTUNITY TO PURSUE FUNDAMENTAL REFORMS
17
during the fi rst quarter of 2011—is immense (Figure 1.7).
The fi scal surplus is estimated to be about 7.5 percent of GDP in 2011, compared to 3.0 percent in 2010, despite higher discretionary spending measures announced by many of the oil exporters (Algeria, Bahrain, Kuwait, Oman, Saudi Arabia, Yemen) (Figure 1.8). However, this overall trend masks the actual fi scal stance of many countries, as measured by the non-oil fi scal and primary balances. The general government non-oil fi scal balance to non-oil GDP ratio is expected to deteriorate in Iraq, Kuwait, Oman, Saudi Arabia, Sudan, and Yemen (Figure 1.9).
Despite the Windfalls, Near-Term Policy Challenges RemainRisks to the outlook are on the downside and could intensify, particularly if the unrest becomes more widespread. The evolving security situation in Libya has already had spillover effects on the region through reduced remittances to Egypt and Tunisia, adding to the challenges facing these countries.5 Protracted unrest could adversely affect investor sentiment, weigh on private-sector activity
5 In 2010, Libya hosted about 1.5 million migrant workers, mainly from Egypt and Tunisia.
ventures. These measures aim to broaden the tax base and generate employment; joblessness remains high, particularly among the youth in many of these countries (Box 1.3).
Financial markets have taken a hit. Equity markets across MENAP oil exporters have fallen since January 11 (Figure 1.4), and some markets (Bahrain, Dubai) are now around the troughs in the aftermath of the 2008 global crisis. Sovereign credit default swap spreads have widened in all GCC countries after the current crisis (Figure 1.5), but are narrower than the post-global crisis levels. Rating agencies have downgraded Bahrain and Libya since the beginning of the unrest.
Fiscal and external balances are improving amid oil price uncertainty. Strong growth in oil revenue will generate substantial fi scal and current account surpluses in 2011. The current account surplus of the oil exporters (excluding Libya) in 2011 is projected at about US$378 billion, with the GCC countries accounting for about US$304 billion (Figure 1.6).4 Nevertheless, considerable uncertainty surrounds these projections. For the oil exporters as a group, revenue uncertainty—as measured by the difference in current account surpluses calculated at the low point of oil futures prices (US$88 per barrel) and the high point (US$114 per barrel)
4 This is based on an oil price assumption of US$107.16 per barrel for 2011.
Figure 1.2 Growth Is Progressing in MENAP Oil Exporters1
(Real GDP growth; percent)
Sources: National authorities; and IMF staff estimates.12011 data exclude Libya.
468
10
-8-6-4-202
2006
Oil GDP
Non-oil GDP
2007 2008 2009 2010 2011
Figure 1.3Non-Oil Sector Activity Remains Robust(Real non-oil GDP growth; percent)
Sources: National authorities; and IMF staff estimates.
6
8
102009 2010 2011
-2
0
2
4
GCC Algeria Iran Iraq Sudan Yemen

REGIONAL ECONOMIC OUTLOOK: MI DDLE EAST AND CENTRAL ASIA
18
Box 1.2
Sudan: Economic Challenges for North and South Sudan
The planned independence of South Sudan in July 2011 will have important macroeconomic implications. For the North, the loss of southern oil production will result in domestic and external imbalances. Preserving macroeconomic stability in the face of this permanent shock could be challenging, particularly at a time when the country has limited access to external fi nancing. For the South, the main challenges will be to build strong institutions with good governance, clear accountability, and transparency to ensure that the oil windfall is channeled toward promoting sustainable growth and reducing widespread poverty.
Impact on North Sudan
Independence will have an immediate impact on North Sudan’s fi scal and external revenues. Oil revenues, which constitute more than half of government revenues, could drop by about 75 percent (6 percent of GDP). About half of this revenue loss would be offset by the reduction in transfers to the South; hence the overall fi scal defi cit could widen by about 3 percentage points of GDP. The current account balance would deteriorate by about 4 percentage points of GDP over the next 2 years, refl ecting both a decline in oil exports—which constitute about 90 percent of exports—and an increase in petroleum product imports. Capital infl ows, including FDI, could decline in the short term, contributing to the emergence of a fi nancing gap that could reach 3–4 percent of GDP in 2012.
Challenges for South Sudan
An independent South Sudan will face several challenges, namely a total dependence on oil revenue (currently about 98 percent of government revenue), weak government institutions, the lack of infrastructure, and a dearth of trained civil servants. These challenges are compounded by the fact that about half of the South’s population lives below the national poverty line. Moreover, South Sudan lags far behind in most Millennium Development Goals relative to the North and other sub-Saharan African countries. To address these challenges, South Sudan will need to rely on substantial assistance from the international community in the years to come.
Status of Millennium Development Goals (MDGs) in Sudan in 2010
IndicatorsNorth Sudan
2015 Target
South Sudan
2015 Target
MDG 1 Eradicate Extreme Poverty and HungerEstimated poverty incidence (percent of total population) 47 23 51 45Prevalence of child malnutrition (underweight for age; percentage under 5) 32 16 48 24Proportion of population below minimum level of dietary energy consumption 28 14 47 11
MDG 2 Achieve Universal Primary EducationGross primary enrolment ratio 71 100 48 100Adult literacy rate 78 100 36 -
MDG 3 Promote Gender Equality and Empower WomenRatio of girls to boys in primary education 54 100 1 100Percentage of women in National Assembly/Council of States 25 - 32 -
MDG 4 Reduce Child MortalityUnder-5 mortality rate (per 1,000) 102 41 381 83Infant mortality rate (per 1,000 live births) 71 53 131 -One-year-olds immunized against measles 85 100 20 -
MDG 5 Improve Maternal HealthMaternal mortality ratio (per 100,000 live births) 638 134 1,989 1,680Birth attended by skilled health staff 57 90 10 -Antenatal care coverage (at least one visit and at least four visits) 70 - 16 -
MDG 7 Integrate the Principles of Sustainable Development into Country Policies and Programmes; Reverse Loss of Environmental Resources
Access to improved drinking water source (percent of population) 59 82 48 75Access to improved sanitation (percent of population) 40 67 6 53
Source: United Nations Development Programme, Sudan.
Prepared by Jemma Dridi.

1. MENAP OIL EXPORTERS: OPPORTUNITY TO PURSUE FUNDAMENTAL REFORMS
19
Box 1.3
Employment Creation in Oil Exporters
During the past decade, the MENAP oil exporters have created many jobs. In the GCC, job creation was mainly in the private sector and mostly for expatriates. Skill mismatches and sizable wage differentials between nationals and expatriate workers largely explain the low employment level of nationals in the private sector.
Providing employment for a growing population is the main medium-term challenge. Unemployment among nationals in some GCC countries (Oman, Saudi Arabia) and non-GCC countries (Algeria, Iraq) is relatively high, particularly among the youth.
Fostering an environment that encourages private-sector development is key to improving employment prospects. Diversifying the economy with a view to providing employment will hinge on the effectiveness of reforms in education, stepped-up training, and enhanced productivity. Merely raising minimum wages in the private sector, as was recently done in Oman, without accompanying measures, is unlikely to solve the problem of unemployment of the local population. Countries should continue to build on their reform agendas, raising the quality of human capital and improving the business environment.
Prepared by Joshua Charap, Ananthakrishnan Prasad, and Renas Sidahmed.
MENA Employment Creation1
(Millions)
2000 2009Annual percent
change
Algeria 6.2 10.2 7.1
Bahrain 0.2 0.4 16.1
Iran 15.6 18.0 1.7
Kuwait 1.2 2.1 8.2
Libya 1.4 1.6 1.2
Oman 0.7 1.1 8.0
Saudi Arabia 6.0 8.1 4.0
Sudan 8.7 12.0 4.2
United Arab Emirates 1.7 3.5 11.5
Source: IMF, World Economic Outlook.1Total employment.
GCC: Private and Public Sector Employment(Average; thousands of workers)
Source: National authorities.
1500
2000
Nationals
Expats
0
500
1000
2000 2009Private Private Public Public
(Bahrain, Libya, Oman, Yemen), and affect the cost and availability of fi nancing for the region as a whole. FDI and the nascent tourism sector will be adversely affected (Bahrain, Libya, Oman, Yemen), potentially setting back recent progress toward much-needed job creation and economic diversifi cation. Furthermore, equity price declines, if they persist, could dampen recovery in real estate markets and adversely affect fi nancial sector balance sheets (GCC countries). Nevertheless, there are positive spillovers from the GCC countries to the rest of the world (Box 1.4).
Short-term fi scal expansions have been fi nanced by higher oil revenues but may have permanently raised spending. Many MENAP oil exporters have ample fi scal space and have increased public spending in response to domestic unrest and increased uncertainty, and to cushion the impact of rising food and fuel prices (Figure 1.9). In Bahrain and Oman, the newly created Gulf Development Fund is expected to provide an additional US$10 billion to each country (40 percent of 2010 GDP in the case of Bahrain) to fi nance housing and infrastructure costs, effectively expanding fi scal

REGIONAL ECONOMIC OUTLOOK: MI DDLE EAST AND CENTRAL ASIA
20
Figure 1.6Current Accounts Improve Across the Board(Billions of U.S. dollars)
Sources: National authorities; and IMF staff estimates.
110
120
300
350GCC
80
90
100
150
200
250Non-GCC
Oil Price, right scale
50
60
70
0
50
100
40-502009 2010 2011
Figure 1.7Current Accounts Under Alternative Price Scenarios
Source: National authorities.1Minimum and maximum oil prices between Jan. 1, 2011 and Mar. 22, 2011.
100120140160
ALG
BH
R
IRN
IRQ
KW
T
OM
N
QAT
SA
U
SD
N
UA
E
Y
MN
-200
204060
C
urre
nt A
ccou
nt B
alan
ce
(bill
ions
of U
.S. d
olla
rs)
80
$88.42/barrel¹$107.16/barrel¹$114.36/barrel¹
Figure 1.8Fiscal Balances Improve(Percent of GDP)
$107.2
90100110120
8101214 GCC
Non-GCC Oil Price, U.S. dollars, right scale
$61.8
$79.0
304050607080
-6-4-20246
Sources: National authorities; and IMF staff estimates.
2009 2010 2011
Figure 1.9Non-Oil Fiscal Balances Expansionary(Percent of non-oil GDP)
Sources: National authorities; and IMF staff estimates.
-20
-10
0
-80
-70
-60
-50
-40
2009 2010 2011
GCC
Non-GCC
-30
Figure 1.4Stock Markets Have Fallen(Index; Oct 1, 2009 =100; Aug 31, 2008–Mar 28, 2011)
Source: Bloomberg.
160 DubaiAbu Dhabi TunisiaDubai Debt
120
140BahrainKuwaitOmanQatarSaudi ArabiaS&P 500
UnrestRestructuring
80
100
60
Oct-09 Jan-10 Apr-10 Aug-10 Nov-10 Mar-11
Source: Markit.
Figure 1.5CDS Spreads Have Widened(Basis points; Oct 1, 2009–Mar 28, 2011)
0
200
400
600
800
1,000
Oct-09 Jan-10 Apr-10 Aug-10 Nov-10 Mar-11
DubaiAbu DhabiBahrainQatarOmanSaudi Arabia
TunisiaUnrest
Dubai Debt Restructuring

1. MENAP OIL EXPORTERS: OPPORTUNITY TO PURSUE FUNDAMENTAL REFORMS
21
increase in oil prices is transitory. Iran (substantial subsidy reforms) and Qatar (increase in domestic petrol prices) are exceptions in that they are seeking to reduce distortions associated with large subsidies on domestic fuel prices.
Infl ation pressures are rising together with concerns about food security. Infl ation is expected to increase in almost all countries in 2011, to an average of 11 percent for the oil exporters as a group. The biggest increase is expected in Iran, due to the subsidy reform (Figure 1.10), but the GCC will also see a pickup in infl ation in 2011 to 5.3 percent from 3.2 percent in 2010 (Figure 1.11). The key driver of
space. Countries with little fi scal space, such as Iran, Sudan, and Yemen, had initiated measures—to enhance non-oil revenues and to contain spending and improve its quality—to narrow their fi scal defi cits in 2010–11. Newly announced measures attempt to dampen pressures from higher food prices, provide support to the unemployed, and alleviate housing constraints (Table 1.1). The cost of these measures ranges between 0.3 percent of GDP (for Algeria) and about 22 percent of GDP (for Saudi Arabia, spread over a number of years). Many of these measures are permanent, and scaling them back may be diffi cult, which might add to fi scal pressures in the future, particularly if the
Box 1.4
Spillovers from the GCC
The GCC has historically had important economic spillovers to the rest of the world. High levels of remittances and outward FDI from the GCC mitigated the impact of the global crisis on many countries in the region in 2008 and 2009. In addition, GCC imports, although not as signifi cant, continue to support the region’s exports.
Aid fl ows—mainly from Kuwait, Saudi Arabia, and the United Arab Emirates—have averaged about 1.5 percent of their combined gross national income between 1973 and 2008. Countries in the MENAP region have received between 10 percent and 70 percent of their total offi cial development assistance from other countries in the region.
Growth linkages between the GCC and the other countries in the region are also signifi cant. Estimates indicate that an increase of 1 percentage point in the GCC’s real GDP growth will increase GDP growth in migrant workers’ countries of origin by ¹⁄³ percentage point. High oil prices have provided an additional incentive to these countries to continue with their ongoing investment programs and to recycle their oil revenues abroad.
The outlook for remittances is clouded by new initiatives under consideration in some countries, such as Saudi Arabia, to provide greater incentives for the hiring of nationals in an attempt to reduce national unemployment.
Prepared by Ananthakrishnan Prasad.
GCC: Outward Spillovers to Rest of the World(Billions of U.S. dollars)
2008 2009 2010 20111
Outward remittances 52.9 60.4 65.6 74.9Outward FDI 38.6 16.0 20.9 42.7Imports 515.1 444.3 491.0 578.3Nonbank deposits 113.6 112.9 134.12
Sources: Bank for International Settlements; national authorities; World Bank; and IMF staff estimates.1IMF staff projections. 2Q3 2010.

REGIONAL ECONOMIC OUTLOOK: MI DDLE EAST AND CENTRAL ASIA
22
Oil exporters should monitor the second-round effects whereby food infl ation translates rapidly into nonfood infl ation. Some governments, particularly in the GCC (Kuwait, Qatar, Saudi Arabia, the United Arab Emirates), will need to carefully monitor the impact of expansionary fi scal spending on aggregate demand to prevent a resurgence of infl ationary pressures. So far, only Sudan has tightened monetary policy in response to emerging infl ationary pressures.
Medium Term: Outlook Good, But Deep Structural Reforms Needed Growth is expected to remain robust, with infl ation declining as the food and oil price shocks abate. Importantly, non-oil growth is expected to pick up,
Table 1.1
Summary of Recent Fiscal Policy Measures
Description of MeasureDate Announced
Estimated Fiscal Cost (Percent of GDP)
Nature of Measure
GCCBahrain • Provide cash transfers of US$2,660 each to families February 13, 2011 1.5 TemporaryKuwait • Provide free staple food to citizens for the next 14 months
together with cash transfersJanuary 17, 2011 Above 2.5 (magnitude
of food subsidy cannot be quantified at this
time)
Temporary
Oman • Employment for 50,000 Omanis; establishment of monthly unemployment benefit of US$390
February 27, 2011 1.25 Permanent
Saudi Arabia • Construct 500,000 housing units, build and expand hospitals March 18, 2011 Temporary• Pay a two-month salary bonus to state employees March 18, 2011 Temporary• Increase the public-sector minimum wage by 19 percent March 18, 2011 Permanent• Inject capital into specialized credit institutions to facilitate debt
write-offs and increase mortgage lending, provide affordable housing, and extend social insurance and unemployment benefits
February 23, 2011 Temporary
• Extend indefinitely the 15 percent inflation allowance for state employees that had been phased in over the past 3 years
November 2010 1.7 Permanent
United Arab Emirates
• Infrastructure stimulus program focusing on the northern emirates February 1, 2011 0.5 Temporary• 70 percent increase in pensions for military personnel February 1, 2011 Permanent• State subsidies for rice and bread February 1, 2011
Other Oil ExportersAlgeria • Temporary exemption in the tax burden on sugar and edible oil January 13, 2011 0.3 TemporaryYemen • Increase in public wages January 23, 2011 1.4 Permanent
• Expand coverage of the social welfare fund by 500,000 additional families
January 23, 2011 0.2
• Pay interim monthly stipend to new school graduates February 12, 2011 0.2 Temporary• Exempt students from paying tuition fees February 12, 2011 0.2• Reintroduce bonuses and allowances to civil servants February 12, 2011 1.0 Permanent• Hire 60,000 new graduates February 12, 2011 0.2 Permanent• Other February 13, 2011 0.3
Source: IMF staff estimates.
headline infl ation is food prices, but core infl ation is increasing in many countries, refl ecting a rise in infl ationary expectations.
Key grain prices, including those of corn and wheat, have risen sharply, heightening food security concerns, given that many MENAP oil exporters are among the largest importers of wheat in the world—Algeria and Iraq, respectively, rank third and ninth. World wheat prices rose by over 75 percent in the 12-month period ending on March 31, 2011. Larger harvests resulting from an increase in global acreage and less severe weather conditions should ease some market tightness over the next 12 months. Structural factors (changing diet patterns in emerging and developing economies, and the boom in biofuels that has buoyed the demand for feedback crops) have also contributed to rising demand for food.

1. MENAP OIL EXPORTERS: OPPORTUNITY TO PURSUE FUNDAMENTAL REFORMS
23
would help contain rapidly rising domestic energy consumption.
Heightened oil-price volatility has also reinforced the need to cast spending within a multi-year framework to ensure sustainability and improve demand management tools. One option for managing such volatility is to adopt a formal fi scal rule, perhaps involving a country-specifi c aggregate expenditure cast in a three-year rolling budget combined with a debt ceiling. In practice, most GCC countries simply base their budget on a conservative oil price, with no explicit guidance as to how or whether additional revenues will be spent. In addition to diminishing the relevance of the budget as a planning document and as an indicator of government priorities, reliance on within-year discretionary adjustments risks generating permanent entitlements that may be diffi cult to scale back in the event of lower oil prices. It may also magnify boom-bust cycles.
Financial sector stability and development. Over the medium term, the MENAP oil exporters should continue their efforts to promote the development of the fi nancial system, to improve its effi ciency and further increase its resilience. The banking sector remains broadly sound in the GCC countries because banks have high capital buffers, in some cases helped by large government capitalization (Qatar, the United Arab Emirates). Nevertheless,
which would typically be associated with increased employment opportunities. Nevertheless, lessons can be drawn from recent developments.
Inclusive growth. To be sustainable, growth strategies need to result in job creation and rising incomes for all segments of the population, and address unemployment and housing problems, especially for the youth. In this context, efforts to foster private-sector development should be sustained. Credit plays a vital role in private sector–led growth that should create employment. Ensuring sustainable credit growth with improved access, particularly to small- and medium-sized enterprises, is, therefore, a priority. The success of efforts to diversify the economy will also hinge on the effectiveness of reforms in education, stepped-up training for nationals, and enhanced productivity; competitiveness will be essential to sustaining inclusive growth.
Better fi scal management. Public spending has increased dramatically in recent years in many countries, often allocated toward growth-enhancing physical and social infrastructure. The quality of spending needs greater attention, including the continued strengthening of public fi nancial management. One step would be for additional countries in the region to move away from reliance on untargeted subsidies to more effi cient social safety nets. In particular, reforming universal fuel price subsidies
Figure 1.11GCC Headline Inflation(Consumer price index, year-on-year growth)
Source: National authorities.
15
10
20
25BHR KWT QAT OMN SAU UAE
0
5
-15
-10
-5
Feb-09 Jun-09 Oct-09 Feb-10 Jun-10 Oct-10 Feb-11
Figure 1.10Non-GCC Headline Inflation(Consumer price index, year-on-year growth)
Source: National authorities.
20
25ALG IRN IRQ SDN YMN
5
10
15
-10
-5
0
-15Feb-09 Jun-09 Oct-09 Feb-10 Jun-10 Oct-10 Feb-11

REGIONAL ECONOMIC OUTLOOK: MI DDLE EAST AND CENTRAL ASIA
24
will be needed to support the development of the fi nancial system and enhance its regulation and supervision, in order to improve its effi ciency and further increase its resilience. Supervisors in all countries should put in place incentives for banks to develop effi cient risk management practices. Particularly important are steps to enhance access to credit for small and medium-sized enterprises, the promotion of appropriate instruments for housing fi nance, and development of domestic debt markets to provide the basis for long-term fi nancing. In the more developed fi nancial systems, existing macroprudential tools should be further refi ned to manage the credit cycle without fueling infl ation, particularly in countries, such as those of the GCC, where monetary policy is constrained by a currency peg.
potential vulnerabilities could emerge through spillovers from the nonbank fi nancial sector to the banking sector (Kuwait), the overhang of the real estate sector (Bahrain, the United Arab Emirates), and the interconnectedness between the different segments of the banking system (wholesale and retail banks in Bahrain). Resolution of nonperforming loans of banks in many non-GCC countries (Algeria, Iran), and restructuring of banks (Iraq, Sudan) require continued attention. Finally, debt restructuring in Dubai may imply postponing the realization of losses and a new bout of rollover risk in a few years, especially if asset prices fail to recover as anticipated.
Credit to the private sector began to pick up in 2010 in several countries—including the GCC countries, Algeria, and Yemen. Continued efforts

1. MENAP OIL EXPORTERS: OPPORTUNITY TO PURSUE FUNDAMENTAL REFORMS
25
Selected Economic Indicators: MENAP Oil Exporters1
Average Proj.2000–05 2006 2007 2008 2009 2010 2011
Real GDP Growth 5.6 5.7 6.2 4.7 0.7 3.5 4.9(Annual change; percent)
Algeria 4.5 2.0 3.0 2.4 2.4 3.3 3.6Bahrain 6.0 6.7 8.4 6.3 3.1 4.1 3.1Iran, I.R. of 5.5 5.8 7.8 1.0 0.1 1.0 0.0Iraq … 6.2 1.5 9.5 4.2 0.8 9.6Kuwait 7.1 5.3 4.5 5.0 -5.2 2.0 5.3Libya 4.3 6.7 7.5 2.3 -2.3 4.2 …Oman 3.3 5.5 6.7 12.9 1.1 4.2 4.4Qatar 8.7 18.6 26.8 25.4 8.6 16.3 20.0Saudi Arabia 4.0 3.2 2.0 4.2 0.6 3.7 7.5Sudan 6.4 11.3 10.2 6.8 6.0 5.1 4.7United Arab Emirates 8.1 8.8 6.5 5.3 -3.2 3.2 3.3Yemen 4.5 3.2 3.3 3.6 3.9 8.0 3.4
Consumer Price Inflation 5.9 8.8 11.2 14.8 5.8 6.8 10.9(Year average; percent)
Algeria 2.3 2.3 3.6 4.9 5.7 4.3 5.0Bahrain 0.7 2.0 3.3 3.5 2.8 2.0 3.0Iran, I.R. of 13.5 11.9 18.4 25.4 10.8 12.5 22.5Iraq 19.8 53.2 30.8 2.7 -2.8 5.1 5.0Kuwait 1.7 3.1 5.5 10.6 4.0 4.1 6.1Libya -3.3 1.4 6.2 10.4 2.8 2.4 …Oman 0.1 3.4 5.9 12.6 3.5 3.3 3.5Qatar 3.5 11.8 13.8 15.0 -4.9 -2.4 4.2Saudi Arabia -0.1 2.3 4.1 9.9 5.1 5.4 6.0Sudan 7.6 7.2 8.0 14.3 11.3 13.0 9.0United Arab Emirates 3.6 9.3 11.1 12.3 1.6 0.9 4.5Yemen 11.6 10.8 7.9 19.0 3.7 12.1 13.0
General Government Fiscal Balance 5.8 13.2 10.3 12.9 -2.7 3.0 7.5(Percent of GDP)
Algeria 6.6 13.5 4.4 7.7 -6.8 -2.7 5.0Bahrain2 1.4 2.7 1.9 4.9 -6.6 -7.8 1.6Iran, I.R. of 2.0 0.0 2.4 -0.2 -1.9 0.6 4.0Iraq … 15.5 12.4 -1.2 -21.8 -10.8 -4.4Kuwait2 27.2 35.4 39.8 19.8 23.5 17.4 22.3Libya 12.6 33.1 28.6 30.3 7.0 9.2 …Oman2 8.4 13.8 11.1 13.8 -1.2 6.2 14.2Qatar 8.8 8.6 10.8 10.3 15.2 12.8 13.8Saudi Arabia 7.7 24.6 15.8 34.4 -4.7 7.7 12.8Sudan -0.6 -4.3 -5.4 -1.4 -4.6 -1.9 -0.2United Arab Emirates3 4.5 18.1 15.4 16.5 -12.6 -1.3 6.5Yemen 0.0 1.2 -7.2 -4.5 -10.2 -4.0 -6.4
Current Account Balance 11.2 21.9 17.9 18.8 4.2 9.2 16.9(Percent of GDP)
Algeria 14.0 24.7 22.8 20.2 0.3 9.4 17.8Bahrain 5.0 13.8 15.7 10.2 2.9 4.6 13.0Iran, I.R. of 5.2 9.2 11.9 7.3 4.2 6.0 11.7Iraq … 19.0 12.5 12.8 -26.6 -6.2 -3.2Kuwait 26.2 44.6 36.8 40.5 26.1 31.8 39.4Libya 18.9 49.7 41.7 41.7 15.6 16.0 …Oman 9.4 15.4 5.9 8.3 -0.6 11.6 14.9Qatar 25.2 25.3 25.0 29.2 10.2 18.7 36.1Saudi Arabia 13.6 27.8 24.3 27.8 6.1 8.7 19.8Sudan -9.5 -15.2 -12.5 -9.0 -12.4 -8.5 -5.5United Arab Emirates 7.7 15.4 6.0 7.4 3.0 7.7 10.4Yemen 5.3 1.1 -7.0 -4.6 -10.2 -4.4 -4.0
Sources: National authorities; and IMF staff estimates and projections.12011 data exclude Libya. 2Central government.3Consolidated accounts of the federal government and the emirates Abu Dhabi, Dubai, and Sharjah.


27
2. MENAP Oil Importers: Winds of ChangeSocial unrest and change are sweeping through many countries in the region. While economic spillovers to other MENAP oil importers from the unrest that began in Egypt and Tunisia have so far been limited, popular protests across the region point to a need for more inclusive growth and broader ownership of the reform agenda. Unrest has clouded the near-term outlook and added to the urgency of addressing high unemployment and improving social safety nets. Over time, a more open business environment that leverages the region’s young and dynamic population would unleash faster and more sustainable improvements in living standards.
Before the ProtestsDuring 2009 and 2010, the region’s economies were generally growing at a moderate but steady pace. Limited exposure to international capital markets insulated these countries from much of the impact of the global fi nancial crisis, and ongoing reforms to liberalize economic activity helped uphold growth. In Egypt, Jordan, Morocco, and Tunisia—the four MENAP oil importers with quarterly national accounts—combined 2010 third-quarter output was 4.7 percent higher than a year earlier, with Egypt taking the lead at close to 5½ percent. Altogether, MENAP oil importers’ economies are estimated to have grown by that same 4.7 percent in both 2009 and 2010, close to the average over the previous decade (Figure 2.1).
Steady recent economic expansion notwithstanding, the social unrest highlights the need for higher and more inclusive growth. Although economic activity had picked up compared to the 1990s, MENAP oil importers’ growth during the 2000s was lower on a per capita basis than that of most other regions (Figure 2.2). Over the past decade, their real GDP per capita growth averaged about 3 percent a year compared to almost 5 percent for emerging and developing economies overall. Moreover, there was an increasing sense that the region’s business environments were suffering from unfair competition, with systems rigged to benefi t a privileged few and gains from higher growth being captured by a small segment of the population. High unemployment has remained a major
challenge. The increase in growth during the past decade was not suffi cient to reduce unemployment, averaging about 12 percent in a labor force that has
Figure 2.1Real GDP Growth Largely Flat in 2010(Annual percentage change)
Sources: National authorities; and IMF staff calculations.
8
10200920102011
20.9
2
4
6
-2
0
Total AFG DJI EGY JOR LBN MRT MAR PAK SYR TUN
Figure 2.2Income Growth Lagging Other Emerging Markets(Annual average percentage change in real GDP per capita)
2
4
6
81990s2000s
-2
0
2
-9.8
Adv
ance
d E
cono
mie
s
Cen
t. &
Eas
t. E
urop
e
Com
mon
wea
lth o
fIn
depe
nden
t Sta
tes
Dev
elop
ing
Asi
an
Sub
-Sah
aran
Afri
can
Wes
tern
Hem
isph
ere
Em
er.&
Dev
el. E
con.
ME
NA
P O
il Im
porte
rs
Sources: National authorities; and IMF staff calculations.
Prepared by Tobias Rasmussen with input from country teams.

REGIONAL ECONOMIC OUTLOOK: MI DDLE EAST AND CENTRAL ASIA
28
grown more rapidly than in all other regions save sub-Saharan Africa. Unemployment is especially high among the young—with youth unemployment at 25–30 percent in Egypt and Tunisia—leaving many feeling excluded from economic progress.
The popular uprisings, the subsequent downfall of governments in Tunisia and Egypt, and violent protests in a number of other MENAP oil importers have shaken the existing order across the region. With this change comes the challenge of putting economies back on track, but also the opportunity to turn to a path of more inclusive growth.
Temporary Toll on Region’s EconomiesIn Tunisia and Egypt, unrest will have a substantial economic cost. Aside from domestic disturbances,
these countries are also suffering more than the other oil importers from strife in neighboring Libya and the resultant return of more than 100,000 migrant workers. In Egypt and Tunisia, output growth is projected to slow by 2–4 percentage points in 2011, due to the temporary disruptions to economic activity as well as a virtual standstill in tourism and foreign direct investment (FDI) (Box 2.1). Both countries have also seen their fi scal defi cits widen (in 2011 to a projected 9.7 percent of GDP in Egypt and 4.3 percent of GDP in Tunisia), as expenditures have increased in response to growing needs and higher borrowing costs, while revenues have suffered from lower economic growth and lower collection rates.
Disruption to economic activity in other MENAP oil importers has so far been more limited. Interruptions to gas deliveries from Egypt created some hardship in Lebanon and Jordan,
Box 2.1
Political Unrest Shakes Egyptian and Tunisian Economies
The civil unrest and subsequent political changes in Egypt and Tunisia will temporarily slow growth in 2011. The slowdown refl ects disruptions to activity during the protests in January–February, uncertainty about future governments and their economic policy course, the impact of the confl ict in Libya, and setbacks in tourism and FDI. In Egypt, real GDP growth is projected to slow to 1 percent in 2011 from 5.1 percent in 2010, and in Tunisia, growth is likely to fall to 1.3 percent in 2011 from 3.7 percent in 2010.1
During the weeks of demonstrations, economic activity was sharply reduced.
• In Egypt, tourism collapsed, and investor and consumer confi dence was shaken. Banks and the stock exchange closed. As the demonstrations wound down, a series of labor strikes for higher wages began, mainly affecting the public sector. Personal security deteriorated as the police force largely disappeared.
• In Tunisia industrial production declined by 13 percent in January, and tourism by 40 percent in January–February. On the whole, disruptions to economic activity have been milder and more short-lived than in Egypt.
In both countries, the security situation—although improved since early 2011—remains fragile, and uncertainty continues to weigh on the outlook. In Egypt, parliamentary and presidential elections are planned for September and November, respectively, and in Tunisia a provisional government currently holds power until elections at end-July. Still, political tensions remain high and the armed confl ict in neighboring Libya has added to the risks surrounding the region.
Elevated insecurity in the region will continue to affect tourism and domestic and foreign direct investment in the months to come. For 2011 as a whole, receipts from tourism are projected to decline in both countries by up to 1 percent of GDP, and FDI by between 1 and 2 percent of GDP.
1 In Egypt, the fi scal year runs July–June. 2011 refers to July 2010–June 2011.

2. MENAP OIL IMPORTERS: WINDS OF CHANGE
29
GDP. Moreover, aside from Egypt and Tunisia, oil importers’ links to Libya are minimal. For most oil importers, the main cost from instability in the region has been an increase in global oil prices and setbacks to tourism and capital fl ows, which, in a few cases, have led to a loss of offi cial reserves. Increased political tension in the region will reduce
but supplies have been restored. More generally, limited economic ties among oil importers imply relatively little direct transmission of reduced economic activity. It is striking that within the group, Jordan and Syria are the two largest exporters of goods to Egypt and Tunisia, but these exports represent only about 0.5 percent of their
Box 2.2
Tourism Takes a Break
Spillovers from the unrest in Egypt, Libya, and Tunisia to tourism in other oil importers could be substantial, but are likely to vary along geographic lines (Figure 1). Other North African countries have traditionally catered to the same predominantly European market as have Egypt and Tunisia and may therefore see a similar, although much more muted, decline in tourist activity. Morocco’s tourism revenues continued to grow in February–March, but early indicators suggest a possible reversal. Closer to the Arabian Gulf, Jordan and Lebanon are the region’s two most tourism-dependent economies. But their visitors, who are primarily from other Arab countries, have exhibited resilience to turbulence in the past; arrivals in Lebanon continued unabated during the May 2008 turmoil (Figure 2).
Past experience suggests that the region’s tourism industry could recover quickly. Following the November 1997 terrorist attacks in Luxor, tourist arrivals in Egypt fell by about half, but fully recovered after about one year. More generally, analysis of how tourism has responded to outbreaks of violence indicates that the effect is transitory, with a recovery time ranging between 2–3 months and 18–21 months.1 A key question, particularly for Tunisia (where the third quarter, on average, has accounted for almost 40 percent of total annual arrivals compared to 30 percent in Egypt), is whether visitors will return in time for the peak summer season.
1 See e.g., B. S. Frey, S. Luechinger, and A. Stutzer, 2007, “Calculating Tragedy: Assessing the Costs of Terrorism,” Journal of Economic Surveys 21: 1–24; and E. Neumayer, 2004, “The Impact of Political Violence on Tourism: Dynamic Cross-National Estimation,” Journal of Confl ict Resolution 48: 259–281.
Figure 1Tourism Receipts and Employment, 2010
Morocco
Jordan
Lebanon
Egypt
Bahrain
Tunisia
Syria
Employment in tourism as percent of total
0 5 10 15 20 25 30 35 40
OmanTourism receipts as percent of GDP
Sources: IMF, World Economic Outlook; and World Travel and Tourism Council.
Figure 2Tourism by Source(Latest available year)
Syria
Jordan
Egypt
Tunisia
Lebanon
0% 20% 40% 60% 80% 100%
Morocco
Europe and America Middle East and North Africa Other
Sources: Central Bank of Egypt; Haver Analytics; Morocco PlanningCommission; Syria Ministry of Tourism; and IMF staff estimates.Notes: For Egypt, Morocco, and Tunisia: shares of tourist nights spent. ForLebanon and Syria: share of tourist arrivals. For Jordan: share of non-Jordanian arrivals, with Europe including only Britain and Germany.
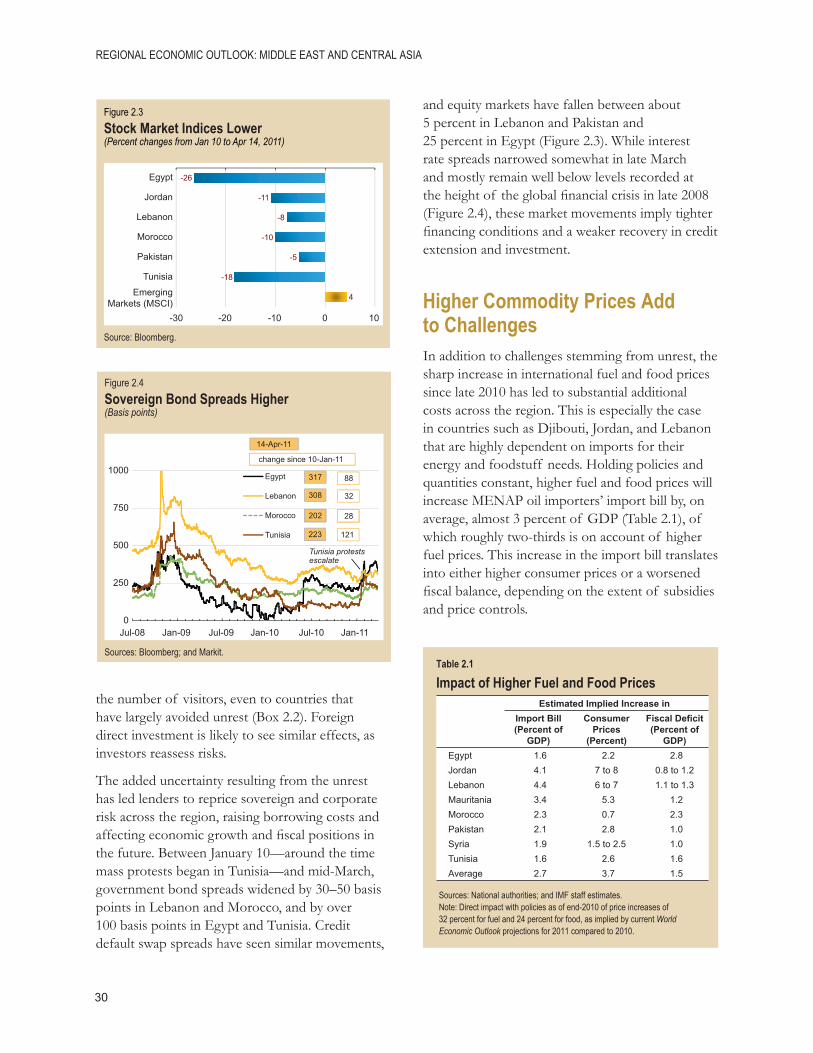
REGIONAL ECONOMIC OUTLOOK: MI DDLE EAST AND CENTRAL ASIA
30
and equity markets have fallen between about 5 percent in Lebanon and Pakistan and 25 percent in Egypt (Figure 2.3). While interest rate spreads narrowed somewhat in late March and mostly remain well below levels recorded at the height of the global fi nancial crisis in late 2008 (Figure 2.4), these market movements imply tighter fi nancing conditions and a weaker recovery in credit extension and investment.
Higher Commodity Prices Add to ChallengesIn addition to challenges stemming from unrest, the sharp increase in international fuel and food prices since late 2010 has led to substantial additional costs across the region. This is especially the case in countries such as Djibouti, Jordan, and Lebanon that are highly dependent on imports for their energy and foodstuff needs. Holding policies and quantities constant, higher fuel and food prices will increase MENAP oil importers’ import bill by, on average, almost 3 percent of GDP (Table 2.1), of which roughly two-thirds is on account of higher fuel prices. This increase in the import bill translates into either higher consumer prices or a worsened fi scal balance, depending on the extent of subsidies and price controls.
the number of visitors, even to countries that have largely avoided unrest (Box 2.2). Foreign direct investment is likely to see similar effects, as investors reassess risks.
The added uncertainty resulting from the unrest has led lenders to reprice sovereign and corporate risk across the region, raising borrowing costs and affecting economic growth and fi scal positions in the future. Between January 10—around the time mass protests began in Tunisia—and mid-March, government bond spreads widened by 30–50 basis points in Lebanon and Morocco, and by over 100 basis points in Egypt and Tunisia. Credit default swap spreads have seen similar movements,
Table 2.1
Impact of Higher Fuel and Food PricesEstimated Implied Increase in
Import Bill(Percent of
GDP)
Consumer Prices
(Percent)
Fiscal Deficit(Percent of
GDP)Egypt 1.6 2.2 2.8Jordan 4.1 7 to 8 0.8 to 1.2Lebanon 4.4 6 to 7 1.1 to 1.3Mauritania 3.4 5.3 1.2Morocco 2.3 0.7 2.3Pakistan 2.1 2.8 1.0Syria 1.9 1.5 to 2.5 1.0Tunisia 1.6 2.6 1.6Average 2.7 3.7 1.5
Sources: National authorities; and IMF staff estimates.Note: Direct impact with policies as of end-2010 of price increases of 32 percent for fuel and 24 percent for food, as implied by current World Economic Outlook projections for 2011 compared to 2010.
Figure 2.3Stock Market Indices Lower(Percent changes from Jan 10 to Apr 14, 2011)
-26
-11
-8
Egypt
Jordan
Lebanon
-10
-5
-18
Morocco
Pakistan
Tunisia
4
-30 -20 -10 0 10
EmergingMarkets (MSCI)
Source: Bloomberg.
Figure 2.4Sovereign Bond Spreads Higher(Basis points)
Sources: Bloomberg; and Markit.
14-Apr-11
750
1000Egypt
Lebanon
Morocco
317
change since 10-Jan-11
88
308 32
202 28
250
500Tunisia 223 121
Tunisia protests escalate
0Jul-08 Jan-09 Jul-09 Jan-10 Jul-10 Jan-11

2. MENAP OIL IMPORTERS: WINDS OF CHANGE
31
However, higher commodity prices are not all bad for MENAP oil importers. Export receipts from iron ore in Mauritania and phosphate rock in Morocco and Jordan have benefi ted from price increases of about 80 percent since end-2009. Moreover, greater trade and remittance receipts from oil exporters within the region—who are benefi ting from higher oil prices—are likely to offset some of the negative impact of rising commodity prices (Box 2.3). This offset will be more pronounced for Mashreq countries, whose links to the fast-growing oil exporters in the Gulf are stronger than are those of Maghreb countries (Figure 2.5). In Tunisia and Morocco 70–80 percent of exports are directed to the European Union, whereas the majority of Jordan and Syria’s external receipts are from regional oil exporters.
Policy Responses Come at a Fiscal Cost…Governments throughout the region have introduced a range of measures in response to higher fuel and food prices and to social demands (Table 2.2).
• In Egypt, measures include advancing a 15 percent increase in government wages and pensions, the creation of a fund for reconstructing small enterprises, and a higher budgetary allocation for wheat imports.
• Jordan has raised allocations for social protection and announced cuts to taxes on fuel and foodstuffs, additional subsidies, and increased civil service salaries and pensions.
• In Lebanon, the excise tax on gasoline was reduced by about 55 percent in February.
• In Pakistan, regular monthly adjustments of petroleum product prices were suspended between November 2010 and March 2011.
• Syria has increased allowances for public sector employees, upped cash transfers to poor households, and reduced taxes on some food
products. Since late March 2011, the government has announced additional measures, including a reduction in income tax rates, an increase in the minimum wage, and the extension of full health coverage to civil service pensioners.
• In Tunisia, the interim government has increased transfers to the unemployed and the poorest segments of the population, suspended adjustments in regulated prices, extended subsidies, and scaled up public investment.
These new measures are in addition to the higher cost of maintaining existing subsidy systems, which, with an average cost of about 3 percent of GDP in 2010, are large by international standards. Morocco, for example, is facing an increase in the cost of existing subsidies of about 2 percent of GDP to be fi nanced within the 2011 budget. Although most other countries will also at least partly offset greater spending on social protection with cuts elsewhere, the net effect is a widening of MENAP oil importers’ combined overall fi scal defi cit to a projected 6.8 percent of GDP in 2011 (Figure 2.6).
…But Higher Spending Will Support Near-Term GrowthWith fi scal stimulus helping offset more adverse economic conditions—outside of Egypt and
Figure 2.5Real GDP Growth of Trading Partners Differs(Weighted by goods exports shares; percent, 2011)
Source: IMF, World Economic Outlook.
6
7
2
3
4
5
0
1
TUN MAR EGY DJI PAK LBN AFG MRT SYR JOR

REGIONAL ECONOMIC OUTLOOK: MI DDLE EAST AND CENTRAL ASIA
32
Box 2.3
Oil Prices and Intraregional Linkages
Oil price changes have a large impact on MENAP oil importers’ economies. On average, oil imports cost them almost 6 percent of GDP in 2010, about twice the world average (Figure 1). Consequently, if volumes remain unchanged, a 35 percent increase in the price of oil imports—roughly equal to the increase from the 2010 average price of crude to the projected price for 2011 of about US$107 per barrel—would cause their import bill to increase by 2.1 percent of GDP. Not all countries are equally oil dependent, however. Owing to its growing production of natural gas, Egypt’s oil imports, at 2½ percent of GDP in 2010, have dropped below the world average. Syria is also partially self-suffi cient in hydrocarbons, although not to the extent it was in the 1990s. Jordan and Lebanon, in contrast, depend on foreign supplies for almost all their energy needs, and their oil imports are much higher, at over 10 percent of GDP.
Despite large import needs, history shows that higher oil prices are not all bad news for MENAP oil importers. During 12 oil price shocks since 1970, even as they paid more for oil imports, MENAP oil importers’ exports—and to a lesser extent FDI and remittances infl ows—also increased, offsetting much of the higher import bill (Figure 2). For commodity exporters—Mauritania and to a lesser extent Jordan and Morocco—the increase in exports partly refl ects a positive correlation between the price of oil and prices of other commodities. At the same time, the additional infl ows also partly refl ect linkages to regional oil exporters that gain when oil prices increase. It is notable that the two MENAP oil importers with the largest ratio of oil imports to GDP—Jordan and Lebanon—are also the economies most connected to the region’s oil exporters, and where past episodes of oil price shocks have been associated with some of the largest increases in external receipts.
Prepared by Tobias Rasmussen and Agustín Roitman.
Figure 1Value of Oil Imports, 2010(Percent of GDP)
10
12
4
6
8
0
LBNJO
R DJIMAR
MRTTUN
SYRPAK
MENAP Oil Im
porters
World EGY
2
Source: IMF, World Economic Outlook.
Figure 2Balance of Payment Changes During Oil PriceShocks Since 1970(Median change in ratio to GDP from year earlier; percentage points)
Sources: IMF, World Economic Outlook; and IMF staff estimates.Note: Oil price shocks identified as years when the nominal US dollar priceof crude oil deflated by US CPI reaches a 3-year high. There have been12 such years since 1970: 1973, 74, 79, 80, 90, 96, 2000, 04, 05, 06, 07, 08,during which real oil prices increased by an average of 46 percent. Other ermerging markets are 53 IMF member countries not classified as low-income, advanced, or oil-exporting economies.
6
7Imports of goods and services
Exports of goods and services
2
3
4
5FDI
Remittances
0
1
LBNJO
RMAR
MRTTUN
SYRPAK
MENAP Oil Im
porters
Other EMs
EGY

2. MENAP OIL IMPORTERS: WINDS OF CHANGE
33
Table 2.2
Fiscal Policy Measures Announced Since Late 2010
SubsidiesSocial Welfare and/or Cash Transfers
Government Salary/Benefit Increases
Tax Breaks or Other
Annual Cost(Percent of GDP)
Egypt 0.7 to 0.9Jordan 2.0 to 2.2Lebanon 1.0Mauritania 1.5 to 2.2Pakistan 0.3Syria 2.0Tunisia 1.4
Sources: National authorities; and IMF staff estimates.Notes: Annual cost does not include higher costs of preexisting subsidies owing to higher commodity prices. Cost estimate for Syria does not include the additional measures announced since late March.
Tunisia—output growth in 2011 in most of the rest of the region is still, for the most part, projected to be on par with or higher than in 2010.
• In Afghanistan, output is projected to increase by a still strong 8 percent in 2011, driven by high levels of external assistance.
• In Djibouti, real GDP growth is projected to increase to 4.8 percent in 2011 from 4.5 percent in 2010 due to continued strong private demand and activity at the port.
• Jordan’s recovery remains on track, with slowly rising domestic activity, a pickup in credit, and output growth projected to reach 3.3 percent in 2011.
• In Mauritania, the only MENAP oil importer to see negative growth in 2009, 2011 growth is projected to reach 5.2 percent, with iron ore exports leading the recovery.
• In Morocco, a strong recovery in agriculture as well as subsidies and other policies to buttress domestic demand have supported an increase in overall output, with growth projected to reach 3.9 percent in 2011.
• In Syria, the ongoing economic expansion in neighboring oil exporters and a recovery in the agricultural sector are helping hold up growth at a projected 3 percent in 2011, despite some disruption from recent protests.
Figure 2.6New Fiscal Costs(Percent of GDP)
Sources: National authorities; and IMF staff calculations.
0
2
4
6
8
10
12
EGY
Additional fiscal measures
Impact of higher fuel and food prices,holding all else constantOverall fiscal deficit, 2011
JOR LBN MRT MAR PAK SYR TUN
In contrast, Lebanon and Pakistan are projected to record markedly lower growth in 2011 than in 2010, but primarily for reasons unrelated to regional unrest.
• Lebanon’s economy, which continued to expand strongly through the global crisis in 2008–09, is projected to see growth fall to 2.5 percent in 2011, mainly as a result of political uncertainty, which predates and is unrelated to the events in Egypt and Tunisia.
• In Pakistan, real GDP growth is projected to fall to 2.8 percent in FY2010/11, largely as a consequence of last year’s devastating fl oods, but also on account of high fi scal defi cits that are crowding out private-sector credit and investment.

REGIONAL ECONOMIC OUTLOOK: MI DDLE EAST AND CENTRAL ASIA
34
defi cit is an added concern, is the only country in the group to have raised policy rates in the past year, but others may soon need to follow suit.
On the positive side, nominal exchange rate depreciation in almost all MENAP oil importers is helping offset lingering competitiveness problems (Figure 2.8). In countries with fi xed exchange rates, currency movements have been driven by the weakening of the U.S. dollar against other major currencies since mid-2010. Egypt and Mauritania have taken a welcome step toward greater exchange rate fl exibility. These depreciations have helped offset the previous appreciation of most oil importers’ real effective exchange rates, which—particularly in Egypt—had become a concern.
Economic Policy Space Is TightWhile several oil importers have some room to relax fi scal policy in the near term, fi nancing in some countries may require external assistance. Higher interest rates and diminished prospects for new external bond issuance have made funding more costly and more diffi cult. Moreover, MENAP oil importers’ public debt levels—although in all cases lower than a decade ago—mostly remain well above the 35 percent of GDP average for emerging markets, limiting the scope for additional borrowing. For countries with large budget defi cits and which have been hard hit by unrest, external assistance may be needed to help bridge immediate fi nancing gaps.
To bolster market confi dence and prevent further escalation of the cost of funding, all countries would benefi t from formulating plans for a return to fi scal consolidation over the medium term. The recent fi scal policy measures also highlight the need to develop better-targeted social protection mechanisms (Chapter 3.3). In the short term, increasing subsidies or raising government wages may be the only feasible mechanisms for providing quick relief to the population. However, such measures are not well targeted to the neediest, can be diffi cult to reverse, and may crowd out growth-enhancing public investment. Replacing them over time with a more cost-effective system of social protection, focused on assisting low-income households, will lead to a more effi cient allocation of resources and will work toward the overriding goals of raising and sustaining living standards and generating lasting employment.
For monetary policy, room to maneuver is similarly limited. With interest rates going up globally and the recent increase in their own risk premiums, MENAP oil importers may need to raise policy rates. Moreover, while only Egypt and Pakistan—and, more recently, Afghanistan—are registering annual headline infl ation above 10 percent, commodity price increases are adding to price pressures in all countries and already appear to be feeding into higher core infl ation (Figure 2.7 and Box 2.4). Pakistan, where monetization of the fi scal
14
15
16
9
10
11MENAP Oil importers: Overall CPICore CPIFood CPI (right scale)
10
11
12
13
5
6
7
8
Jan-10 Mar-10 May-10 Jul-10 Sep-10 Nov-10
Sources: Haver Analytics; and national authorities.¹Excludes Djibouti and Mauritania as data were unavailable.
Figure 2.7Inflationary Pressures(Consumer prices¹; period average, annual percent change)
Figure 2.8Nominal Exchange Rates Have Depreciated(Percent changes since June 2010; increase represents appreciation)
Source: IMF, World Economic Outlook.
02468
Inflation differentialNominal effective exchange rateReal effective exchange rate
-10-8-6-4-2
-12DJI MRT JOR LBN TUN EGY SYR MAR PAK

2. MENAP OIL IMPORTERS: WINDS OF CHANGE
35
Box 2.4
Monetary Policy Response to MENAP Food Infl ation
Food infl ation in MENAP countries is higher, more volatile, and more persistent than nonfood infl ation, and the weight of food in national consumption baskets is typically very large. Moreover, there are substantial second-round effects whereby food infl ation propagates rapidly into nonfood infl ation. Accordingly, monetary policy needs to focus on keeping headline infl ation well anchored.
Infl ation developments in many emerging and developing countries (including MENAP) can be characterized by three key stylized facts. First, the weight of food in the consumer price index is large (averaging about 36 percent in MENAP; see Figure). Second, food infl ation is higher, more volatile, and more persistent than nonfood infl ation (see Table). Third, so-called second-round effects, where food infl ation propagates into nonfood infl ation, appear to be strong. For MENAP countries, about half of a given shock to food infl ation in the current quarter is transmitted to nonfood infl ation in the following quarter.
Monetary policymakers and central banks often focus on a narrow measure of infl ation—for example, nonfood infl ation—constructed by the exclusion or down-weighting of volatile components (such as food prices). In principle, such a focus reduces transitory noise, and prevents central banks from erroneously changing monetary policy in response to temporary infl ation shocks. However, in the context of the large share of food in most MENAP consumption baskets, focusing primarily on movements in nonfood infl ation can provide a distorted picture of overall infl ation in an economy, underestimate infl ationary pressures, delay needed monetary policy responses, and may increase infl ation expectations. Accordingly, when setting the stance of monetary policy, regional central banks should look not only at nonfood infl ation, but should also pay greater attention to headline infl ation.
Prepared by Paul Cashin and Agustín Roitman.
40506070
Advanced economiesMENAP oil importers MENAP oil exporters
0102030
UA
E
Iran
Iraq
U.S
.
Leba
non
Tuni
sia
Djib
outi
Jord
anM
oroc
coE
gypt
Pak
ista
nS
yria
Mau
ritan
iaA
fgha
nist
an
Qat
ar
Kuw
ait
Sau
di A
rabi
a
Bah
rain
Om
anA
lger
iaLi
bya
Yem
enS
udan
Eur
o ar
eaO
EC
D a
vera
ge
Weight of Food in the Consumer Price Index, 2010(Percent)
Sources: Eurostat; national authorities; Organisation for Economic Co-operation and Development; and IMF staff calculations.
Average Annualized Inflation for MENAP Countries(Percent, 1994–2011)
Food NonfoodAverage 13 9Volatility 33 20Persistence 0.14 0.09
Sources: National authorities; and IMF staff calculations.Note: Volatility is measured using the standard deviation; persistence is measured by the first-order autoregressive coefficient.
The Road AheadWith the region undergoing unprecedented change, the outlook for MENAP oil importers is unusually uncertain. For the near term, risks are mainly on the downside, including the possibility of spreading unrest, sharply higher oil prices, and
rising fi scal defi cits. Moreover, further deterioration of investor confi dence and associated capital outfl ows could leave governments short of needed fi nancing. While banking systems—aside from Afghanistan’s—have so far been resilient, the prospect of more nonperforming loans arising from the turbulence is also a potential vulnerability.

REGIONAL ECONOMIC OUTLOOK: MI DDLE EAST AND CENTRAL ASIA
36
economic growth. Continued care to maintain macroeconomic stability, coupled with reforms to remove deep-seated obstacles that are holding back the region’s economies, could soon produce tangible results and build economic momentum over time. The needs are clear (see October 2010 Regional Economic Outlook and Chapter 3): upgrading education systems, improving business environments and allowing more open competition, raising intraregional trade and reorienting exports toward other fast-growing emerging markets, and developing fi nancial systems with a wider reach. With all the changes currently sweeping through the region, the time is right for fundamental reforms.
Over time, however, the changes taking place in the region could provide a boost for its economies. A more inclusive reform agenda that meets the population’s demands by providing greater access to opportunity and more competition would make the economies more dynamic and leverage the region’s inherent strengths: a young labor force and a privileged geographic position at the crossroads between major markets in Europe and fast-growing emerging and developing economies in Asia and sub-Saharan Africa.
The key to sustained progress will be to set out on the right track. Overcoming high unemployment will require a substantial increase in the pace of

2. MENAP OIL IMPORTERS: WINDS OF CHANGE
37
Selected Economic Indicators: MENAP Oil ImportersAverage Proj.2000–05 2006 2007 2008 2009 2010 2011
Real GDP Growth 4.4 6.3 6.1 4.8 4.7 4.7 2.3(Annual change; percent)
Afghanistan, Rep. of … 5.6 13.7 3.6 20.9 8.2 8.0Djibouti 2.4 4.8 5.1 5.8 5.0 4.5 4.8Egypt 4.0 6.8 7.1 7.2 4.7 5.1 1.0Jordan 6.0 7.9 8.5 7.6 2.3 3.1 3.3Lebanon 3.4 0.6 7.5 9.3 8.5 7.5 2.5Mauritania 3.7 11.4 1.0 3.5 -1.2 4.7 5.2Morocco 4.4 7.8 2.7 5.6 4.9 3.2 3.9Pakistan 4.9 6.1 5.6 1.6 3.4 4.8 2.8Syrian Arab Republic 3.8 5.0 5.7 4.5 6.0 3.2 3.0Tunisia 4.4 5.7 6.3 4.5 3.1 3.7 1.3
Consumer Price Inflation 3.9 7.1 7.0 13.3 11.1 8.8 10.7(Year average; percent)
Afghanistan, Rep. of … 7.2 8.6 30.5 -8.3 0.9 14.2Djibouti 2.0 3.5 5.0 12.0 1.7 4.0 4.6Egypt 4.7 7.6 9.5 18.3 11.7 11.6 11.8Jordan 2.1 6.3 4.7 13.9 -0.7 5.0 6.1Lebanon 0.5 5.6 4.1 10.8 1.2 4.5 6.5Mauritania 7.9 6.2 7.3 7.3 2.2 6.1 7.3Morocco 1.5 3.3 2.0 3.9 1.0 1.0 2.9Pakistan 4.6 7.9 7.8 12.0 20.8 11.7 15.5Syrian Arab Republic 2.7 10.4 4.7 15.2 2.8 4.4 6.0Tunisia 2.7 4.1 3.4 4.9 3.5 4.4 4.0
General Government Fiscal Balance -5.3 -4.7 -4.8 -5.4 -5.2 -6.0 -6.8(Percent of GDP)
Afghanistan, Rep. of … -3.1 -2.1 -4.3 -1.4 -0.1 -0.6Djibouti -1.8 -2.4 -2.6 1.3 -4.6 -0.5 -0.1Egypt1 -9.9 -8.2 -7.3 -6.8 -6.9 -8.1 -9.7Jordan -3.1 -3.4 -5.5 -5.4 -8.5 -5.4 -6.8Lebanon1 -15.3 -10.4 -10.8 -9.5 -8.2 -7.2 -10.5Mauritania1,2 -6.6 35.8 -1.6 -6.5 -5.1 -0.4 -1.7Morocco1 -5.2 -1.8 0.3 1.5 -2.1 -4.2 -4.9Pakistan -2.7 -3.7 -4.0 -7.3 -5.2 -6.0 -5.0Syrian Arab Republic -2.1 -1.1 -4.0 -2.9 -2.9 -4.8 -6.8Tunisia -2.6 -2.9 -2.8 -0.7 -2.6 -1.2 -4.3
Current Account Balance -0.4 -1.6 -2.5 -4.6 -4.6 -3.3 -4.1(Percent of GDP)
Afghanistan, Rep. of … -5.7 0.9 -1.6 -2.6 2.0 -0.7Djibouti -0.4 -11.5 -21.4 -24.3 -9.1 -6.7 -15.4Egypt 1.6 1.6 2.1 0.5 -2.3 -2.0 -2.7Jordan -0.0 -11.0 -16.9 -9.0 -6.3 -5.4 -8.5Lebanon -15.2 -5.3 -6.8 -9.2 -9.4 -10.2 -12.9Mauritania -18.8 -1.3 -18.3 -15.8 -12.3 -4.9 -6.9Morocco 2.2 2.2 -0.1 -5.2 -4.9 -4.2 -5.7Pakistan 1.6 -3.9 -4.8 -8.5 -5.7 -2.3 -1.5Syrian Arab Republic -1.3 -2.3 -3.6 -2.8 -5.7 -4.4 -4.6Tunisia -3.0 -1.8 -2.4 -3.8 -2.8 -4.8 -7.8
Sources: National authorities; and IMF staff estimates and projections.1Central government.2Includes oil revenue transferred to the oil fund.


39
3. Policy Challenges
3.1. MENA Oil Importers: Creating Jobs for the Young WorkforceThe ongoing social and political events in the region highlight the urgency of addressing youth unemployment. To boost job creation and enhance the employability of young people, policymakers can in the short term bring forward labor-intensive infrastructure investments, provide tax incentives or credit guarantees to viable labor-intensive small and medium-sized enterprises, and scale up promising training programs, or introduce new well-designed and effective ones. But these measures are no substitute for a comprehensive employment strategy that reorients education to better equip graduates with the skills that employers seek; improves the business and investment climate; and dismantles labor market rigidities that discourage fi rms from hiring. In parallel, governments should provide effective social protection for workers and job seekers.
Addressing high unemployment is a longstanding challenge for the oil importers of the Middle East and North Africa (MENA). In 2008, unemployment rates in Egypt, Jordan, Lebanon, Morocco, Syria, and Tunisia (hereafter, the MENA6) averaged 11 percent, the highest regional rate worldwide (Figure 3.1.1). In contrast to recent cyclical increases elsewhere, high levels of unemployment are not new to the region: unemployment in the MENA6 has been largely structural, remaining in the vicinity of 12 percent over the past two decades. High labor force growth, skill mismatches, labor market rigidities, large public sectors, and high reservation wages have all conspired to keep unemployment persistently high (see October 2010 Regional Economic Outlook for details).
The high unemployment rates in the MENA6, together with low labor force participation rates—particularly among females—result in very low employment-to-working-age population ratios. At about 48 percent, the labor force participation rate in the MENA6 is much lower than in any other region in the world. The employment-to-working-age population ratio in the MENA6 is also the lowest regional rate worldwide, at well below 50 percent, in contrast, for example, to 70 percent in East Asia (Figure 3.1.2).
Unemployment: Largely a Youth PhenomenonUnemployment in the region is largely a youth phenomenon. The share of youth (ages 15–24) in total unemployment exceeds 40 percent in all MENA6 countries, registering around 60 percent in Egypt and Syria.1 Moreover, at over 25 percent, the
1 The share of youth in total unemployment refers to data for 2008 or latest earlier year available. The source of the data is the International Labor Organization, except for Jordan (Department of Statistics).Prepared by Yasser Abdih.
Figure 3.1.1Unemployment Rates by Region1,2(20083)
MENA6Egypt Jordan
MoroccoTunisia
25
30
35
Latin America andthe Caribbean
South Asia
Lebanon
Syria
10
15
20
25
Central andSouth-EasternEurope (non-EU) and CIS
Sub-Saharan
Africa
DevelopedEconomies
and EU
South-East Asiaand thePacific
East Asia5
4 5 6 7 8 9 10 11 12 13 14 15 16Yout
h un
empl
oym
ent (
perc
ent)
Total unemployment (percent)
Sources: International Labor Organization; national authorities; IMF, WorldEconomic Outlook; and IMF staff estimates.1MENA6 countries are Egypt, Jordan, Lebanon, Syria, Morocco, and Tunisia.2Total and youth unemployment rates for Morocco reflect data from UrbanLabor Force Survey.3Or most recent earlier year for which data are available.

REGIONAL ECONOMIC OUTLOOK: MI DDLE EAST AND CENTRAL ASIA
40
youth unemployment rate in the MENA6 exceeds that of any other region in the world—a rate that reaches up to 30 percent in Tunisia and 32 percent in Morocco (Figure 3.1.1). Unusually, education in this region is not a guarantee against unemployment. In fact, unemployment tends to increase with schooling, exceeding 15 percent for those with tertiary education in Egypt, Jordan, and Tunisia.
Quick Wins with Long-Term Benefi ts: Lessons from ElsewhereThe ongoing social and political turmoil in the region has given urgency to the issue of addressing youth unemployment. Faced with this increasingly pressing challenge, policymakers across the region are struggling to fi nd ways to create jobs and enhance the employability of their young populations. Governments can start implementing measures in the short term that would also have long-term benefi ts.
Turn infrastructure investment into a vehicle for employment generation. Investment in infrastructure can have a sizable impact on employment generation, even in the short term. For example, evidence from Latin America and the Caribbean suggests that about 40,000 annual direct and indirect new jobs can be created in the short term for every US$1 billion spent on infrastructure projects. Extrapolating these
numbers to Egypt and Tunisia, for instance, suggests that 1 percent of GDP spent on infrastructure could generate in the short term as many as 87,000 new jobs in Egypt and 18,000 jobs in Tunisia. To have an immediate effect, policymakers in the region can therefore seek to bring forward viable labor-intensive infrastructure projects that are already in the pipeline, while maintaining fi scal sustainability. Such a policy will not only provide wage employment—including for young people—but will also enhance long-term growth, thereby leading to sustained job creation.
Support private-sector activity through macro policies. To encourage job creation, policymakers can explore the possibility of giving tax incentives or providing credit guarantees to viable labor-intensive small- and medium-sized enterprises, as was done in many emerging markets and transition economies during the global fi nancial crisis. Moreover, removing impediments to access to credit would also help these enterprises.
Scale up promising training programs based on past successes in the region. The region offers a growing range of promising youth-oriented training programs. One such example is the Education For Employment Foundation (EFE), which currently operates in several countries in the region including Egypt, Jordan, and Morocco. EFE works with corporations and industries to assess demand for skills and to provide corresponding tailored training programs for young people. Through both in-class and on-the-job training, EFE has proven successful in providing job seekers with skills relevant to businesses and placing unemployed youth in jobs. For example, 85 percent of program graduates were placed in jobs in Jordan and 86 percent were placed in jobs and internships in Morocco. Policymakers should seek to scale up and replicate such promising programs.
Introduce new well-designed and effective training programs. Given the magnitude of youth unemployment and the urgent need to address it, policymakers may want to initiate new investments in well-designed training programs, in addition to expanding training programs that have shown some success. It is crucial that policymakers act now, given that it may take
Figure 3.1.2Employment-to-Working-Age Population Ratiosand Labor Force Participation Rates by Region(2008)
75
WorldCentral and South-Eastern Europe
(non-EU) and CIS
East Asia
South-East Asia andthe Pacific
Latin America and theCaribbean
Sub-Saharan Africa
60657075
MENA6
Developed Economiesand EU
South Asia
EgyptJordan
Lebanon
MoroccoSyria
Tunisia
45505560
4045
35 45 55 65 75
Labo
r for
ce p
artic
ipat
ion
rate
(per
cent
)
Employment-to-working-age populationratio (percent)
Sources: International Labor Organization; national authorities; IMF, WorldEconomic Outlook; and IMF staff estimates.

3.1. MENA OIL IMPORTERS: CREATING JOBS FOR THE YOUNG WORKFORCE
41
to be more inclusive; hence, governments need to create an environment that allows all segments of the population to contribute to and benefi t from economic growth, not just a privileged few. Moreover, growth should be led by the private sector, and in this regard, government policies need to support an environment that enables that sector to fl ourish.
• Create an environment that fosters a level playing fi eld for everyone. “Growth strategies cannot succeed without a commitment to equality of opportunity, giving everyone a fair chance to enjoy the fruits of growth.”2 What is needed is an environment where people, particularly young people, have equal opportunities to acquire a good education, equal opportunities to compete for high-quality jobs, equal opportunities to become entrepreneurs, and equal opportunities to access credit or purchase land and other production factors. Ensuring greater equality of opportunity and broader sharing of the benefi ts of economic reform would lay a solid foundation for an inclusive and sustainable improvement in living standards.
• Improve the business climate. Reforms aimed at creating a business environment more conducive to investment and competition—including streamlining the cumbersome and costly procedures for business startups, strengthening property rights legislation, and enhancing contract enforcement—are key to unlocking the region’s employment potential. Such reforms would also facilitate the movement of educated young workers from low-growth-generating and low-income-earning activities in the informal sector to the formal sector.
• Reach out to the diaspora. There are large numbers of expatriates from the region in Europe, the United States, and the GCC. In many cases, these expatriates have not only advanced
2 Commission on Growth and Development, 2008, The Growth Report: Strategies for Sustained Growth and Inclusive Development, p. 7. www.growthcommission.org.
some time to reap the benefi ts of new investments. Some lessons can be learned from the experiences of other countries when designing such programs. For example, evaluations of youth training programs in Latin America indicate that those that are demand-driven, offer on-the-job training, focus on both hard and soft skill formation, monitor performance, and perform impact evaluation have a signifi cant positive impact on employment and earnings of program participants.
At the same time, when designing short-term solutions to youth unemployment, governments should ensure that such solutions do not harm the long-term goal of sustainable job creation and productive skill formation. For example, and in light of the ongoing political turmoil and uncertainty, governments may be enticed to quickly create unneeded jobs in the already large public sector. Such a policy, which may be diffi cult to unwind later, may distort labor market incentives and divert resources away from a potentially more vibrant private sector. As another example, giving subsidies to the educated unemployed youth, while well-intended and providing relief, may reinforce skills mismatches for future labor market entrants if the qualifi cation for such subsidies is based solely on diplomas and credentials.
Pillars of a Comprehensive Job StrategyIn parallel to the measures discussed above, governments need to put in place a comprehensive job strategy aimed at addressing the underlying structural problems. Such a strategy should be based on three pillars: fostering inclusive growth, enhancing skill formation, and providing adequate social protection to workers and job seekers.
Fostering higher and more inclusive growthAchieving high growth remains key to generating jobs for new labor market entrants. Growth needs

REGIONAL ECONOMIC OUTLOOK: MI DDLE EAST AND CENTRAL ASIA
42
business leaders to teach marketable skills to high school and college students, including basic business skills, teamwork, leadership skills, and entrepreneurial thinking. Injaz was launched in Jordan in 1999 but now has spread to a dozen countries in the region.
• Reform university admission policies. The attractiveness of university education across the region suggests using university admission policies to infl uence skill formation at lower levels of education. Reforming such policies to test a broader range of skills beyond rote learning—including writing skills, critical thinking, and problem solving—would give incentives for students at the primary and secondary levels to acquire such skills.
• Reform public sector hiring practices and compensation policies. Public sector hiring procedures should place greater emphasis on skills and competition and less on paper qualifi cations. Governments could introduce interviews and tests that evaluate a broader range of skills, beyond what is currently being tested in universities and schools, including both hard and soft skills. Moreover, strengthening the link between compensation and performance and implementing merit-based promotion policies would also send the right signals regarding skill formation for young people.4
Protect the worker and not the jobThe region suffers from overly rigid labor market regulations, when compared to elsewhere. In Egypt, for example, severance payments for established employees amount to 132 weeks’ worth of their fi nal salaries. In Syria and Morocco, the average is 80 weeks and 85 weeks, respectively—much higher than the average of 38.6 weeks in the East Asia and Pacifi c region and 25.8 weeks in the developed
4 See, for example, Djavad Salehi-Isfahani and Navtej Dhillon, 2008, “Stalled Youth Transitions in the Middle East: A Framework for Policy Reform,” Middle East Youth Initiative Working Paper No. 8 (Dubai: Middle East Youth Initiative).
degrees, but also years of experience in competitive environments. Calling on the skilled diaspora and reversing “brain drain” would increase the supply of skilled labor and thereby help domestic economies grow and compete globally.3 Improvements in the business environment, better governance, and better enforcement of intellectual and property rights would help bring back talent residing abroad. The successful experiences of India and Taiwan in luring back the skilled diaspora suggest that such reforms may need to be complemented with specifi c policy support, such as the provision of tax and fi nancial incentives.
• Foster trade. Recent empirical evidence indicates that countries in the region have been trading far below their potential (see October 2010 Regional Economic Outlook). Moreover, according to recent analysis by the World Economic Forum, trade policies in the MENA6 are among the most restrictive in the world. MENA6 tariffs—averaging approximately 12 percent—are nearly double those in emerging Asia. Furthermore, several countries in the region rank at the lower end among 139 countries surveyed on a measure of overall trade restrictiveness. By further liberalizing external trade and opening up domestic markets, the region could boost output growth and labor demand. Lowering tariffs, diversifying trade toward fast-growing emerging markets, and increasing intraregional trade would help in this regard.
Reduce skills mismatches by addressing the root causes • Realign curricula with private-sector needs.
Policymakers should scale up initiatives that better align education with the needs of the private sector. One such promising initiative is Injaz, a partnership between ministries of education and the private sector that gets
3 Marcus Noland and Howard Pack, 2007, The Arab Economies in a Changing World (Washington: Peterson Institute for International Economics).

3.1. MENA OIL IMPORTERS: CREATING JOBS FOR THE YOUNG WORKFORCE
43
Policy should aim at relaxing rigid labor market regulations, while at the same time preserving the right to collective bargaining and providing effective social protection, including unemployment insurance, for workers. More fl exible labor market regulations would help enable the private sector to respond effectively to market signals and would increase the employment response of other reforms such as trade liberalization.
world.5 Such high costs of fi ring discourage fi rms from hiring in the fi rst place. Therefore, while such regulations are intended to protect the worker, they in fact impede job creation in the formal sector and contribute to driving fi rms into the informal economy where young people have limited opportunities for human capital development.
5 Navtej Dhillon and Tarik Yousef (eds.), 2009, Generation in Waiting: The Unfulfilled Promise of Young People in the Middle East (Washington: Brookings Institution Press).

44
3.2. Moving from Subsidizing Products to Protecting People: Strengthening Social Protection in MENAP
Universal price subsidies—especially on foods and fuels—are common in the MENAP region. They appeal to governments because of their administrative ease, but also create distortions and are not well targeted. Several countries recently introduced or expanded price subsidies (and/or cut indirect taxes) to mitigate the impact of higher global commodity prices. While these steps can serve as temporary stop-gap measures, countries should prepare to replace subsidies with more cost-effective social safety net instruments, especially cash transfers and other forms of income support. Subsidy reform is diffi cult, but experience shows that countries can take steps to facilitate the process. These include collecting and disseminating information on costs and benefi ciaries of subsidies; deploying comprehensive communication strategies; strengthening public sector governance and service delivery; gradually improving the targeting of subsidies, compensating reform losers, and strengthening targeted comprehensive social safety nets; establishing automatic pricing mechanisms; and moving in a regionally coordinated way.
The Cost of Reliance on Subsidies for Social ProtectionMENAP countries stand out from comparators in other regions for their heavy reliance on universal price subsidies as a social protection tool (Box 3.2.1). According to estimates by the International Energy Agency, the MENAP region accounted for almost two-thirds of global petroleum price subsidies in 2009. Food subsidies are also widespread, with 17 out of 22 MENAP countries currently providing them.
Data on the budgetary costs of these subsidies—which include outlays for subsidies and foregone revenues—are scarce. An aggregation of IMF country desk estimates suggests that price subsidies in MENAP countries amounted to US$200 billion (7.8 percent of GDP) in 2010. About 15 percent of this amount refl ected the cost of food subsidies, and the remainder subsidies on fuels and electricity.
While a comprehensive tally of other social protection spending is unavailable, partial information suggests that social safety net instruments and social insurance play less of a role in the region. In particular, targeted cash transfers and other forms of income support are not used widely in MENAP countries and, where they exist,
the resources allocated to them are still relatively small (Figure 3.2.1).
Price subsidies are also imposing effi ciency costs on the region. In 2009 and 2010, MENAP countries passed only 25 percent of the global gasoline price increase on to domestic consumers. For diesel fuel, the pass-through was even less. As a result, average retail fuel prices are much lower than in other regions.
Cheap fuel and food prices induce waste and overconsumption, which can lead to damage to the environment, ineffi cient investment choices, and competitiveness problems. For example, in countries such as Iran and the United Arab Emirates energy consumption (adjusted for income
Figure 3.2.1Cost of Price Subsidies versus Cash Transfers(Percent of GDP, 2010)
Sources: IMF staff calculations; and national authorities.
8
10
0
2
4
6
Jordan Syria Yemen
Subsidies Cash Transfers
Prepared by Andreas Bauer.

45
3.2. MOVING FROM SUBSIDIZING PRODUCTS TO PROTECTING PEOPLE: STRENGTHENING SOCIAL PROTECTION IN MENAP
50–75 percent of spending on well-designed cash transfers reaches the bottom 40 percent of the population. Replacing subsidies with income support would strengthen social protection and free
differences) is more than 50 percent higher than in the United States. In Egypt, price subsidies have reportedly led to the use of bread as animal and fi sh feed. Price subsidies also encourage socially wasteful activities such as smuggling, black markets, and corruption.
Because universal price subsidies are typically poorly targeted, their cost-effectiveness as a social protection instrument is highly questionable. For example, the poorest 40 percent of the population in Jordan receives less than a quarter of total spending on fuel subsidies. Food subsidies generally do better in terms of targeting performance, but even for them leakages to the better-off are still quite large (Figure 3.2.2).
The longer-term objective for MENAP countries should be to design and introduce more cost-effective social safety nets and replace price subsidies. Effective social safety net interventions such as cash transfers and other forms of income support can be better targeted—typically about
Box 3.2.1
Social Protection Instruments
The social policy mandate of a government involves providing social protection to vulnerable segments of the population. Instruments typically used for this purpose include social safety net interventions, price subsidies, and social insurance schemes. Social safety nets are noncontributory transfer programs such as cash or near-cash transfers (e.g., food stamps), in-kind transfers (e.g., school feeding, mother/child complements, take-home food rations), and fee waivers for essential services (e.g., schooling, health care, utilities, and transportation). Social insurance involves benefi ts that are based on prior contributions (e.g., unemployment insurance and old age or disability pensions).
Figure 3.2.2Distribution of Subsidies Across Income Groups(Percent)
Jordan--Fuel (2005)
Cross country¹--Fuel (2010)
0% 20% 40% 60% 80% 100%
Egypt--Baladi bread(2008/09)
Lebanon--Bread (2008)
Bottom 40 percent Top 60 percent
Sources: Robert Gillingham and Moataz El-Said, 2005, "Jordan: Distributional Effects of Eliminating Subsidies for Petroleum Products,"Technical Assistance Report (Washington: International Monetary Fund);Javier Arze del Granado, David Coady, and Robert Gillingham, 2010,"The Unequal Benefits of Fuel Subsidies: A Review of Evidence forDeveloping Countries," IMF Working Paper 10/202 (Washington:International Monetary Fund); World Bank, 2010, "Egypt's Food Subsidies:Benefit Incidence and Leakages" (Washington).
Social Safety Net Noncontributory transfers (e.g., cash transfers, in-kind benefits, fee waivers)
Social Insurance Contribution-based benefits (e.g., unemployment insurance, old age/disability pensions)
Other Social Policies Other interventions, such as health, education, housing, or labor policies
Social Protection
Social Policy
Price Subsidies
Taxonomy of Social Policy Interventions
Source: IMF staff illustration.

REGIONAL ECONOMIC OUTLOOK: MI DDLE EAST AND CENTRAL ASIA
46
and other vulnerable groups, and mitigation schemes must therefore be developed for the transition.
Steps to Strengthen Social Protection in the Short TermToday, policymakers in MENAP countries are facing the twin challenges of alleviating immediate social pressures, including those arising from higher food and fuel prices, while also starting a process of more fundamental reform of their social protection systems.
To address short-term pressures, countries in the region have announced a number of mitigation measures (see Chapters 1 and 2). Some countries with existing social safety net instruments—such as cash transfers—have been able to scale these up, but many countries have also expanded subsidies or reduced taxes on food and fuel products.
While the use of these instruments is understandable in the absence of better targeted alternative delivery mechanisms, they should be seen as temporary stop-gap measures until more effi cient protection instruments can be put in place. At the same time, better targeted measures such as school feeding programs, fee waivers for public services that cater mostly to the poor (e.g., health, education, or public transport), or labor-intensive public works can be expanded or introduced relatively quickly.
Advancing Subsidy Reform with Broad OwnershipThe appropriate structure of strengthened social safety nets and the modalities and speed of fundamental price subsidy reform in the medium term will depend on country-specifi c factors, including administrative capacity, the political environment, and the macroeconomic and fi scal situation. However, experiences from other subsidy reform episodes (Box 3.2.2) can provide some guiding principles for the design of robust subsidy reform strategies:
up substantial resources for other priority uses. The latter is important for many oil-importing countries in the MENAP region, which have limited fi scal space. Even for oil-exporting countries for which fi scal space is not an issue, phasing out subsidies will prove benefi cial by stemming excessive consumption and encouraging conservation and the adoption of more energy-effi cient technologies.
Why Is Price Subsidy Reform So Diffi cult?Attempts to phase out subsidy regimes have proven challenging in MENAP countries and elsewhere. Some subsidy reforms, especially in the 1980s and 1990s, led to a reduction in outlays, but attempts were often reversed after meeting (sometimes violent) resistance, or rolled back in the face of large commodity price swings.
Several factors explain uneven progress on subsidy reform thus far:
• First, there is a dearth of publicly available information about the magnitude and distributional impact of price subsidies, and, as a result, awareness of the fi scal costs and distortions of price subsidies is relatively low.
• Second, subsidies have created vested interests that are diffi cult to overcome.
• Third, resistance to subsidy reform refl ects—in part—broader weaknesses in the delivery of public services. In many countries, middle-class households are squeezed because they cannot rely on publicly provided health care, schooling, or utilities. In this context, price subsidies are seen as one of few tangible benefi ts in return for tax payments, and their removal is, thus, heavily resisted.
• Fourth, in oil-producing countries, cheap energy is considered an entitlement by many, especially when there is no perception of other resource dividends from the government.
• Finally, even in cases when subsidies are clearly regressive, their removal can hurt the poor

3.2. MOVING FROM SUBSIDIZING PRODUCTS TO PROTECTING PEOPLE: STRENGTHENING SOCIAL PROTECTION IN MENAP
47
are used well by the government. To this end, public fi nancial management should be strengthened, particularly the integrity of the budget and the public investment management process. Net savings from subsidy reforms should be transparently allocated to high-priority projects to build public support. However, in countries with limited fi scal space some of the savings may have to be earmarked for defi cit and debt reduction.
• Improve targeting gradually to make early gains. The transition from a social protection system that is heavily reliant on price subsidies to a comprehensive social safety net where cash transfers and other forms of income support predominate will have to be gradual in most cases, as delivery and targeting mechanisms need to be developed and put
Box 3.2.2
Examples of Successful Subsidy Reforms
In Mexico, the implementation in 1997 of Progresa (later renamed Oportunidades para la Mayoría), a program that provides cash transfers to the poor on condition that health, education, and nutrition targets (such as regular medical check-ups and school attendance) are met, allowed the government to phase out a number of poorly targeted food subsidies, including the generalized subsidy on tortillas in 1999. Evaluations have confi rmed that the transfers, which are based on a combination of self-selection and means testing, are relatively well targeted compared to other safety net programs.
Indonesia more than doubled fuel prices in 2005 and further increased the prices of fuel products by 25–33 percent in 2008. Budgetary savings from the fuel price increase fi nanced a cash compensation program to 15.5 million poor families (this scheme was later transformed into a conditional cash transfers program). Additional compensations to other groups included an increase in the personal income tax threshold, a reduction in tariffs on sugar, and a VAT exemption for agricultural products. As part of the reform, the authorities introduced an automatic fuel price adjustment mechanism. Indonesia’s reform benefi ted from the availability of a well-targeted delivery mechanism for transfers and a successful communications campaign.
Jordan followed a gradual approach to phase out fuel price subsidies starting in 2005. By February 2008, domestic fuel prices followed international prices via a monthly automatic pricing regime. Mitigation measures included increases in minimum and civil service wages, one-time bonuses to government employees and pensioners with low incomes, introduction of a life-line electricity tariff structure, provision of cash transfers to low-income households, and increased allocations to the National Aid Fund (the government’s social assistance entity). However, in January 2011, due to social pressures, the authorities temporarily suspended the automatic fuel price adjustment and reduced taxes on gasoline, diesel, and kerosene. Overall, the Jordanian experience illustrates the importance of putting in place effective social safety nets as part of price subsidy reforms that can be quickly scaled up, to reduce the odds of reform reversal in case of sudden shocks.
• Collect and disseminate information about costs and benefi ts of subsidies. Existing subsidies should be quantifi ed, publicized, and brought on budget so that they are subjected to competition for public funding. In addition, household surveys have to be conducted and published so that the recipients of subsidies can be identifi ed. This will heighten awareness of the cost of subsidies and the merits of reforming them.
• Develop a comprehensive communication strategy. A review of 40 country experiences between 2002 and 2006 showed that the odds of success in subsidy reforms almost tripled with strong political support and proactive public communications.
• Strengthen public-sector governance, accountability, and capacity. Resistance to subsidy reform will be lower if there is trust that saved resources

REGIONAL ECONOMIC OUTLOOK: MI DDLE EAST AND CENTRAL ASIA
48
Box 3.2.3
Replacing Subsidies with Cash Transfers: Subsidy Reform in the Islamic Republic of Iran
In December, Iran started implementing the Targeted Subsidies Reform Law approved by the Iranian Parliament a year earlier. The substantial—up to 20 times—price increase for all major energy products, public transport, water, and some food items (such as bread) made Iran the fi rst major energy-exporting country to cut indirect subsidies drastically and to replace them with across-the-board cash transfers to the population.
The price increases are estimated to have removed close to US$60 billion dollars (about 15 percent of GDP) in annual product subsidies. The law stipulates that out of the revenue arising from the price increase, about US$30 billion is to be redistributed equally to each household in the fi rst year in freely usable cash, US$18 billion to enterprises to fi nance their restructuring to reduce energy intensity, and about US$12 billion to the government to allow it to pay for higher energy bills and improve energy effi ciency in the public sector.
Impact
Despite the dramatic increase in prices, the reform was implemented smoothly. Transfer payments to households have supported demand for Iranian goods and particularly benefi ted the poor. There are indications that the newfound wealth fl owing to Iran’s smaller towns and villages is reinvigorating economic activity. Although it is too early to assess the impact on domestic energy use, early reports indicate energy consumption may have declined by up to 20 percent for some fuels. The impact of the energy price increase on consumer prices has so far been limited by the authorities’ efforts to slow down the pass-through to retail prices through higher imports, inventory accumulation, and administrative measures.
Lessons and Looking Ahead
The smooth implementation of the price reform is owing mainly to the clarity of the reform’s objectives, technical preparation, and extensive communication efforts by the government regarding the benefi ts of the reform and eligibility for cash transfers.
Looking ahead, reforming Iran’s energy-intensive corporate sector and agriculture to offset the negative impact of higher energy prices on their balance sheet is likely to be the single biggest challenge for Iran. Iranian enterprises will need to change their production mix to more energy-effi cient products, and alter their production technologies to reduce production costs. This adjustment process is likely to take several years and require the support of effective macroeconomic and microeconomic policies and incentives. The authorities, well aware of this challenge, are planning to launch a number of programs to assist enterprises in their restructuring efforts.
Iran: Selected Energy Prices(Millions of barrels per day)
Before Dec. 19, 20101 From Dec. 19, 20101
US cents/liter US cents/literGasoline regular 10/39 39/68Gasoline premium 15/53 49/78Diesel 1.6 15/34Gas oil 1.6 15/34Kerosene 1.6 10Fuel oil 1 19
Sources: Compiled by the authors from media reports.1 The first price applies to rationed quota, the second to quantities sold above the quota. To smooth the adjustment, households and selected industrial and agricultural users are eligible to purchase limited quantities of fuels at the lower price. The low-price quotas are expected to be phased out gradually.
Prepared by Dominique Guillaume and Roman Zytek.

3.2. MOVING FROM SUBSIDIZING PRODUCTS TO PROTECTING PEOPLE: STRENGTHENING SOCIAL PROTECTION IN MENAP
49
in place. However, in the meantime, quick gains from improved targeting can be scored by narrowing the scope of existing subsidies to products that are most important for the poor or capping quantities of subsidized products at subsistence consumption levels. Once delivery mechanisms are in place, price subsidies should be replaced by price-indexed cash transfers, ideally with attached conditions that provide incentives for human capital investment (if administrative costs are not too high). Where cash transfers already exist, these can be enhanced and scaled up from the onset to speed up the process of phasing out subsidies.
• Provide compensation to losers. Data from subsidy reform experiences suggest that the availability of alternative safety net programs and compensations more than doubles the likelihood of reform success. Measures to protect the poor, those living close to the poverty line, and even parts of the middle class thus need to be considered, at least for a transition phase. Such forms of compensation can be particularly important in oil-producing countries, where large price adjustments are needed and access to cheap energy is considered an entitlement. The ongoing reform in Iran, where substantial in-kind subsidies were replaced by cash transfers that are essentially an oil dividend, is likely
to provide relevant insights on this matter (Box 3.2.3). Any compensation should be tangible from the outset of the reform, but ultimately rolled into the redesigned social safety net.
• Establish automatic pricing mechanisms to help depoliticize price setting. Moving away from discretionary ad hoc pricing of commodities—particularly fuels—should be an integral part of any price subsidy reform. Automatic price adjustment can make price setting less controversial, especially if overseen by an independent regulatory agency. While the ultimate goal should be to liberalize fuel and food prices, there may be merit in adopting a smoothing rule (based on moving averages or price adjustment caps). Price smoothing can help prevent the suspension of price adjustment mechanisms in the face of sudden price increases, while still ensuring full pass-through over the medium term.
• Move regionally, if possible. A broader—even coordinated—effort in the region to phase out price subsidies and establish better social protection systems could also help ease the resistance to change. This approach could make a reduction in subsidies politically more palatable and would reduce the risk of negative spillovers from isolated reforms (for instance by eliminating incentives for smuggling).

50
3.3. The Impact of Financial Development on Economic Growth in the Middle East and North Africa
A key challenge for the MENA region is to generate higher rates of economic growth over the medium term to raise living standards and address high levels of unemployment. Slow growth in MENA over the past three decades can be partly traced to two main fi nancial sector issues. First, several countries in the region lack fi nancial depth and, second, the region as a whole has not fully benefi ted from the level of banking intermediation on offer, signaling a “quality gap.” Policy should therefore aim to provide a fi nancial infrastructure conducive to bank and fi nancial market development; enhance banking competition by removing entry barriers and improving credit information; reassess the role of state banks; and further the process of fi nancial reform.
A vibrant and dynamic fi nancial sector contributes to a host of improved economic outcomes including mobilization of savings, allocation of resources to productive uses, facilitation of transactions and risk management, and corporate control. In particular, there is widespread evidence that fi nancial depth—the overall scale of bank intermediation and fi nancial market activity—is associated with broader access to fi nancial services and faster and more equitable economic growth.
Financial Depth Is Adequate Overall… Using two common measures of fi nancial depth—the ratio of private credit to GDP for bank intermediation, and the stock market turnover ratio1 for market activity—MENA countries, on average, do not lag behind other regions. From 1975 to 2008, the average private-credit-to-GDP ratio for MENA was substantially higher than the emerging and developing country (EDC) average (Figure 3.3.1), although it has fallen short of East Asia and the Pacifi c since the early 1990s, and is well below that of high-income countries. As of 2008, the
Prepared by Adolfo Barajas (IMF), Ralph Chami (IMF), and Reza Yousefi (University of Texas at Austin). 1Other indicators have frequently been used to measure financial depth, but these two indicators have proven to have a stronger and more robust relationship with economic growth. The turnover ratio is defined as the ratio of the value of shares traded to market capitalization.
private-credit-to-GDP ratio stood at 45 percent in MENA, compared to an EDC average level of 38 percent. Stock markets in MENA also appear to be deeper, on average, than in other emerging and developing countries, with a turnover ratio of 40 percent in 2007,2 substantially higher than the EDC average of 26 percent (Figure 3.3.2).
Of course, notable heterogeneity exists within the region. The high-income oil-exporting economies of the GCC exhibit markedly deeper fi nancial sectors, with an average turnover ratio of 54 percent in 2007, compared to 26 percent for the rest of the MENA region. At the individual country level, while Saudi Arabia is relatively deep
2Country coverage of the turnover ratio declines notably after 2007.
Figure 3.3.1Private Credit by Deposit Money Banks/GDP (1975–2008, percent)
Sources: IMF, International Financial Statistics; World Bank, Database on Financial Development and Structure, 2010 ; and authors' calculations.
0.8
1.0
1.2 Middle East and North AfricaGCCNon-GCCWorld AverageEmerging & Developing CountriesHigh-Income
0.0
0.2
0.4
0.6
1975 1985 1995 2005 2008

3.3. THE IMPACT OF FINANCIAL DEVELOPMENT ON ECONOMIC GROWTH IN THE MIDDLE EAST AND NORTH AFRICA
51
regions—partly explaining the lack of access described above—and that it is largely attributed to more stringent entry restrictions, a weak credit information environment, and a defi cient level of development of nonbank sources of fi nance.4
As a result, the impact of banking depth on growth in MENA is weaker than in other regions. An analysis of the determinants of economic growth across a broad sample of countries reveals that, for a given level of private credit, the impact on economic growth is about a third lower than in other EDC regions. For example, if Yemen’s banking system were to deepen to the EDC average, annual per capita growth would increase by 1½ percentage points, while a non-MENA country with a similar initial depth—Armenia, for example—would increase growth by 2¹⁄³ percentage points per year (Figure 3.3.4). The difference, of about ¾ of a percentage point, is the result of the quality gap, or the lack of access and competition in MENA banking systems. Moreover, even for MENA countries with above-average and continuously increasing depth, there is a measurable loss of economic growth due to the quality gap, of up to ¼ of a percentage point per year.
4 Diego Anzoategui, María Soledad Martínez-Pería, and Ricardo Rocha, 2010, “Bank Competition in the Middle East and Northern Africa Region,” World Bank Policy Research Paper 5363 (Washington: World Bank).
on both fronts, with a private-credit-to-GDP ratio of 39 percent and a turnover ratio of 131 percent, Yemen’s private-credit-to-GDP ratio is 8 percent (Figure 3.3.3).
…But Banks Have Not DeliveredHowever, banking systems in the MENA region have not produced the expected growth-enhancing benefi ts commensurate with their depth, signaling a quality gap with respect to the rest of the world. First, the region has fallen short in providing access to fi nancial services for the population. Survey results indicate that, compared to other regions, MENA businesses—particularly small and medium-sized enterprises—have received substantially less fi nancing from banks, and perceive this lack of fi nancing to be a serious constraint to business expansion.3 Loan concentration tends to be greater, and the percentage of the population with access to bank deposits tends to be lower. Second, a recent study shows that competition within MENA banking systems has lagged behind that of other
3 Based on the World Bank Enterprise Surveys, which indicate that 30 percent of firms in MENA are receiving a loan or line of credit from a bank, compared to 33 percent for the EDC average, and 35 percent of MENA firms identify access to credit as a major constraint, for which the region ranks second to sub-Saharan Africa.
Figure 3.3.2Stock Market Depth by Region(2007, Turnover Ratio: Value of Shares Traded/Capitalization)
Sources: World Bank, Database on Financial Development and Structure, 2010; and authors’ calculations.
World Average
High-Income
0.0
Emerging and Developing
Non-GCC
MENA Average
GCC
0.2 0.4 0.6 0.8 1.0 1.2
Figure 3.3.3Financial Depth in MENA Countries
QatarTunisiaBahrain
UAELebanon
KuwaitMorocco
Jordan
0.0 0.2 0.4 0.6 0.8 1.0 1.2 1.4Libya
YemenAlgeria
SyriaOman
IranSaudi Arabia
Egypt
Stock Market Turnover Ratio, 2007Private Credit by Deposit Money Banks/GDP, 2008
Sources: IMF, International Financial Statistics; World Bank, Database on Financial Development and Structure, 2010; and authors' calculations.

REGIONAL ECONOMIC OUTLOOK: MI DDLE EAST AND CENTRAL ASIA
52
• For both deep and shallow systems in the region, enhancing competition will be crucial to improving the quality of intermediation and strengthening bank governance. The relaxing of stringent entry restrictions, to both new domestic and foreign banks, and actions to improve the credit information environment—including the introduction or strengthening of a credit registry—will play an important role.
• In some MENA countries, the role of state banks should be carefully assessed—and, if necessary, scaled down.5 Worldwide analysis has shown that a dominant state bank presence is associated with lack of fi nancial deepening and, when combined with institutional weakness, with higher governance-related problems and lower economic growth.
• Government actions to kick-start fi nancial market development, by placing government debt domestically on open and voluntary markets and encouraging development of a secondary market, would also support greater competition by providing alternative channels of fi nancing to banking.
5 Roberto Rocha, Subika Farazi, and Eric Feyen, 2011, “Bank Ownership and Performance in the Middle East and North Africa Region,” Unpublished (Washington: World Bank). This study shows that state banks in MENA follow three mandates (government financing, employment, and development) that come at a cost: lower profitability, higher operation costs, and lower asset quality than their private counterparts.
Policy Actions Going Forward The sweeping changes currently taking place in the region provide an opportunity to introduce far-reaching reforms in the fi nancial area. In order to promote economic growth, policy actions should be directed toward increasing fi nancial depth—particularly in countries where it is most lacking—and enhancing the quality of banking intermediation. Successful implementation of these policies will help increase access to fi nance, both to households and to SMEs. These policies include:
• Improving legal frameworks that protect creditor and minority shareholder rights, streamlining insolvency regimes, removing excessive controls on credit and/or interest rates, and maintaining macroeconomic stability, which have been effective in encouraging fi nancial deepening throughout the world.
3Quality EffectPure Depth Effect
1
2
0Yemen Libya Algeria Syria Myanmar Armenia Mexico
Sources: National authorities; and IMF staff estimates.
Figure 3.3.4Growth Impact of Raising Credit/GDP to Emerging Country Average(Average annual percentage points, per capita real GDP)

53
Caucasus and Central Asia
Oil and gas exporters
Oil and gas importers
Russia
Georgia4.4
2,658
Kazakhstan15.6
8,883
Armenia3.3
2,846China
Azerbaijan9.0
6,008Uzbekistan
28.21,380
Turkmenistan5.4
3,939 Tajikistan7.6741
KyrgyzRepublic5.3864
Sources: IMF, Regional Economic Outlook database; and Microsoft Map Land.Note: The country names and borders on this map do not necessarily reflect the IMF's official position.
Population, millions (2010)GDP per capita, U.S. dollars (2010)


55
CCA HighlightsAt 6½ percent, growth in the CCA countries in 2010 was higher than expected, driven by commodity exports and public investment. Oil and gas exporting countries enjoyed growth of 7 percent and improved their current account position by 5½ percentage points of GDP. While the expansion in oil and gas importers was lower (4 percent), their external position also strengthened, aided by higher mineral and metal prices and a pickup of remittances. Growth is expected to moderate to 5¾ percent in 2011 as oil and gas production growth slows down.
Infl ation is rising in all CCA countries. It averaged 7¼ percent in 2010 and is projected to pick up further to 10 percent in 2011, largely refl ecting food and fuel price increases but also, in some cases, emerging demand pressures. High infl ation adversely affects the poor and complicates policymaking. In response, the authorities are tightening monetary policies to avoid second-round effects from higher commodity prices, and in some cases using administrative measures to limit price increases.
Fiscal consolidation plans for 2011 are mixed across the region, and under pressure from demands for higher spending. In Armenia and Georgia, where fi scal space is constrained and self-sustaining recovery appears to be in place, further signifi cant fi scal tightening is planned. Elsewhere, pressures for higher spending are delaying or slowing consolidation. For oil and gas exporters, which have ample fi scal space, a gradual path of fi scal adjustment is appropriate, with non-oil defi cits in 2011 remaining signifi cantly higher than before the crisis.
Policymakers will need to address three main immediate challenges: the pickup of infl ation, an upsurge of social pressures to spend, and the poor quality of bank portfolios. Dealing with infl ation will require close monitoring of developments, and probably further tightening of policies as second-round effects of the commodity price shocks begin to emerge. Efforts to prioritize and improve the quality of public expenditure will be crucial at a time when countries need to develop targeted and cost-effective safety nets to protect the most vulnerable. Restoring the health of banking systems, particularly in Kazakhstan, the Kyrgyz Republic, and Tajikistan, is needed to support a recovery in credit and private investment.
Over the medium term, job creation and poverty reduction are key objectives for all countries. Progress will depend on developing adequate safety nets, increasing the role of the private sector, diversifying economies away from natural resources, and achieving greater regional synergies. Improving the business environment through enhanced transparency, governance, and institutional quality is an important item of the reform agenda.

REGIONAL ECONOMIC OUTLOOK: MI DDLE EAST AND CENTRAL ASIA
56
CCA Region: Selected Economic Indicators, 2000–11(Percent of GDP, unless otherwise indicated)
Average Proj.2000–07 2008 2009 2010 2011
CCA
Real GDP (annual growth) 10.3 6.8 3.7 6.6 5.7
Current Account Balance -0.6 8.9 0.4 5.7 8.6
Overall Fiscal Balance 1.4 6.2 0.9 3.4 4.5
Inflation, p.a. (annual growth) 9.8 16.5 6.2 7.2 10.1
CCA oil and gas exporters
Real GDP (annual growth) 10.7 7.0 4.9 7.1 5.8
Current Account Balance 0.3 12.4 1.8 7.4 10.7
Overall Fiscal Balance 2.2 8.0 2.2 4.9 6.1
Inflation, p.a. (annual growth) 10.2 16.8 6.6 7.2 9.6
CCA oil and gas importers
Real GDP (annual growth) 8.3 5.8 -3.5 4.0 5.2
Current Account Balance -6.3 -14.7 -9.6 -8.5 -10.4
Overall Fiscal Balance -2.8 -3.6 -6.9 -5.3 -5.2
Inflation, p.a. (annual growth) 7.8 14.4 4.2 7.4 13.2
Sources: National authorities; and IMF staff calculations and projections.CCA oil and gas exporters: Azerbaijan, Kazakhstan, Turkmenistan, and Uzbekistan. CCA oil and gas importers: Armenia, Georgia, the Kyrgyz Republic, and Tajikistan.

57
Основные положения по странам КЦАТемпы роста в странах Кавказа и Центральной Азии (КЦА), составившие в 2010 году 6½ процента, были выше, чем ожидалось, при этом движущей силой были экспорт биржевых товаров и государственные инвестиции. Страны-экспортеры нефти и газа имели прирост на 7 процентов и улучшили свое сальдо счета текущих операций на 5½ процентного пункта ВВП. Хотя прирост в странах-импортерах нефти и газа был меньше (4 процента), их внешнеэкономическое положение также упрочилось, этому способствовали более высокие цены на минеральное сырье и металлы, а также увеличение денежных переводов. Ожидается, что в 2011 году, когда замедлится рост производства нефти и газа, темпы роста экономики снизятся до 5¾ процента.
Рост инфляции происходит во всех странах КЦА. В среднем ее темпы в 2010 году составили 7¼ процента, и, по прогнозам, в 2011 году они еще больше возрастут, достигнув 10 процентов, в основном в результате повышения цен на продовольствие и топливо, а также, в некоторых случаях из-за возникающего давления со стороны спроса. Высокая инфляция отрицательно сказывается на малоимущих и усложняет разработку и проведение политики. Официальные органы реагируют на это, ужесточая денежно-кредитную политику, с тем чтобы избежать эффектов второго порядка от роста цен на биржевые товары, и в некоторых случаях применяя административные меры для ограничения повышения цен.
Планы бюджетной консолидации на 2011 год в странах региона являются различными и подвергаются давлению, оказываемому с целью увеличения расходов. В Армении и Грузии, где бюджетное пространство ограничено и, по-видимому, происходит самостоятельный подъем в экономике, планируется дальнейшее ужесточение налогово-бюджетной политики. В других странах требования об увеличении расходов приводят к отсрочке или замедлению консолидации. В странах-экспортерах нефти и газа, где есть достаточное бюджетное пространство, целесообразны постепенные темпы бюджетной консолидации, при этом в 2011 году ненефтяные дефициты останутся существенно более высокими, чем до кризиса.
Директивным органам будет необходимо решить три основные неотложные проблемы: повышение инфляции, увеличение общественного давления в целях наращивания расходов и низкое качество банковских кредитных портфелей. Сдерживание инфляции потребует внимательного наблюдения за развитием событий и, возможно, дополнительного ужесточения экономической политики, поскольку появляются эффекты второго порядка, связанные с шоками цен на биржевые товары. Меры по определению приоритетов и повышению качества государственных расходов будут критически важны в период, когда странам необходимо разработать адресные и экономически эффективные системы социальной защиты для наиболее уязвимых групп. Оздоровление банковских систем, особенно в Казахстане, Кыргызской Республике и Таджикистане, необходимо для поддержки восстановления кредита и частных инвестиций.
В среднесрочной перспективе важнейшими целями для всех стран являются создание рабочих мест и сокращения бедности. Успехи в этом направлении зависят от создания достаточных систем социальной защиты, повышения роли частного сектора, диверсификации экономики за счет уменьшения зависимости от природных ресурсов и достижения более значительных региональных синергетических эффектов. Улучшение деловой среды благодаря повышению степени прозрачности, совершенствованию управления и повышения качества институтов является важной составной частью программы реформ.

REGIONAL ECONOMIC OUTLOOK: MI DDLE EAST AND CENTRAL ASIA
58
Регион КЦА: отдельные экономические показатели, 2000–11 годы (В процентах ВВП, если не указано иное)
Среднее Прогноз2000–07 2008 2009 2010 2011
КЦА
Реальный ВВП (годовые темпы) 10.3 6.8 3.7 6.6 5.7
Сальдо счета текущих операций -0.6 8.9 0.4 5.7 8.6
Общее сальдо бюджета 1.4 6.2 0.9 3.4 4.5
Инфляция (годовые темпы в процентах) 9.8 16.5 6.2 7.2 10.1
Экспортеры нефти и газа КЦА
Реальный ВВП (годовые темпы) 10.7 7.0 4.9 7.1 5.8
Сальдо счета текущих операций 0.3 12.4 1.8 7.4 10.7
Общее сальдо бюджета 2.2 8.0 2.2 4.9 6.1
Инфляция (годовые темпы в процентах) 10.2 16.8 6.6 7.2 9.6
Импортеры нефти и газа КЦА
Реальный ВВП (годовые темпы) 8.3 5.8 -3.5 4.0 5.2
Сальдо счета текущих операций -6.3 -14.7 -9.6 -8.5 -10.4
Общее сальдо бюджета -2.8 -3.6 -6.9 -5.3 -5.2
Инфляция (годовые темпы в процентах) 7.8 14.4 4.2 7.4 13.2
Источники: национальные официальные органы; расчеты и прогнозы персонала МВФ.Экспортеры нефти и газа КЦА: Азербайджан, Казахстан, Туркменистан и Узбекистан.Импортеры нефти и газа КЦА: Армения, Грузия, Кыргызская Республика и Таджикистан.

59
4. Caucasus and Central Asia: Sustaining the RecoveryThe sharper-than-envisaged rebound in the CCA in 2010 was led by commodity exports and public investment. To sustain and broaden this recovery, policies will have to confront three short-term challenges: fi rst, countering second-round effects from food and fuel price increases, while protecting the poor; second, resisting expenditure pressures while improving the quality of spending, including by developing safety nets; third, strengthening bank balance sheets, risk management, and supervisory practices to reinvigorate credit growth and address vulnerabilities. Over the medium term, business environment improvements are needed to support diversifi ed and broad-based growth and employment.
Growth Continued to Recover But Infl ation Picked Up The postcrisis recovery took hold in 2010, with growth estimated at 6½ percent, substantially higher than in 2009 (3½ percent). Last year’s outturn was higher than previously projected, except in Armenia and Turkmenistan, and consistent with performance in other emerging and low-income countries. CCA growth was well above the global expansion of 5 percent and growth in Russia of 3¾ percent (Figure 4.1).
The recovery was mainly driven by higher oil and gas exports—helped by favorable prices—and by public investment and fi scal support to sectors affected by the crisis (Figure 4.2a). In the four oil and gas exporters—Azerbaijan, Kazakhstan, Turkmenistan, and Uzbekistan—growth averaged 7 percent, compared with 4 percent in the oil and gas importing countries (Armenia, Georgia, Kyrgyz Republic, Tajikistan), although those countries benefi ted from higher mineral and metals prices.
The recovery in 2010 is likely to have narrowed output gaps in CCA countries.1 However, precrisis growth drivers did not fully recover and private demand remained subdued in countries like Kazakhstan, restrained by weak fi nancial systems
Prepared by Ana Lucía Coronel and Mark Horton with input from country teams.1 Estimating potential output in the CCA countries is complicated by data constraints, interactions between natural resource sectors and the rest of CCA economies, structural changes, and demand and supply shocks.
and ongoing deleveraging. Remittances—a key source of infl ows and support for domestic construction activities in Armenia, the Kyrgyz Republic, and Tajikistan—picked up from 2009, but remained well off 2008 levels (Figure 4.2b). Similarly, in Georgia and Kazakhstan, foreign direct investment (FDI) continued to be well below precrisis levels, and there was a further net outfl ow of fi nancing to foreign banks from Kazakhstan in 2010, in sharp contrast to the precrisis period.
Headline infl ation increased in all countries, mainly following upward pressure on global commodity prices, but in some cases also demand pressures (Figures 4.3a and 4.3b). Nonfood infl ation picked up in some countries (Kyrgyz Republic, Tajikistan, Uzbekistan). For the region as a whole, consumer price index (CPI) infl ation increased by 1 percentage point to average 7¼ percent (year-on-year) in 2010.
Figure 4.1Real GDP (Annual percentage growth)
Sources: National authorities; IMF World Economic Outlook; and IMF staff projections and calculations.
9
12
15
-9
-6
-3
0
3
2000-08
CCA oil and gas exportersCCA oil and gas importersRussiaWorldChina
6
201120102009

REGIONAL ECONOMIC OUTLOOK: MI DDLE EAST AND CENTRAL ASIA
60
Figure 4.2aExports of CCA Oil and Gas Exporters(Billions of U.S. dollars)
80
100 2009 Exports
40
60
2010 Exports
2011 Exports
0
20
AZE KAZ TKM UZB
Sources: National authorities; and IMF staff calculations. Sources: National authorities; and IMF staff projections and calculations.
15 Exports Remittances
9
12
3
6
02007 2008 2009 2010 2011
Figure 4.2bExports and Net Remittances of CCA Oiland Gas Importers (Billions of U.S. dollars)
Figure 4.3aAggregated Headline and Nonfood Inflation, CCA Oil and Gas Exporters(GDP weighted CPI; year-on-year percent change; 2007–10)
Sources: National authorities; and IMF staff calculations.1January and February 2011 do not include Turkmenistan.
20
25Oil and gas exporters nonfood
10
15Oil and gas exporters headline¹
-5
0
5
Jan-07 Aug-07 Mar-08 Oct-08 May-09 Dec-09 Jul-10 Feb-11
Sources: National authorities; and IMF staff calculations.
Figure 4.3b
(GDP weighted CPI; year-on-year percent change; 2007–10)
Aggregated Headline and Nonfood Inflation, CCA Oil and Gas Importers
15
5
-5
0 Oil and gas importers nonfood
Oil and gas importers headline
10
Jan-07 Aug-07 Mar-08 Oct-08 May-09 Dec-09 Jul-10 Feb-11
The external position of CCA countries strengthened in 2010. Current account balances improved by 1 percentage point of GDP in the oil and gas importing countries and by 5½ percentage points in the oil and gas exporters in 2010. However, current account defi cits remain high in Armenia and Georgia, and a large public investment program led to a large current account defi cit in Turkmenistan for the second year in a row. Foreign exchange reserves generally increased, particularly in Azerbaijan and Kazakhstan, where there was also a signifi cant accumulation of assets in sovereign wealth funds. International reserves are generally at healthy levels across the region, although somewhat low in Tajikistan relative to common international benchmarks.
Continuing Recovery at a Moderating PaceCurrent projections point to a moderation of growth across the CCA, from 6½ percent in 2010 to 5¾ percent in 2011. This is driven by lower growth in CCA oil and gas exporting countries, despite higher oil prices, as oil production is expected to grow at a slower pace in Kazakhstan and to decline in Azerbaijan. Non-oil GDP growth is projected to ease slightly from the strong rebound in 2010 in both countries and in Turkmenistan. In the oil and gas importers, growth is expected to accelerate, on average, refl ecting a recovery from last year’s poor harvest in Armenia and a rebound

4. CAUCASUS AND CENTRAL ASIA: SUSTAINING THE RECOVERY
61
(Figure 4.4a). Oil and gas exporting countries, notably Azerbaijan and Kazakhstan, are expected to continue to benefi t from rising commodity prices and to improve their overall fi scal positions despite sustained fi scal support to the economy. However, non-oil defi cits will remain signifi cantly higher than before the crisis (Figure 4.4b). All CCA countries are facing pressures to respond to the surge of infl ation. This may involve increases in public spending ranging from use of strategic grain reserves to targeted transfers, to more generalized subsidies and possible wage and pension hikes. Tax cuts intended to ease food price increases will also contribute to fi scal pressures.
Central banks in the region, which had generally conducted accommodative monetary policies to stimulate credit growth in the wake of the crisis, have mostly started to respond to the surge of headline infl ation by increasing policy rates—so far, by 50–550 basis points (Figure 4.5). Although policy rates in some countries have limited operational effectiveness, these rate increases are important signals, and the monetary authorities of Armenia, Azerbaijan, Georgia, and the Kyrgyz Republic have also strengthened reserve and liquidity requirements.
Banking sector balance sheets remain impaired in some CCA countries (Kazakhstan, Kyrgyz
from the civil unrest and crisis-related contraction in the Kyrgyz Republic. Growth is expected to slow but remain strong in Georgia and Tajikistan.
With global fuel and food prices expected to increase by 18 and 15 percent, respectively, in 2011, infl ation is projected to pick up to almost 10 percent in 2011, nearly 3 percentage points higher than previously envisaged. Annual CPI infl ation is approaching double digits in Azerbaijan and Kazakhstan, and has already passed this threshold in the other CCA countries (except Turkmenistan). Higher commodity prices will result in stronger current account balances in the oil and gas exporting countries, and weaker among the oil and gas importers.
The authorities’ announced policies for 2011 point to further fi scal consolidation in Armenia and Georgia in light of relatively constrained fi scal space and signs of self-sustained recovery. In contrast, a widening of the fi scal defi cit is expected in the Kyrgyz Republic, where increased spending is intended to address the impact of last year’s political crisis; Turkmenistan, where high public investment levels will continue; and Tajikistan2
2 In Tajikistan, the path of the overall fiscal deficit (5.2 percent of GDP in 2009, 3.0 percent in 2010, and 5.4 percent in 2011) reflects under-execution of the budget in 2010 (lower-than-expected current spending and lower foreign-financed capital expenditure).
Figure 4.4aFiscal Balances in Oil and Gas Importers(Percent of GDP)
Sources: National authorities; and IMF staff calculations and projections.
0
-6
-4
-2
-12
-10
-8
-14ARM GEO KGZ TJK
2007 2008 2009 2010 2011
Figure 4.4bNon-Oil-Gas Fiscal Balances in Oil and GasExporters(Percent of non-oil-gas GDP)
Sources: National authorities; and IMF staff calculations and projections.1Fiscal balance over GDP is used.
20
10
20
-10
0
-40
-30
-
2007 2008 2009 2010 2011
-50AZE KAZ TKM UZB¹

REGIONAL ECONOMIC OUTLOOK: MI DDLE EAST AND CENTRAL ASIA
62
voice and accountability in some countries, and tensions and unresolved confl icts throughout the region (Box 4.1).
Policy Challenges: Achieving Sustainable and Inclusive GrowthIn the period immediately ahead, CCA policymakers will need to adapt policies to the evolving situation to maintain macroeconomic stability while protecting the most vulnerable. In doing so, they will need to address several increasingly pressing challenges:
• The surge of infl ation with risks of infl ationary expectations becoming entrenched.
• An upsurge of social pressures to increase fi scal spending, which may generate threats to macroeconomic stability.
• The poor quality of bank portfolios, which restrains credit growth and effective intermediation.
Over the medium term, sustaining growth, employment creation, and poverty reduction are the main challenges. Progress will depend on reforms to develop adequate social safety nets, increase the role of the private sector, and diversify economies away from natural
Republic, Tajikistan), requiring continued policy action. Banking sector conditions have improved in Armenia and Georgia—where bank profitability has continued to recover, foreign funding and domestic credit have picked up, and nonperforming loans (NPLs) have declined. Elsewhere, borrowers are struggling to pay back loans, given the decline in demand and depreciation of currencies. In Kazakhstan and the Kyrgyz Republic, the share of NPLs remains particularly high (Figure 4.6). In some CCA countries, private-sector credit growth is negative (Kazakhstan) or sluggish and dependent on central bank support (Tajikistan).
Risks to the OutlookRisks to the outlook are mixed. Growth could be stronger if the upward movement in oil prices continues, with higher exports and investment. CCA oil and gas importers would face a larger import bill, but would also benefi t from higher remittances from Russia. Downside risks are posed by heightened infl ation expectations, lingering fi nancial sector problems, and a possible deterioration of the global economy. The sociopolitical environment in the CCA also poses risks, with the possibility of spillovers from the events in the Middle East and North Africa, given the high poverty levels and perceptions of low
Figure 4.5Adjustment in Policy Rates, 2010–11(Policy rate; percent)
Source: National authorities.
12
14
16
0
2
4
6
8
10
UZBApr-10 Mar-11
AZE
KAZ
TKM
ARM
GEO
KGZ
TJK
Figure 4.6High and Mostly Rising Levels of Nonperforming Loans(90-day basis; percent of total loans)
Source: National authorities.130-day basis.
0
4
8
12
16
20
24
28
AZE
2008200920102011 (latest)
KAZ TKM UZB ARM GEO KGZ TJK¹

4. CAUCASUS AND CENTRAL ASIA: SUSTAINING THE RECOVERY
63
Box 4.1
Poverty and the Social Context in the CCA
Although offi cial data do not capture poverty, inequality, and unemployment adequately in all CCA countries, evidence suggests that poverty is still high, especially in Tajikistan, the Kyrgyz Republic, and Uzbekistan. Income inequality, unemployment, and underemployment are also matters of concern throughout the region. Because of the Soviet legacy, human development indicators are better than in other countries at a similar income level; however, they are now deteriorating in some countries.
CCA countries employ various forms of social assistance, but in some cases insuffi cient funding, design challenges, weak administrative capacity, and corruption limit their effectiveness.1 Governments generally rely heavily on simpler but distortionary and poorly targeted measures, such as entitlement spending and administrative price controls. Therefore, social protection arrangements need to be enhanced to protect the most vulnerable.
Poverty, inequality, and inadequate social protection combined with corruption elevate the risk of social disruption (see Figure). Signifi cant enhancements in governance, transparency, and accountability, and a boost in investment in human development, should help provide employment opportunities, including to the sizable youth population, which in a few years will enter the job market in large numbers (particularly in Central Asia).
Massive migration to Russia helps mitigate unemployment and poverty, but remittances have proven vulnerable to downturns in the cyclical, migrant-employing sectors in Russia. The labor-supplying countries of the region have not “invested” suffi ciently in migration infrastructure to enhance benefi ts in terms of stable employment and, thereby, social protection. Given that the ongoing migration to Russia acts as a safety valve in terms of job opportunities and remittance fl ows, better skills and language training would benefi t the migrating population, and, with other business environment reforms, eventually lead to better prospects at home.
Prepared by Nadeem Ilahi and David Amaglobeli.1 Social programs in Georgia and Armenia are better targeted as they use proxy means-testing.
Human Development and Corruption(2010 UN Human Development Indicators and Transparency International Corruption Perception Index)
Sources: United Nations Development Programme; and Transparency International.
GeorgiaKazakhstan
ArmeniaAzerbaijan
Turkmenistan
Central and Eastern Europe (average)
60
80
Low-Income Countries (average)
TajikistanKyrgyz Republic
Uzbekistan
0
20
40
0
Hig
her L
evel
of H
uman
D
evel
opm
ent
Less Corruption20 40 60 80
resources. Improving the business environment and achieving greater regional synergies would enhance domestic and regional competitiveness and achieve greater economies of scale. Although CCA countries have made progress over the past decade, they lag behind other emerging market economies—and, in some cases, low-income countries—in transparency, governance, and institutional quality. Further substantial improvements should be an important part of the medium-term agenda.
Is Infl ation a Concern? The run-up of infl ation is complicating policymaking and adversely affecting the poor. Food prices are a key driver, as food comprises over 50 percent of consumption baskets in most countries. Fuel price increases are also a factor, and in some countries, demand pressures also appear to be contributing (Box 4.2). In the absence of effective social safety nets, CCA governments are taking (or considering) administrative measures

REGIONAL ECONOMIC OUTLOOK: MI DDLE EAST AND CENTRAL ASIA
64
Box 4.2
What Is Driving Infl ation in the CCA?
Headline infl ation increased in 2010 in all countries, mainly following upward pressure on global commodity prices, but in some cases also refl ecting other factors.
Global food infl ation. The current rise in global food prices has contributed to marked increases in headline infl ation throughout the CCA.1 This refl ects high weights on food items in overall CPI baskets, signifi cant dependence on imported food, and a strong link between food prices and infl ation expectations (see Table). Adverse weather conditions also affected agricultural production in Armenia, Azerbaijan, and Kazakhstan. Domestic food price infl ation, which appears highly correlated with global food infl ation, increased from an average of 4 percent year-on-year in June 2010 to 17 percent in January 2011, with the rise most pronounced in Azerbaijan, Georgia, Kazakhstan, the Kyrgyz Republic, and Tajikistan.
Fuel prices. Rising global energy prices are also contributing to infl ationary pressures. Fuel and energy shares in CPI baskets range from 1–2 percent in Azerbaijan and Tajikistan to 9–13 percent in Armenia, Georgia, and Kazakhstan. Although various subsidy and price regulation mechanisms limit the direct pass-through of rising global energy prices—mainly in the oil and gas exporting countries—indirect channels, particularly distribution costs and infl ation expectations, can quickly transmit external energy price shocks, reinforcing the effects of the food price shock.
Firming recoveries, accommodative policies, and capital infl ows. The CCA economies have begun to recover, aided by global conditions and accommodative domestic policies. Although there are few signs of overheating, core infl ation has increased in some countries, and strong base money expansion throughout most CCA countries underscores the potential for future infl ationary pressures. For now, credit and real income growth generally remain weak, but the region is once again experiencing foreign exchange infl ows, with a rebound in remittances to the commodity importers, and oil-price-related FDI and revenue fl ows to the commodity-exporting countries.
The Role of Food in CCA Inflation
ARM AZE GEO KAZ KGZ TJK TKM UZBFood share in CPI1 48 53 39 39 58 58 55 58Correlation between Global Food Prices and:
Headline Inflation 0.72 0.79 0.80 0.76 0.75 0.77 0.82 0.69Food Inflation 0.79 0.81 0.82 0.79 0.81 0.79 0.84 0.68
Net food importer Yes Yes Yes No Yes Yes Yes No
Sources: United Nations, Food and Agriculture Organization (FAO) and Comtrade; national authorities; and IMF staff calculations.1Parts per 100.
Prepared by Ali Al-Eyd and Niklas Westelius.1 The degree of pass-through from import to domestic prices depends on exchange rate movements, the share of imported goods in the consumption basket, domestic market structure, and distribution costs.
to counter price increases and protect the poor. These include actions to limit rises in the price of key staple foods and fuels (Uzbekistan); reduced customs duties on wheat fl our (Kyrgyz Republic);
exemptions in value-added tax rates (Azerbaijan, Tajikistan); or activation of strategic reserves, including for grain. In Kazakhstan, memoranda were signed with producers and processors to

4. CAUCASUS AND CENTRAL ASIA: SUSTAINING THE RECOVERY
65
provide short-term relief. However, these should be selective, time-bound, and removed as better-targeted instruments are developed. The fi scal cost of these schemes should be transparently disclosed and may need to be offset by savings in other areas in countries where fi scal space is limited.
Looking further ahead, structural reforms should be pursued to enhance the resilience of CCA economies and to improve the effi ciency of macroeconomic policies, including:
• Strengthening the monetary transmission mechanism. Monetary policy effectiveness would be increased by further moving away from fi xed or heavily managed exchange rates, enhancing central bank independence, promoting domestic fi nancial market development to reduce dollarization, and encouraging increased competition in the banking sector.
• Developing better social safety nets. Safety nets should aim at targeted and cost-effective income support based on cash or near-cash transfer schemes.
• Enhancing supply responses. Reforms are needed, particularly in agriculture, to improve competitiveness, labor market fl exibility, and productivity.
Resisting Fiscal Pressures, Improving Expenditure QualityAs the recovery has gained momentum and infl ationary pressures have emerged, governments are fi nding it diffi cult to resist pressures to further raise wages, pensions, and other social payments, particularly in the oil and gas exporting countries, which have ample fi scal space (Figure 4.7). These pressures are also related to political developments—including election cycles. In Kazakhstan and Uzbekistan, for example, public wages are due to increase by a further 25 percent in 2011, and an even larger increase is planned in the Kyrgyz Republic. These wage increases and other
control the rise in bread prices. In Georgia, the authorities have not used administrative measures, but instead distributed electricity and food vouchers to households.
In general, it is advisable that countries allow global commodity price increases (which are beyond their control) to pass through into domestic retail prices. Seeking to avoid this adjustment through the use of administrative measures such as export bans, export taxes, and price controls creates market distortions and could give rise to substantial fi scal costs. Given the importance of food in consumption, headline infl ation will inevitably rise. The main concern for CCA policymakers is that this rise will contribute to worsening infl ation expectations and broadening price pressures, affecting macroeconomic stability and disproportionately hurting the poor. A comprehensive policy response will therefore be needed to effectively address the impact of the food price shock. This would involve:
• Further tightening monetary policy in response to rising infl ation. Experience suggests that, even though the impact may be delayed and hard to detect, higher commodity prices will eventually have second-round effects in the absence of a proactive policy response. With economic recovery now taking hold throughout the region, it is appropriate to move away from accommodative monetary policies.
• Improving communication of monetary policy. Conveying clearly the current and expected causes of infl ation and infl ation objectives would help moderate expectations.
• Establishing a prudent fi scal stance. Enhanced coordination between governments and central banks and guarding against procyclicality will be increasingly important, to ensure that fi scal policy is supportive of price stability. Cautious public wage increases and spending initiatives that are well targeted to supply bottlenecks are crucial to this end.
• Using administrative measures cautiously. Where well-targeted social assistance is hard to implement, administrative measures may

REGIONAL ECONOMIC OUTLOOK: MI DDLE EAST AND CENTRAL ASIA
66
fi scal measures could further fuel infl ation and begin to threaten the achievement of fi scal consolidation plans. The challenge for CCA authorities is to move in parallel to improve the effi ciency of spending, favoring health, education, and other productive expenditures, and avoiding hard-to-reverse nonessential outlays. Efforts to strengthen non-oil revenue performance will also be important.
Strengthening Bank Balance SheetsHigh and rising NPLs have impaired bank fi nancial positions and pose risks to capital adequacy. In Kazakhstan, the Kyrgyz Republic, and Tajikistan, despite ample bank liquidity, banks are unwilling to extend loans, to avoid further risks to their balance sheets. Uncertainties surrounding the stability of funding sources and provisioning needs have increased incentives to maintain cash reserves and restrain lending activity.
Restoring the health of banking systems is therefore a key priority for ensuring credit recovery and effi cient intermediation of resources. In the near term, the authorities in CCA countries with problematic bank assets should undertake comprehensive and transparent resolution strategies that include recapitalizing banks and attracting new capital, if needed. At the same time, strengthened risk management practices, legal and
Figure 4.7Public Spending Growth(Real terms; percent)
Sources: National authorities; and IMF staff calculations and projections.
40
30
50
602005-08200920102011
-20
-10
0
10
20
ARM AZE GEO KAZ KGZ TJK TKM UZB
regulatory changes to improve collateral recovery, and increased competition among borrowers and lenders would help prevent a recurrence of the NPL problem. Some countries have already taken action, such as introducing leverage ratios or new prudential reporting standards. Continued recourse to directed lending in some countries (Tajikistan, Turkmenistan, Uzbekistan) remains an important distortion to the functioning of markets. Restructuring of state-owned enterprises and subjecting them to greater fi nancial discipline are longstanding issues.
Following a marked increase at the outset of the crisis, deposit and credit dollarization has declined in most CCA countries, although it is still above levels prevailing prior to the crisis. Risks inherent to dollarization have been addressed by tightening prudential regulations on foreign exchange funding and lending operations in a number of countries in the region, including Armenia, Georgia, and Kazakhstan. Looking ahead, the supervisory authorities should continue to encourage better risk management practices and enhance coordination between the monetary and fi scal authorities to promote the development of local currency money and capital markets.
Regulatory, supervisory, and governance frameworks need to be improved concurrently to address underlying bank vulnerabilities. Across the region, supervisors need enhanced autonomy, independence, and legal protection. Supervisors must have the power to act on the basis of information and inspections, and should not resort to regulatory forbearance, or feel any pressure to do so. In some countries, macroprudential policies should be introduced or strengthened to address potential vulnerabilities, including excessive reliance on foreign funding and risky lending practices.
Improving the Business Climate to Create Job OpportunitiesCCA economies depend heavily on commodity exports or remittances, and are vulnerable to their volatility. Non-hydrocarbon exports remain at relatively modest levels throughout the region.

4. CAUCASUS AND CENTRAL ASIA: SUSTAINING THE RECOVERY
67
governance, and institutions are therefore crucially needed in the CCA, as in other regions in the world. Finally, a pro-employment strategy should also incorporate a boost to investment in human development.
Regional trade links are relatively low, have declined over the past decade, and have been hampered by the high cost of the required infrastructure, as well as regional tensions and confl ict. Achieving greater regional synergies and economies of scale within CCA countries would also help enhance competitiveness. This would involve further cooperation among countries, including enhancement of trade across borders in the region, a specifi c area where CCA countries score relatively poorly in Doing Business indicators (Boxes 4.3 and 4.4).
CCA countries generally lack diversifi ed production or export bases, and several rely heavily on remittance infl ows linked to construction activity in Russia or Kazakhstan. This has proved to be a fragile source of consumption-led growth.
In this context, sustaining strong, inclusive growth, employment creation, and poverty reduction will depend on invigorated structural reforms to encourage economic diversifi cation and competitiveness. Reforms should help CCA countries move beyond precrisis sources of growth by fostering greater openness and contestability of sectors to new domestic and foreign entrants, and to generate greater activity through enhanced involvement and operations of domestic fi nancial sectors. Improving the business environment and increasing the role of the private sector in the economy are key ingredients in these efforts.
Achieving an investor-friendly environment entails a combination of efforts in several areas. Infrastructure improvements in transportation and telecommunications and a reduction in the role of the state enterprises in the non-oil sector are major challenges throughout the region. In addition, while CCA countries have made some progress over the past decade in strengthening governance and institutions (Figure 4.8), they lag behind other emerging market economies. Less progress has been made in some measures of voice and accountability, rule of law, or control of corruption. Further substantial improvements in transparency,
Sources: The 2009 World Governance Indicators.1EM is the average rank of 19 emerging markets.
Figure 4.8Governance Indicators1(World Governance Indicators; normalized rank 0–100)
60
80
100 CCA Highest CCA Lowest CCA Average
0
20
40
Voice and Accountability
PoliticalStability No
Violence
Government Effectiveness
Regulatory Quality
Rule of Law Corruption
Bet
ter G
over
nanc
e
Control of
EM

REGIONAL ECONOMIC OUTLOOK: MI DDLE EAST AND CENTRAL ASIA
68
Box 4.3
How Integrated Are CCA Countries?
A diffi cult transition. In the 20-year period since achieving independence, CCA countries have had to move away from the Soviet system, where countries became highly specialized in the production of a few commodities, and trade and fi nancial fl ows between the republics were centrally planned. Integration was further complicated by shocks (most notably, the Russian fi nancial crisis of 1998) and frictions between countries in the CCA region. These hampered intraregional cooperation by disrupting trade and transportation links and hindering development of labor, energy, and capital markets.
Low intraregional trade despite efforts to liberalize. On an aggregate level, trade among CCA countries appears lower than would be expected on the basis of the size of the economies and their geographical proximity (Figures 1a, 1b). Only about 5 percent of total exports or imports of these countries are destined for (or come from) other CCA countries. Furthermore, this ratio has been on a declining trend. China and the EU are the main destinations for CCA exports, while imports come mainly from China, the EU, and Russia. China is growing rapidly in importance not only for Central Asia, but also for the Caucasus.
Low aggregate numbers for intra-CCA trade are driven to some extent by the region’s two major exporters— Azerbaijan and Kazakhstan. Both primarily export oil. When these two countries are excluded, the share of other CCA countries in exports and imports increases from 5 to a still relatively low 15 percent, and the declining trend is no longer evident. This trade consists primarily of agricultural commodities.
As most CCA countries have substantially reduced traditional tariff and nontariff barriers, the low intraregional trade is surprising. Remaining impediments are mostly institutional. Most CCA countries rank poorly on indicators of trading across borders, such as the number of documents and days needed for export or import procedures. Costs of exporting or importing are higher than in other transition economies (Figure 2).
Figure 1aCCA Exports, 2010(Percent of total)
4.46.8
14.735.9 Intra-CCA
Russia
China
EU
US
Others
31.86.4
Source: IMF, Direction of Trade Statistics.
Figure 1bCCA Imports, 2010(Percent of total)
Source: IMF, Direction of Trade Statistics.
Intra-CCA
Russia
China
EU
US
Others
5.2
24.730.9
2.6
23.013.5
Prepared by Dmitriy Rozhkov.

4. CAUCASUS AND CENTRAL ASIA: SUSTAINING THE RECOVERY
69
Efforts are needed to strengthen cooperation. Initiatives to strengthen regional cooperation include projects implemented under the Central Asia Regional Economic Cooperation Program (CAREC) in the areas of energy, transport, and trade facilitation. CAREC also provides member countries with a forum to discuss their trade policies.1 Still, there are signifi cant, unrealized benefi ts from regional integration. For example, while foreign companies are often active in several countries of the region—in telecommunications, banking, insurance, construction, and energy—investment fl ows among CCA countries are negligible. There are only a few examples of banks or other companies from one CCA country being active in another. The degree of country “ownership” of regional projects has also varied. These projects have often been driven by non-CCA countries or multilateral institutions. Improvements in governance and the business environment across the region would help in attracting intra-CCA and other FDI and increasing interest in regional projects.
1 As discussed in Box 4.4, another example of regional efforts is the Central Asia–China gas pipeline.
Source: World Bank, Ease of Doing Business Rankings, 2011.
2,500
3,000
3,500
4,000
1,000
1,500
2,000
0
500
Chi
na
Latv
ia
Est
onia
Pol
and
Turk
eyC
zech
Rep
.
Bos
nia
Cro
atia
Ser
bia
Rus
sia
Sin
gapo
re
Viet
nam
Pak
ista
n
Chi
na
Slo
veni
aA
lban
ia
Lith
uani
a
Hun
gary
Rom
ania
Geo
rgia
Slo
vak
Rep
.B
ulga
riaU
krai
neA
rmen
iaM
oldo
vaB
elar
us
Mon
golia
Aze
rbai
jan
Kaz
akhs
tan
Kyr
gyz
Rep
.U
zbek
ista
nTa
jikis
tan
Afg
hani
stan
Hon
g K
ong
SA
R,
The Cost of Exporting
Figure 2Trading Across Borders (U.S. dollars per container)
4,500
5,000
2,500
3,000
3,500
4,000
1,000
1,500
2,000
0
500
Chi
na
Viet
nam
Pak
ista
nA
lban
iaE
ston
iaS
love
nia
Latv
iaP
olan
dLi
thua
nia
Turk
eyC
roat
ia
Rom
ania
Bos
nia
Hun
gary
Geo
rgia
Ser
bia
Ukr
aine
Bul
garia
Bel
arus
Rus
sia
Mol
dova
Arm
enia
Mon
golia
Sin
gapo
re
Chi
na
Cze
ch R
ep.
Slo
vak
Rep
.
Kaz
akhs
tan
Kyr
gyz
Rep
.A
zerb
aija
nA
fgha
nist
anTa
jikis
tan
Uzb
ekis
tan
Source: World Bank, Ease of Doing Business Rankings, 2011.
Hon
g K
ong
SA
R,
The Cost of Importing

REGIONAL ECONOMIC OUTLOOK: MI DDLE EAST AND CENTRAL ASIA
70
Box 4.4
New Pipelines in the Caucasus and Central Asia Region
The fi rst line of the Central Asia–China gas pipeline began operations at end-2009. The pipeline starts in Turkmenistan and transits Uzbekistan and Kazakhstan (map). With a second, parallel line (opening in 2011), capacity will reach 40 billion cubic meters (bcm) per year. The pipeline currently delivers gas from Turkmenistan, and 2010 volumes were about 4 bcm. Exports from Uzbekistan will come onstream in 2011, and an extension will link in gas supplies in southwestern Kazakhstan. In addition, a new pipeline from Turkmenistan to Iran was opened in early 2010, doubling existing capacity.
The projects promise to have a signifi cant impact on the region:
• Diversifying export destinations. Diverse destinations will reduce vulnerability to lower demand from Russia, strengthen Central Asia’s ability to negotiate prices in line with global trends, and generate new revenues from transit.
• Promoting construction and employment. The projects have contributed to capital infl ows and allowed Central Asian countries to cushion the negative effect of the global downturn.
• Supporting regional cooperation. The fi rst line of the China pipeline was built and became operational in less than 28 months, providing an important example of cooperation that could be extended to other projects and sectors.
• Setting the stage for future investments. Together with an East–West pipeline in Turkmenistan, construction of which commenced in 2010 to connect Turkmenistan’s eastern fi elds with the Caspian and facilitate exports to Europe, the China pipeline may prepare the ground for a possible pipeline from Central Asia to Afghanistan, Pakistan, and India.
Prepared by Svetlana Cerovic.
Central Asia–China Gas Pipeline
Adapted from Wikipedia, http://en.wikipedia.org/wiki/Central_Asia_%E2%80%93_China_gas_pipeline.

4. CAUCASUS AND CENTRAL ASIA: SUSTAINING THE RECOVERY
71
Selected Economic Indicators: CCAAverage Proj.
2000–05 2006 2007 2008 2009 2010 2011
Real GDP Growth 9.4 13.6 12.3 6.8 3.7 6.6 5.7
(Annual change; percent)
Armenia 11.2 13.2 13.7 6.9 -14.2 2.6 4.6
Azerbaijan 11.3 34.5 25.0 10.8 9.3 5.0 2.8
Georgia 6.5 9.4 12.3 2.4 -3.8 6.4 5.5
Kazakhstan 10.3 10.7 8.9 3.2 1.2 7.0 5.9
Kyrgyz Republic 4.1 3.1 8.5 7.6 2.9 -1.4 5.0
Tajikistan 9.2 7.0 7.8 7.9 3.9 6.5 5.8
Turkmenistan 16.6 11.0 11.1 14.7 6.1 9.2 9.0
Uzbekistan 5.1 7.5 9.5 9.0 8.1 8.5 7.0
Consumer Price Inflation 9.7 9.3 11.4 16.5 6.2 7.2 10.1
(Year average; percent)
Armenia 2.6 2.9 4.4 9.0 3.5 8.2 9.3
Azerbaijan 4.1 8.4 16.6 20.8 1.5 5.7 10.3
Georgia 5.5 9.2 9.2 10.0 1.7 7.1 12.6
Kazakhstan 8.2 8.7 10.8 17.1 7.4 7.4 9.1
Kyrgyz Republic 6.5 5.6 10.2 24.5 6.8 7.8 18.8
Tajikistan 19.1 10.0 13.2 20.4 6.5 6.5 13.9
Turkmenistan 8.4 8.2 6.3 14.5 -2.7 4.4 6.1
Uzbekistan 18.0 14.2 12.3 12.7 14.1 9.4 11.6
General Government Fiscal Balance 0.6 4.2 3.1 6.2 0.9 3.4 4.5
(Percent of GDP)
Armenia1 -2.6 -2.0 -2.3 -1.8 -7.8 -4.9 -3.9
Azerbaijan1 0.2 -0.2 2.6 20.8 6.8 13.9 16.9
Georgia -1.1 -3.0 -4.7 -6.3 -9.2 -6.6 -4.0
Kazakhstan 2.4 7.2 4.7 1.1 -1.4 1.3 1.8
Kyrgyz Republic -5.6 -2.1 -0.3 0.0 -3.6 -6.5 -8.9
Tajikistan -3.0 1.7 -5.5 -5.1 -5.2 -3.0 -5.4
Turkmenistan2 1.0 5.3 3.9 10.0 7.8 2.1 1.0
Uzbekistan -0.6 5.2 5.3 10.7 3.1 4.6 7.0
Current Account Balance -1.6 3.2 1.6 8.9 0.4 5.7 8.6
(Percent of GDP)
Armenia -6.4 -1.8 -6.4 -11.8 -16.0 -13.7 -12.4
Azerbaijan -12.2 17.6 27.3 35.5 23.6 27.7 28.4
Georgia -8.0 -15.1 -19.7 -22.6 -11.2 -9.8 -13.0
Kazakhstan -1.4 -2.5 -8.1 4.6 -3.7 2.5 5.8
Kyrgyz Republic -0.1 -3.1 -0.2 -8.1 2.0 -7.4 -8.7
Tajikistan -2.8 -2.8 -8.6 -7.6 -5.9 2.2 -4.1
Turkmenistan 4.1 15.7 15.5 16.5 -16.1 -11.4 -4.7
Uzbekistan 3.8 9.1 7.3 8.7 2.2 6.7 10.0
Sources: National authorities; and IMF staff estimates and projections.1Central government.2State government.


73
Statistical Appendix
The IMF’s Middle East and Central Asia Department (MCD) countries and territories comprise Afghanistan, Algeria, Armenia, Azerbaijan, Bahrain, Djibouti, Egypt, Georgia, Iran, Iraq, Jordan, Kazakhstan, Kuwait, the Kyrgyz Republic, Lebanon, Libya, Mauritania, Morocco, Oman, Pakistan, Qatar, Saudi Arabia, Somalia, Sudan, Syria, Tajikistan, Tunisia, Turkmenistan, the United Arab Emirates, Uzbekistan, the West Bank and Gaza, and Yemen.
The following statistical appendix tables contain data for 30 MCD countries. Data revisions refl ect changes in methodology and/or revisions provided by country authorities.
All data refer to the calendar years, except for the following countries, which refer to the fi scal years: Afghanistan and Iran (March 21/March 20), Qatar (April/March), and Egypt and Pakistan (July/June).
Data in Table 5 relate to the calendar year for all aggregates and countries, except for Iran, for which the Iranian calendar year (beginning on March 21) is used.
In Tables 3, 9, and 10, “oil” includes gas, which is also an important resource in several countries.
REO aggregates are constructed using a variety of weights as appropriate to the series:
• Country group composites for the growth rates of monetary aggregates and exchange rates are weighted by GDP converted to U.S. dollars at market exchange rates (both GDP and exchange rates are averaged over the preceding three years) as a share of MCD or group GDP.
• Composites for other data relating to the domestic economy (Tables 1, 3, 5, and 7–13), whether growth rates or ratios, are weighted by GDP valued at purchasing power parities (PPPs) as a share of total MCD or group GDP.
• Composites relating to the external economy (Tables 17 and 19) are sums of individual country data after conversion to U.S. dollars at the average market exchange rates in the years indicatedfor balance of payments data and at end-of-year market exchange rates for debt denominated in U.S. dollars.
Tables 2, 4, 14–16, and 18 are sums of the individual country data.

REGIONAL ECONOMIC OUTLOOK: MI DDLE EAST AND CENTRAL ASIA
74
Table 1. Real GDP Growth(Annual change; percent)
Average Proj.2000–05 2006 2007 2008 2009 2010 2011
MENAP1 5.2 5.9 6.1 4.7 2.1 3.9 3.9Oil exporters1 5.6 5.7 6.2 4.7 0.7 3.5 4.9
Algeria 4.5 2.0 3.0 2.4 2.4 3.3 3.6Bahrain 6.0 6.7 8.4 6.3 3.1 4.1 3.1Iran, I.R. of 5.5 5.8 7.8 1.0 0.1 1.0 -0.0Iraq ... 6.2 1.5 9.5 4.2 0.8 9.6Kuwait 7.1 5.3 4.5 5.0 -5.2 2.0 5.3Libya 4.3 6.7 7.5 2.3 -2.3 4.2 ...Oman 3.3 5.5 6.7 12.9 1.1 4.2 4.4Qatar 8.7 18.6 26.8 25.4 8.6 16.3 20.0Saudi Arabia 4.0 3.2 2.0 4.2 0.6 3.7 7.5Sudan 6.4 11.3 10.2 6.8 6.0 5.1 4.7United Arab Emirates 8.1 8.8 6.5 5.3 -3.2 3.2 3.3Yemen 4.5 3.2 3.3 3.6 3.9 8.0 3.4
Oil importers 4.4 6.3 6.1 4.8 4.7 4.7 2.3Afghanistan, Rep. of ... 5.6 13.7 3.6 20.9 8.2 8.0Djibouti 2.4 4.8 5.1 5.8 5.0 4.5 4.8Egypt 4.0 6.8 7.1 7.2 4.7 5.1 1.0Jordan 6.0 7.9 8.5 7.6 2.3 3.1 3.3Lebanon 3.4 0.6 7.5 9.3 8.5 7.5 2.5Mauritania 3.7 11.4 1.0 3.5 -1.2 4.7 5.2Morocco 4.4 7.8 2.7 5.6 4.9 3.2 3.9Pakistan 4.9 6.1 5.6 1.6 3.4 4.8 2.8Syrian Arab Republic 3.8 5.0 5.7 4.5 6.0 3.2 3.0Tunisia 4.4 5.7 6.3 4.5 3.1 3.7 1.3
CCA 9.4 13.6 12.3 6.8 3.7 6.6 5.7
Oil and gas exporters 9.7 14.5 12.6 7.0 4.9 7.1 5.8Azerbaijan 11.3 34.5 25.0 10.8 9.3 5.0 2.8Kazakhstan 10.3 10.7 8.9 3.2 1.2 7.0 5.9Turkmenistan 16.6 11.0 11.1 14.7 6.1 9.2 9.0Uzbekistan 5.1 7.5 9.5 9.0 8.1 8.5 7.0
Oil and gas importers 7.7 8.8 11.2 5.8 -3.5 4.0 5.2Armenia 11.2 13.2 13.7 6.9 -14.2 2.6 4.6Georgia 6.5 9.4 12.3 2.4 -3.8 6.4 5.5Kyrgyz Republic 4.1 3.1 8.5 7.6 2.9 -1.4 5.0Tajikistan 9.2 7.0 7.8 7.9 3.9 6.5 5.8
MemorandumMENA1 5.2 5.8 6.2 5.1 1.8 3.8 4.1GCC 5.5 5.9 5.8 7.2 0.2 5.0 7.8Maghreb1 4.4 4.8 4.2 3.5 2.4 3.5 3.3Mashreq 4.0 6.1 7.0 6.9 5.1 5.0 1.5
Sources: National authorities; and IMF staff estimates and projections.12011 data exclude Libya.

STATISTICAL APPENDIX
75
Table 2. Nominal GDP(Billions of U.S. dollars)
Average Proj.2000–05 2006 2007 2008 2009 2010 2011
MENAP1 1,043.5 1,706.8 1,999.4 2,475.3 2,203.8 2,546.0 2,982.7
Oil exporters1 738.2 1,289.9 1,516.2 1,895.2 1,587.8 1,858.2 2,237.0Algeria 70.4 117.3 134.3 170.2 139.8 160.3 192.4Bahrain 9.8 15.8 18.5 22.1 19.3 22.7 26.5Iran, I.R. of 135.3 222.1 285.9 330.6 321.2 357.2 420.9Iraq ... 45.1 57.0 86.5 65.2 82.2 108.4Kuwait 49.8 101.6 114.7 148.8 109.5 131.3 172.8Libya 33.2 56.5 71.6 88.9 60.2 74.2 ...Oman 22.7 36.8 41.9 60.6 46.9 55.6 66.0Qatar 25.5 60.5 80.8 110.7 98.3 129.5 194.3Saudi Arabia 223.7 356.6 385.2 476.9 376.3 443.7 578.6Sudan 17.9 36.4 46.5 58.0 55.8 68.4 75.1United Arab Emirates 128.3 222.1 258.2 314.8 270.3 301.9 363.8Yemen 12.1 19.1 21.7 26.9 25.1 31.3 38.3
Oil importers 305.3 416.9 483.3 580.2 616.0 687.8 745.7Afghanistan, Rep. of ... 7.1 8.6 10.2 12.5 15.6 18.3Djibouti 0.6 0.8 0.8 1.0 1.0 1.1 1.2Egypt 88.7 107.4 130.3 162.4 188.6 218.5 231.1Jordan 10.2 15.6 17.8 22.7 25.1 27.5 30.0Lebanon 19.6 22.4 25.1 30.1 34.9 39.2 42.5Mauritania 1.3 2.7 2.8 3.5 3.0 3.8 4.4Morocco 46.9 65.6 75.2 88.9 91.4 103.5 100.3Pakistan 85.0 127.5 143.2 163.9 162.0 174.9 202.8Syrian Arab Republic 23.2 33.4 40.4 52.6 53.9 59.3 68.3Tunisia 26.3 34.4 38.9 44.9 43.5 44.3 46.6
CCA 73.4 160.3 211.4 266.5 237.6 284.5 346.5
Oil and gas exporters 62.9 140.5 184.5 231.7 208.6 253.2 311.8Azerbaijan 7.7 21.0 33.1 46.4 43.1 54.4 72.2Kazakhstan 32.7 81.0 103.1 135.2 113.6 138.4 168.8Turkmenistan 10.6 21.4 26.0 21.5 18.5 21.4 27.6Uzbekistan 11.9 17.0 22.3 28.6 33.5 39.0 43.3
Oil and gas importers 10.5 19.8 26.9 34.8 29.0 31.3 34.6Armenia 2.9 6.4 9.2 11.7 8.5 9.4 9.9Georgia 4.2 7.8 10.2 12.9 10.8 11.7 12.9Kyrgyz Republic 1.8 2.8 3.8 5.1 4.7 4.6 5.1Tajikistan 1.5 2.8 3.7 5.1 5.0 5.6 6.8
MemorandumMENA1 955.1 1,572.2 1,847.6 2,301.2 2,029.4 2,355.5 2,761.6
GCC 459.7 793.4 899.1 1,134.0 920.6 1,084.6 1,402.0Maghreb1 178.2 276.5 322.9 396.4 337.9 386.1 343.7Mashreq 141.7 178.9 213.6 267.8 302.6 344.6 372.0
Sources: National authorities; and IMF staff estimates and projections.12011 data exclude Libya.

REGIONAL ECONOMIC OUTLOOK: MI DDLE EAST AND CENTRAL ASIA
76
Table 3. Oil and Non-Oil Real GDP Growth(Annual change; percent)
Average Proj.2000–05 2006 2007 2008 2009 2010 2011
Non-Oil GDP
MENAP oil exporters1 5.9 7.3 8.2 5.6 3.2 3.5 3.5Algeria 4.8 5.6 6.3 5.9 9.3 5.3 5.3Bahrain 7.8 8.1 9.6 7.2 3.6 4.6 2.7Iran, I.R. of 5.9 6.2 8.6 1.6 1.1 1.1 -0.2Iraq ... 7.5 -2.0 5.4 4.0 4.5 5.0Kuwait 9.7 7.2 9.7 6.1 -1.2 1.8 4.5Libya 2.8 10.7 14.8 7.9 6.0 7.0 ...Oman 6.0 11.3 13.1 16.1 -0.8 3.0 4.5Qatar 9.1 23.7 30.6 27.8 9.6 10.0 9.5Saudi Arabia 4.0 5.1 4.6 4.3 3.7 4.3 5.4Sudan 5.1 9.7 7.5 8.5 6.4 6.1 5.1United Arab Emirates 9.6 9.5 9.1 6.3 0.6 2.1 3.3Yemen 5.2 4.7 5.3 4.8 4.1 4.4 3.8
CCA oil and gas exporters 10.6 11.2 9.9 8.3 2.8 7.1 6.1Azerbaijan 10.5 12.1 11.3 15.7 3.0 7.6 6.0Kazakhstan 9.7 10.8 9.1 3.2 0.5 6.6 6.0Turkmenistan 17.2 11.6 10.7 18.6 14.9 8.7 7.0Uzbekistan ... ... ... ... ... ... ...
Memorandum
GCC 6.3 8.0 9.0 8.0 2.9 4.2 5.3
Oil GDPMENAP oil exporters1 5.5 2.6 1.1 1.3 -6.1 3.5 7.2
Algeria 4.1 -2.5 -0.9 -2.3 -6.0 -0.9 0.8Bahrain -1.0 -1.0 1.1 0.4 -0.3 0.1 6.2Iran 2.9 2.7 1.7 -3.7 -9.8 0.0 2.0Iraq ... 5.3 4.0 12.3 4.3 -1.5 12.8Kuwait 4.5 2.8 -2.6 3.3 -11.4 2.2 6.6Libya 5.6 4.3 2.8 -1.6 -8.9 1.6 ...Oman 0.6 -2.5 -3.6 6.8 4.9 6.5 4.1Qatar 8.4 14.3 23.3 23.1 7.7 22.7 29.5Saudi Arabia 4.3 -0.8 -3.6 4.2 -6.7 2.3 13.3Sudan 49.7 26.5 33.0 -4.4 2.6 -3.0 1.1United Arab Emirates 3.9 6.5 -2.7 1.6 -9.6 5.3 3.4Yemen 0.8 -8.3 -13.1 -8.1 1.6 51.0 -0.3
CCA oil and gas exporters 15.9 22.0 15.4 3.6 4.7 9.1 6.2Azerbaijan 13.2 62.0 37.3 6.9 14.8 4.9 -0.3Kazakhstan 16.3 9.9 6.9 2.8 7.1 10.2 5.5Turkmenistan 17.4 8.6 12.6 -0.7 -35.4 13.5 25.0Uzbekistan ... ... ... ... ... ... ...
MemorandumGCC 4.1 2.1 -0.9 5.5 -5.4 5.5 12.1
Sources: National authorities; and IMF staff estimates and projections.12011 data exclude Libya.

STATISTICAL APPENDIX
77
Table 4. Crude Oil Production and Exports(Millions of barrels per day)
Average Proj.2000–05 2006 2007 2008 2009 2010 2011
Production
MENAP oil exporters1 22.0 26.0 25.8 26.3 24.3 24.7 25.0Algeria 1.1 1.4 1.4 1.3 1.3 1.2 1.3Bahrain 0.2 0.2 0.2 0.2 0.2 0.2 0.2Iran, I.R. of 3.7 4.0 4.1 3.9 3.6 3.6 3.6Iraq ... 2.0 2.0 2.3 2.4 2.4 2.7Kuwait 2.1 2.6 2.6 2.7 2.3 2.3 2.5Libya 1.5 1.8 1.8 1.8 1.6 1.6 ...Oman 0.9 0.7 0.7 0.8 0.8 0.9 0.9Qatar 0.7 0.8 0.8 0.8 0.8 0.8 0.8Saudi Arabia 8.3 9.2 8.8 9.2 8.4 8.6 9.9Sudan 0.2 0.4 0.5 0.5 0.5 0.5 0.5United Arab Emirates 2.2 2.6 2.5 2.6 2.3 2.4 2.5Yemen 0.4 0.4 0.3 0.3 0.3 0.3 0.3
CCA oil and gas exporters 1.5 2.2 2.4 2.5 2.7 2.9 3.0Azerbaijan 0.3 0.6 0.8 0.9 1.0 1.0 1.0Kazakhstan 1.0 1.3 1.4 1.5 1.6 1.7 1.8Turkmenistan 0.2 0.2 0.2 0.2 0.2 0.2 0.2Uzbekistan ... ... ... ... ... ... ...
Memorandum
GCC 14.4 16.2 15.7 16.2 14.8 15.2 16.7Exports2
MENAP oil exporters1 16.1 19.5 19.6 20.1 17.8 17.9 18.2Algeria 0.7 0.9 0.9 0.8 0.7 0.7 0.7Bahrain 0.2 0.1 0.1 0.1 0.2 0.2 0.2Iran 2.4 2.4 2.5 2.4 2.1 2.0 2.0Iraq ... 1.4 1.6 1.8 1.9 1.9 2.1Kuwait 1.3 1.7 1.7 1.8 1.4 1.4 1.5Libya 1.1 1.4 1.5 1.4 1.2 1.2 ...Oman 0.8 0.6 0.6 0.6 0.7 0.7 0.7Qatar 0.7 0.7 0.8 0.8 0.7 0.7 0.7Saudi Arabia 6.4 7.0 7.0 7.3 6.3 6.4 7.5Sudan 0.2 0.2 0.4 0.4 0.4 0.4 0.4United Arab Emirates 2.0 2.4 2.3 2.4 2.1 2.1 2.2Yemen 0.3 0.3 0.2 0.2 0.2 0.2 0.2
CCA oil and gas exporters 1.1 1.7 2.0 2.1 2.3 2.5 2.6Azerbaijan 0.2 0.6 0.7 0.8 0.9 0.9 0.9Kazakhstan 0.9 1.1 1.2 1.2 1.4 1.5 1.6Turkmenistan 0.0 0.0 0.0 0.0 0.1 0.1 0.1Uzbekistan ... ... ... ... ... ... ...
MemorandumGCC 11.4 12.7 12.5 13.0 11.2 11.5 12.7
Sources: National authorities; and IMF staff estimates and projections.12011 data exclude Libya. 2Excluding exports of refined oil products.

REGIONAL ECONOMIC OUTLOOK: MI DDLE EAST AND CENTRAL ASIA
78
Table 5. Consumer Price Inflation(Year average; percent)
Average Proj.2000–05 2006 2007 2008 2009 2010 2011
MENAP1 5.2 8.2 9.8 14.3 7.6 7.5 10.8
Oil exporters1 5.9 8.8 11.2 14.8 5.8 6.8 10.9Algeria 2.3 2.3 3.6 4.9 5.7 4.3 5.0Bahrain 0.7 2.0 3.3 3.5 2.8 2.0 3.0Iran, I.R. of 13.5 11.9 18.4 25.4 10.8 12.5 22.5Iraq 19.8 53.2 30.8 2.7 -2.8 5.1 5.0Kuwait 1.7 3.1 5.5 10.6 4.0 4.1 6.1Libya -3.3 1.4 6.2 10.4 2.8 2.4 ...Oman 0.1 3.4 5.9 12.6 3.5 3.3 3.5Qatar 3.5 11.8 13.8 15.0 -4.9 -2.4 4.2Saudi Arabia -0.1 2.3 4.1 9.9 5.1 5.4 6.0Sudan 7.6 7.2 8.0 14.3 11.3 13.0 9.0United Arab Emirates 3.6 9.3 11.1 12.3 1.6 0.9 4.5Yemen 11.6 10.8 7.9 19.0 3.7 12.1 13.0
Oil importers 3.9 7.1 7.0 13.3 11.1 8.8 10.7Afghanistan, Rep. of ... 7.2 8.6 30.5 -8.3 0.9 14.2Djibouti 2.0 3.5 5.0 12.0 1.7 4.0 4.6Egypt 4.7 7.6 9.5 18.3 11.7 11.6 11.8Jordan 2.1 6.3 4.7 13.9 -0.7 5.0 6.1Lebanon 0.5 5.6 4.1 10.8 1.2 4.5 6.5Mauritania 7.9 6.2 7.3 7.3 2.2 6.1 7.3Morocco 1.5 3.3 2.0 3.9 1.0 1.0 2.9Pakistan 4.6 7.9 7.8 12.0 20.8 11.7 15.5Syrian Arab Republic 2.7 10.4 4.7 15.2 2.8 4.4 6.0Tunisia 2.7 4.1 3.4 4.9 3.5 4.4 4.0
CCA 9.7 9.3 11.4 16.5 6.2 7.2 10.1
Oil and gas exporters 10.0 9.7 11.9 16.8 6.6 7.2 9.6Azerbaijan 4.1 8.4 16.6 20.8 1.5 5.7 10.3Kazakhstan 8.2 8.7 10.8 17.1 7.4 7.4 9.1Turkmenistan 8.4 8.2 6.3 14.5 -2.7 4.4 6.1Uzbekistan 18.0 14.2 12.3 12.7 14.1 9.4 11.6
Oil and gas importers 7.8 6.9 8.8 14.4 4.2 7.4 13.2Armenia 2.6 2.9 4.4 9.0 3.5 8.2 9.3Georgia 5.5 9.2 9.2 10.0 1.7 7.1 12.6Kyrgyz Republic 6.5 5.6 10.2 24.5 6.8 7.8 18.8Tajikistan 19.1 10.0 13.2 20.4 6.5 6.5 13.9
Memorandum
MENA1 5.3 8.3 10.0 14.5 6.1 7.0 10.2GCC 1.1 4.6 6.6 11.0 3.0 3.2 5.3Maghreb1 1.4 2.8 3.6 5.5 3.7 3.2 4.2Mashreq 3.9 7.8 8.0 17.0 8.9 9.6 10.2
Sources: National authorities; and IMF staff estimates and projections.12011 data exclude Libya.

STATISTICAL APPENDIX
79
Table 6. Broad Money Growth(Annual change; percent)
Average Proj.2000–05 2006 2007 2008 2009 2010 2011
MENAP1 15.8 21.7 25.1 18.5 12.4 9.9 13.4
Oil exporters1 17.2 24.8 28.0 19.5 13.2 9.5 15.2Algeria 14.8 18.6 24.1 16.1 3.1 14.3 14.1Bahrain 10.4 14.9 40.8 18.4 5.8 11.1 7.7Iran, I.R. of 30.7 39.2 28.6 16.6 21.7 10.4 24.8Iraq ... 34.6 37.3 35.4 26.7 18.2 35.1Kuwait 9.3 21.7 19.3 15.6 13.4 2.2 10.7Libya 9.7 15.0 37.3 47.3 11.1 10.0 ...Oman 8.0 24.9 37.2 23.1 4.7 11.3 10.0Qatar 20.3 38.0 39.5 19.7 16.9 21.3 10.2Saudi Arabia 10.8 19.3 19.6 17.6 10.7 5.0 11.8Sudan 32.4 27.4 10.3 16.3 23.5 25.4 16.2United Arab Emirates 19.9 23.2 41.7 19.2 9.8 6.2 9.6Yemen 19.6 27.7 16.8 13.7 10.6 9.2 18.0
Oil importers 12.8 13.8 16.6 15.2 9.8 10.9 8.5Afghanistan, Rep. of ... 22.3 14.4 64.9 17.1 19.7 16.0Djibouti 11.2 10.2 9.6 20.6 17.5 12.2 4.8Egypt 13.3 13.4 18.3 15.5 8.4 10.4 5.4Jordan 10.7 14.1 10.6 17.3 9.3 11.5 8.9Lebanon2 9.1 6.4 10.9 15.5 23.2 12.4 8.0Mauritania 21.9 15.7 18.9 13.7 15.2 11.0 14.3Morocco 9.3 17.8 17.0 9.9 5.5 7.7 7.8Pakistan 15.1 14.9 19.3 15.3 9.6 12.5 11.9Syrian Arab Republic 16.8 9.2 12.4 12.5 9.3 10.5 9.1Tunisia 9.6 11.4 12.5 14.4 13.0 11.1 6.9
CCA 36.1 65.3 43.5 36.8 16.5 23.5 21.9
Oil and gas exporters 37.4 69.0 42.6 41.3 16.5 23.9 22.7Azerbaijan 28.8 86.4 72.4 44.0 -0.3 24.3 26.0Kazakhstan 40.7 78.1 25.9 35.4 17.9 14.6 18.4Turkmenistan 32.4 55.9 72.2 62.8 10.9 36.1 31.2Uzbekistan 41.0 37.8 46.9 38.7 40.8 52.4 29.0
Oil and gas importers 28.4 43.1 49.2 6.2 16.7 21.2 16.3Armenia 22.9 32.9 42.3 2.4 16.4 10.6 13.8Georgia 27.9 39.3 49.6 7.0 8.1 28.5 16.0Kyrgyz Republic 22.1 51.6 33.3 12.6 17.9 21.1 15.3Tajikistan 48.0 63.4 78.8 6.3 38.9 25.7 22.4
Memorandum
MENA1 15.9 22.3 25.6 18.5 12.6 9.6 13.5GCC 13.4 22.0 28.3 18.3 11.0 7.0 10.7Maghreb1 11.2 16.7 23.2 20.8 6.7 11.4 11.0Mashreq 13.0 11.7 15.5 15.1 10.4 10.7 6.6
Sources: National authorities; and IMF staff estimates and projections.12011 data exclude Libya. 2Broad money (M5) is defined to include nonresident deposits.

REGIONAL ECONOMIC OUTLOOK: MI DDLE EAST AND CENTRAL ASIA
80
Table 7. General Government Fiscal Balance(Percent of GDP)
Average Proj.2000–05 2006 2007 2008 2009 2010 2011
MENAP1 2.3 7.1 5.2 6.7 -3.6 -0.2 2.4
Oil exporters1 5.8 13.2 10.3 12.9 -2.7 3.0 7.5Algeria 6.6 13.5 4.4 7.7 -6.8 -2.7 5.0Bahrain2 1.4 2.7 1.9 4.9 -6.6 -7.8 1.6Iran, I.R. of 2.0 0.0 2.4 -0.2 -1.9 0.6 4.0Iraq ... 15.5 12.4 -1.2 -21.8 -10.8 -4.4Kuwait2 27.2 35.4 39.8 19.8 23.5 17.4 22.3Libya 12.6 33.1 28.6 30.3 7.0 9.2 ...Oman2 8.4 13.8 11.1 13.8 -1.2 6.2 14.2Qatar 8.8 8.6 10.8 10.3 15.2 12.8 13.8Saudi Arabia 7.7 24.6 15.8 34.4 -4.7 7.7 12.8Sudan -0.6 -4.3 -5.4 -1.4 -4.6 -1.9 -0.2United Arab Emirates3 4.5 18.1 15.4 16.5 -12.6 -1.3 6.5Yemen 0.0 1.2 -7.2 -4.5 -10.2 -4.0 -6.4
Oil importers -5.3 -4.7 -4.8 -5.4 -5.2 -6.0 -6.8Afghanistan, Rep. of ... -3.1 -2.1 -4.3 -1.4 -0.1 -0.6Djibouti -1.8 -2.4 -2.6 1.3 -4.6 -0.5 -0.1Egypt2 -9.9 -8.2 -7.3 -6.8 -6.9 -8.1 -9.7Jordan -3.1 -3.4 -5.5 -5.4 -8.5 -5.4 -6.8Lebanon2 -15.3 -10.4 -10.8 -9.5 -8.2 -7.2 -10.5Mauritania2,4 -6.6 35.8 -1.6 -6.5 -5.1 -0.4 -1.7Morocco2 -5.2 -1.8 0.3 1.5 -2.1 -4.2 -4.9Pakistan -2.7 -3.7 -4.0 -7.3 -5.2 -6.0 -5.0Syrian Arab Republic -2.1 -1.1 -4.0 -2.9 -2.9 -4.8 -6.8Tunisia -2.6 -2.9 -2.8 -0.7 -2.6 -1.2 -4.3
CCA 0.6 4.2 3.1 6.2 0.9 3.4 4.5
Oil and gas exporters 1.3 5.3 4.3 8.0 2.2 4.9 6.1Azerbaijan2 0.2 -0.2 2.6 20.8 6.8 13.9 16.9Kazakhstan 2.4 7.2 4.7 1.1 -1.4 1.3 1.8Turkmenistan5 1.0 5.3 3.9 10.0 7.8 2.1 1.0Uzbekistan -0.6 5.2 5.3 10.7 3.1 4.6 7.0
Oil and gas importers -2.8 -1.6 -3.4 -3.6 -6.9 -5.3 -5.2Armenia2 -2.6 -2.0 -2.3 -1.8 -7.8 -4.9 -3.9Georgia -1.1 -3.0 -4.7 -6.3 -9.2 -6.6 -4.0Kyrgyz Republic -5.6 -2.1 -0.3 0.0 -3.6 -6.5 -8.9Tajikistan -3.0 1.7 -5.5 -5.1 -5.2 -3.0 -5.4
Memorandum
MENA1 3.0 8.6 6.4 8.6 -3.4 0.6 3.3GCC 9.3 22.4 17.5 24.7 -0.8 7.2 12.6Maghreb1 3.1 10.4 6.0 8.2 -2.9 -0.9 0.1Mashreq -8.7 -7.0 -7.0 -6.4 -6.5 -7.4 -9.2
Sources: National authorities; and IMF staff estimates and projections.12011 data exclude Libya. 2Central government.3Consolidated accounts of the federal government and the emirates Abu Dhabi, Dubai, and Sharjah.4Includes oil revenue transferred to the oil fund.5State government.

STATISTICAL APPENDIX
81
Table 8. General Government Total Revenue, Excluding Grants(Percent of GDP)
Average Proj.2000–05 2006 2007 2008 2009 2010 2011
MENAP1 30.1 36.0 34.9 37.2 31.3 32.0 33.3
Oil exporters1 35.3 43.6 41.9 45.2 36.2 38.4 40.7Algeria 37.0 42.7 39.6 47.2 36.3 38.9 42.2Bahrain2 31.7 30.4 28.8 32.0 23.4 24.0 27.9Iran, I.R. of 24.3 29.9 30.7 27.0 25.8 27.3 29.5Iraq ... 74.5 78.9 76.7 68.7 67.3 71.4Kuwait2 63.9 67.3 69.7 59.8 65.5 59.7 58.9Libya 48.6 64.1 66.0 70.1 59.3 59.7 ...Oman2 46.7 48.8 45.4 46.3 39.9 41.6 48.6Qatar 40.3 39.1 40.1 35.0 47.3 41.0 35.6Saudi Arabia 44.0 56.6 50.4 66.0 41.1 48.5 54.1Sudan 15.4 20.5 20.0 21.3 14.8 15.1 17.7United Arab Emirates3 24.8 33.7 33.1 38.6 25.3 28.4 33.5Yemen 32.8 38.2 32.8 36.5 24.6 24.6 24.6
Oil importers 19.2 20.9 21.2 21.6 22.0 20.1 19.7Afghanistan, Rep. of ... 8.2 7.8 8.0 10.3 11.1 11.4Djibouti 26.4 31.1 30.2 28.8 30.6 30.0 30.4Egypt2 20.0 24.1 23.7 24.6 26.3 21.9 21.5Jordan 25.6 28.1 28.4 24.7 23.3 21.7 21.1Lebanon2 20.5 22.1 22.7 22.8 24.0 21.2 21.4Mauritania2,4 28.9 29.4 25.8 23.4 24.7 24.1 21.5Morocco2 22.6 25.1 27.4 29.7 25.9 25.3 24.9Pakistan 13.9 14.1 15.0 14.6 14.5 14.2 13.5Syrian Arab Republic 27.3 25.5 22.7 20.1 23.9 22.0 20.9Tunisia 26.8 26.5 27.4 29.6 29.0 29.5 30.9
CCA 24.9 27.3 28.5 33.2 28.8 30.9 31.1
Oil and gas exporters 26.3 28.3 29.3 34.9 29.7 32.1 32.3Azerbaijan2 24.2 28.0 28.2 51.1 41.6 44.4 43.4Kazakhstan 24.6 27.5 29.3 27.9 22.5 25.4 25.9Turkmenistan5 21.2 20.2 17.3 20.9 22.4 18.2 17.5Uzbekistan 33.1 34.1 35.4 40.5 36.3 40.1 41.8
Oil and gas importers 17.8 21.9 24.3 24.0 23.8 23.8 23.9Armenia2 15.6 17.5 19.3 20.1 20.4 20.1 20.4Georgia6 18.2 25.5 28.7 27.5 27.1 25.9 25.6Kyrgyz Republic 21.1 25.6 28.1 28.0 27.1 28.8 29.6Tajikistan 16.5 18.9 20.5 20.5 20.0 20.9 20.7
Memorandum
MENA1 32.5 38.9 37.7 40.2 33.6 34.5 36.0GCC 42.2 50.9 47.4 54.6 40.8 43.9 47.3Maghreb1 33.5 38.9 38.7 43.3 35.8 37.0 34.6Mashreq 21.5 24.4 23.7 23.7 25.6 21.8 21.4
Sources: National authorities; and IMF staff estimates and projections.12011 data exclude Libya. 2Central government.3Consolidated accounts of the federal government and the emirates Abu Dhabi, Dubai, and Sharjah.4Includes oil revenue transferred to the oil fund.5State government.6Revised for 2002–04 to include extrabudgetary revenues.

REGIONAL ECONOMIC OUTLOOK: MI DDLE EAST AND CENTRAL ASIA
82
Table 9. Oil Exporters: General Government Non-Oil Fiscal Balance(Percent of non-oil GDP)
Average Proj.2000–05 2006 2007 2008 2009 2010 2011
MENAP oil exporters1 -33.2 -39.6 -42.0 -50.0 -48.4 -48.8 -50.7Algeria -31.5 -35.6 -45.7 -54.1 -45.4 -45.7 -46.0Bahrain2 -29.0 -28.4 -28.7 -31.7 -34.4 -38.3 -33.8Iran, I.R. of -18.9 -28.2 -26.2 -23.6 -19.1 -19.0 -19.0Iraq ... -101.0 -126.0 -215.0 -166.0 -167.0 -187.1Kuwait2 -35.9 -30.3 -27.1 -72.6 -60.1 -69.9 -70.1Libya -76.1 -135.3 -146.5 -167.0 -140.5 -150.9 ...Oman2 -57.7 -63.4 -53.8 -63.6 -60.2 -63.2 -76.2Qatar -45.6 -40.6 -30.7 -20.4 -14.7 -25.2 -25.3Saudi Arabia -40.9 -44.8 -51.2 -52.2 -67.8 -65.6 -81.7Sudan -9.5 -18.5 -20.9 -20.1 -13.6 -11.5 -13.4United Arab Emirates3 -18.6 -13.5 -14.0 -23.5 -42.3 -34.7 -35.1Yemen -35.4 -42.6 -43.1 -46.3 -31.3 -30.0 -34.4
CCA oil and gas exporters -7.2 -10.9 -12.2 -21.0 -20.4 -21.2 -22.1Azerbaijan2 -12.2 -31.2 -28.6 -38.4 -38.7 -38.8 -38.5Kazakhstan -5.5 -4.2 -6.5 -16.0 -14.0 -14.7 -14.9Turkmenistan4 -10.0 -7.4 -6.5 -6.0 -8.3 -11.6 -21.5Uzbekistan ... ... ... ... ... ... ...
MemorandumGCC -37.0 -37.0 -38.5 -45.8 -54.9 -54.4 -62.6
Sources: National authorities; and IMF staff estimates and projections.12011 data exclude Libya. 2Central government.3Consolidated accounts of the federal government and the emirates Abu Dhabi, Dubai, and Sharjah.4State government.

STATISTICAL APPENDIX
83
Table 10. Oil Exporters: General Government Non-Oil Revenue (Percent of non-oil GDP)
Average Proj.2000–05 2006 2007 2008 2009 2010 2011
MENAP oil exporters1 16.1 18.7 18.9 18.8 17.5 16.9 16.9Algeria 17.1 18.1 17.1 18.4 18.5 19.8 20.1Bahrain2 11.1 9.0 7.1 6.1 4.7 4.1 4.3Iran, I.R. of 9.9 12.4 12.5 12.0 14.9 14.4 13.7Iraq ... 7.8 13.1 12.5 15.5 12.4 14.9Kuwait2 35.0 47.0 39.7 30.2 19.7 19.0 19.8Libya 20.7 25.2 29.5 33.7 19.8 21.4 ...Oman2 14.2 14.9 16.5 13.6 16.1 13.8 13.8Qatar 29.5 34.0 37.0 32.4 44.8 39.9 42.1Saudi Arabia 22.3 24.6 25.1 27.8 19.5 18.4 18.0Sudan 8.4 11.3 10.3 9.0 8.4 8.8 9.1United Arab Emirates3 9.3 11.4 12.7 11.7 10.9 10.4 10.2Yemen 13.1 14.3 14.8 12.4 12.6 12.3 13.0
CCA oil and gas exporters 24.2 24.4 26.1 22.5 19.7 20.0 19.8Azerbaijan2 23.9 29.9 29.7 27.7 26.8 24.0 21.5Kazakhstan 25.6 24.4 26.9 21.8 17.1 18.7 19.8Turkmenistan4 14.6 12.1 11.6 13.4 15.6 17.2 15.4Uzbekistan ... ... ... ... ... ... ...
MemorandumGCC 20.9 24.4 24.4 23.9 20.0 18.8 19.4
Sources: National authorities; and IMF staff estimates and projections.12011 data exclude Libya. 2Central government.3Consolidated accounts of the federal government and the emirates Abu Dhabi, Dubai, and Sharjah.4State government.

REGIONAL ECONOMIC OUTLOOK: MI DDLE EAST AND CENTRAL ASIA
84
Table 11. General Government Total Expenditure and Net Lending(Percent of GDP)
Average Proj.2000–05 2006 2007 2008 2009 2010 2011
MENAP1 28.4 29.5 30.2 30.8 35.2 32.5 31.2
Oil exporters1 29.8 31.0 31.9 32.4 39.1 35.6 33.4Algeria2 30.5 29.2 35.2 39.5 43.1 41.6 37.2Bahrain3 31.1 28.2 27.5 27.4 30.4 32.1 28.6Iran, I.R. of 22.3 29.8 28.3 27.2 27.8 26.7 25.5Iraq ... 72.7 71.9 80.6 93.6 79.8 76.9Kuwait3 36.7 31.9 30.0 40.0 42.0 42.3 36.7Libya 36.0 31.0 37.4 39.8 52.3 50.5 ...Oman3 38.3 34.8 36.4 32.4 41.2 35.3 34.4Qatar 31.5 30.5 29.3 24.6 32.0 28.2 21.8Saudi Arabia 36.4 32.0 34.6 31.6 45.7 40.8 41.3Sudan 16.0 25.2 26.0 23.2 20.0 17.6 18.5United Arab Emirates4 20.3 15.6 17.7 22.2 37.8 29.7 27.0Yemen 33.2 37.4 40.3 41.2 35.2 29.9 32.1
Oil importers 25.6 26.6 26.7 27.6 27.9 26.7 27.3Afghanistan, Rep. of ... 21.5 22.2 22.3 22.0 23.5 25.6Djibouti 34.3 37.4 37.7 40.6 41.6 35.8 36.3Egypt3 29.4 32.6 31.5 31.5 34.0 30.3 31.7Jordan 35.6 34.5 36.6 34.5 33.6 29.2 30.0Lebanon3 35.9 35.5 34.9 33.2 32.5 28.7 32.1Mauritania 37.0 28.5 29.6 30.7 30.6 25.8 24.8Morocco3,5 28.1 27.4 27.5 29.6 28.5 29.9 30.2Pakistan 17.7 18.4 19.3 22.2 19.9 20.5 18.8Syrian Arab Republic 29.3 26.6 26.7 23.0 26.8 26.9 27.7Tunisia 29.6 29.4 30.2 30.7 32.0 30.8 35.6
CCA 24.6 23.3 25.7 27.4 28.5 27.7 27.0Oil and gas exporters 25.3 22.9 25.1 27.1 27.6 27.1 26.3
Azerbaijan3,6 24.0 27.4 25.9 31.1 34.8 30.8 26.5Kazakhstan 22.3 20.2 24.6 26.9 23.9 24.1 24.1Turkmenistan7 20.2 14.9 13.4 10.9 14.7 16.1 16.4Uzbekistan 34.5 29.2 30.3 30.0 33.6 34.5 35.2
Oil and gas importers 21.5 25.5 29.2 29.6 34.3 31.3 31.5Armenia3,6 19.9 20.6 23.2 23.0 32.4 26.5 27.0Georgia 19.9 29.7 34.0 37.0 38.4 34.8 30.9Kyrgyz Republic 27.7 28.9 31.1 29.2 36.1 38.1 43.1Tajikistan 19.9 21.9 28.0 27.2 28.6 26.1 28.3
Memorandum
MENA1 29.8 31.0 31.6 31.9 37.3 34.1 32.8GCC 33.0 28.6 30.0 29.9 41.6 36.8 34.7Maghreb1 30.6 29.1 32.8 35.5 38.8 38.1 34.6Mashreq 30.2 32.0 31.3 30.5 32.8 29.6 31.0
Sources: National authorities; and IMF staff estimates and projections.12011 data exclude Libya. 2Including special accounts.3Central government.4Consolidated accounts of the federal government and the emirates Abu Dhabi, Dubai, and Sharjah.5Net lending includes balance on special treasury accounts.6Expenditures do not include statistical discrepancy.7State government.

STATISTICAL APPENDIX
85
Table 12. Total Government Gross Debt(Percent of GDP)
Average Proj.2000–05 2006 2007 2008 2009 2010 2011
MENAP1 62.6 45.0 39.0 33.6 37.2 33.9 30.9Oil exporters1 48.5 30.0 23.9 18.1 23.4 19.1 14.1
Algeria 49.0 23.6 12.5 8.2 10.4 10.2 10.1Bahrain2 31.9 23.6 19.2 14.6 25.4 32.0 24.8Iran, I.R. of 23.5 19.7 17.9 13.8 14.0 12.0 9.5Iraq ... 219.6 181.0 110.5 143.1 112.3 38.9Kuwait2 25.2 8.3 6.7 5.6 7.0 5.8 4.5Libya 23.4 0.9 0.0 0.0 0.0 0.0 ...Oman2 18.3 9.6 7.5 5.1 8.0 5.9 4.1Qatar 41.6 13.1 8.8 8.9 28.7 20.0 13.7Saudi Arabia 77.3 27.3 18.5 13.2 16.0 10.8 8.3Sudan 145.8 89.3 82.3 69.8 78.9 68.0 63.4United Arab Emirates3 4.3 6.8 7.8 12.5 22.5 21.0 16.4Yemen 55.4 40.8 40.4 36.4 49.9 40.6 42.0
Oil importers 89.3 74.9 69.1 64.5 63.7 62.3 61.9Afghanistan, Rep. of ... ... ... ... ... ... ...Djibouti 32.7 56.8 63.6 60.2 59.7 58.3 57.2Egypt 100.0 98.8 87.1 74.7 75.6 73.8 74.9Jordan 96.7 73.5 71.1 58.4 61.8 61.4 62.8Lebanon2 162.3 179.9 167.7 156.3 146.4 136.7 133.8Mauritania4 209.1 86.8 96.8 90.4 111.4 85.6 51.3Morocco2 66.6 59.4 54.6 48.2 47.7 49.9 52.8Pakistan 76.5 56.4 54.6 58.7 57.3 56.8 54.1Syrian Arab Republic 109.9 48.5 44.1 38.2 31.2 27.5 24.3Tunisia 62.2 48.8 45.9 43.3 42.9 40.4 42.8
CCA 30.7 13.9 11.3 10.9 14.8 15.1 16.8Oil and gas exporters 23.5 10.0 8.1 7.7 10.2 10.6 12.2
Azerbaijan2 20.9 10.2 8.6 7.3 12.1 10.8 10.7Kazakhstan 16.3 6.7 5.9 6.7 10.4 11.4 12.6Turkmenistan5 19.5 3.3 2.4 2.8 2.7 7.4 16.2Uzbekistan 43.5 21.3 15.8 12.8 11.0 10.0 11.3
Oil and gas importers 66.3 34.8 28.9 28.6 42.0 42.9 44.8Armenia2 40.0 18.7 16.1 16.2 40.6 39.4 45.6Georgia 55.9 27.3 21.5 27.6 37.3 39.1 41.7Kyrgyz Republic 103.7 72.5 56.8 48.5 58.0 62.6 59.5Tajikistan 76.0 35.8 35.2 30.2 36.6 36.7 36.5
MemorandumMENA1 60.8 43.5 37.0 30.5 34.6 31.1 27.9
GCC 50.6 18.7 13.4 11.3 17.4 13.5 10.3Maghreb1 53.3 33.7 27.1 23.6 24.8 24.3 29.8Mashreq 106.5 95.9 86.0 74.8 74.1 71.6 71.7
Sources: National authorities; and IMF staff estimates and projections.12011 data exclude Libya. 2Central government.3Consolidated accounts of the federal government and the emirates Abu Dhabi, Dubai, and Sharjah.4Includes oil revenue transferred to the oil fund, as well as public enterprises and central bank debts.5State government.

REGIONAL ECONOMIC OUTLOOK: MI DDLE EAST AND CENTRAL ASIA
86
Table 13. Selected MENAP Countries: Total Government Net Debt(Percent of GDP)
Average Proj.2000–05 2006 2007 2008 2009 2010 2011
MENAP1,2 25.3 19.0 15.8 13.0 15.2 13.9 16.7
Oil exporters1,2 -9.0 -3.8 -6.4 -10.0 -8.2 -8.0 -4.4Iran, I.R. of -10.5 -4.2 -0.5 0.6 1.5 -0.3 5.3Iraq 415.0 219.6 181.0 110.5 143.1 112.3 38.9Libya -18.5 -81.0 -82.8 -73.1 -108.4 -94.9 ...Oman3 -27.7 -32.7 -36.2 -29.5 -39.9 -36.2 -33.8Qatar 35.6 9.3 5.0 5.5 24.1 16.5 10.6United Arab Emirates4 -84.7 -77.6 -83.2 -85.9 -85.4 -76.2 -71.3Yemen 49.3 33.0 35.2 31.4 43.7 36.6 38.7
Oil importers2 78.5 57.8 54.6 53.6 52.6 51.9 51.0Jordan 92.1 66.0 64.6 53.1 56.0 55.8 57.6Lebanon3 155.7 175.0 162.0 144.9 132.9 125.1 125.9Mauritania5 209.1 82.8 94.8 90.4 111.3 85.5 51.2Morocco3 64.3 56.8 53.1 47.5 47.0 49.2 52.1Pakistan 75.2 52.2 49.7 53.7 53.5 53.2 50.5Syrian Arab Republic 77.1 32.2 28.4 22.6 17.9 16.6 15.8Tunisia 62.2 48.8 45.9 43.3 42.9 40.4 42.8
Sources: National authorities; and IMF staff estimates and projections.12011 data exclude Libya. 2Weighted average of the selected countries.3Central government.4Consolidated accounts of the federal government and the emirates Abu Dhabi, Dubai, and Sharjah.5Includes oil revenue transferred to the oil fund, as well as public enterprise and central bank debts.

STATISTICAL APPENDIX
87
Table 14. Exports of Goods and Services(Billions of U.S. dollars)
Average Proj.2000–05 2006 2007 2008 2009 2010 2011
MENAP1 432.7 878.4 1,029.0 1,339.7 959.4 1,162.4 1,484.2
Oil exporters1 352.1 747.9 876.2 1,144.5 788.9 970.3 1,276.5Algeria 28.6 57.3 63.5 82.1 48.2 63.8 89.5Bahrain 8.7 15.5 17.2 21.1 15.5 18.4 23.2Iran, I.R. of 41.5 82.8 104.7 108.4 87.5 102.0 129.0Iraq ... 30.2 38.7 63.6 40.6 53.4 74.4Kuwait 27.3 64.9 72.7 98.4 61.7 73.3 105.9Libya 18.2 43.0 49.2 62.3 37.4 44.1 ...Oman 13.6 22.9 26.4 39.6 29.4 38.2 50.9Qatar 16.7 39.3 50.5 72.7 48.3 69.6 119.8Saudi Arabia 109.5 225.6 249.6 323.5 202.5 253.6 377.9Sudan 2.8 6.0 9.3 13.0 8.2 10.8 15.3United Arab Emirates 73.7 152.4 186.7 249.7 202.3 233.7 278.7Yemen 4.6 7.9 7.8 10.2 7.1 9.5 11.9
Oil importers 80.6 130.5 152.7 195.2 170.6 192.1 207.7Afghanistan, Rep. of ... 1.9 2.0 2.5 2.9 3.1 3.3Djibouti 0.2 0.3 0.3 0.4 0.4 0.4 0.5Egypt 19.6 33.9 39.4 53.3 47.0 46.6 48.3Jordan 4.9 8.1 9.3 12.4 10.9 12.2 13.2Lebanon 8.5 13.7 16.0 22.8 22.8 26.1 27.7Mauritania 0.5 1.4 1.5 1.9 1.5 2.3 3.2Morocco 13.9 21.7 27.3 33.4 26.4 34.2 34.6Pakistan 12.9 20.3 21.4 24.0 23.2 24.9 28.5Syrian Arab Republic 7.9 13.1 15.5 19.3 15.4 20.5 25.6Tunisia 11.0 16.0 20.1 25.2 19.9 21.9 22.8
CCA 32.0 75.6 100.8 142.4 100.3 126.1 173.6
Oil and gas exporters 28.2 69.4 92.8 133.0 92.2 116.7 161.8Azerbaijan 3.8 14.0 22.5 32.1 22.8 29.3 40.8Kazakhstan 16.8 41.6 51.9 76.4 48.3 65.3 89.2Turkmenistan 3.7 7.5 9.5 12.3 9.5 10.0 15.4Uzbekistan 4.0 6.3 8.9 12.2 11.5 12.2 16.4
Oil and gas importers 3.8 6.2 8.0 9.3 8.1 9.3 11.7Armenia 0.8 1.5 1.8 1.8 1.3 1.7 2.0Georgia 1.4 2.6 3.2 3.7 3.2 4.1 5.0Kyrgyz Republic 0.8 1.5 2.2 3.0 2.8 2.6 3.4Tajikistan 0.9 0.7 0.8 0.9 0.8 1.0 1.3
Memorandum
MENA1 418.6 856.1 1,005.6 1,313.1 933.3 1,134.4 1,452.4GCC 249.4 520.6 603.1 804.9 559.7 686.7 956.4Maghreb1 72.2 139.5 161.5 205.0 133.4 166.3 150.0Mashreq 40.9 68.8 80.2 107.8 96.3 105.4 114.9
Sources: National authorities; and IMF staff estimates and projections.12011 data exclude Libya.

REGIONAL ECONOMIC OUTLOOK: MI DDLE EAST AND CENTRAL ASIA
88
Table 15. Imports of Goods and Services(Billions of U.S. dollars)
Average Proj.2000–05 2006 2007 2008 2009 2010 2011
MENAP1 340.1 615.1 780.5 1,011.3 903.1 982.4 1,092.4
Oil exporters1 240.6 446.9 579.3 748.2 670.0 731.1 817.1Algeria 16.8 25.5 33.3 49.1 49.1 50.5 55.5Bahrain 6.7 11.3 12.3 15.7 11.1 13.3 14.8Iran, I.R. of 35.5 63.3 71.7 86.3 74.1 80.3 80.1Iraq ... 23.2 29.4 48.7 54.4 54.8 76.3Kuwait 16.3 26.9 32.5 38.2 30.7 25.9 31.2Libya 9.6 15.2 20.0 24.9 27.1 31.1 ...Oman 8.7 13.8 19.4 26.6 21.6 24.2 32.9Qatar 7.1 21.8 27.2 35.4 30.1 35.7 39.1Saudi Arabia 63.6 115.3 147.1 179.5 163.6 193.7 236.0Sudan 3.9 10.0 11.0 12.5 11.0 12.7 14.1United Arab Emirates 59.9 112.9 166.1 219.7 187.3 198.2 224.4Yemen 4.4 7.8 9.4 11.7 10.0 10.7 12.8
Oil importers 99.5 168.2 201.2 263.1 233.1 251.3 275.3Afghanistan, Rep. of ... 7.4 8.4 9.5 9.6 10.0 10.4Djibouti 0.3 0.5 0.6 0.7 0.6 0.6 0.8Egypt 22.8 38.2 44.9 63.1 59.9 57.0 60.3Jordan 7.7 13.2 15.7 19.2 16.5 17.9 20.2Lebanon 12.7 16.7 20.6 28.1 28.4 31.9 34.6Mauritania 0.9 1.6 2.1 2.7 2.1 2.5 3.6Morocco 16.1 26.1 34.6 46.3 37.2 45.7 47.4Pakistan 15.5 33.2 35.3 45.4 39.2 38.1 42.7Syrian Arab Republic 8.3 14.6 18.1 21.4 18.7 23.5 28.8Tunisia 11.7 16.7 20.8 26.6 20.9 24.0 26.5
CCA 31.0 60.8 82.7 100.9 87.1 93.5 121.2
Oil and gas exporters 25.7 50.0 67.5 80.2 71.8 76.2 100.1Azerbaijan 4.2 8.1 9.4 11.5 9.9 11.0 16.5Kazakhstan 14.8 32.9 45.0 49.6 38.9 42.8 56.4Turkmenistan 3.1 3.6 4.9 7.8 11.3 11.3 13.4Uzbekistan 3.5 5.4 8.2 11.4 11.7 11.0 13.8
Oil and gas importers 5.3 10.8 15.3 20.7 15.3 17.3 21.1Armenia 1.4 2.5 3.6 4.7 3.7 4.1 4.6Georgia 2.0 4.4 5.9 7.5 5.3 6.1 7.5Kyrgyz Republic 0.9 2.3 3.2 4.7 3.7 4.1 5.2Tajikistan 1.1 1.6 2.6 3.7 2.7 2.9 3.8
MemorandumMENA1 321.2 574.5 736.8 956.4 854.2 934.4 1,039.3
GCC 162.3 302.0 404.6 515.1 444.3 491.0 578.3Maghreb1 55.2 85.0 110.8 149.5 136.4 153.9 133.0Mashreq 51.5 82.8 99.3 131.9 123.5 130.3 143.9
Sources: National authorities; and IMF staff estimates and projections.12011 data exclude Libya.

STATISTICAL APPENDIX
89
Table 16. Current Account Balance(Billions of U.S. dollars)
Average Proj.2000–05 2006 2007 2008 2009 2010 2011
MENAP1 88.0 275.7 259.0 329.1 38.3 149.1 347.6
Oil exporters1 89.1 282.3 270.9 355.7 66.4 171.9 378.0Algeria 10.3 29.0 30.6 34.5 0.4 15.1 34.3Bahrain 0.5 2.2 2.9 2.3 0.6 1.0 3.5Iran, I.R. of 6.7 20.4 34.1 24.0 13.5 21.6 49.2Iraq ... 8.5 7.1 11.0 -17.4 -5.1 -3.5Kuwait 13.7 45.3 42.2 60.2 28.6 41.7 68.1Libya 7.2 28.1 29.8 37.1 9.4 11.9 ...Oman 2.2 5.7 2.5 5.0 -0.3 6.5 9.8Qatar 6.6 15.3 20.2 32.3 10.0 24.3 70.2Saudi Arabia 34.3 99.1 93.5 132.5 22.8 38.8 114.4Sudan -1.7 -5.5 -5.8 -5.2 -6.9 -5.8 -4.2United Arab Emirates 10.1 34.1 15.4 23.3 8.2 23.3 37.7Yemen 0.6 0.2 -1.5 -1.3 -2.6 -1.4 -1.5
Oil importers -1.1 -6.7 -11.9 -26.6 -28.1 -22.7 -30.5Afghanistan, Rep. of ... -0.4 0.1 -0.2 -0.3 0.3 -0.1Djibouti -0.0 -0.1 -0.2 -0.2 -0.1 -0.1 -0.2Egypt 1.3 1.8 2.7 0.9 -4.4 -4.3 -6.3Jordan -0.1 -1.7 -3.0 -2.0 -1.6 -1.5 -2.5Lebanon -3.0 -1.2 -1.7 -2.8 -3.3 -4.0 -5.5Mauritania -0.3 -0.0 -0.5 -0.6 -0.4 -0.2 -0.3Morocco 1.0 1.4 -0.1 -4.6 -4.4 -4.3 -5.7Pakistan 1.2 -5.0 -6.9 -13.9 -9.3 -3.9 -3.1Syrian Arab Republic -0.4 -0.8 -1.4 -1.5 -3.1 -2.6 -3.1Tunisia -0.7 -0.6 -0.9 -1.7 -1.2 -2.1 -3.6
CCA -1.0 5.2 3.4 23.7 0.9 16.1 29.7
Oil and gas exporters -0.5 6.6 6.4 28.8 3.7 18.7 33.4Azerbaijan -0.9 3.7 9.0 16.5 10.2 15.1 20.5Kazakhstan -0.4 -2.0 -8.3 6.3 -4.2 3.5 9.9Turkmenistan 0.4 3.4 4.0 3.6 -3.0 -2.4 -1.3Uzbekistan 0.5 1.6 1.6 2.5 0.7 2.6 4.3
Oil and gas importers -0.5 -1.5 -2.9 -5.1 -2.8 -2.7 -3.6Armenia -0.1 -0.1 -0.6 -1.4 -1.4 -1.3 -1.2Georgia -0.4 -1.2 -2.0 -2.9 -1.2 -1.1 -1.7Kyrgyz Republic 0.0 -0.1 -0.0 -0.4 0.1 -0.3 -0.4Tajikistan -0.0 -0.1 -0.3 -0.4 -0.3 0.1 -0.3
Memorandum
MENA1 87.0 281.1 265.8 343.1 47.9 152.8 350.8GCC 67.4 201.7 176.6 255.6 69.9 135.5 303.7Maghreb1 17.4 57.8 58.9 64.6 3.7 20.4 24.6Mashreq -2.1 -1.9 -3.4 -5.4 -12.4 -12.4 -17.4
Sources: National authorities; and IMF staff estimates and projections.12011 data exclude Libya.

REGIONAL ECONOMIC OUTLOOK: MI DDLE EAST AND CENTRAL ASIA
90
Table 17. Current Account Balance(Percent of GDP)
Average Proj.2000–05 2006 2007 2008 2009 2010 2011
MENAP1 7.9 16.2 13.0 13.3 1.7 5.9 11.7
Oil exporters1 11.2 21.9 17.9 18.8 4.2 9.2 16.9Algeria 14.0 24.7 22.8 20.2 0.3 9.4 17.8Bahrain 5.0 13.8 15.7 10.2 2.9 4.6 13.0Iran, I.R. of 5.2 9.2 11.9 7.3 4.2 6.0 11.7Iraq ... 19.0 12.5 12.8 -26.6 -6.2 -3.2Kuwait 26.2 44.6 36.8 40.5 26.1 31.8 39.4Libya 18.9 49.7 41.7 41.7 15.6 16.0 ...Oman 9.4 15.4 5.9 8.3 -0.6 11.6 14.9Qatar 25.2 25.3 25.0 29.2 10.2 18.7 36.1Saudi Arabia 13.6 27.8 24.3 27.8 6.1 8.7 19.8Sudan -9.5 -15.2 -12.5 -9.0 -12.4 -8.5 -5.5United Arab Emirates 7.7 15.4 6.0 7.4 3.0 7.7 10.4Yemen 5.3 1.1 -7.0 -4.6 -10.2 -4.4 -4.0
Oil importers -0.4 -1.6 -2.5 -4.6 -4.6 -3.3 -4.1Afghanistan, Rep. of ... -5.7 0.9 -1.6 -2.6 2.0 -0.7Djibouti -0.4 -11.5 -21.4 -24.3 -9.1 -6.7 -15.4Egypt 1.6 1.6 2.1 0.5 -2.3 -2.0 -2.7Jordan -0.0 -11.0 -16.9 -9.0 -6.3 -5.4 -8.5Lebanon -15.2 -5.3 -6.8 -9.2 -9.4 -10.2 -12.9Mauritania -18.8 -1.3 -18.3 -15.8 -12.3 -4.9 -6.9Morocco 2.2 2.2 -0.1 -5.2 -4.9 -4.2 -5.7Pakistan 1.6 -3.9 -4.8 -8.5 -5.7 -2.3 -1.5Syrian Arab Republic -1.3 -2.3 -3.6 -2.8 -5.7 -4.4 -4.6Tunisia -3.0 -1.8 -2.4 -3.8 -2.8 -4.8 -7.8
CCA -1.6 3.2 1.6 8.9 0.4 5.7 8.6
Oil and gas exporters -0.9 4.7 3.4 12.4 1.8 7.4 10.7Azerbaijan -12.2 17.6 27.3 35.5 23.6 27.7 28.4Kazakhstan -1.4 -2.5 -8.1 4.6 -3.7 2.5 5.8Turkmenistan 4.1 15.7 15.5 16.5 -16.1 -11.4 -4.7Uzbekistan 3.8 9.1 7.3 8.7 2.2 6.7 10.0
Oil and gas importers -5.4 -7.4 -10.9 -14.7 -9.6 -8.5 -10.4Armenia -6.4 -1.8 -6.4 -11.8 -16.0 -13.7 -12.4Georgia -8.0 -15.1 -19.7 -22.6 -11.2 -9.8 -13.0Kyrgyz Republic -0.1 -3.1 -0.2 -8.1 2.0 -7.4 -8.7Tajikistan -2.8 -2.8 -8.6 -7.6 -5.9 2.2 -4.1
MemorandumMENA1 8.5 17.9 14.4 14.9 2.4 6.5 12.7
GCC 13.4 25.4 19.6 22.5 7.6 12.5 21.7Maghreb1 9.3 20.9 18.2 16.3 1.1 5.3 7.2Mashreq -1.5 -1.1 -1.6 -2.0 -4.1 -3.6 -4.7
Sources: National authorities; and IMF staff estimates and projections.12011 data exclude Libya.

STATISTICAL APPENDIX
91
Table 18. Gross Official Reserves(Billions of U.S. dollars)
Average Proj.2000–05 2006 2007 2008 2009 2010 2011
MENAP1 252.8 601.8 848.7 1,011.5 997.9 1,098.8 1,155.8
Oil exporters1 193.2 504.1 734.7 889.1 862.6 950.1 1,025.3Algeria 30.9 77.8 110.2 143.1 148.9 165.3 197.9Bahrain 1.5 2.7 4.1 3.8 3.5 4.9 7.9Iran, I.R. of 25.9 60.5 82.9 79.6 78.0 85.7 122.6Iraq ... 20.0 31.5 50.2 44.3 50.6 50.6Kuwait 8.0 11.8 15.9 16.7 17.7 19.9 22.4Libya 21.6 59.3 79.4 92.3 98.7 101.8 ...Oman 3.3 5.0 9.5 11.4 12.2 13.0 14.4Qatar 2.5 5.4 9.8 9.8 18.8 27.2 36.2Saudi Arabia2 73.4 225.2 305.3 441.9 408.6 443.7 517.8Sudan 0.6 1.7 1.4 2.0 0.9 0.8 1.3United Arab Emirates3 16.4 28.0 77.9 30.9 24.7 32.0 49.7Yemen 4.2 6.8 7.0 7.3 6.2 5.1 4.5
Oil importers 59.6 97.7 114.0 122.4 135.3 148.7 130.5Afghanistan, Rep. of ... 2.0 2.8 3.5 4.2 5.1 5.4Djibouti 0.1 0.1 0.1 0.2 0.2 0.2 0.2Egypt 15.4 23.0 28.6 34.6 31.3 35.2 27.7Jordan 3.8 6.2 6.9 7.7 11.1 12.4 11.6Lebanon 7.5 11.4 11.5 18.8 27.4 30.2 27.3Mauritania 0.1 0.2 0.2 0.2 0.2 0.3 0.4Morocco 11.8 20.8 24.7 22.8 23.6 25.1 19.3Pakistan 6.1 10.8 14.3 8.6 9.1 13.0 13.6Syrian Arab Republic 11.2 16.5 17.0 17.1 17.6 17.6 17.2Tunisia 2.9 6.8 7.9 9.0 10.6 9.5 7.7
CCA 8.6 29.2 33.7 40.1 46.7 56.1 71.7
Oil and gas exporters 7.4 26.3 29.4 35.9 40.7 49.8 64.8Azerbaijan 0.9 2.5 4.3 6.5 5.4 6.9 8.9Kazakhstan 4.8 19.1 17.6 19.9 23.1 28.3 36.0Turkmenistan … … … … … … …Uzbekistan 1.7 4.7 7.5 9.5 12.2 14.6 19.9
Oil and gas importers 1.2 2.9 4.3 4.3 6.0 6.3 6.9Armenia 0.5 1.1 1.7 1.4 2.0 1.9 1.8Georgia 0.3 0.9 1.4 1.5 2.1 2.3 2.7Kyrgyz Republic 0.4 0.8 1.2 1.2 1.6 1.7 1.8Tajikistan 0.1 0.1 0.1 0.2 0.3 0.5 0.6
MemorandumMENA1 246.0 589.0 831.7 999.4 984.6 1,080.7 1,136.8
GCC 105.0 278.1 422.5 514.6 485.5 540.7 648.4Maghreb1 67.3 164.8 222.4 267.4 282.0 302.0 225.3Mashreq 37.9 57.0 64.0 78.2 87.4 95.5 83.9
Sources: National authorities; and IMF staff estimates and projections.12011 data exclude Libya. 2Saudi Arabia Monetary Agency gross foreign assets.3Central bank only. Excludes overseas assets of sovereign wealth funds.

REGIONAL ECONOMIC OUTLOOK: MI DDLE EAST AND CENTRAL ASIA
92
Table 19. Total Gross External Debt(Percent of GDP)1
Average Proj.2000–05 2006 2007 2008 2009 2010 2011
MENAP2 33.2 31.3 34.6 29.8 35.0 31.8 27.4
Oil exporters2 25.2 27.8 34.0 28.9 35.6 31.8 26.5Algeria 34.1 5.0 4.2 3.5 3.8 2.8 2.0Bahrain 48.0 53.4 139.3 151.5 169.6 155.1 146.6Iran, I.R. of 10.9 10.4 9.8 6.2 6.5 5.3 4.1Iraq ... 212.8 174.6 110.5 137.9 107.8 33.9Kuwait 28.1 30.4 50.2 40.7 52.6 41.3 32.1Libya 17.5 9.9 7.8 6.3 9.3 7.5 ...Oman 23.3 15.5 17.2 15.1 18.6 12.3 9.7Qatar 60.1 43.5 51.8 51.6 85.2 80.5 63.6Saudi Arabia 11.7 11.9 19.7 17.5 23.8 20.3 20.8Sudan 133.9 78.1 68.5 58.1 64.0 53.8 51.8United Arab Emirates 17.4 36.3 50.4 43.1 48.1 46.2 39.9Yemen 43.4 28.7 26.9 21.9 24.0 19.6 17.8
Oil importers 51.6 42.1 36.6 32.8 33.2 31.8 30.0Afghanistan, Rep. of ... 169.4 23.3 20.2 9.2 8.2 8.0Djibouti 59.1 56.8 63.6 60.2 59.7 58.3 57.2Egypt 32.5 27.6 22.9 21.9 17.1 15.6 14.6Jordan3 73.0 46.8 41.7 22.6 21.7 21.6 18.9Lebanon 160.7 198.8 194.0 171.6 169.0 160.8 156.8Mauritania 216.9 94.1 97.4 83.4 103.6 83.2 58.1Morocco 36.1 23.9 23.7 20.6 23.2 24.8 22.9Pakistan 39.8 28.0 27.0 27.1 32.1 31.3 28.7Syrian Arab Republic 82.8 27.5 21.7 16.8 15.4 14.4 13.4Tunisia4 60.1 53.9 51.8 45.9 49.3 48.5 48.7
CCA 51.6 54.9 53.4 47.7 57.5 46.9 43.3
Oil and gas exporters 49.9 57.3 56.3 49.7 58.6 46.2 42.2Azerbaijan5 18.5 9.4 7.7 6.5 7.9 7.2 8.0Kazakhstan 73.0 91.4 93.9 79.7 99.7 76.4 67.7Turkmenistan 19.5 3.3 2.4 2.8 2.7 7.4 16.2Uzbekistan 37.0 22.1 16.7 13.1 15.0 14.7 16.6
Oil and gas importers 61.3 38.1 34.1 34.3 50.1 53.2 52.9Armenia5 37.6 18.9 15.7 13.5 34.7 35.5 37.5Georgia 47.2 37.8 38.5 44.0 58.0 61.2 61.9Kyrgyz Republic 107.1 77.7 60.2 45.1 58.2 68.3 63.6Tajikistan 90.1 42.7 40.9 46.3 51.6 53.6 50.4
MemorandumMENA2 32.5 31.0 35.2 30.0 35.3 32.0 27.4
GCC 18.9 24.5 37.6 33.5 43.7 39.6 34.9Maghreb2 36.4 17.4 16.1 13.5 16.7 15.7 15.1Mashreq 61.1 50.7 44.3 37.8 34.7 32.4 31.0
Sources: National authorities; and IMF staff estimates and projections.1Nominal GDP is converted to U.S. dollars using period average exchange rate.22011 data exclude Libya. 3Excludes deposits of nonresidents held in the banking system.4Includes bank deposits of nonresidents.5Public and publicly guaranteed debt, as private debt data are not reliable.

STATISTICAL APPENDIX
93
Table 20. Capital Adequacy Ratios(Percent of risk-weighted assets)
Dec-06 Dec-07 Dec-08 Dec-09 Dec-10 Jan-11 Feb-11 Mar-11
Oil exportersAlgeria 15.2 12.9 16.5 21.9 … … … …Bahrain 22.0 21.0 18.1 19.6 … … … …Iran, I.R. of 9.9 9.1 6.5 … … … … …Iraq … … … … … … … …Kuwait 21.2 19.4 17.1 18.0 … … … …Libya 11.6 11.8 12.2 14.5 … … … …Oman 17.2 15.8 14.7 15.5 15.0 … … …Qatar 14.3 13.5 15.5 16.1 16.1 … … …Saudi Arabia 21.9 20.6 16.0 16.5 … … … …Sudan 19.7 22.0 10.5 7.1 10.0 … … …United Arab Emirates 16.6 14.0 13.3 19.2 20.81 … … …Yemen2 12.0 8.7 14.6 14.63 … … … …
Oil importersAfghanistan, Rep. of … … … … … … … …Djibouti 17.4 8.1 8.5 9.5 … … … …Egypt 14.7 14.8 14.7 15.1 … … … …Jordan 21.4 20.8 18.4 19.6 19.5 19.5 … …Lebanon4 25.0 12.5 12.2 13.7 13.3 … … …Mauritania … 28.2 31.9 … … … … …Morocco 12.3 10.6 11.2 11.7 … … … …Pakistan 12.7 12.3 12.2 14.0 14.0 … … …Syrian Arab Republic 7.0 6.5 6.5 6.3 6.5 … … …Tunisia 11.8 11.6 11.7 12.4 12.6 … … …
CCAArmenia 34.9 30.1 27.5 28.3 22.2 21.7 … …Azerbaijan 18.7 19.9 19.6 17.7 16.9 16.7 … …Georgia … 30.0 24.0 25.6 23.6 26.1 26.8 …Kazakhstan 15.0 14.2 14.9 -8.2 17.6 17.4 17.5 17.9Kyrgyz Republic 28.5 31.0 32.6 33.5 30.4 31.2 … …Tajikistan … 19.4 24.2 25.4 24.5 … … …Turkmenistan 25.3 15.9 30.9 16.5 18.7 … … …Uzbekistan … 23.2 23.2 23.4 23.4 … … …
Source: National authorities.1Assuming banks retain 50 percent of 2010 profits.2Data refer to all banks except the Housing Bank and CAC Bank. 2006 includes CAC Bank data.3Audited financial statements.4From 2007 onward, based on revised risk weights (Basel II).

REGIONAL ECONOMIC OUTLOOK: MI DDLE EAST AND CENTRAL ASIA
94
Table 21. Return on Assets(Percent)
Dec-06 Dec-07 Dec-08 Dec-09 Dec-10 Jan-11 Feb-11 Mar-11
Oil exportersAlgeria 0.9 1.1 1.2 1.4 … … … …Bahrain 2.1 1.2 1.3 1.2 … … … …Iran, I.R. of … … … … … … … …Iraq … … … … … … … …Kuwait 3.7 3.6 0.9 0.8 … … … …Libya 0.5 0.4 0.6 0.7 … … … …Oman 2.3 2.1 1.7 1.4 1.8 … … …Qatar 3.7 3.6 2.9 2.6 … … … …Saudi Arabia 4.0 2.8 2.3 2.0 1.9 1.8 … …Sudan 3.6 3.7 3.0 3.8 3.9 0.3 … …United Arab Emirates 2.3 2.0 1.8 1.3 1.4 … … …Yemen 1.2 1.6 1.0 0.9 … … … …
Oil importersAfghanistan, Rep. of … … … 1.2 … … … …Djibouti 1.8 1.8 1.6 1.4 … … … …Egypt 0.8 0.9 0.8 0.8 … … … …Jordan 1.7 1.6 1.4 1.1 … … … …Lebanon1 0.9 1.0 1.1 1.1 1.2 … … …Mauritania … 4.0 3.1 1.4 … … … …Morocco 1.3 1.5 1.2 1.2 … … … …Pakistan 2.1 1.5 0.8 0.9 1.0 … … …Syrian Arab Republic 2.0 2.4 1.8 1.9 1.0 … … …Tunisia 0.7 0.9 1.0 1.0 1.0 … … …
CCAArmenia 3.6 2.9 3.1 0.7 2.2 -0.4 … …Azerbaijan 1.3 1.9 1.8 2.2 0.9 -0.1 … …Georgia2 … 1.9 -2.6 -0.8 1.7 1.4 0.6 …Kazakhstan … 2.3 0.3 -24.1 12.5 … … …Kyrgyz Republic 3.4 4.4 3.8 2.5 1.1 … … …Tajikistan … 2.7 2.0 0.8 0.8 … … …Turkmenistan 5.4 4.1 4.3 3.6 2.6 … … …Uzbekistan … 2.4 8.9 7.4 7.7 … … …
Source: National authorities.1After tax.2Cumulative and annualized.

STATISTICAL APPENDIX
95
Table 22. Nonperforming Loans(Percent of total loans)
Dec-06 Dec-07 Dec-08 Dec-09 Dec-10 Jan-11 Feb-11 Mar-11
Oil exportersAlgeria 34.2 35.5 28.2 21.8 … … … …Bahrain 4.8 6.0 2.3 3.9 … … … …Iran, I.R. of 9.9 15.7 18.3 … … … … …Iraq … … … … … … … …Kuwait 3.9 3.2 5.3 9.7 … … … …Libya 25.4 27.2 19.2 16.9 … … … …Oman 4.9 3.2 2.1 3.5 3.3 … … …Qatar 2.2 1.5 1.2 1.7 2.0 … … …Saudi Arabia 2.0 2.1 1.4 3.3 … … … …Sudan 19.4 26.0 22.4 20.5 14.4 14.1 … …United Arab Emirates 6.3 2.9 2.5 4.8 5.9 … … …Yemen1 23.0 19.5 14.22 13.9 … … … …
Oil importersAfghanistan, Rep. of 3.4 0.7 1.2 0.7 … … … …Djibouti 15.6 10.9 8.6 6.7 … … … …Egypt3 18.2 19.3 14.8 13.4 … … … …Jordan 4.3 4.1 4.2 6.7 7.9 7.9 … …Lebanon 13.5 10.1 7.5 6.0 4.4 … … …Mauritania … 32.4 28.0 28.0 … … … …Morocco 10.9 7.9 6.0 5.5 4.8 … … …Pakistan 6.9 7.6 10.5 12.6 14.7 … … …Syrian Arab Republic 4.7 5.3 5.1 4.8 … … … …Tunisia 19.3 17.6 15.5 13.2 12.1 … … …
CCAArmenia 2.5 2.4 4.4 4.8 3.1 4.3 … …Azerbaijan 6.6 3.0 3.3 3.5 4.7 4.9 … …Georgia … 0.8 4.1 6.3 5.4 5.4 5.3 …Kazakhstan4 … … 5.2 21.2 23.8 24.7 24.7 …Kyrgyz Republic 6.2 5.3 5.3 8.2 15.8 16.6 … …Tajikistan5 4.1 2.8 5.4 10.4 7.5 … … …Turkmenistan 0.6 0.4 0.1 0.1 0.6 … … …Uzbekistan … 2.6 3.0 1.2 1.0 … … …
Source: National authorities.1Data refer to all banks except the Housing Bank and CAC Bank. 2006 includes CAC Bank data.2Audited financial statements.3Provisioning to NPLs surpassed 100 percent as of Dec. 2009 and data refers to end of fiscal year.490-day basis.5Overdue by 30 days or more.
