regional climate change impacts on water resources noaa-crest reza khanbilvardi july 2011
TRANSCRIPT
Regional Climate Change Impacts on Water Resources
NOAA-CRESTReza Khanbilvardi
July 2011
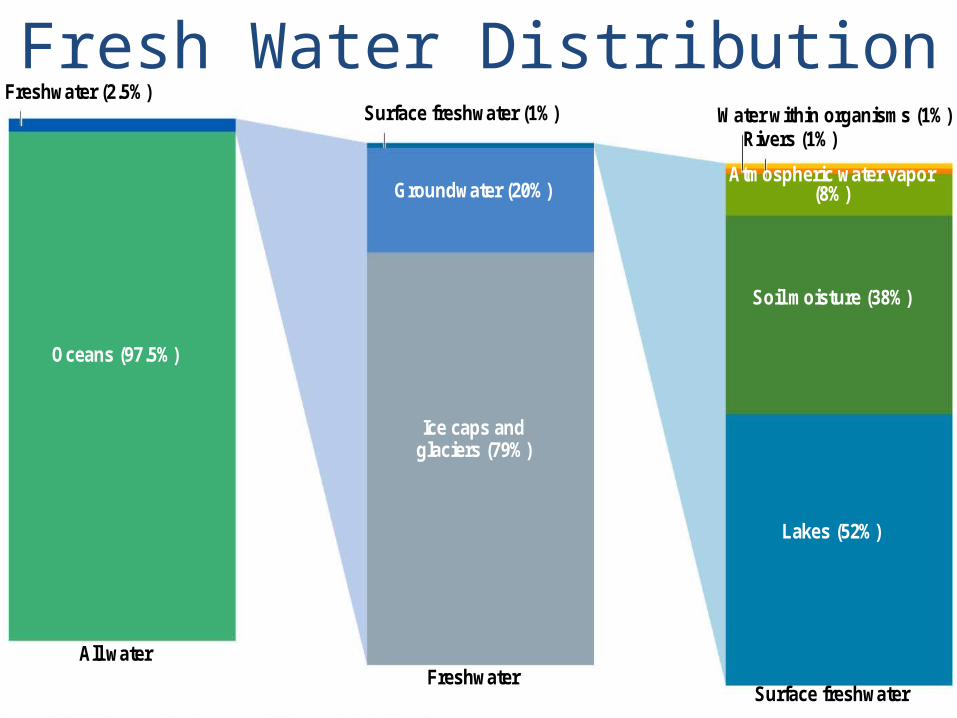
Freshwater (2.5%)Surface freshwater (1%) Water within organisms (1%)
Oceans (97.5%)
All water
Groundwater (20%)
Ice caps andglaciers (79%)
FreshwaterSurface freshwater
Lakes (52%)
Soil moisture (38%)
Atmospheric water vapor(8%)
Rivers (1%)
Freshwater (2.5%)Surface freshwater (1%) Water within organisms (1%)
Oceans (97.5%)
All water
Groundwater (20%)
Ice caps andglaciers (79%)
FreshwaterSurface freshwater
Lakes (52%)
Soil moisture (38%)
Atmospheric water vapor(8%)
Rivers (1%)
Fresh Water Distribution
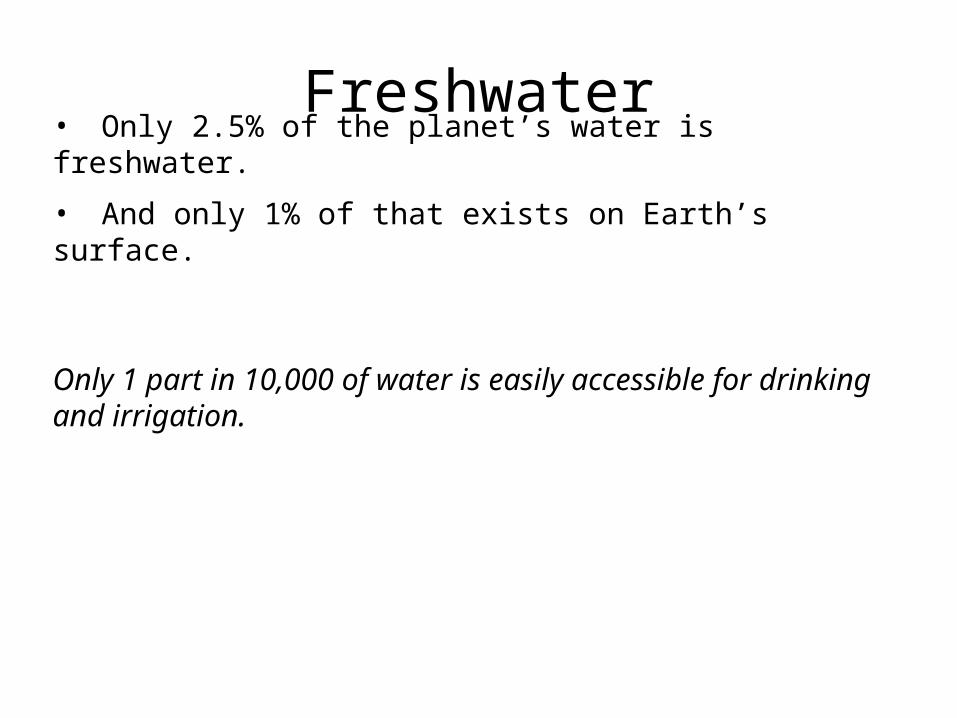
Freshwater• Only 2.5% of the planet’s water is freshwater.
• And only 1% of that exists on Earth’s surface.
Only 1 part in 10,000 of water is easily accessible for drinking and irrigation.
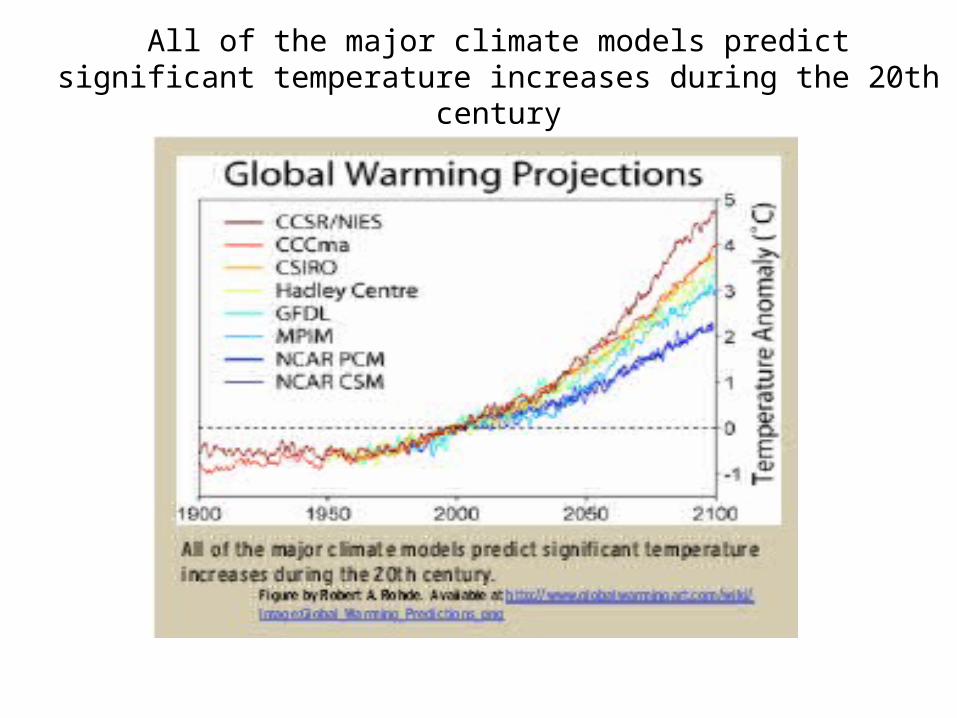
All of the major climate models predict significant temperature increases during the 20th century
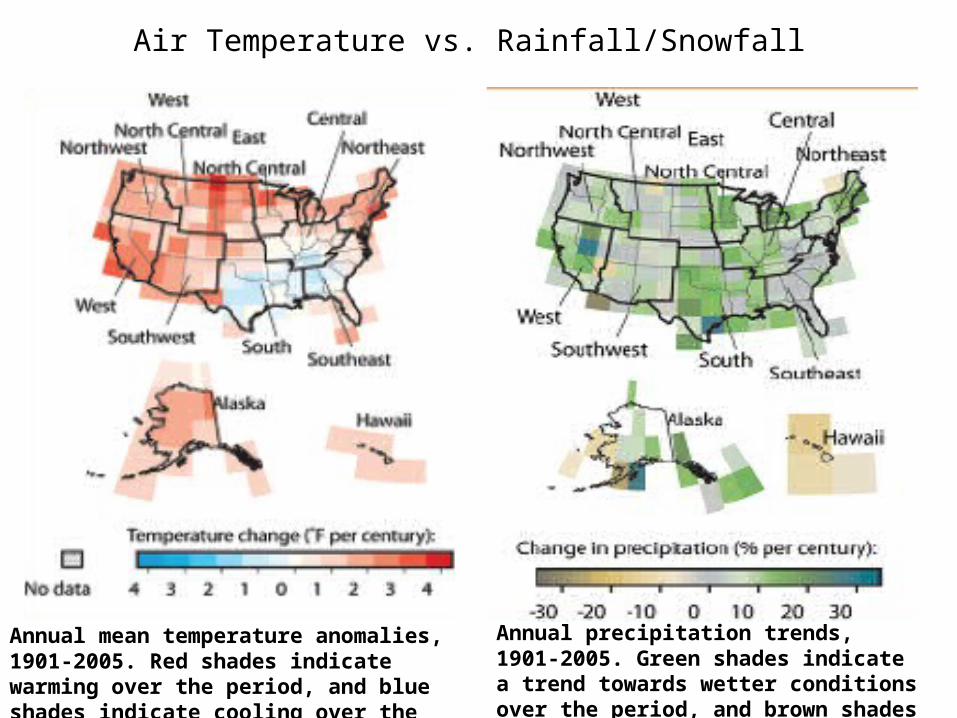
Air Temperature vs. Rainfall/Snowfall
Annual mean temperature anomalies, 1901-2005. Red shades indicate warming over the period, and blue shades indicate cooling over the period.
Annual precipitation trends, 1901-2005. Green shades indicate a trend towards wetter conditions over the period, and brown shades indicate a trend towards dryer conditions.
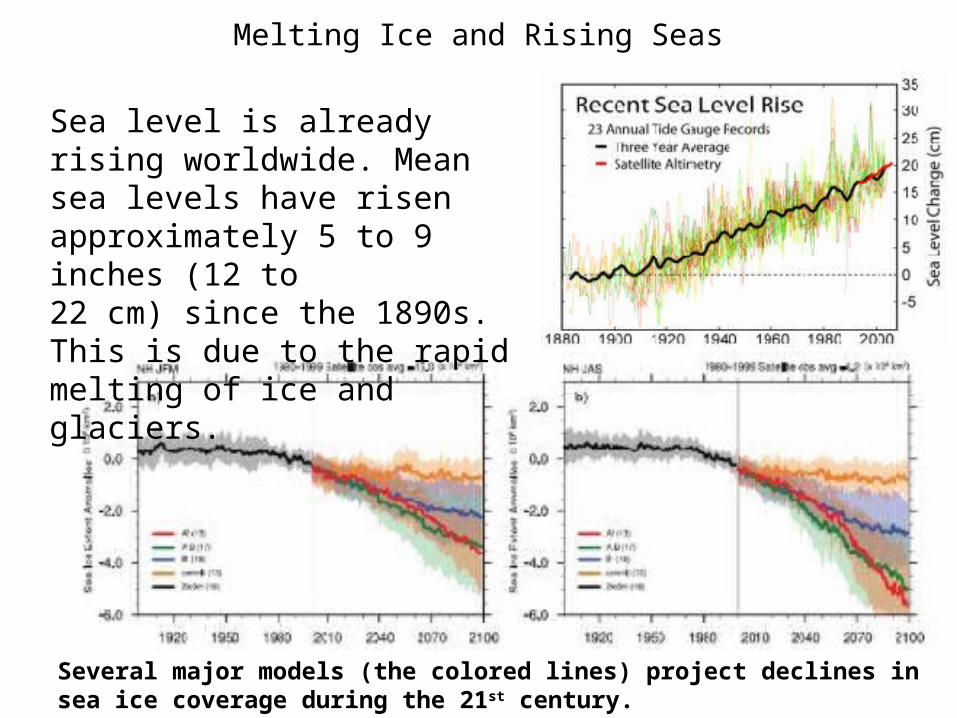
Melting Ice and Rising Seas
Several major models (the colored lines) project declines in sea ice coverage during the 21st century.
Sea level is already rising worldwide. Mean sea levels have risen approximately 5 to 9 inches (12 to22 cm) since the 1890s. This is due to the rapid melting of ice and glaciers.
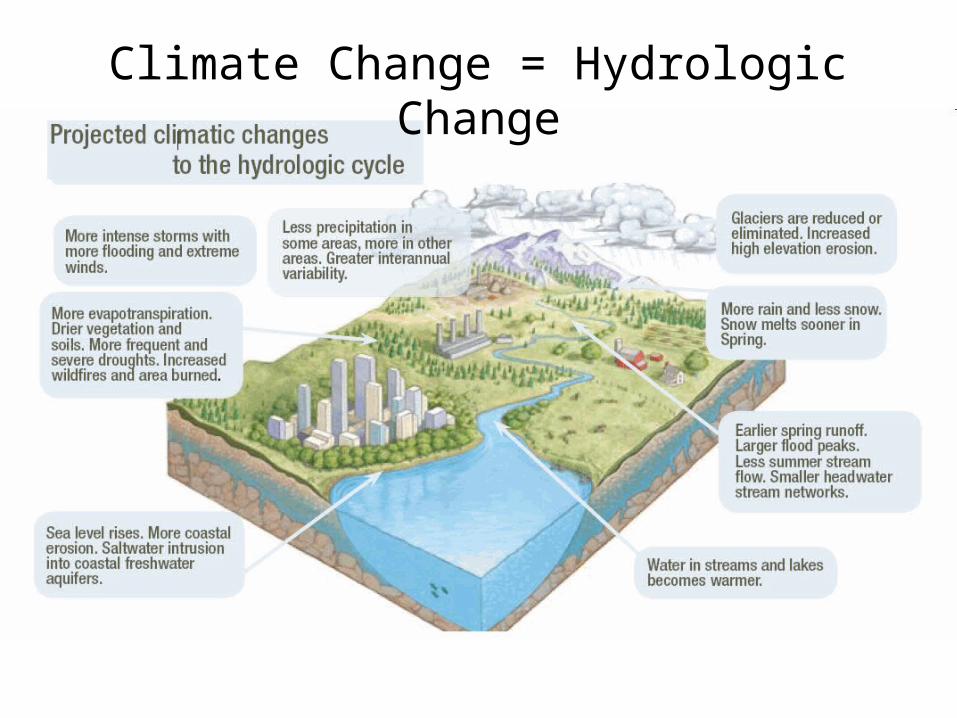
Climate Change = Hydrologic Change
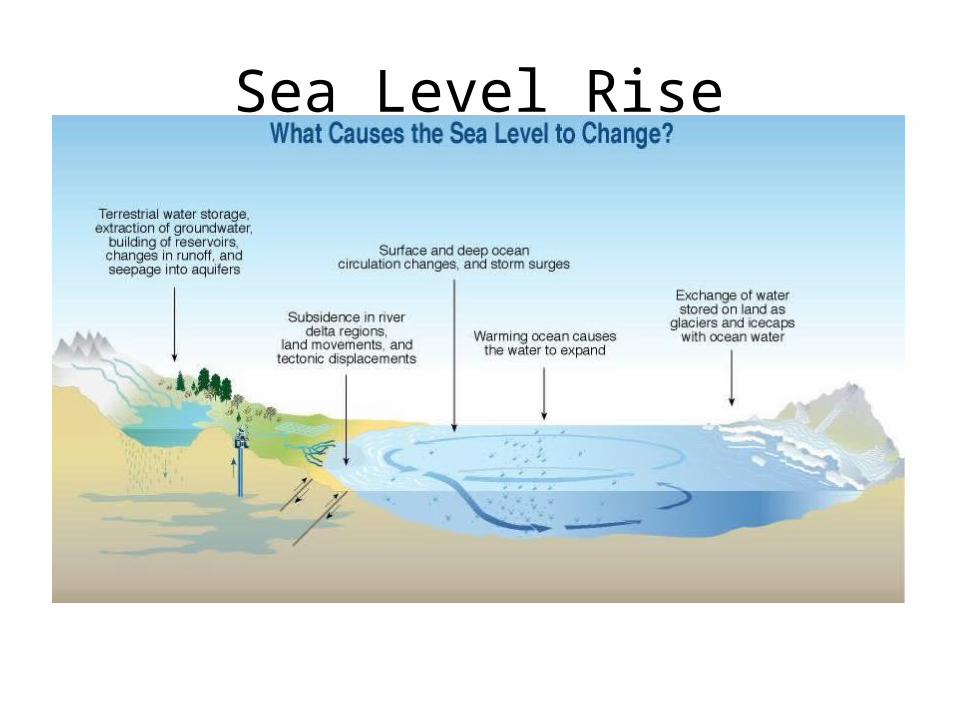
Sea Level Rise
Climate Change and Water
• Future effect of climate change on global water resources depends on both– Climatic factors AND– Non-climatic factors• Population growth• Changes in economy• Development of new tech• Changes in watershed characteristics• Watershed management
Impacts of Climate Change
• Changes in Water Availability– Quantity– Quality– Timing– Distribution
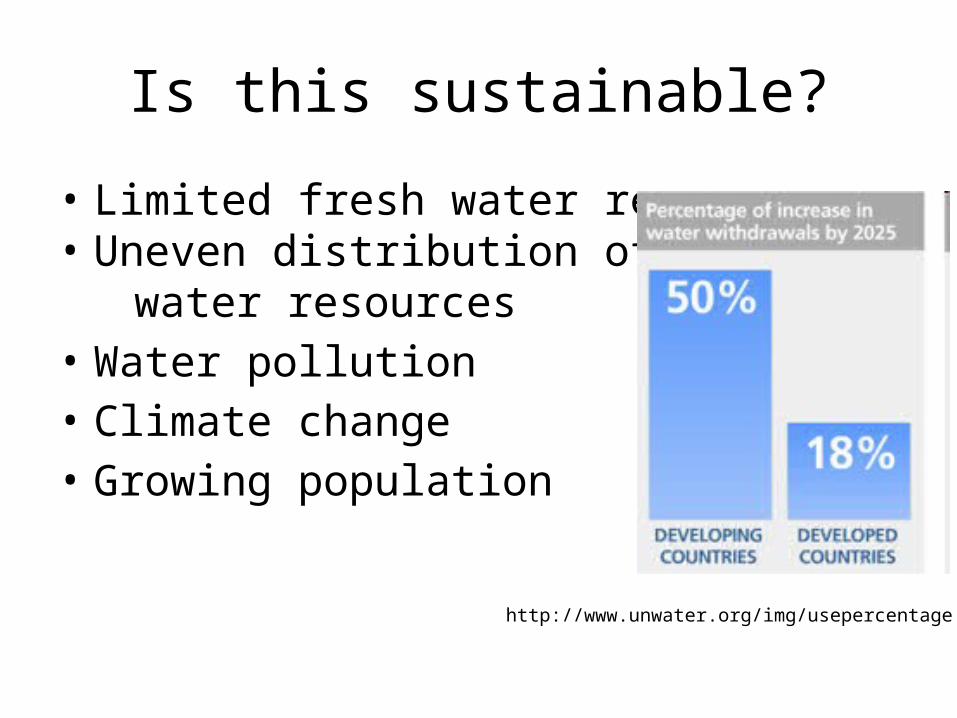
Is this sustainable?
• Limited fresh water resources• Uneven distribution of water resources• Water pollution• Climate change• Growing population
http://www.unwater.org/img/usepercentage.jpg
UNDERSTANDING SIGNIFICANT CLIMATE EVENTS IN WORLD
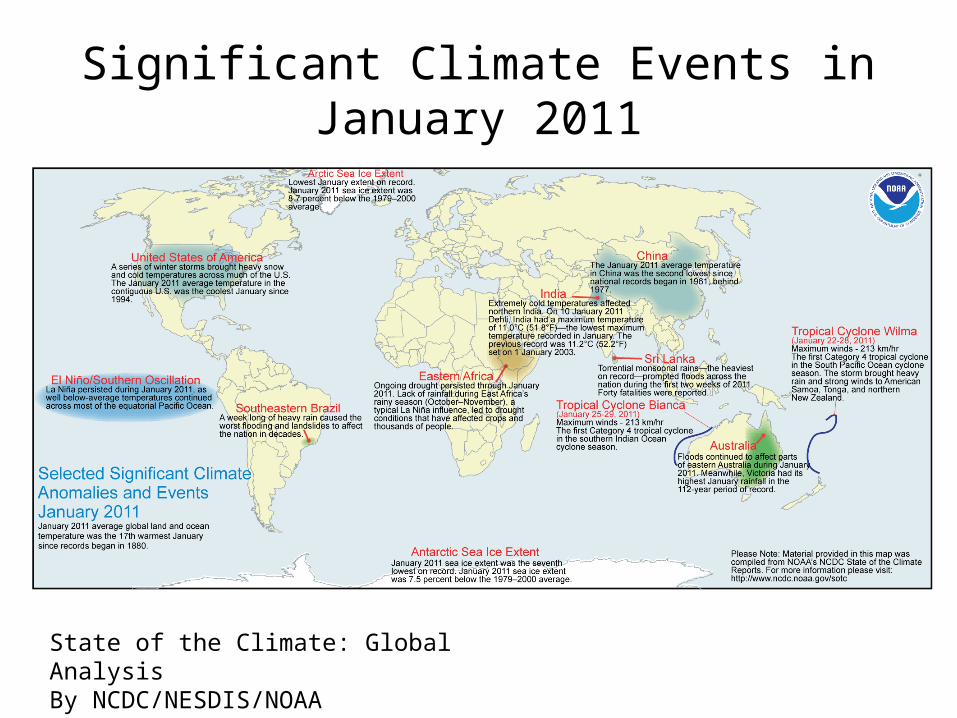
Significant Climate Events in January 2011
State of the Climate: Global AnalysisBy NCDC/NESDIS/NOAA
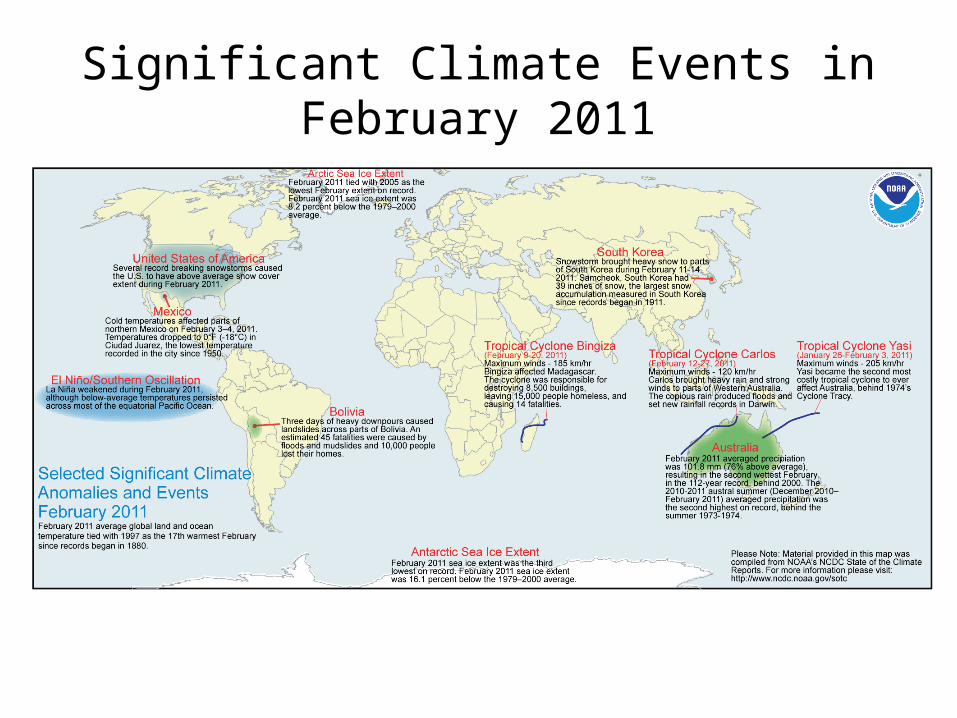
Significant Climate Events in February 2011
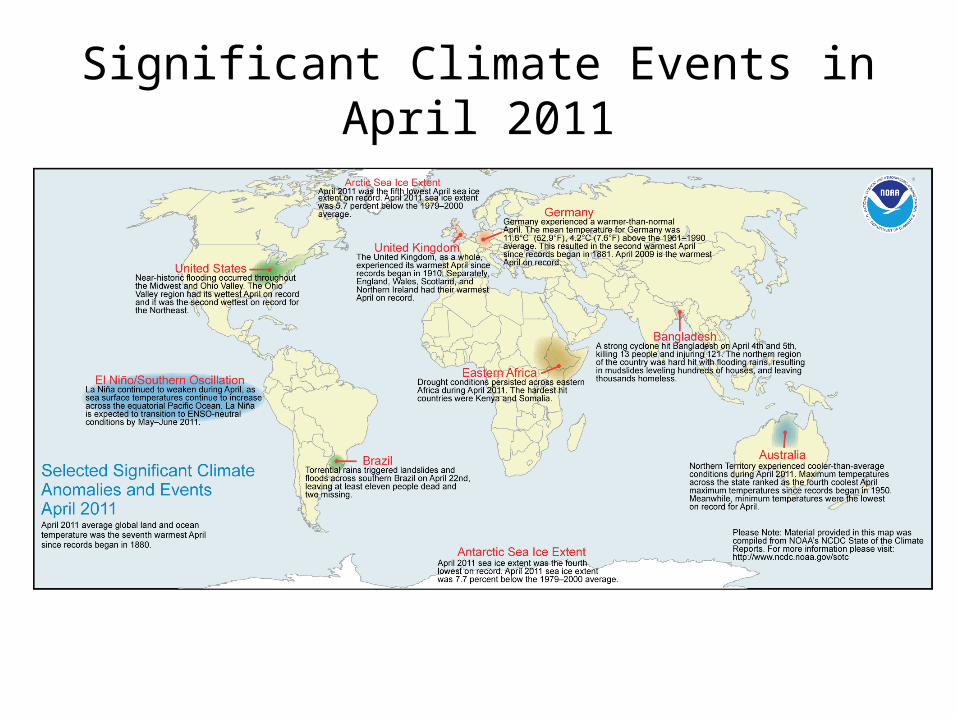
Significant Climate Events in April 2011
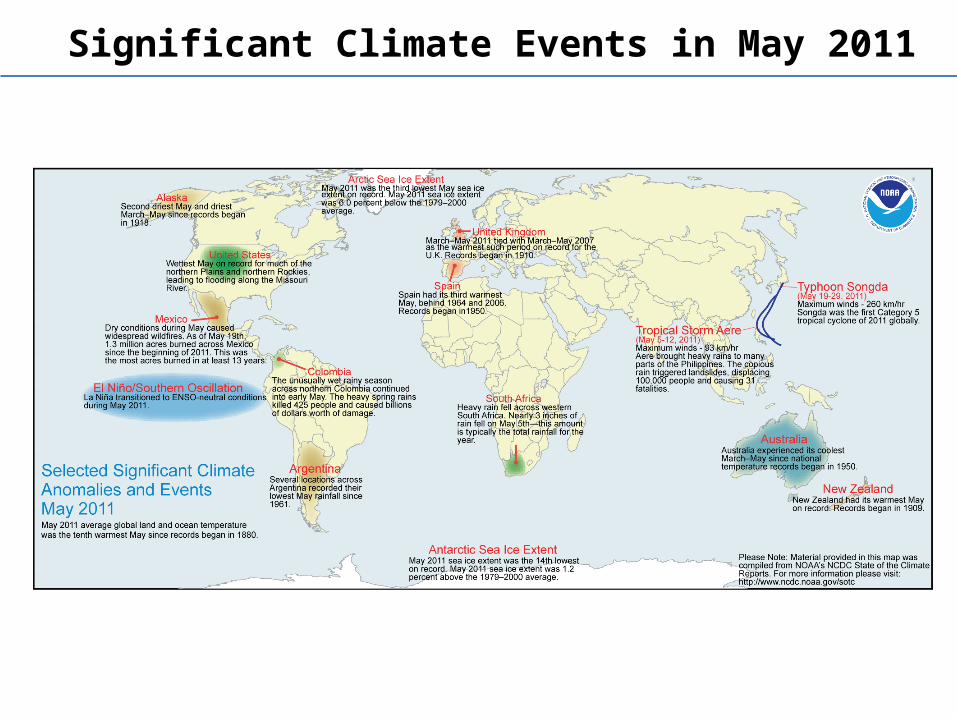
Significant Climate Events in May 2011
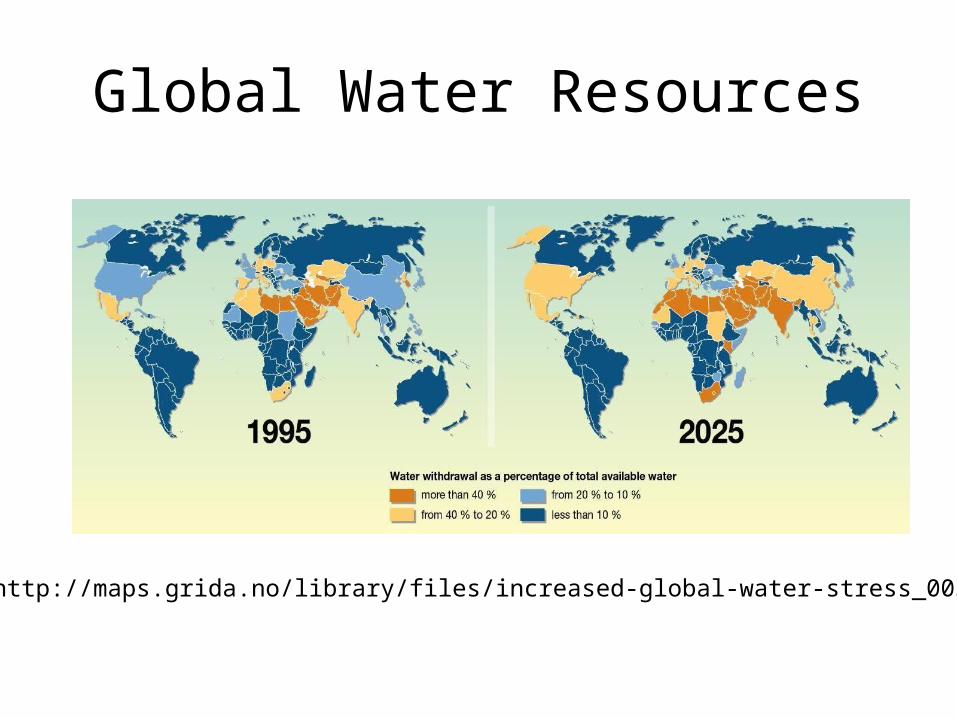
Global Water Resources
http://maps.grida.no/library/files/increased-global-water-stress_003.jpg
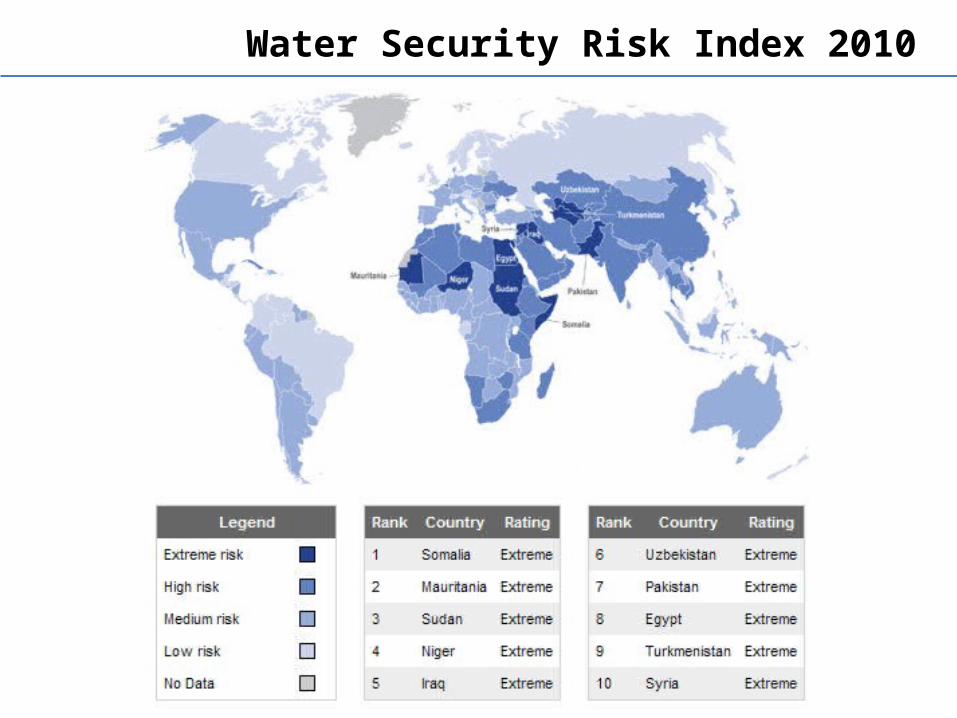
Water Security Risk Index 2010
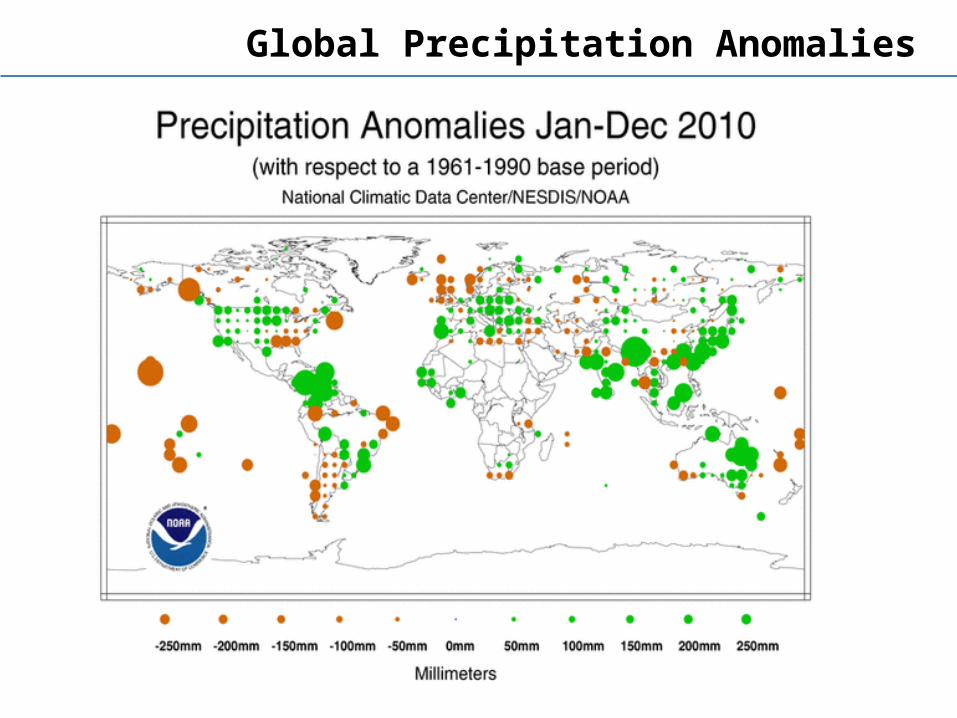
Global Precipitation Anomalies
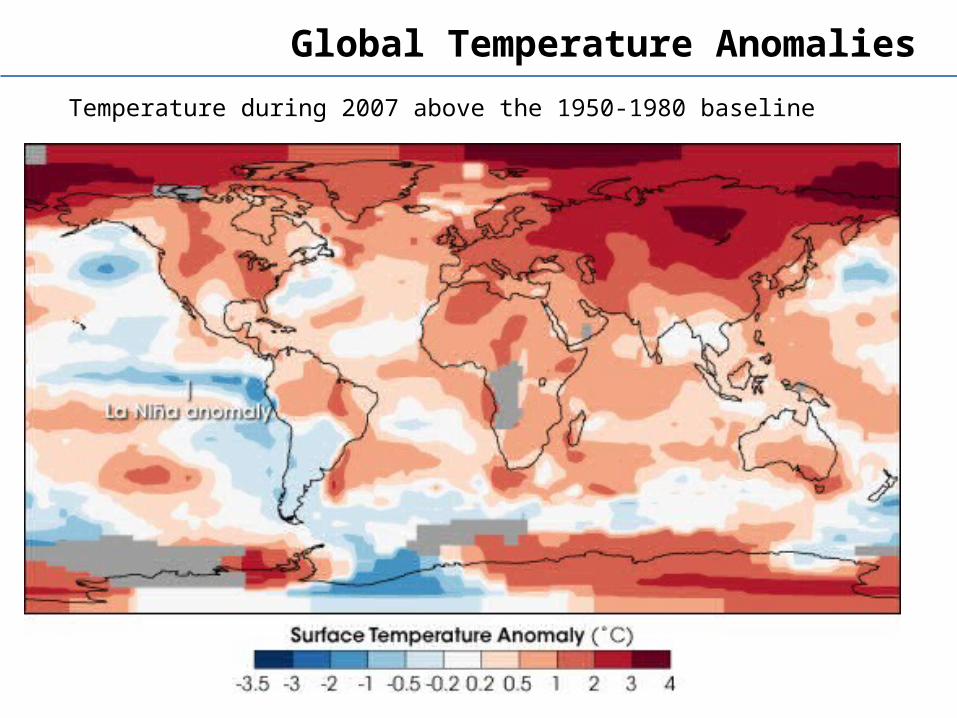
Global Temperature Anomalies
Temperature during 2007 above the 1950-1980 baseline
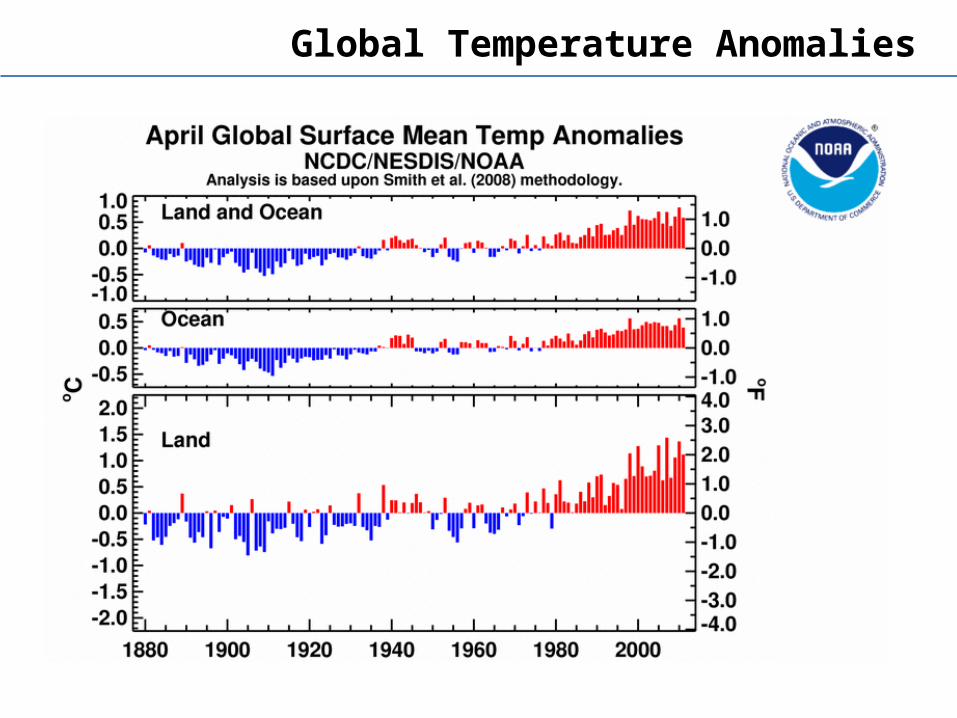
Global Temperature Anomalies
A future of water wars?“The wars of the 21st century will be fought over
water.”
— Ismail Serageldin, Chairman of the World Water Commission
• Already, scarcity has caused or exacerbated conflict in arid areas (e.g., Colorado River states in southwest U.S., the Middle East).
• Many nations have cooperated with neighbors to resolve water disputes.
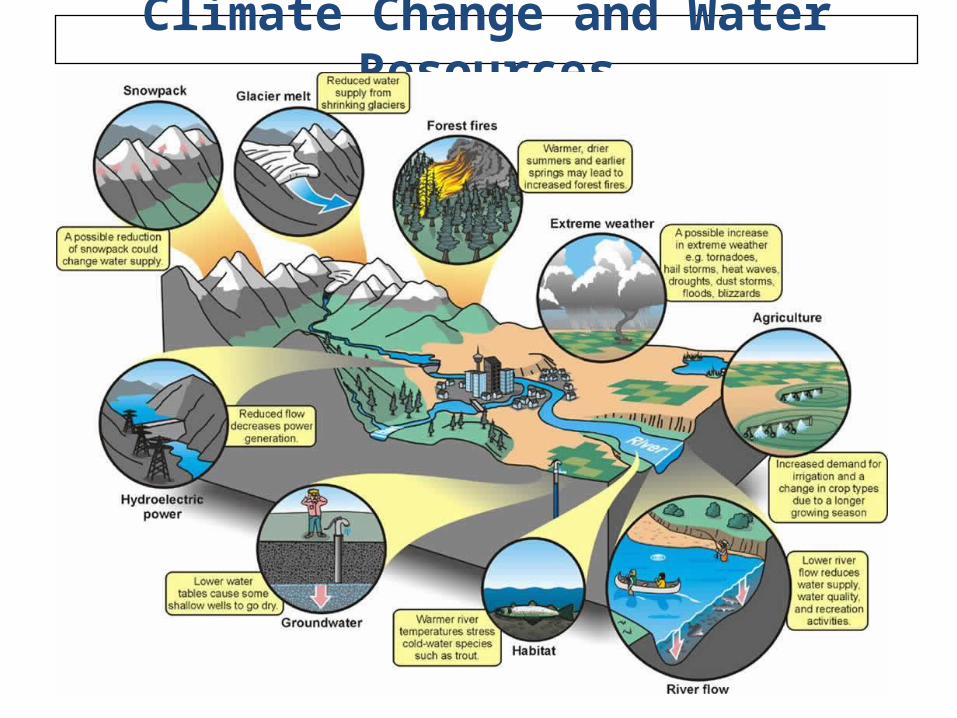
Climate Change and Water Resources
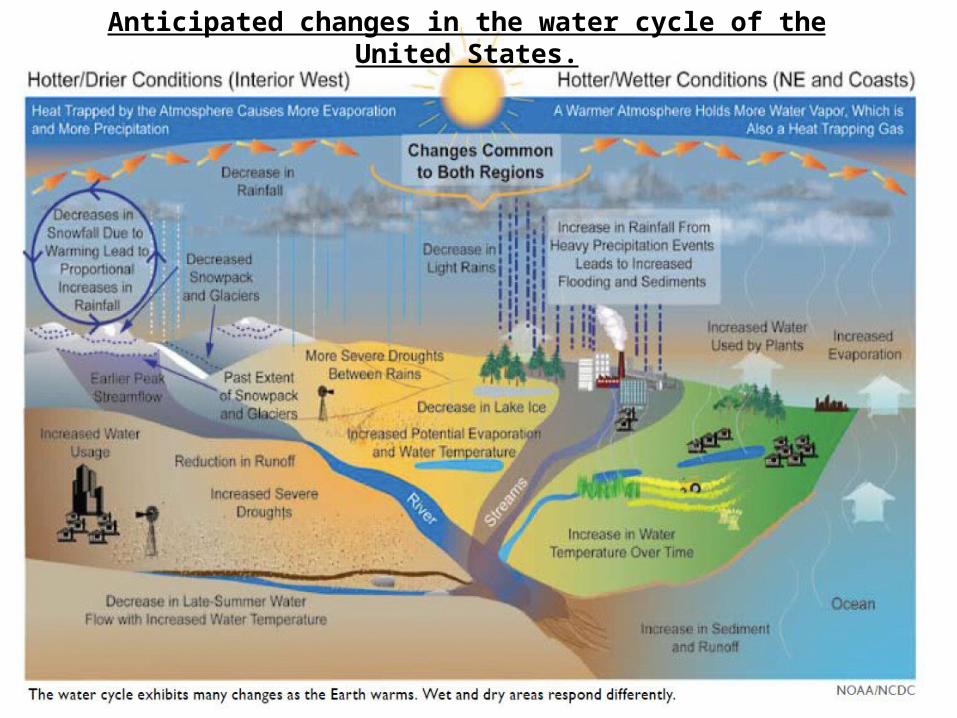
Anticipated changes in the water cycle of the United States.
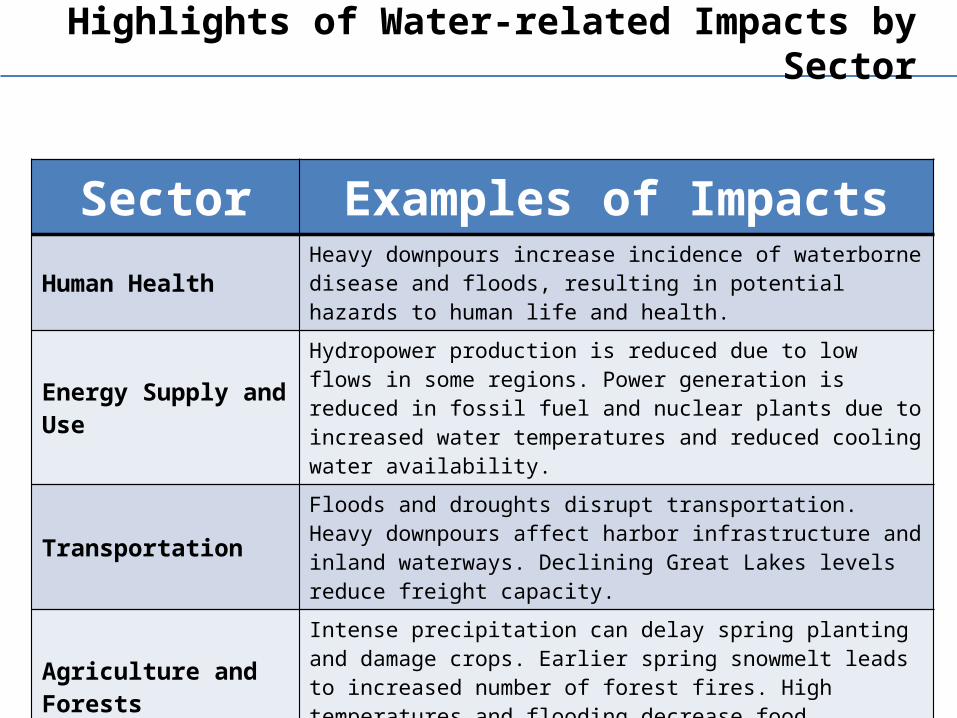
Sector Examples of ImpactsHuman Health Heavy downpours increase incidence of waterborne disease and
floods, resulting in potential hazards to human life and health.
Energy Supply and UseHydropower production is reduced due to low flows in some regions. Power generation is reduced in fossil fuel and nuclear plants due to increased water temperatures and reduced cooling water availability.
TransportationFloods and droughts disrupt transportation. Heavy downpours affect harbor infrastructure and inland waterways. Declining Great Lakes levels reduce freight capacity.
Agriculture and ForestsIntense precipitation can delay spring planting and damage crops. Earlier spring snowmelt leads to increased number of forest fires. High temperatures and flooding decrease food production.
Ecosystems Coldwater fish threatened by rising water temperatures. Some warm-water fish will expand ranges.
Highlights of Water-related Impacts by Sector
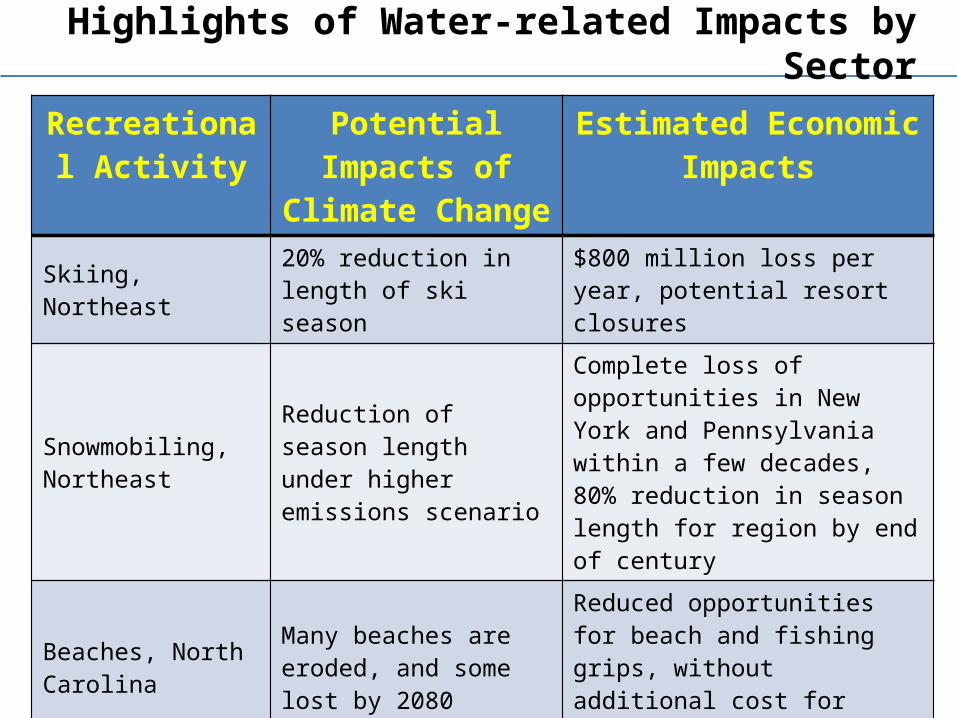
Recreational Activity
Potential Impacts of Climate Change
Estimated Economic Impacts
Skiing, Northeast 20% reduction in length of ski season
$800 million loss per year, potential resort closures
Snowmobiling, Northeast
Reduction of season length under higher emissions scenario
Complete loss of opportunities in New York and Pennsylvania within a few decades, 80% reduction in season length for region by end of century
Beaches, North Carolina
Many beaches are eroded, and some lost by 2080
Reduced opportunities for beach and fishing grips, without additional cost for adaptation measures
Highlights of Water-related Impacts by Sector
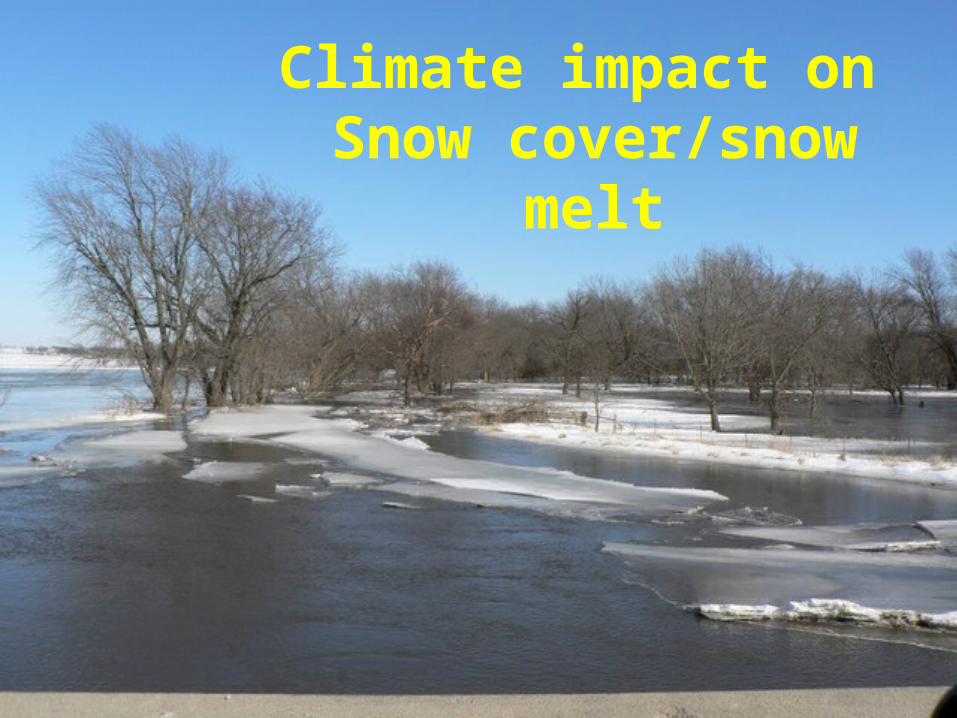
Climate impact on Snow cover/snow melt
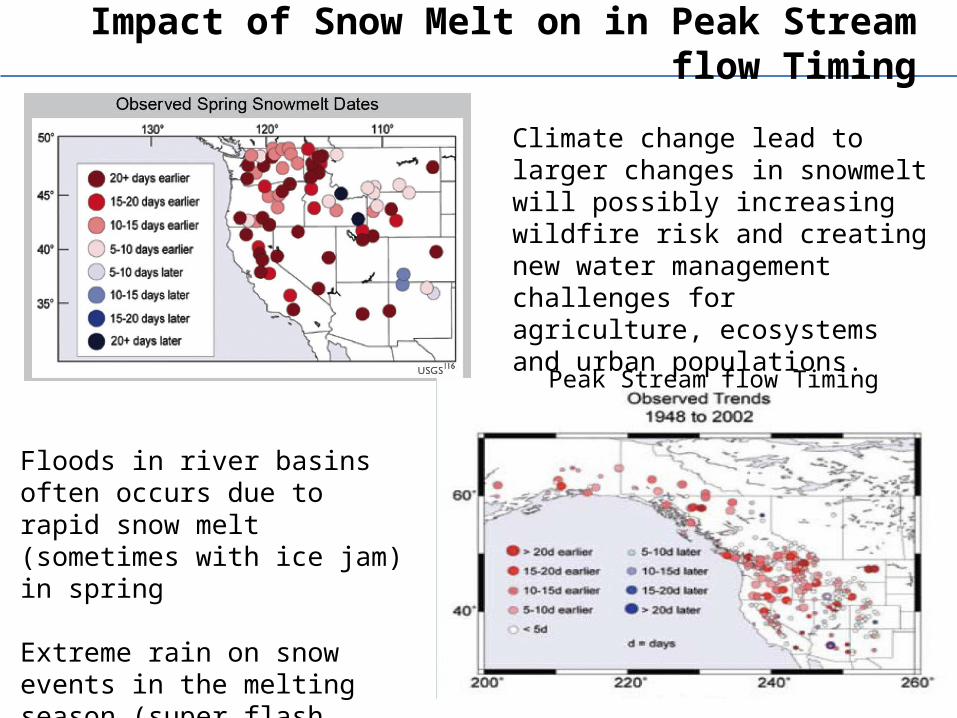
Impact of Snow Melt on in Peak Stream flow Timing
Peak Stream flow Timing
Climate change lead to larger changes in snowmelt will possibly increasing wildfire risk and creating new water management challenges for agriculture, ecosystems and urban populations.
Floods in river basins often occurs due to rapid snow melt (sometimes with ice jam) in spring
Extreme rain on snow events in the melting season (super flash flood)
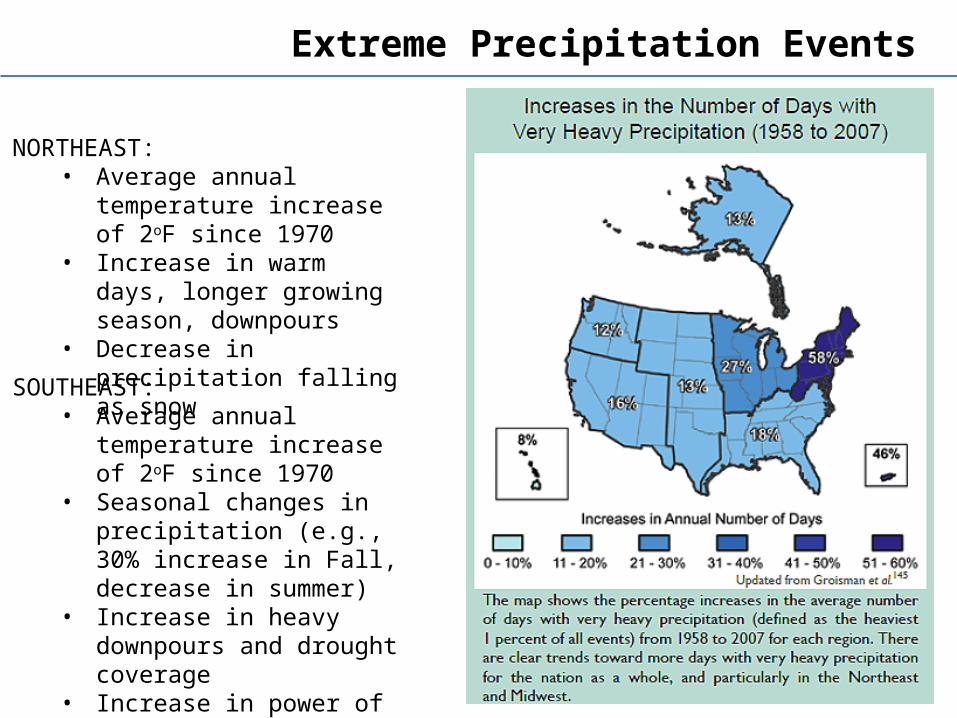
Extreme Precipitation Events
NORTHEAST:• Average annual temperature
increase of 2oF since 1970• Increase in warm days, longer
growing season, downpours• Decrease in precipitation
falling as snow
SOUTHEAST:• Average annual temperature
increase of 2oF since 1970• Seasonal changes in
precipitation (e.g., 30% increase in Fall, decrease in summer)
• Increase in heavy downpours and drought coverage
• Increase in power of Atlantic hurricanes since 1970
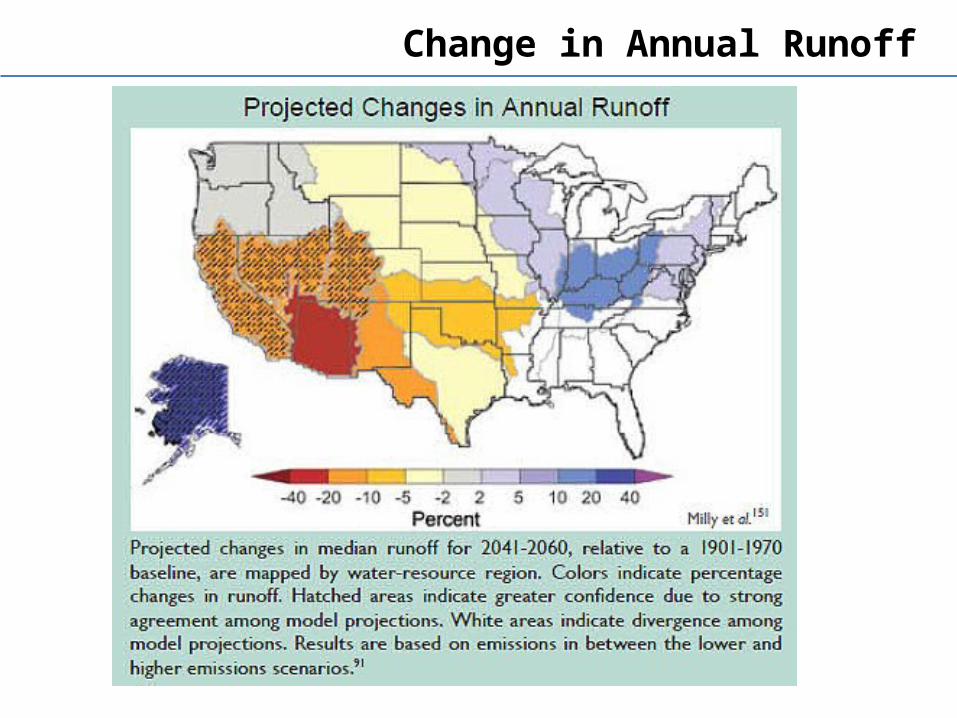
Change in Annual Runoff
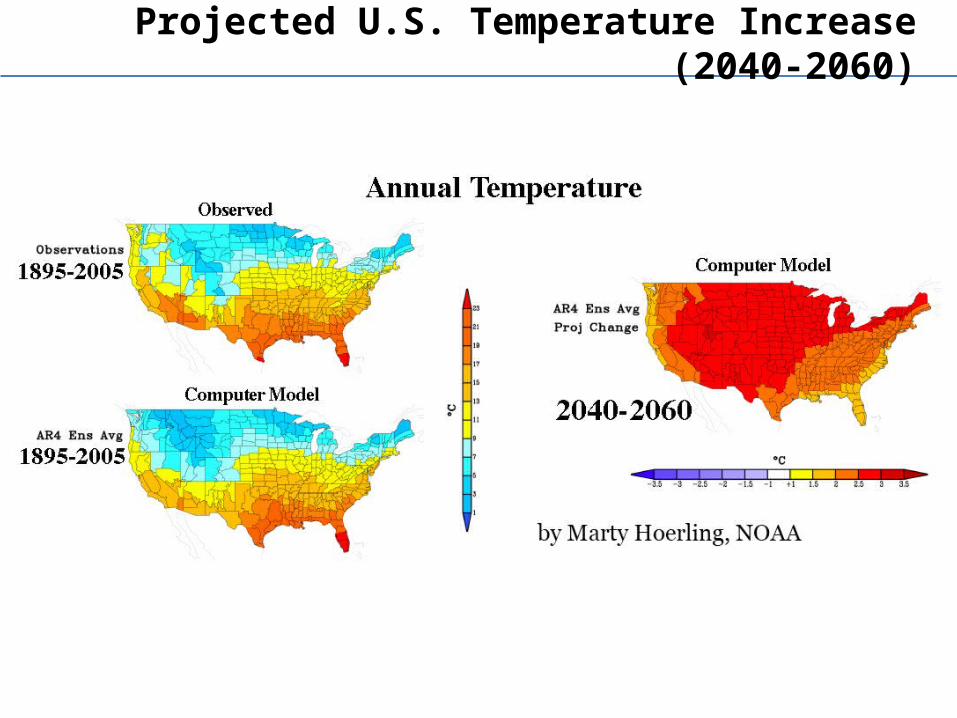
Projected U.S. Temperature Increase (2040-2060)
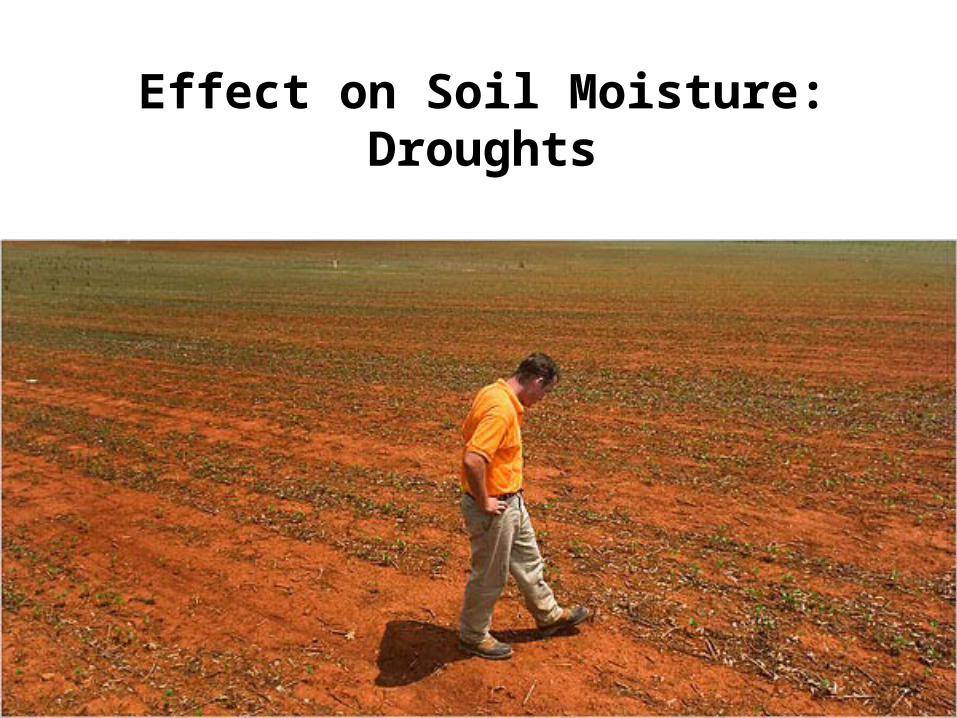
Effect on Soil Moisture:Droughts
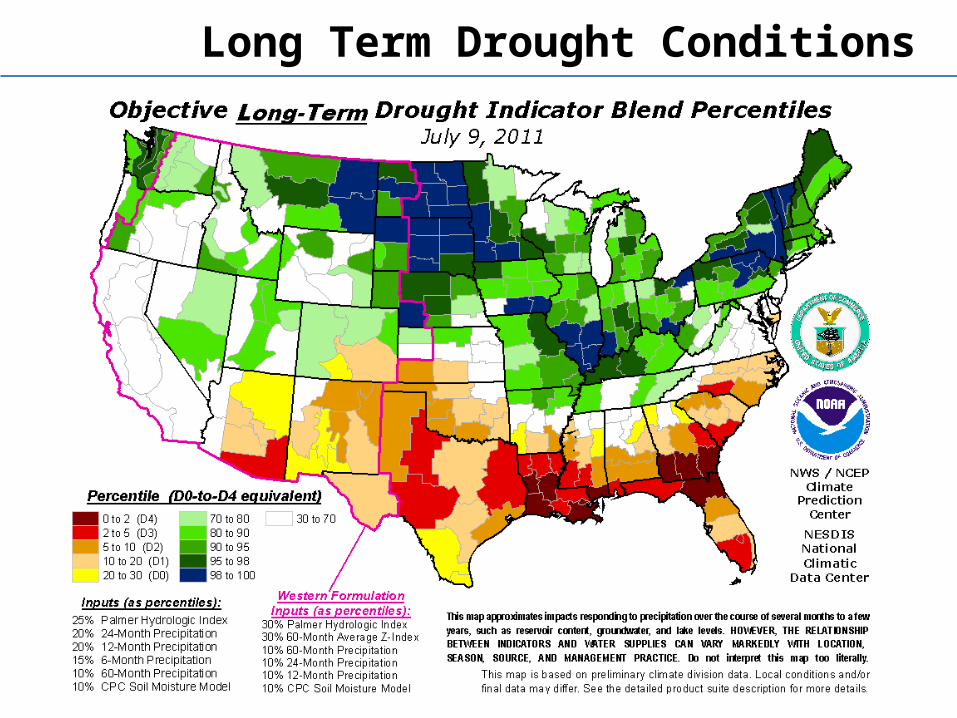
Long Term Drought Conditions
• An increase in average temperature can – lengthen the growing season in regions with a relatively cool spring and fall; – adversely affect crops in regions where summer heat already limits
production; – increase soil evaporation rates, and – increase the chances of severe droughts.
• Changes in rainfall can affect soil erosion rates and soil moisture, both of which are important for crop yields.
• Food production is projected to benefit from a warmer climate, but there probably will be strong regional effects, with some areas in North America suffering significant loss of comparative advantage to other regions.
• The U.S. Great Plains/Canadian Prairies are expected to be particularly vulnerable.
Effect on Agriculture Productivity
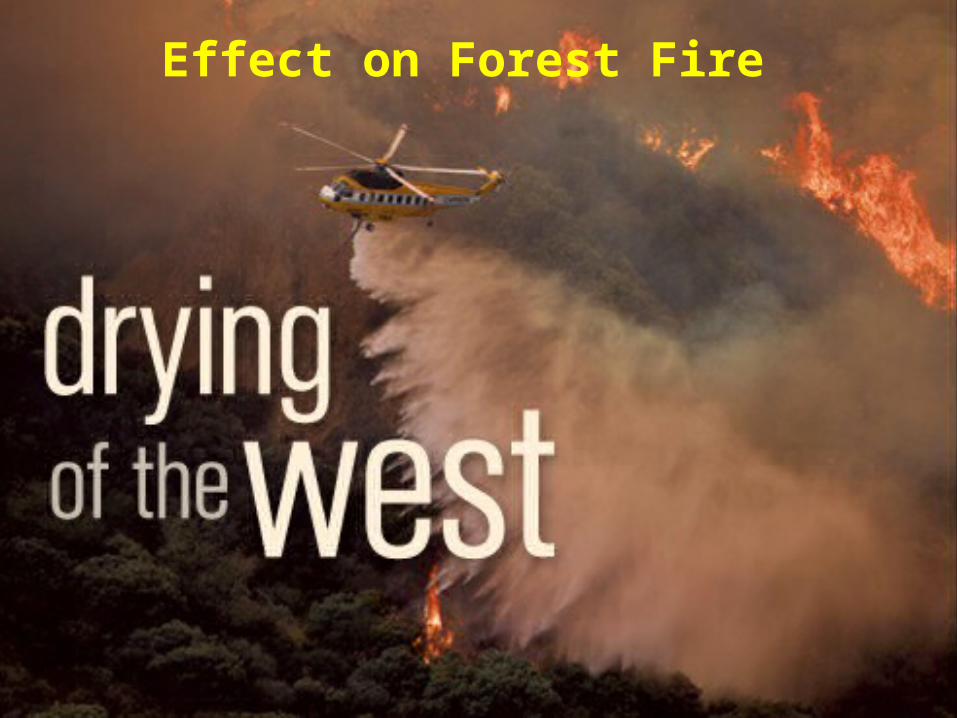
Effect on Forest Fire
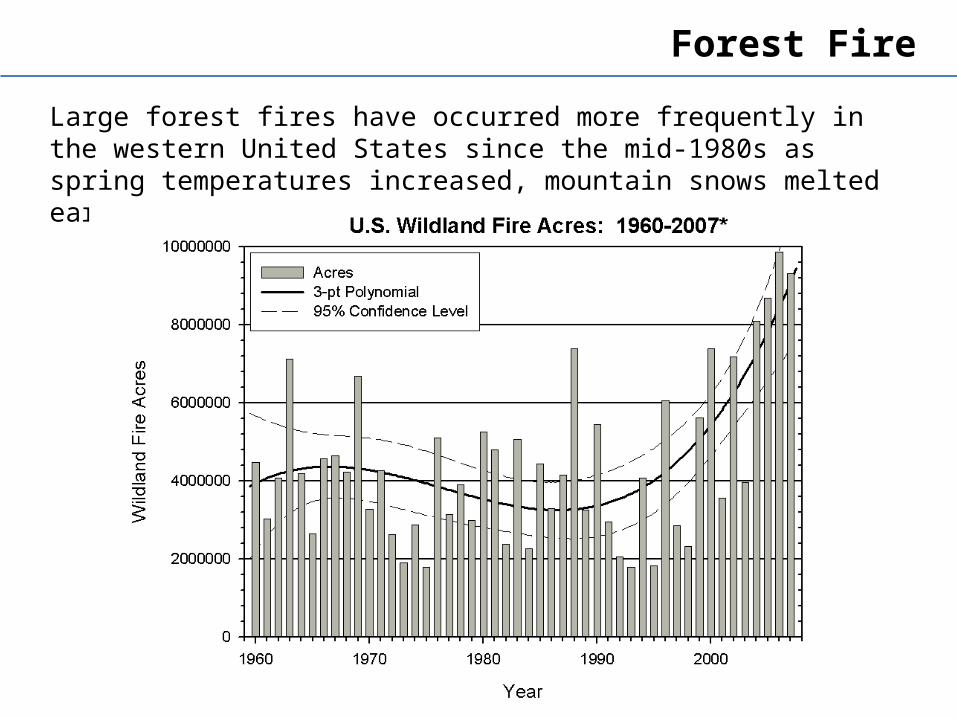
Forest Fire
Large forest fires have occurred more frequently in the western United States since the mid-1980s as spring temperatures increased, mountain snows melted earlier and summers got hotter.
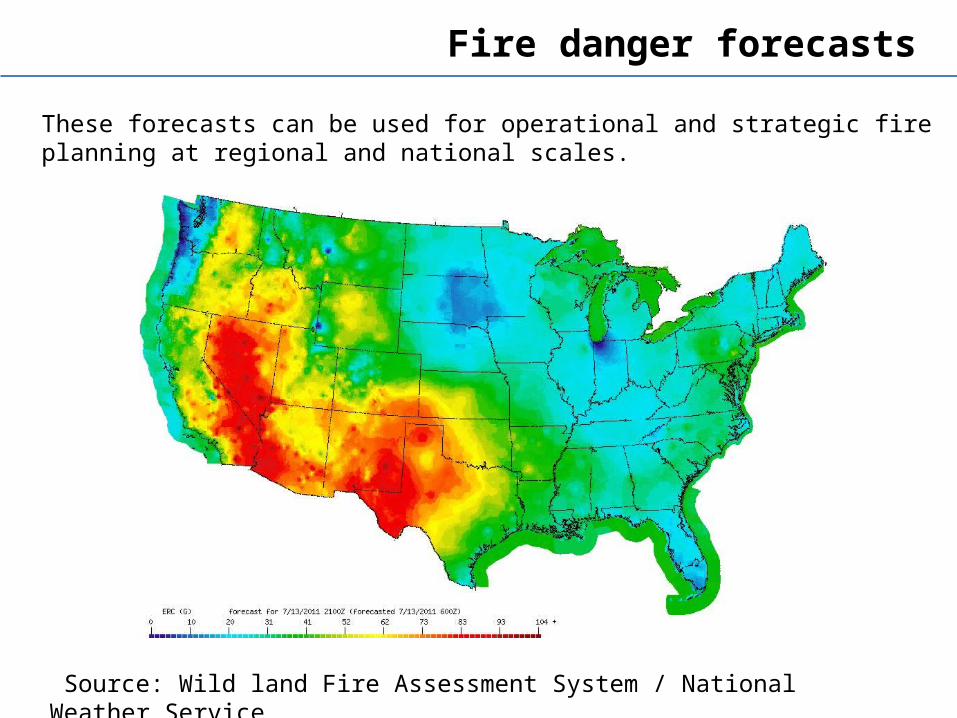
Fire danger forecasts
These forecasts can be used for operational and strategic fire planning at regional and national scales.
Source: Wild land Fire Assessment System / National Weather Service
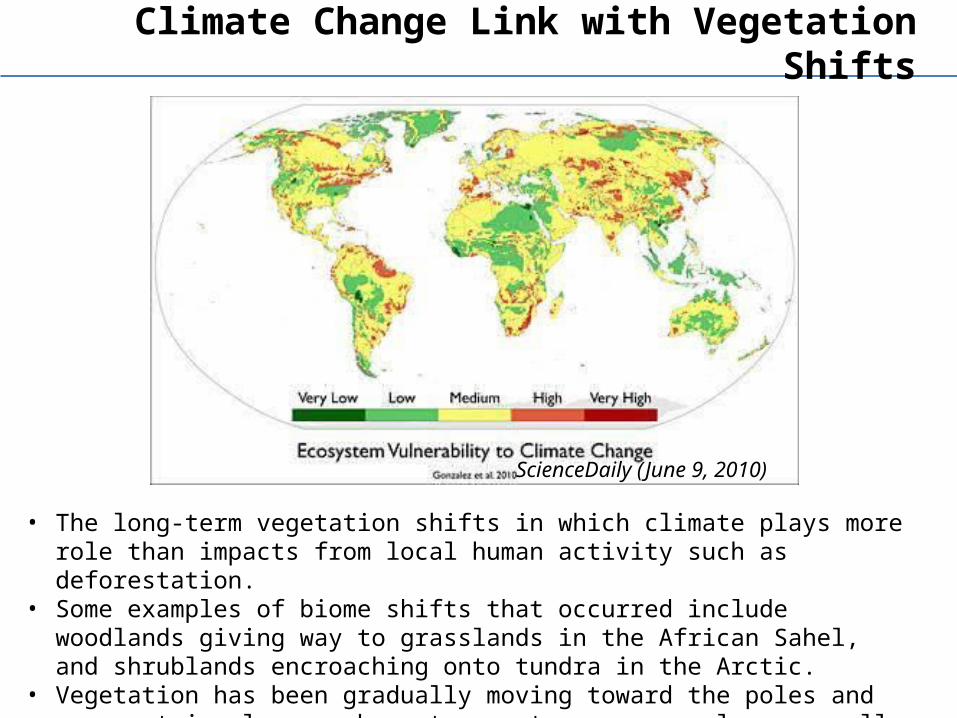
Climate Change Link with Vegetation Shifts
ScienceDaily (June 9, 2010)
• The long-term vegetation shifts in which climate plays more role than impacts from local human activity such as deforestation.
• Some examples of biome shifts that occurred include woodlands giving way to grasslands in the African Sahel, and shrublands encroaching onto tundra in the Arctic.
• Vegetation has been gradually moving toward the poles and up mountain slopes, where temperatures are cooler, as well as toward the equator, where rainfall is greater.
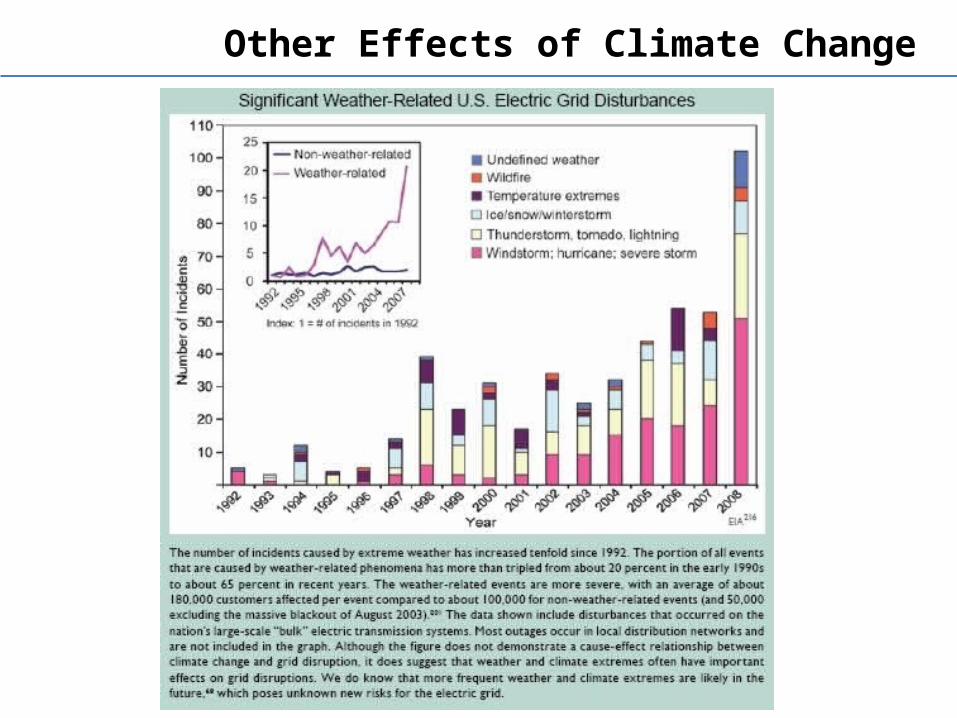
Other Effects of Climate Change
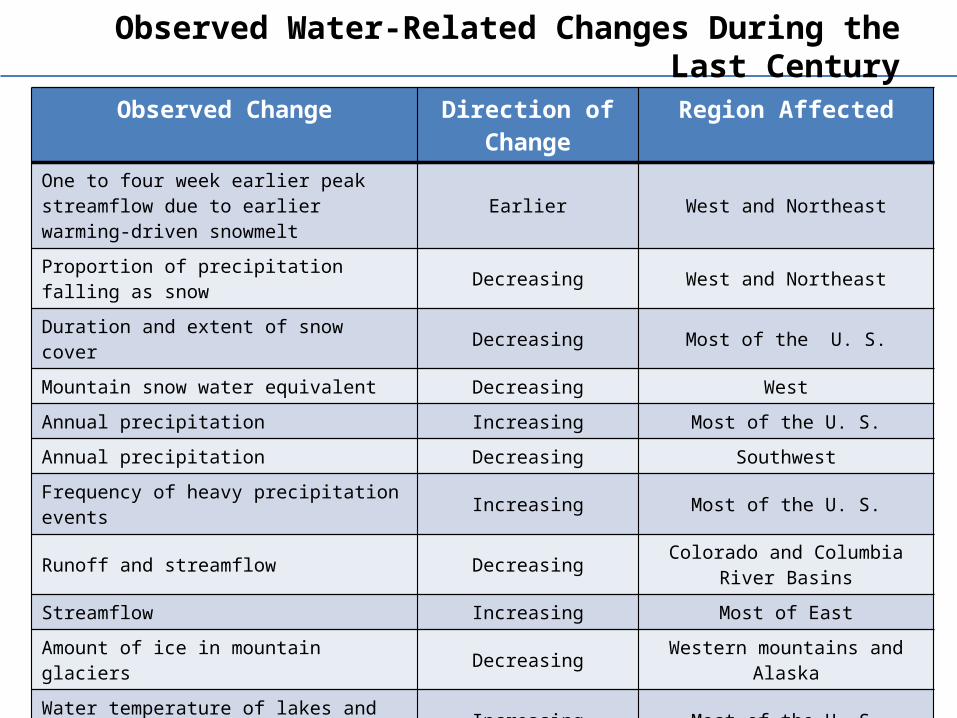
Observed Water-Related Changes During the Last Century
Observed Change Direction of Change Region AffectedOne to four week earlier peak streamflow due to earlier warming-driven snowmelt Earlier West and Northeast
Proportion of precipitation falling as snow Decreasing West and Northeast
Duration and extent of snow cover Decreasing Most of the U. S.
Mountain snow water equivalent Decreasing West
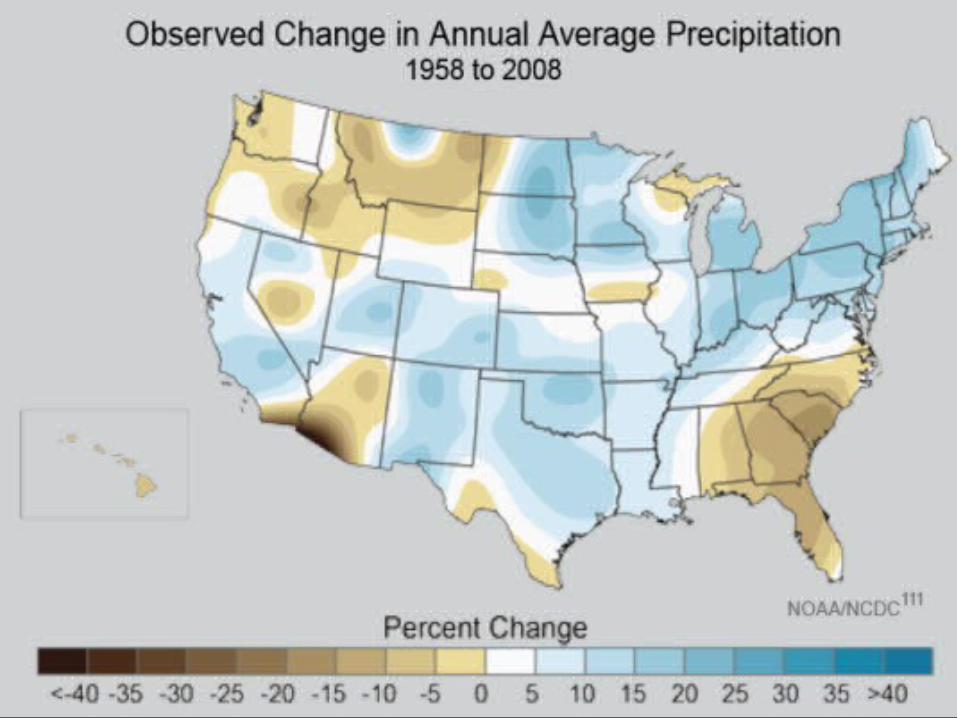
Annual precipitation Increasing Most of the U. S.
Annual precipitation Decreasing Southwest
Frequency of heavy precipitation events Increasing Most of the U. S.
Runoff and streamflow Decreasing Colorado and Columbia River Basins
Streamflow Increasing Most of East
Amount of ice in mountain glaciers Decreasing Western mountains and Alaska
Water temperature of lakes and streams Increasing Most of the U. S.
Ice cover on lakes and rivers Decreasing Great Lakes and Northeast
Periods of drought Increasing Parts of West and East
Salinization of surface waters Increasing Florida and Louisiana
Widespread thawing of permafrost Increasing Alaska
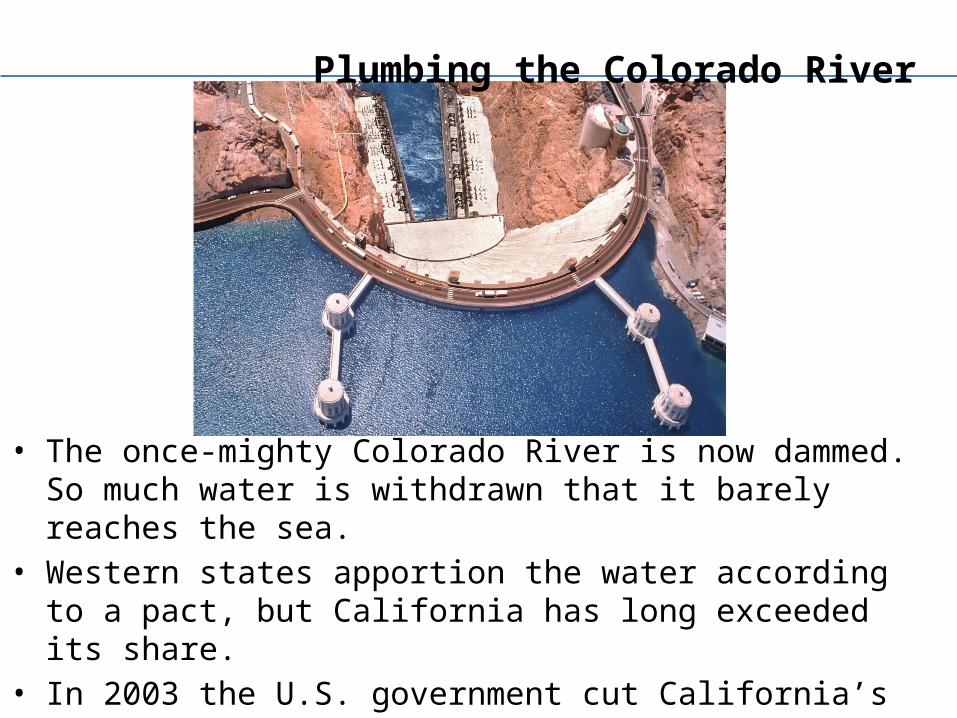
Plumbing the Colorado River
• The once-mighty Colorado River is now dammed. So much water is withdrawn that it barely reaches the sea.
• Western states apportion the water according to a pact, but California has long exceeded its share.
• In 2003 the U.S. government cut California’s flow. Months of wrangling followed until a deal was reached.
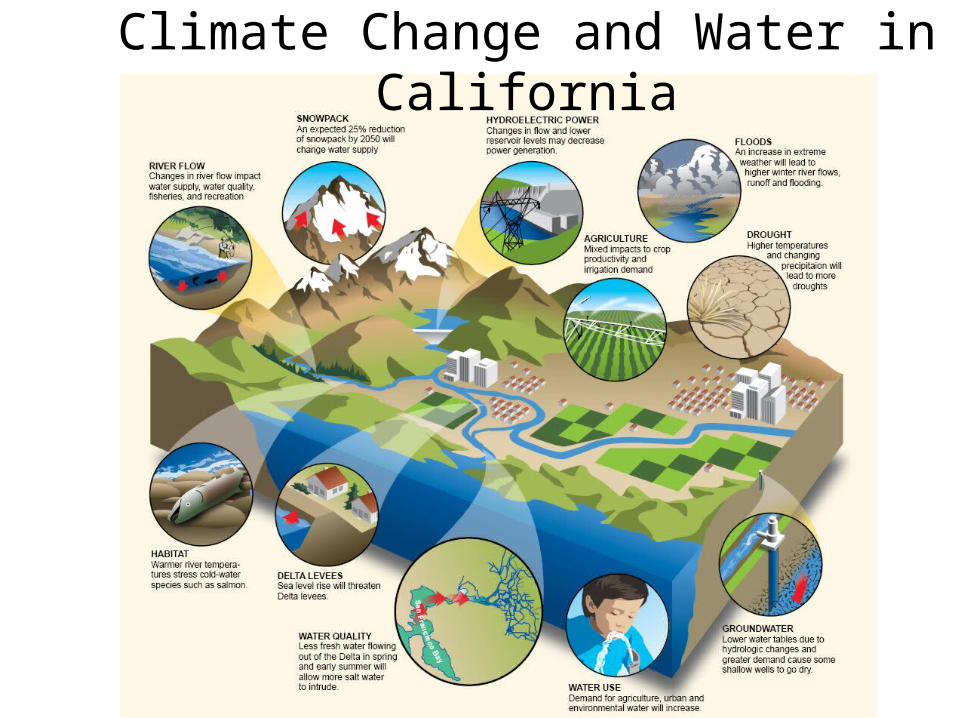
Climate Change and Water in California
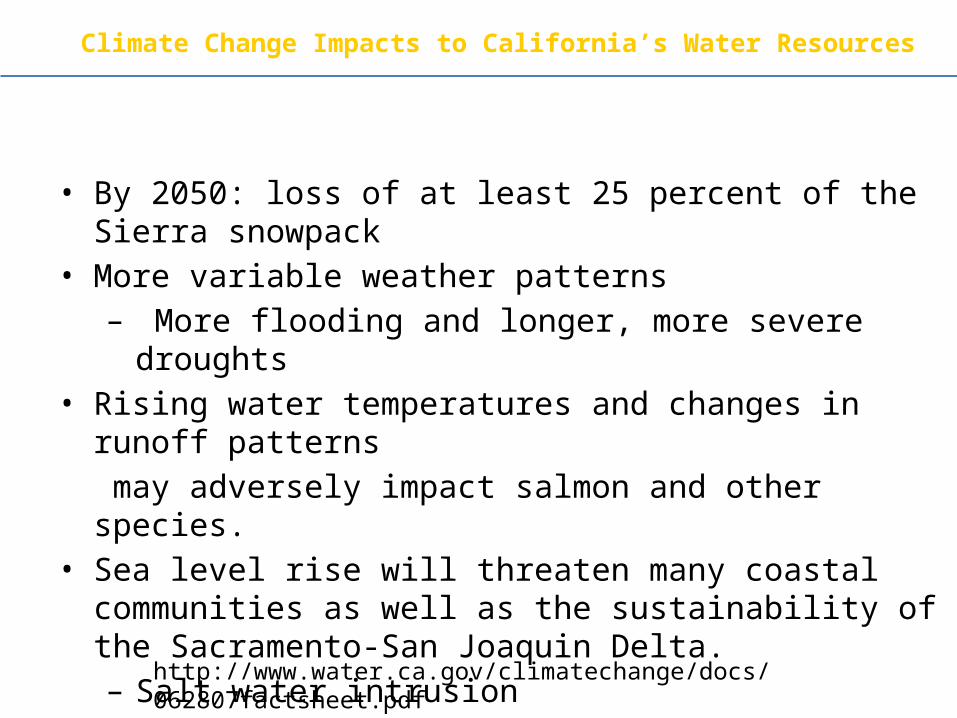
Climate Change Impacts to California’s Water Resources
• By 2050: loss of at least 25 percent of the Sierra snowpack• More variable weather patterns– More flooding and longer, more severe droughts
• Rising water temperatures and changes in runoff patterns may adversely impact salmon and other species.
• Sea level rise will threaten many coastal communities as well as the sustainability of the Sacramento-San Joaquin Delta. – Salt water intrusion
http://www.water.ca.gov/climatechange/docs/062807factsheet.pdf
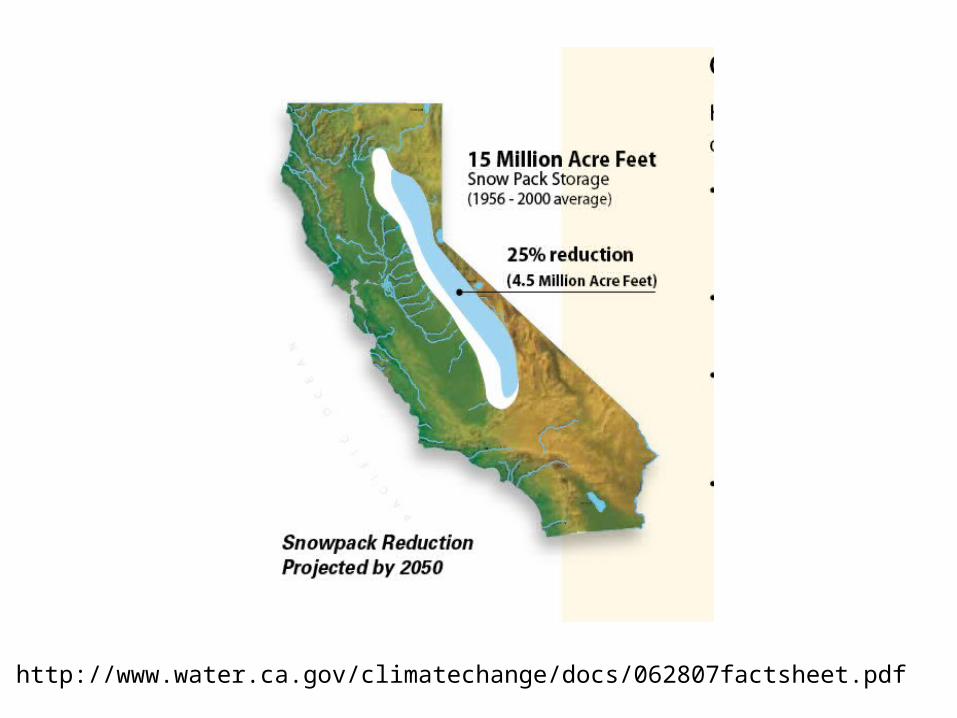
http://www.water.ca.gov/climatechange/docs/062807factsheet.pdf
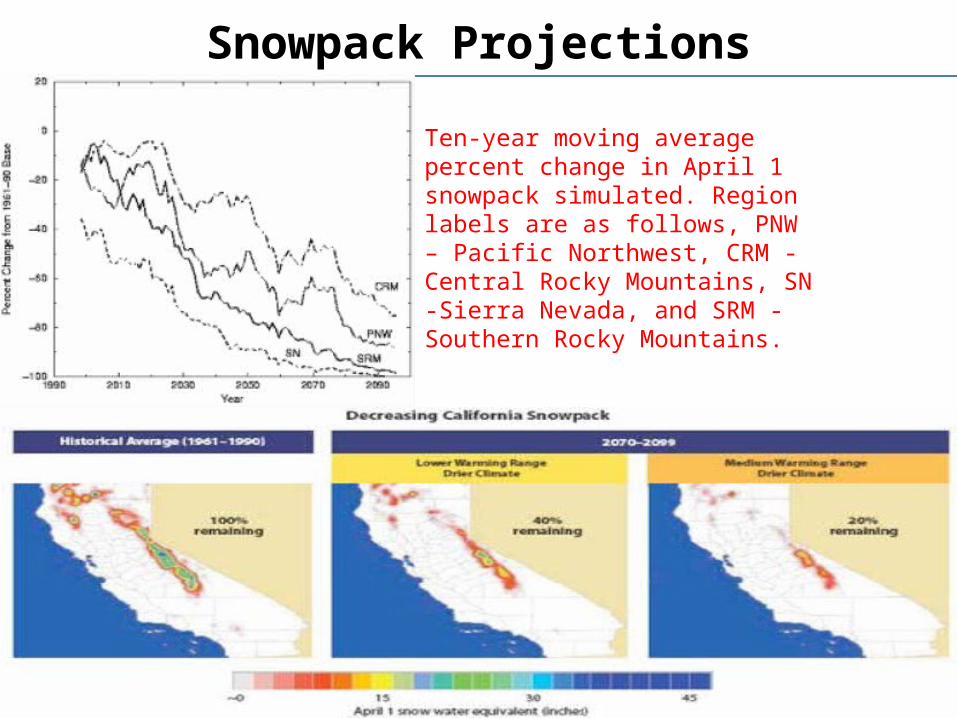
Snowpack Projections
Ten-year moving average percent change in April 1 snowpack simulated. Region labels are as follows, PNW – Pacific Northwest, CRM - Central Rocky Mountains, SN -Sierra Nevada, and SRM - Southern Rocky Mountains.
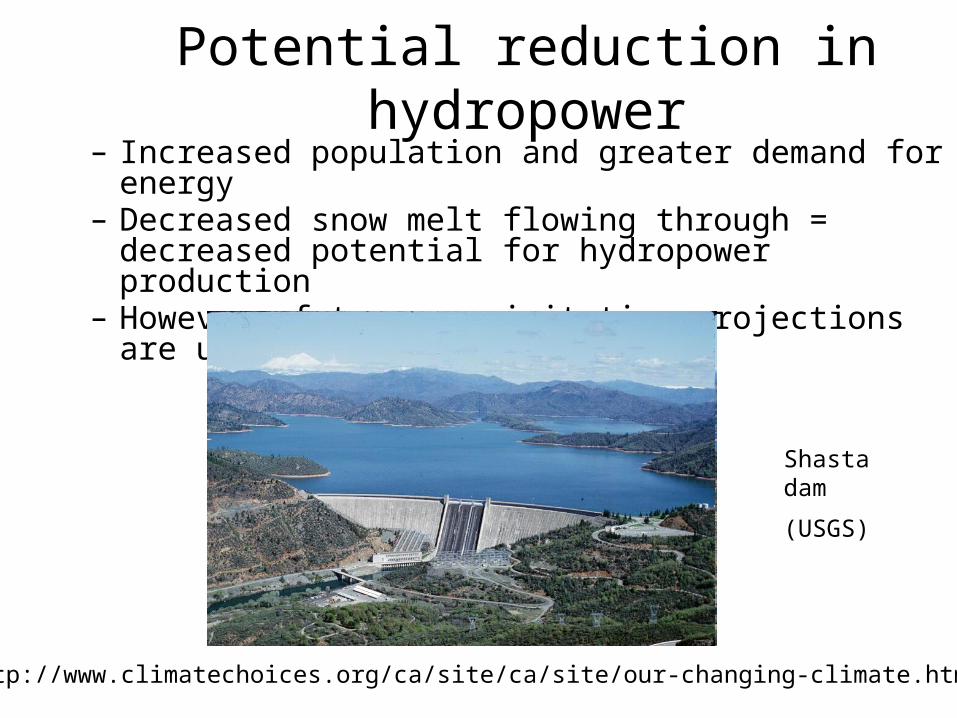
Potential reduction in hydropower– Increased population and greater demand for energy – Decreased snow melt flowing through = decreased potential
for hydropower production– However, future precipitation projections are uncertain.
Shasta dam
(USGS)
http://www.climatechoices.org/ca/site/ca/site/our-changing-climate.html
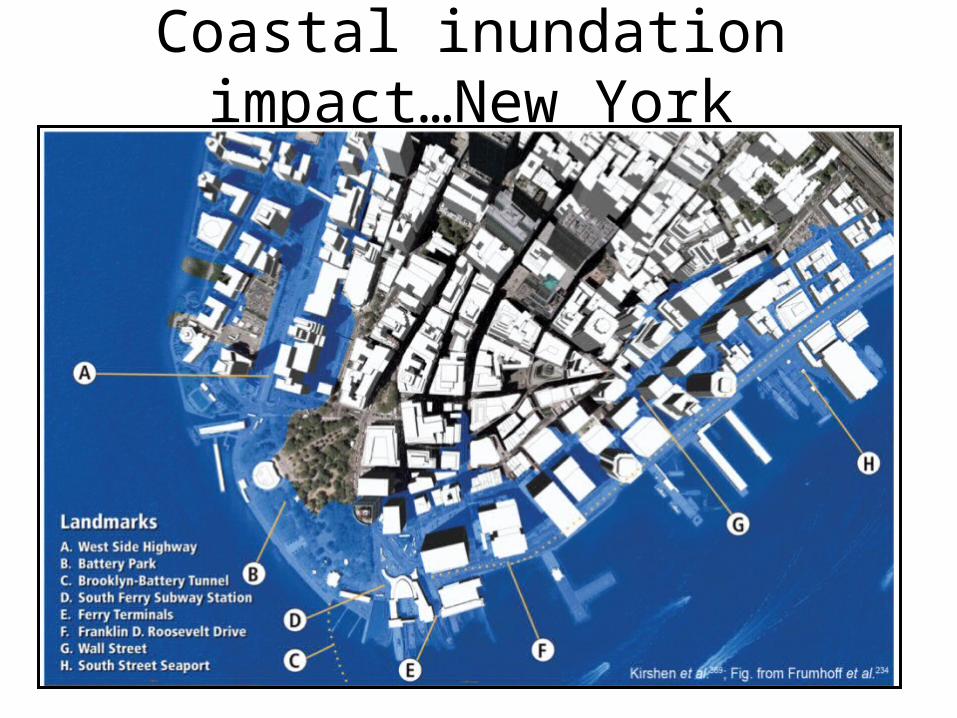
Coastal inundation impact…New York

Questions?