regional business creation and push fact9rs : the case...
TRANSCRIPT
This paper was presented on the Fourth Annual Global Conference Entrepreneurship Research,Fontainebleau, France, March 1994.
Copyright C) 1991- É:cck des Haules Études Commercialu (HEC) Monlréa/.TOII8 droit8 rhervés JX1III' tOll8 JKlY8. T0f41e tTaductian 0f4 tOUle reproduction sow quelque forme que ce soit en interdite.
Lu textn publlb dœu la .rie du cahiers de recherche HEC n'engagent que la reapon.rabilité de kun auteurs.La publication de ce cahJ.,. de recJruche a été rendue po88ible g1'dce à du subventions d'aide à 10 publication et à 10 dfllûsion de la recIwdwpt'O\IOIQ1It des fonda de l'École du HE. C.Direction de la reche1'che, É:cck du HE.C, 3000 chemin de la CôIe-Sainte-Cathe,.ine.. Montro/ (Québec) Canado H3T lA7
Regional Business Creation and"Push" Fact9rs : The Case of Quebec
by
Jean-Marie Toulouse, Gilles Roy andLuc Vallée
Cahier de recherche no 94-01-01
Janvier 1994ISSN : 0840-853X

",',...j"""",,=., ~ '-~

ABSTRACT
We have undertaken to examine regional variations in business formation rates inCanada by concentrating fIrst of all on the province of Quebec. This document providespreliminary results. They suggest that regional development is not best achievedthrough the direct creation of jobs, but rather through the promotion of workers'mobility or through the removal of barriers to workers' mobility. Such a policy mayappear paradoxical to some, given that it could lead to the exodus of workers fromcertain regions where the govemment is investing to foster development and createjobs. However, the govemment's costly effort is more likely to reduce workers' mobilityand be detrimental to the development of other regions where the workers would haverelocated at no cost to taxpayers.


Regional Business Creation and "Push" Factors:The Case of Quebec
1. uctionIntrod
The question of regional variation in the rate of fInn creation has long been thefocus of a wide range of studies and analyses by specialists in the field of entrepre-neurship, particularly in the United States and the United Kingdoml. Clearly, interestin this issue must be placed in the context of the broader research trend concerning theeconomic and social contributions of entrepreneurs in terms of job creation,technologica1 innovation, and economic development2.
Most of these studies have sought to define the structural and sociodemographicvariables which can account for relative variations in the regional rate of ftnn creation.Using 10hannisson (1991) as a reference, we have undertaken to group these variablesinto ftve broad alternative explanatory models: the "push", "pull", resource, contextual,and network models.
1.1. The "Push8 Model
The "push" model represents an essentially reactive conception of the entrepreneu-rial process. It is based on the hypothesis that individuals are driven to create their ftnnin reaction to difficulties encountered in the labour market. These difficulties may bethe result of harsh macro-economic conditions (recession, high unemployment rate,company closings), personal problems experienced as a wage eamer Gob dissatisfaction,threat of lay-off or closure, impossibility of career advancement), or integrationproblems resulting from an individual's immigrant status. This model is also called the"push-recession" model because of its close links to macro-economic cycles3. Accordingto this theoretical framework, the most entrepreneurial regions should be those where
1 For the United Statea, Bee Penninga, 1982; Sche:ll, 1983; Butle:rand He_n, 1991. For the: United Killldom, Bee Birle:y,
1984; Gud,m, 1978; Crou, 1981; Maaon, 1982; Storc:y, 1982, 1985a; O'Farrell and Crouchle:y, 1985; Binks andJe:nninga, 19868, 1986b; Uoyd and Mason 1985, We:llthc:ad, 1989; We:llthead and Moyea, 1992.
2 c.r., Birch, 1979, 1987; Gudgin, BnlOlkill and Fochergill, 1979; Sweeney, 1987; Kirchhoff and Pbillip., 1988, 1991.
3 c.r., Storey, 1982; Binks and Jennings, 1986a, 1986b; Welllhead, 1989; Hamilton, 1989.
Copyrlgltl . École des HEC 1

Regional Business Creation and "Push" Factors: The Case of Quebec
these negative motivational factors are the strongest; that is, in regions with highunemployment, difficult economic conditions, and a high proportion of new arrivais.
1.2. The "PullR Model
Contrary to the "push" model, the "pull" model considers entrepreneurship to be theend result of a positive force; the voluntary and carefully thought-out action of a persanwho was able to detect and exploit a promising business opportunity in a particularmarket. According to this model, then, the most entrepreneurial regions should bethose where business opportunities are the most numerous and where demand is thestrongest or on the increase. The agglomeration/rurality factor is generally the mostimportant factor in this model, with variables such as the income level, demographicgrowth, and the progression of regional demand4.
The Resource Mode!1.3.
This model explains variability in the firm creation rate in terms of the quality ofthe resources available to entrepreneurs in a given region. Considered here are:physical resources (vacant industrial spaces, commercial and industrial infrastructures,rea1 estate), [mancial resources (land appraisal, financial services, availability of riskcapital), professional resources ( entrepreneurship support groups, industrial commissio-ner, technica1 support services) and human resources (percentage of children in full-time education, proportion of university and college graduates).
According to this approach, the regions with the richest resources should show thehighest rate of firm creations.
Contextual1.4. The
As its name suggests, the contextual model focuses on a set of socio-demographic,economic, and cultural variables which have an impact on the quality of the entrepre-neurial climate in a given region.
Inc1uded in this model are, first of aIl, the variables which characterize the industrialand occupational structure of a region. It considers elements such as industrial structureand concentration, the presence of entry barriers, the size of existing fInns, the
4 C.C., Gudgin, 1978; Crou, 1982; Muon, 1982; Storey, 1982; O'farrelland Crouch1ey, 1984; Oou1d and Keeble, 1984;
Welthead 1989; Keeble, 199Ob; Banks, 1991; Johanniuon, 1991.
5 C.f., Folhergill and Gudgin, 1982; Storey, 1982; Keeble and Oould, 1985; Florida and Kenney, 1988; Malecki, 1990;
Banb. 1991; Johannil8On. 1991; Westhead and Moyea, 1992.
~. &01. dGIIBC
Model
2

Regional Business Creation and "Push" Factors: The Case of Quebec
proportion of independent organizations, the importance of the service sector, and theoccupational profùe of the region6.
The model a1so attempts to capture the quality of the entrepreneurial climate andthe level of social support available to entrepreneurs in the community, independentlyof fmancial and technical support. This dimension can be assessed by means of suchvariables as the proportion of self-employed workers, the level of employment in artisticprofessions, the number of business associations and sports associations, the majoritypolitical affiliation, the proportion of immigrants, the age prome, the typical parentalstatus, the rate of unionization, and the crime rate7.
Although the literature is not unanimous, certain authors have identified a positiveand significant correlation between the rate of firm creation and the following variables:a high percentage of manufacturing jobs in companies with less than 50 employees(Gudgin, 1979; Cross, 1981), weak industrial specialization (Cross 1981; Garofoli, 1991),a high percentage of total jobs in industries with weak entry barriers (O'Farrel andCrouchley, 1984), a low proportion of non-native firm subsidiaries (Malecki, 1990), ahigh percentage of managers, professionals, and self-employed workers (Storey, 1982;Garofoli, 1991; Westhead and Moyes, 1992), a strong proportion of workers in thecultural industry (Johannisson, 1991), a large number of business associations andsports associations (Johannisson, 1991), a strong proportion of immigrants (Pennings,1982; Schell, 1983; Chrisman, Van Deusen and Anyomi, 1992), and a politica1 culturefavourable to business (Westhead and Moyes, 1992).
1.5. The Network Mode!
This modellinks variability in the rate of fIrm creation to membership in a network,to the quality and to the vitality of business networks which can support the communityof entrepreneurs. Variables such as inclusion, exclusion, size, stability, °penness,professionalism, and spatial distribution of the networks are considered here .
1.6 Research Objectives
We have undertaken to examine regional variations in business formation rates inCanada by concentrating first of aIl on the province of Quebec. This document providesa summary of the main results obtained in the context of our preliminary work on the"push model". ln subsequent papers, we will extend our research to the other modelscited and to all Canadian provinces. Our ultimate goal is obviously to arrive at a better
6 C.f., Gudgin, 1981; Cross, 1981; Storey, 1982; O'Parrel and Crouchlcy, 1984; Aydalot, 1986; Johanni880n, 1991;
Garofoli, 1992; Wc8lhcad and Moyel, 1992.
7 c.r., Sb8pero and Sokol, 1982; O'Farrel and Crouchley, 1984; Westhead, 1989; JohanniUOD, 1991; Westhead and
Moyea, 1992.
8 c.r., Sellen, 1981; Aldrich et al.
Copyrl,hI . &ok de. HEC

Regional Business Creation and .Push. Factors: The Case of Quebec
understanding of the problem of variation in regional rates of fInn creation, and,indirectly, to improve the quality of public intervention in this area.
2. VARIATION lN THE REGIONAL RATE OF FIRMCREATION lN QUEBEC
21. Oloice of a Data Base
We have used two alterna te sources of data to represent the rate of firm creationin Quebec: the Dun & Bradstreet (D&B) data bank and the data bank of theCommission des Normes du Travail du Québec (CNT). 80th banks present certainadvantages and disadvantages in terms of methodology.
The D&B group compiles data on companies for which it receives informationrequests as part of its credit information service. The main advantage of this bank isits extensive range: indeed, D&B operates in aU Canadian provinces as well as inseveral other countries, including the United States. This assures a uniform data basefor the different regions we wish to study. It should a1so be mentioned that D&Bexercises strict control over the quality of the information it gathers.
The D&B nonetheless aJso comprises a number of weaknesses (Birch, 1979). 118major disadvantage is its fragmentary nature. Indeed, the company is only interestedin companies for which it receives formaI information requests. This does notnecessarily mean that small flrms are under-represented, since such firms usually posea greater risk fmancially, but rather that certain types of fmns are under-represented,notably those in the service sector. As severaI authors have notOO, the D&B indexes aredesigned more for the conducting of market research than for economic research.Certain conventions used are methodologically unsound. Lastly, it should be mentionedthat not all companies agree to reveal their figures to D&B.
The CNT data bank does not present the same problems. Indeed, this bank isproduced on the basis of information transmitted to it by the Bureau du fichier centraldes entreprises du Québec (BFCE) and based on information it gathers itself. This meansthat aIl incorporated companies are automatically entered into this data base.Partnerships and self-employed individuals are also recorded when they register directIywith the organization. This data bank is consequently much more comprehensive thanthat of the D&B. It is also important to note that the CNT data are available for asignificant number of previous years, while those of the D&B are only available for1991.
AlI of these factors contribute to make the CNT data base appear much moreinteresting at fIrst glance. However, there is a major disadvantage which must be takeninto account: the bank is only available for the Quebec census divisions. As a result,similar data for the rest of Canada will have to be found when the time cornes toextend our study, and chances are that this will not be an easy task. Thus, theadvantages of the Quebec model may be lost at the level of Canada as a whole. It is forthis reason that we decided to test bath data bases concurrently. As we shall see below,
CtJpyri"" . .. .. BC 4

Regional Business Creation and .Push. Factors: The Case of Quebec
only the data obtained from the CNT provided significant results, both in terms of the"push" model and in terms of the correlation coefficients matrix.
For the explanatory variables, we used the data from Statistics Canada's 1986census. With the exception of a few minor areas, the results of the 1991 census had notyet been rendered public at the time our study was conducted.
2.2. Finn Creation Rate: Methodological Definition
The literature proposes various methods for measuring regional variations in thebusiness creation rate. For example, a number of authors have used net annualvariations in the number of companies as an estimator of the phenomenon under study.Others have used the ratio of new companies to the existing stock of companies or tosectorial employment (Schell, 1983). More recent studies, however, tend to reject theseapproaches due to the biases introduced in the ca1culation of estima tors (impact of theregional industrial structure, for example). Currently, the Most common approach is toconsider only the gross number of new companies, weighted by the number ofinhabitants or households (Johannisson, 1991; Garofoli, 1992; Westhead and Moyes,1992). This is the method we have adopted in this study.
The data obtained from the D&B and CNT bases allow us to derme three maintypes of endogenous variables: new fInns created (D&B and CNT), fInns in existencefor one to two years (D&B), and fInns in existence for three to fIve years (D&B).
ln this study, we will test the "push" models using, in tum, four definitions of therate of firm creation:
~. tœI._BEC
Dependent VariablesAnticipated
5

Canada uses certain number of geographical units group thenumerous statistics it publishes. The smallest standardized unit is called an "enumera-tion area" (EA). These areas (150 to 300 households) are then grouped into "censussubdivisions" (CSD), which are in turn grouped into "census divisions" (CD) and into"subprovincial regions" (SR). There also exists a grouping of "census agglomerations"(CA) for urban centres with at least 10,000 inhabitants, and of "metropolitan censusareas" (CMA) for urban centres with at least 100,000 inhabitants.
For methodological reasons, the breakdown into census divisions seems to be thebest alternative for testing the various models we have defmed. Indeed, the number ofunits (99) is sufficient to render the tests statistically significant. We have alsocombined the census metropolitan areas (5) and the census agglomerations (25) inorder to underscore the impact of the urban factor.
For the purposes of this study, we have used the new territorial boundaries definedby Statistics Canada in the 1991 Standard Geographical Classification (SGC). It shouldbe noted that this classification has been substantially modified since the 1986 census,when the federal government decided to adjust its classification to make it conformwith the Quebec government's Municipalité régionale de comté (MRC). The censusdivisions (CD) were thus changed to imita te the boundaries of the various MRC's. Thisreform presented a number of significant constraints at the methodologicallevel: it wasnecessary to establish a table of equivalencies between the old and the new censusdivisions in order to process the chronological series. This was done by means of thecensus subdivisions (CSD) which, in spite of a change in numeration, kept the sameboundaries.
We have grouped all of the CD's (census divisions) into their respective subprovin-cial region (SR) in order to determine the different regional mean rates of firrncreation. The figures in brackets indicate the rank of the regions in each category. Thepopulation of the 1991 census was used to weight the indicators.
Copyrl"" . &ok .. HEC 6

~" lia lŒC 7
Regional Business Creation and -PusJa- Faaon: TM Care of Quebec
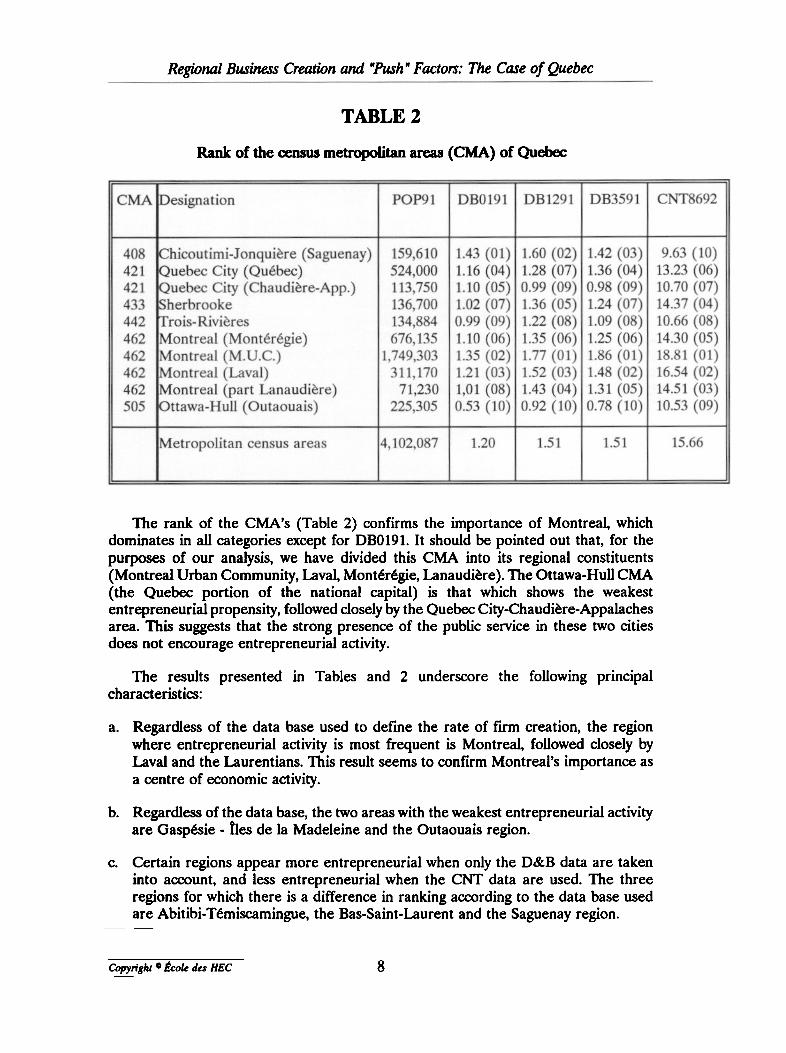
Rank of the census
The rank of the CMA's (Table 2) confirms the importance of Montreal, whichdominates in all categories except for DBO191. It should be pointed out that, for thepurposes of our analysis, we have divided this CMA into its regional constituents(Montreal Urban Community, Laval, Montérégie, Lanaudière). The Ottawa-Hull CMA(the Quebec portion of the national capital) is that which shows the weakestentrepreneurial propensity, followed closely by the Quebec City-Chaudière-Appalachesarea. This suggests that the strong presence of the public service in these two citiesdoes not encourage entrepreneurial activity.
The results presented in Tables and 2 underscore the following principalcharacteristics:
a. RegardIess of the data base used to defme the rate of firm creation, the regionwhere entrepreneurial activity is ffiost frequent is Montreal, followed closely byLaval and the Laurentians. This result seeffiS to confmn Montreal's importance asa centre of economic activity.
b. Regardless of the data base, the two areas with the weakest entrepreneurial activityare Gaspésie - tIes de la Madeleine and the Outaouais region.
c. Certain regions appear more entrepreneurial when only the D&B data are takeninto account, and less entrepreneurial when the CNT data are used. The threeregions for which there is a difference in ranking according to the data base usedare Abitibi-Témiscamingue, the Bas-Saint-Laurent and the Saguenay region.
0Jpyrl"" . &ok - HEC
TABLE 2
metropolitan areas (CMA) of Quebec
8
Regional Business Cmuion and -Pu.rJa- Facton: The Cœe of Quebec
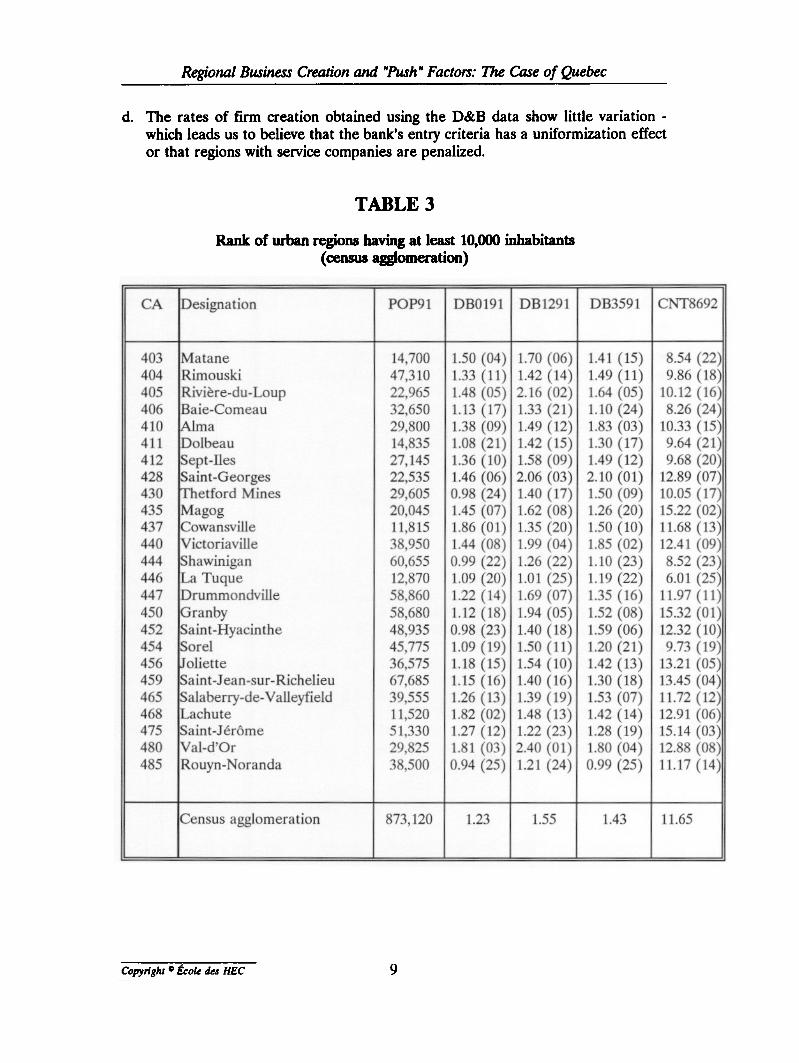
d. The rates of firm creation obtained using the D&B data show little variation -which leads us to believe that the bank's entry criteria has a uniformization effector that regions with service companies are penalized.
Rank of urban
QIpyn"" . teoI. .. HI!C
TABLE 3
regions having at least 10,000 inhabitants(ceDSUS agglomeration)
9

Regional Business Creation and "Push" Factors: The Case of Quebec
H we extend our analysis to examine small urban regions (those with a populationof at least 10,000), we observe that the intensity of entrepreneurial activity variesaccording to the time period considered. For example, the city of Cowansville appearsvery entrepreneurial if the number of surviving fInns less than a year old (DBO191) isconsidered. On the contrary, if we use the number of surviving fInns between one andtwo years old (DB1291), the city no longer seems entrepreneurial. Yet. if we considerthe nurnber of surviving fInns which are three to rIVe years oid (DB3591) or thenurnber of fInns created between 1986 and 1992 (CNT8692), Cowansville appear fairlyentrepreneurial. At the other extrerne, Granby appears very entrepreneurial ifCNT8692 is used and not very entrepreneurial if DBO191 is used.
There are three possible expia nations for this phenomenon: either the data basesdiffer significantly, or rankings based on short periods are very unstable, or there is noregularity in the phenomenon of fIrm creation. Our knowledge of this particular milieuleads us to believe that it is preferable to work with a period of between three and fIveyears: the results obtained based on DB3591 and CNT86-92 coincide more closely withour perception of this phenomenon than DBO191 and DB1291.
ln order to identify the best variable and, especially, to gain an understanding of theelements associated with flnn creation, we focused our attention on one model: the"push" model.
3. The "Push" Model
3.1. Construction of the Model
The unemployment rate constitutes the basic theoretica1 variable of the "push"model (Johannisson, 1991), since it is the statistic which best reflects the problem ofintegration in the labour force. Other variables May also be associated with this modelprovided that they represent the same phenomenon; that is, negative forces which pushindividuals toward entrepreneurship. Researchers who gather their data by means ofquestionnaires obviously do not face the same constraints as those who rely on officiaIstatistica1 indexes. For example, Storey (1982) uncovered the following "push" factorsbased on an interview of 156 new entrepreneurs in the region of Cleveland, in theUnited Kingdom: lay-off, termination of employment, company c1osure, earlyretirement, threat of lay-off, and job dissatisfaction. For their part, Binks and Jennings(1986a) obtained the following factors: lay-off, job insecurity, disagreement withemployer, and company closure. White all of these variables provide a more refmedunderstanding of the "push" phenomenon, it appears very difficult to measure thesevariables statistically.
Copyrl"" . tœII.. 1ŒC 10

Regional Business Cmuion and 8PusJa8 Factors: The Que of Quebec
32. Review of the Literature
Impact of unemployment on the firm aeation rate
For years, authors have been defending the theory that difficu1t economicconditions, particu1arly at the level of employment, encourage the process of firmcreation9. However, the empirical studies which have been conducted are far fromconclusive in this regard. One could even put forward that the large majority of thesestudies have observed the exact opposite relation to that expected; that is, a firmcreation rate that is negatively correlated to the unemployment rate.
Those authors who have established a positive relation between the unemploymentrate and the firm creation rate have generally based their arguments on the interpreta-tion of questionnaires administered to a selected sampling of entrepreneurs. Forexample, Storey (1982) conducted a survey of 156 new entrepreneurs in the region ofCleveland, in the United Kingdom: at the time, 26% of respondents claimed to havebeen unemployed immediately prior to going into business. The results obtained byBinks and Jennings (1986a) from a survey of 100 entrepreneurs in the Nottinghamregion are even more revealing: in this case, 47 respondents claimed that they weremotivated by "push" factors to create their flrm. More recently, Barkham (1992)administered a questionnaire to about 120 new entrepreneurs in three regions of theUnited Kingdom. A high proportion of the respondents declared that they wereIIpushed" toward entrepreneurship (32% in the West Midlands) and that they wereunemployed immediately prior to creating their flrm (27% in the North-East).
The large majority of the econometric studies conducted on this subject do notsupport the findings of the surveys by questionnaire. For example, Pennings (1982)found no positive correlation between the unemployment rate and the rate of new firmcreation for certain selected industrial sectors (plastics, telecommunications, electronics)in a study conducted in 70 urban American centres for the period of 1966-70. Foreman-Peck (1984) arrived at the S8me conclusion for the rate of firm creation in the Englishand Welsh manufacturing sector as a whole between 1918 and 1939.
Rather, several studies have observed a negative relation between the unemploy-ment rate and the rate of fIon creation. This is true of the studies realized by Binksand Jennings (1986b) and Westhead (1989), which covered the years 1971-81 and 1979-83 in the United Kingdom. Recently, Johannisson (1991) studied the pattern of newfirm creation in Sweden for the period 1986-89. He also found a negative (but notsignfficant) relation between these two variables. For their part, Reynolds, Miller andMaki (1991) arrived at a negative and signifIcant correlation between an indicator ofthe unemployment rate (the proportion of the average revenue received from socialsecurity programs) and the regional rate of fIon creation in the United States. Thestudy was conducted using D&B data for the period 1982-86.
9C.f., Schumpeler, 1939; Oxenfeldt, 1943; Dahmcn, 1970; and JohD80D, 1986.
Ct1f11rI"" 81.cok da HEC 11

Regional Business Creation and "Push" Factors: The Case of Quebec
We could conclude by saying that the vast majority of the literature does notsupport the hypothesis of a positive relation between the unemployment rate and thefinn creation rate. On the contrary, the empirical results obtained reveal a negativecorrelation between these two variables. ln order to assess the veritable relationshipbetween them, it would perhaps be necessary to test the impact of a variation inunemployment insurance premiums. It is possible that the generosity of social programsinhibits the natural entrepreneurial propensity of people who have been laid off.
Impact of Migraûon on the Finn Creaûon Rate
ln our opinion, migration variables constitute another group which can beassociated with the "push" model. Indeed, it is weU-known that many immigrants arepushed toward entrepreneurship by problems of integration in their adopted society(Toulouse, 1991). Even though this type of variable has been abundantly tested in theentrepreneurialliterature (Chrisman, Van Deusen and Anyomi, 1992), until now, noone seems to have associated it explicitly with the "push" model. We have taken it uponourselves to do 50 in this study.
Most authors have observed a strong positive correlation between immigration andthe regional rate of firm creation 10, It would seem, then, that the entrepreneurialpropensity of immigrants is indeed stronger than that of the host population, forreasons which are probably attributable to integration difficulties.
Impactof Economie Turbulence on the Finn Creation Rate
A third category of variables appears to be relevant in the context of this model:they are what one author has called variables of "economic turbulence" (Westhead,1989). As the name suggests, these variables attempt to ret1ect the general economicclimate of a region by highlighting the broader trends in terms of company closings andloss of employment. This category lends a certain materiality to the factor of the threatof lay-offs or closings that were observed in the survey by questionnaire (Storey, 1982;Binks and Jennings, 1986a).
Generally, variables such as the number of company closings or job losses resultingfrom such closings are used to represent the concept of economic turbulence. It seemsthat a high rate of loss of employment is positively correlated to the rate of firmcreation, at least in the United Kingdom (Storey and Jones, 1987; Westhead, 1989).
10c.r., $cheU and Davig, 1981; Penninp, 1982; Jobannil8Ol1. 1991; Bull and Winler, 1991; Wuthcad and Moyea, 1992;
ChrilllW1, Van Deuaen and Anyomi, 1992.
Conrl"".~.. sc 12
Tests were performed for the foUowing four dependent variables: DBO191, DB1291,DB3591 and CNT8692. To refine even further, we have added two new dependentvariables: the number of companies registered with the CNT in 1986 per 1,000inhabitants (CNT86) and the number of companies registered with the CNT in 1991,per 1,000 inhabitants (CNT91).
The explanatory variables were selected based on the conceptual framework of the"push" model; that is, negative forces which encourage entrepreneurship. We wantedto represent the three main types of variables which seemed to best conform to thefindings of the literature; that is, the unemployment rate, migra tory Dow, and thenumber of company deregistrations. We th en defined and tested a certain number ofvariants of these variables to determine which were the most significant. As expected,the most significant variables were found in the models with the highest R2.
ln order to highlight the impact of regional variations with respect to the firmcreation rate, we conducted tests for four alternative groups of geographical clusters:(1) the Quebec census divisions (CD); (2) the Quebec census divisions plus the censussubdivisions of the Montrea1 Urban Community (CD + CSD from MUC: thisprocedure permits division of the MUC - Montreal Urban Community - into clusterswhich correspond to the others); (3) the census metropolitan areas plus the Quebeccensus agglomeration (CMA + CA: this procedure makes it possible to obtain allregions having over 10,000 inhabitants); and (4) the Quebec census divisions minus thecensus subdivisions included in the census metropolitan areas or census agglomerations(CD - CA + CMA: this procedure makes it possible to obtain the rural regions). Thetests showed that the best results are obtained using the dependent variables CNT86,CNT91, CNT86-92. For the sake of simplicity, we have presented only these results,since they were the most significant.
0Inri"" . tœII tla HIlC 13

Regional Business Creation and "Push" Facton: The Case of Quebec
TABLE 4
Independent variables used in the empirical tests
percentage of non-Canadian citizens, 1986.number of companies deregistered from the CNT bank in 1986, per1,000 inhabitants.number of companies deregistered from the CNT bank in 1991, per1,000 inhabitants.average annual number of companies deregistered from the CNTbank over the period 1986-92, per 1,000 inhabitants.percentage of migrants 5 years and older relocating within theprovince of Quebec in 1986.variation in the percentage of migrants 5 years and older relocatingwithin the province of Quebec between 1981 and 1986.percentage of migrants 5 years and older coming from otherCanadian provinces in 1986.variation in the percentage of migrants 5 years and older comingfrom other Canadian provinces between 1981 and 1986.percentage of foreign immigrants 5 years and older from outsideCanada in 1986.variation in the percentage of foreign immigrants 5 years and olderfrom outside Canada between 1981 and 1986.unemployment rate in 1986.variation in the unemployment rate between 1981 and 1986.
4.2 Interpretation of the Results
Our results, obtained by using OLS regressions, are presented in the followingtables. Only the most significant results for each of the geographical groupings arediscussed below. Other results are available upon request. Because of the differentnumber of observations and the different dependent variables used in the fourregressions, it is impossible to use the R2 as a criterion to determine which is the bestregression. However, our model performed quite weIl with R2, ranging from 0.36 to0.70, a result generally considered excellent in the context of such a cross-section dataset. Thus, it appears that the "push" model is quite useful in predicting the rate ofbusiness creation across regions within the province of Quebec, whether across thewhole territory or in urban and rural areas.
The role of unemployment
A look at the series of regressions reveals that the unemployment rate prevailingin 1986 is negatively correlated to the rate of fIrm creation in the different regions ofQuebec over the 1986-92 period. The coefficient of unemployment is negative andstatistically signfficant in all regressions, except for rural regions, where it is insignfficant
Copyrighl . École des HEC 14
. CITNC86:
. CNT86DH:
. CNT91DH:
. CNT8692DH:
. MIGQ86:
. MIGQ8186V:
. MIGC86:
. MIGC8186V:
. MIGE86:
. MIGE8186V:
. TCH86:
. TCH8186V:

Regional Business Creation and .Push. Factors: The Case of Quebec
but still negative. This suggests that unemployment provides a negative incentive tocrea te businesses. ln the context of an analysis using data at an aggregate level, thisresult confirms the findings of other authors Il.
This result is hardly surprising considering that the level of unemployment in agiven area is more likely to retlect the state of the demand in that area than theincentive of unemployed individuals to crea te a business. There is a strong argumentto support our belief that this is indeed the case: Had we compared unemployedworkers' willingness to crea te a business across different regions of Quebec, we mayhave found the expected result. However, because the pool of potential entrepreneursis dominated by individuals who do have a steady job, and because the incentives ofthese workers to become self-employed should normally be negatively related to thelevel of unemployementl2, the overall effect of unemployement on the rate ofentrepreneurship is very likely to be negative. ln other words, the negative demand-sideeffect of unemployment on entrepreneurship may domina te and thus hide its positivesupply-side effect, preventing us from observing the phenomenon described by otherresearchers in the fields of entrepreneurship and economicsl3.
Il 1be potenlial endopoeity ofunemploym8nt i. not an i- bere, _e the uoemployment fi", are for 1986, wbereuthe dependant variable meaaure. Ihc nte of buaioe.. creation for the 1986-1992 period.
12 Thi. i.1nIe becauae hiF unemploymenl ai,..I. a poor"le ofthc dcmand (buaine_. are mon liltely 10 faillhan uaua1).
Thorefore, hi'" uncmployment re,iona may DOt be optimal .rea. in whi1:h to create a new bu.ine... Seconclly, ,iven lhatlabour market conditiona are more difficult for the unemployed when unemployment i. widclpread, employed workenwouJd nonnally heaitalc 10 leave thcir current job in ordcr 10 becorne aelf-cmployed.
13The - JCnerou. the unemploycmcnl benetill and odIer aocial plOJI'8maaimcd al unemployod wortcn, the - likelythi. will be the cale. Sec JohannillOD (1991). SiDCe theae proaramaare relatively aenerou. iD Quebec, one miJbt expcctthe incelllÎve of unemployod wortcn to lia" a buùne.. to be rel.tively .man. Thi. wouJd allO help to explain the relativedominance of the demand-lide eft'ect in the dall. Anotbcr explanation may limply be that unemploymem ia inhibnm,buIÎne8 creaOOa by cauam, p8)'cboIoJicalltre8a. fUl8DCW inaecurity, or by reducing the bonowina capabiliûe8 of
potential entrepreneun.
0Ipyri"" . tœI. .. HEC 15

Regional Business Creation and .Push. Factors: The Case of Quebec
Significant at the 90% confidenceSignificant at the 95% confidenceSignificant at the 99% confidence
.*****
However, in other regressions we included variations in the rate of unemploymentas weIl as the rate of unemployment itself. These regressions are presented in Table 6.This was done so that the level of unemployement would capture the state of thedemand in each region, and 50 that the variations in the level of unemployment wouldcapture the supply-side response of newly unemployed workers to unemployment.
O1pyrlBIII . teole da BEC
TABLE 5
Regression analysis for CNI'8692EH / OLSGeographical groupings 1, fi, ID and IV
level.level.level.
16

Regional Business Creation and "Push" Factors: The Case of Quebec
TABLE 6
Regression analysis for CNT8692EH / Ol.SGeographica1 groupings fi and ID induding employment variations
.
..
...
Significant at the 90% confidence level.Significant at the 95% confidence level.Significant at the 99% confidence level.
The results confmn our expectations. The coefficient of unemployment is stillnegative and significant in all four regressions, whereas the coefficient of the variationsin unemployment is always positive and significant when the migration variables areexcluded trom the regressions. The fact that the results do not seem very robust to theinclusion of the migration variables may be due to the possibility that worker mobilityand unemployment are intrinsically linked phenomena, causing coefficient estima tes tobe relatively unstable. Nonetheless, overaU these results suggest that, as expected by thetheory, there is an entrepreneurial positive supply-side response of workers tounemployment.
QJpyrl"" . &ok cIu HEC 17
RegiontU BusiMss Creation and -PusJa- FadOn: The Case of Qwbec
Because there are many reasons to believe that the mobility of workers is stronglylinked to variations in unemployment, we condueted an experiment in the hope ofcontrolling for this effect. The results of this explanatory regression method arepresented in Table 7. They should be interpreted with caution, however, since we havenot yet performed a rigorous statistical analysis to ensure the consistency of this newestimator. The estimator is obtained through a two-step procedure: the flfSt stepconsists of a series of regressions purging eaeh explanatory variable of the influence ofthe other explanatory variables; the second step reduces to an Ordinary Least Squareregression of the dependent variable on the "purificated" variables; a constant is alsoineluded in the regression. ln this specifie case of the third regression presented inTable 7, we performed 5 auxiliary regressions (not presented here) in whieh eaehvariable was first projected on aIl other variables of the original model (ineluding aconstant). We then retreived the residuals from these auxiliary regressions and fmallyused these residuals (interpreted as information purged of any influence from the otherexplanatory variables) and a constant as regressors in the fmal regression presented inTable 7. The results are remarkably stable and are comparable to the results presentedin the previous tables. However, they are now aIl significant at the 99% confidencelevel.
As expected, the effect of unemployment, which we interpret as a measure of thestate of the demand in each geographical area, is still negative. Moreover, in thisregression, even when the migration variables are included, the coefficient associatedwith the variations in unemployment is positive and significant. This suggests that weare able to capture the phenomenon which we set out to identify.
ln summary, the effect of unemployment on entrepreneurship is complex. On theone hand, a high level of unemployment appears to signal that business opportunitiesare scarce. On the other hand, once we control for the level of unemployment, we findthat the higher the number of workers joining the pool of unemployed individuals, thehigher the incentive to start a business.
~.",,1lEC 18
RegioMJ Businas Cmuion and 8Push8 Faaon: The Cœe of Queb«
Exploratory model: Regression analysis for CNf8692EH 1 OLSGeographical grouping fi
Significant at the 90% confidence level.Significant at the 95% confidence level.Significant at the 99% confidence level.
.
..
...
Finally, note that (Table 5) the coefficient of the unemployment variable in theurban regression is much larger than in the rural regression, suggesting that thenegative impact of unemployment in urban areas is much more important than in ruralareas. This may be attributable to the higher inter- regional proximity in urban areas,which makes it easier for an entrepreneur from a depressed region (with highunemployment) to locate his business in a booming region (with low unemployment).Through a case study of a few regions, further research should focus on understandingthe different dynamics between urban and rural areas.
The role of mobility
The results also show that the composition of the population in the different regionsis relatively important in explaining the distribution of the rate of entrepreneurshipacross the various regions. The three variables MIGQUE86, MIGCAN86 and
Cof11rlfltl . &011- HEC
TABLE 7
19

kgional Business Creation and .PusJa' Facton: The ~ of Quebec
MIGEXT86 allow us to divide immigration in each region into three components: localimmigration (migrants from other parts of Quebec). national immigration (migrantsfrom other provinces of Canada) and international immigration (migrants from othercountries ).
The results from Tables 5, 6 and 7 indicate that the proportion of foreignimmigrants (MIGEXT86) is positively correlated with the rate of business creation inregressions, confmning the vitality of immigrant entrepreneurship often hypothesizedin the literature; the results are strongly significant from a statistica1 point of view.Similarly, the proportion of the population in each region which is made up ofindividua1s coming from another area within the province of Quebec (MIGQUE86) a1sohas a positive impact on the rate of regional business creation. The coefficient of thevariable is a1ways positive and statistica1ly different from zero in ail four regressions.This shows the importance of inter-regional mobility in the process of firm creation.The relationship seems strongest in rural areas, which suggests the potential ofindividual mobility to foster regional economic development. Because the regressionscontrol for the level of unemployment and because we used data on the compositionof the population at the start of the period (i.e., in 1986), this result cannot beinterpreted as a spurious correlation reflecting only the possibility that migrants wouldbe attracted towards more entrepreneurial regions. The correct interpretation seemsto be that, while migrants are probably attracted by prosperity, they a1so contribute toprosperity by eventua1ly creating a firm in the region into which they have moved.
On the other hand, the proportion of immigrants coming to the province of Quebecfrom other provinces in Canada (MIGCAN86) has a negative impact on the rate ofregional entrepreneurship. However, the coefficient of this variable is not statisticallysignificant in the rural equation model. It therefore seems that, overall, Canadiansimmigrating from other provinces do not immigra te with the perspective of creating abusiness in the province of Quebec. It is surprising, however, that the coefficient of thisvariable is negative and statisticaUy significant in most equations. One may think thatmost Canadians moving to Quebec from other provinces do not corne to create abusiness but rather to occupy a corporate job (for example, a marketing vice-presidentat the Royal Bank in Toronto may be relocated in Montreal to become Quebec'sregional marketing director). To explain the negative correlation between this variableand the rate of business creation, we conjecture that such people may be more likelyto !ive in urban residential areas (suburbs of large cities), where businesses are lessoften located. Yet, in our experimental regression presented in Table 7, the coefficientassociated with inter-provincial mobility is positive and highly significant.
Finally, it is worth mentioning (although these results are not reported in the tables)that we did not detect any statistically significant impact of firm deregistrations(whether measured by CNT86DH, CNT91DH or CNT8692DH) on the rate of businesscreation for any of the four geographical groupings used in this study. We had hopedthat a high rate of ftnl1 failure would have signaUed a high rate of ftrm creation. Wefailed to capture the effect of turbulence on entrepreneurial activities. This may be dueto the fact that deregistration is a poor proxy to measure economic turbulence. Let usnote, however, that since the series was calculated from 1981 and 1986 ftgures, it mightbe interesting to test tOO hypothesis again when the more recent 1991 census databecome available; they are expected next summer.
Copyrl"" . &ole da HEC 20

Regional Business Creation and -Push- Facton: T'he Case ofQueb«
S. Conclusion
Our study clearly shows that the fundamental thesis of the "push" mode!, namelythat unemployment has a positive impact on entrepreneurial incentives, is empiricallyrejected in the province of Quebec when we fail to include variations in unemploymentin the regressions. As several other studies have aIready shown 14, we found thatunemployment discourages business creation. The results hold for the period covering1986-92 for most geographica1 groupings used in the analysis; one notable exception isrural areas, where unemployment does not seem to have an impact on businesscreation.
However, we argued that within the context of an empirica1 study using aggregatecross-section data, it is possible that unemployment captures the state of the demandin each area better than the supply-side response of unemployed individuals setting upbusinesses that they would not have set up otherwise (i.e., had they been securelyemployed in the first place). Indeed, most, if not aU. studies corroborating suchconclusions are regional studies, as in this paper, that use cross-section aggregate datarather than individual data to examine this hypothesis.
We then included both the unemployment rate and variations in the unemploymentrate as explanatory variables in our regressions. By using unemployment as a proxy forthe state of the demand in the different geographical units, the variations inunemployment are more likely to capture the higher incentive of unemployedindividuals to create businesses. Our results suggest that the inclusion of such variableshelps to circumvent the difficulties encountered by several authors in identifying theexpected effect of unemployment on entrepreneurship in empirical studies usingaggregate cross-section data.
The other significant result of this paper is the effect of the three types ofimmigration on the rate of entrepreneurship across regions. We found that both intra-provincial and international migration had a positive impact on business creation; theopposite result was found for inter-provincial migration (except in our experimentalregression). Thus, immigration appears to be an excellent predictor of entrepreneurialactivity. This result is consistent with that of other studies on immigrant entrepreneurs-hip.
Our results have important implications for public policy, in particular policiesregarding regional development and immigration. For instance, our study reveals thatimmigration is beneficial to business creation. If we believe, as many authors haveshown15, that new firms are responsible for the creation of the majority of jobs, thenthe adoption of more h"beral immigration policies would seem appropriate in order toreduce unemployment. This also appears to be an interesting way to promote regionaldevelopment, especially in regions where unemployment is high. Seen in this
Binb and Jenninp, 1986b; JoIwmia8on, 1991; Reynoldl, Miller and Maki, 1991.
Regional Business Creation and .Push. Factors: The Case of Quebec
perspective, aggressive programs targeting immigrant-entrepreneurs, such as those ofCanada, Australia and New-Zealand, appear particularly useful.
A seemingly paradoxica1 polk'Y, that is nonetheless in line with orthodox free-marketeconomics, is suggested by our results. ln light of our fmdings concerning the impactof unemployment and mobility, it appears that regional development is not bestachieved through the direct creation of jobs, but rather through the promotion ofworkers' mobility or through the removal of barriers to workers' mobility. Such a policyMay appear paradoxica1 to some, given that it could lead to the exodus of workers fromcertain regions where the government is investing to foster development and createjobs. However, the government's costly effort is more likely to reduce workers' mobilityand be detrimental to the development of other regions where the workers would haverelocated at no cost to taxpayers. ln the end, such a market-based regional developmentstrategy would lead to a greater variance in income between the different regions, butprobably to a higher average income.
0Ir1rl"" . .. .. HIlC 22

RegionalIJusinas C1Wltion and 8PusJa8 Facton: The Case ofQwb«
Bibliography
Aldrich, H.; Rosen, B.; Woodward, W. (1987). "The Impact of Social Networks onBusiness Foundation and Profit: A Longitudinal Study". Fronders of Entrepreneur-ship Research: Babson CoUege Press.
Aydalot, P. (1986). "The Location of New Finn Creation-. ln D. Keeble and E. Wever(eds). New Firms and Regional Development in Europe. Beckenham: Croom Helm.
Banks, M.C. (1991). "Location Decisions of Rural New Ventures-. Frontiers of Entrepre-neurship Re.search: Babson College Press; pp. 363-377.
Bannock, G. Dorant A.London: Schell.
Barkham, R. (1992). "Regional Variations in Entrepreneurship: Some Evidence fromthe United Kingdom". Entrepreneurship and Regional Development: vol. 4, n° 3,pp. 215-244.
Beesley, M.E., Hamilton, R.T. (1984). .Small Firms' Seedbed and the Concept ofTurbulence". Journal of Industrial Economies: vol. 23, pp. 217-231.
Berry, BJ.L. (1973). Growth Centers in the American Urban System. Cambridge, MA:Ballinger.
Binks, M. Jennings, A. (1986a). "New Firms as a Source of Industrial Regeneration".ln Scott, M. and al. (eds.): SmaU Finns Growth and Development. Aldershot: Gower,pp.3-11.
Binks, M. Jennings, A. (1986b). 1
ln Curran, J. and al. (eds.):pp. 19-38.
Birch, D. (1979). The Job Generation Process. Cambridge. MA: MIT Program OnNeighbourhood and Regional Change.
Birch. D. (1987). Job Creation in America. New York: The Free Press.
Bull, 1.; Win ter, F. (1991). "Community Differences in Business Births and Growths".JoumaI of Business Venturing, vol. 6, pp. 29-43.
Butler, J.E.; Hansen, G.S. (1991). "Network Evolution, Entrepreneurial Success, andRegional Development". Entrepreneurship and Regional Development, vol. 3, n° 1,pp. 1-16.
Conrl"" . &ok tIn SC
(1978). SmaU Finns in Cilies: A Review of Recent Research.
"Small Firms as a Source of Economie Rejuvenation".: The Survival of the Small Finn. Aldershot: Gower,
23

Regional Business Creation and -PusJa- Foaon: The Que 01 Quebec
Chrisman, J.; Van Deusen, c.; Anyomi, S. (1992). "Population Growth and RegionalEconomy: An Empirical Analysis of Business Formation and Job Generation in theRetail Sector". Entrepreneurship and Regional Development: vol. 4, n° 4, pp. 339-355.
Cooper, A.c. (1973). "Technical Entrepreneurship: What Do We Know"" MDManagement: vol. 3, pp. 59-64.
Cross, M. (1981). New Finn Formation and Regional Development. Farnborough: GowerPublishing Co.
Dahmen, E. (1970). EntrepreneuriaJ Activity and the Development of Sweclish Indwtry,1919-1939. Homewood, D.: Richard Irwin.
Florida, R.L., Kenney, M. (1988). "Venture Capital, High Technology, and RegionalDevelopment". Regional Studies, vol. 22, pp. 33-48.
Foreman-Peck, J. (1984). New Firm Formation and Industrial Change in the InterwarEconomy. University of Newcastle-upon-Tyne, Discussion Paper no. 80.
Fothergill, S., Gudgin, G. (1982). Unequal Growth: Urban and Regional EmploymentChange in the U.K, London: Heinemann.
Garofoli, G. (1992). "New Firm Formation and Local Development: The ItalianExperience". Entrepreneurship and Regional Development: vol. 4, n° 2, pp. 101-125.
Gibbs, J.P., Poston, D.L (1975). "1be Division of Labor: Conceptualization and RelatedMeasures". Social Forces: voL 53, pp. 468-476.
Gould, A., Keeble, D. (1985). "New Firms and Rural Industrialization in East Anglia".ln Storey DJ. (Eds). Small Finns in Regional Economie Development. Cambridge:Cambridge University Press, pp. 43-71.
Gudgin, G., Hart, M., Fagg, J., D'Arey, E., Keegan, R. (1989). Job Generation andManufacturing Industry 1973-86, A Comparison of Northem lre/and with the Republicof lre/and and the English Midlands. Northem Ireland Economie Researeh Center.
Gudgin, G. (1978). Industria/ Location Processes and Regional Emp/oyment Growth.Farnborough: Saxon House.
Gudgin. G.. Brunskill, J.. Fothergill, S. (1979). New Manufacturlng Firms in RegionalEmployment Growth. Center for Environmental Studies, n° 39.
Hamilton. R.T. (1989). "Unemployment and Business Formation Rates: ReconcilingTime-Series and Cross-Section Evidence". Environment and Planning A: vol. 21.pp. 249-255.
Hoover, E.M., Vernon, R (1959). Anatomy of a Metropolis. Cambridge, MA.: HarvardUniversity Press.
01pyrl"" . &ok da HEC 24

RegionQl Business Creation and .Push. Factors: The Case of Quebec
Johnson, P. (1986). New Finns: An Economie Perspective. London: Allen & Unwin.
Johnson, P.S., Cathcart, D.G. (1979). -New Manufacturing Firms and RegionalDevelopment: Seme Evidence from the Northern Region". Regional Studies: vol. 13,pp. 269-280.
Johannisson, B. (1990). -Community Entrepreneurship: Cases and Conceptualization-.Entrepreneurship and Regional Development: vol. 2, pp. 71-88.
Johannisson, B. (1991). Regional Patterns of New-Firm Formation: The Case of Sweden.Vaxjo University, Sweden: Center for Small Business Development.
Kirchhoff, B., Phillips, B. (1988). "The Effect of Finn Formation and Growth on JobCreation in the United States-, Journal of Business Venturing, vol. 3, pp. 261-272.
Kirchhoff, B., Phillips, B. (1991). -Are Small Firms Still Creating New Jobs-. Frontiersof Entrepreneurship Research: Babson College Press; pp. 335-349.
Leone, RA., Struyk, R. (1976), "The Incubator Hypothesis: Evidence from FiveSmsa's-. Urban Studies: voL 13, pp. 325-332.
Uoyd, P.E., Mason, C.M. (1985). -Spatial Variation in New Firm Formation in theUnited Kingdom: Comparative Evidence from Merseyside, Greater Manchester andSouth Hampshire-. ln Storey DJ. (Eds), Small Firms in Regional EconomieDevelopment. Cambridge: Cambridge University Press, pp, 72-100,
Malecki, E. (1990). -New Finn Formation in the USA: Corporate Structure, VentureCapital, and Local Environment-, Entrepreneurship and Regional Development:Vol. 2, n° 3, pp. 247-266.
Marlow, S.; Storey, D. (1992). -New Finn Foundation and Unemployment: A Note on- - - - - - - .. - . -. - . - - - - - - --Research Method". International Small Business Journal, vol. 10, n° 3, pp. 62-67.
Mason, C.M. (1982). New Manufacturîng Finns in South Hampshire: Survey Results.Department of Geography, University of Southampton, n° 13.
lssati, G. Fumagalli, A. (1990). "Survival, Entrepreneurship, Growth:Relationship? The Milanese Area's Case". ln proceedings of Rent-W Res.Entrepreneurship 4th Workshop, Cologne, Germany.
Mussati,
O'Farrell, P.N., Crouchley, R. (1985). "An Industrial and Spatial Analysis of New FinnFormation in Ireland". ln Storey D.J. (Eds). Small Finm in Regional EconomieDevelopment. Cambridge: Cambridge University Press, pp. 101-134.
Oxenfeldt, A.R. (1943). New Firms and Free Enlerprise.on Public Affairs.
Pennings, J.M. (1982). -Organizational Birth Frequencies: An Empirica1 Investigation-.Administrative Science Quarterly: vol. 27, n° 1, pp. 120-144.
0Jnrl"" 81.cok .. HEC
WhichResearch in
Washington: American Council
25
Regional Business Creation and 8PusJ88 Factors: The Case of Quebec
Québec, Ministère des Communautés culturelles et de l'immigration. Direction généraledes politiques et des programmes (1990). Au Québec pour batir ensemble: un énoncéde politique en matière d'immigration et d'intégration. Montréal: la Direction.
Reynolds, P.; Miller, B; Maki, W. (1991). "Regional Characteristics Affecting New FirmBirths". Frontiers of Entrepreneurship Research: Babson CoUege Press, pp. 378-390.
Riggs, F.W. (1964). Administration in Developping Countries. Boston, MA: HoughonMifflon Co..
Schell, D.W. (1983). "Entrepreneurial Activity: A Comparaison of Three NorthCarolina Communities". Fronders of Entrepreneurship Research: Babson CollegePress, pp. 495-507.
ScheU, D.W., Davig, W. (1981). "lbe Community Infrastructure of Entrepreneurship:A Sociopolitica1 Analysis-. Frontiers in Entrepreneurship Research: Babson CollegePress, pp. 563-590.
Schumpeter, J.A. (1939). Business Cycles. New York: McGraw Hill, voL 1, p. 94.
Shapiro, A.; Soko~ L. (1982). "The Social Dimension of Entrepreneurship.. ln Kent,CA. & al. (eds). Encyclopedia of Entrepreneurship. Englewood Cliffs, NJ.: Prentice-Hall, pp. 72-90.
Statistiques Canada, Division des normes (1992). Classification géographique type: CGT1991. Ottawa: la division.
Storey, DJ. (1982). Entrepreneurship and the New Finn. London: Croom HeIm.
Storey, DJ. (1985a). "Manufacturing Employment Change in Northern England 1965-78: The Role of Small Business". ln Storey DJ. (Eds). Small Firms in RegionalEconomie Development. Cambridge: Cambridge University Press, pp. 43-71.
Storey, D.J. (1985b). "The Implications for Policy". ln Storey D.J. (Eds). smaU Firmsin Regional Economie Development. Cambridge: Cambridge University Press,pp. 219-229.
Storey, DJ.; Jones, A.M. (1987). "New Firm Formation - A Labour Market Approachto Industrial Entry". Scottish Joumal of Political Economy, vol. 34, pp. 37-51.
Sweeney, G.P. (1987). Innovation, Entrepreneurs and Regional Development.Frances Pinter.
Thompson, W. (1968). "InternaI and External factors in the Development of UrbanEconomies". ln Perloff, H.S. and Wingo L (eds). Issues in Urban Economies.Washington: John Hopkins Press.
Conrf"" . tcok .. IŒC
London:
26

Regional Business Creation and "Push" Factors: The OIU of Quebec
Toulouse, J.M. (1991). "Les immigrants et la création d'entreprises: test d'un modèlepréliminaire auprès des chinois et des haïtiens". Hull: Actes du colloque national surla régionalisation de l'immigration au Québec, November 22, 1991.
Walton, J. (1977). Elites and Economie Development. Austin, TE: Institute of LatinAmerican Studies, The University of Texas Press.
Westhead, P. (1989). "A Spatial Analysis of New Manufacturing Firm Formation inWales, 1979-1983". International Small Business Journal, vol. 7, pp. 44-68.
Westhead, P., Moyes, T. (1992). "Reflections on Thatcher's Britain: Evidence from NewProduction Firm Registration 1980-88". Entrepreneurship and Regional Development:vol. 4, n° 1, pp. 21-56.
0JnriIItI8 teoIe tIu BEC 27