regional assessment of weather and freight impacts krechmer... · » lost commerce due to snow...
TRANSCRIPT
DTFH61-12-D-00048-T-13005
FHWA Road Weather Program Stakeholder Meeting
Salt Lake City, Utah
Presented by:
Cambridge Systematics
August 13, 2014

Project Background
2
Background Commercial vehicles main mode of freight transportation
» $500 billion freight sector
» 70% of total value and 60% of weight moves by truck
» Estimates that adverse weather is responsible for 12% to 25% of all delay
» Trucking delays due to weather = $3.1 billion/yr for the 50 largest cities
» Lost commerce due to snow closures = $10 billion/day
Other economic impacts of adverse weather
» More than $2 billion/yr is spent on snow and ice control by State DOTs
» Weather accounts for 25% of non-recurring congestion
3

Project Background 1st Phase Study 2012
» National estimate of delay $8-$9 billion annually
» Developed model primarily on state-by-state basis
» Key data sources – used 3 year period 2008 to 2010
• ATRI truck travel speed data (now in FHWA NPMRDS dataset)
• NOAA weather data – Global Summary of the Day (GSOD)
• Truck O-D data developed by project team from Global Insight Data
» Recommendations
• Finer detail needed on truck movements and weather events
• Conduct test scenarios in smaller areas/regions
4

Weather Data – GSOD
These stations were selected because they overlaid the truck speed data very well
5

Second Phase
6
Key Analysis Questions
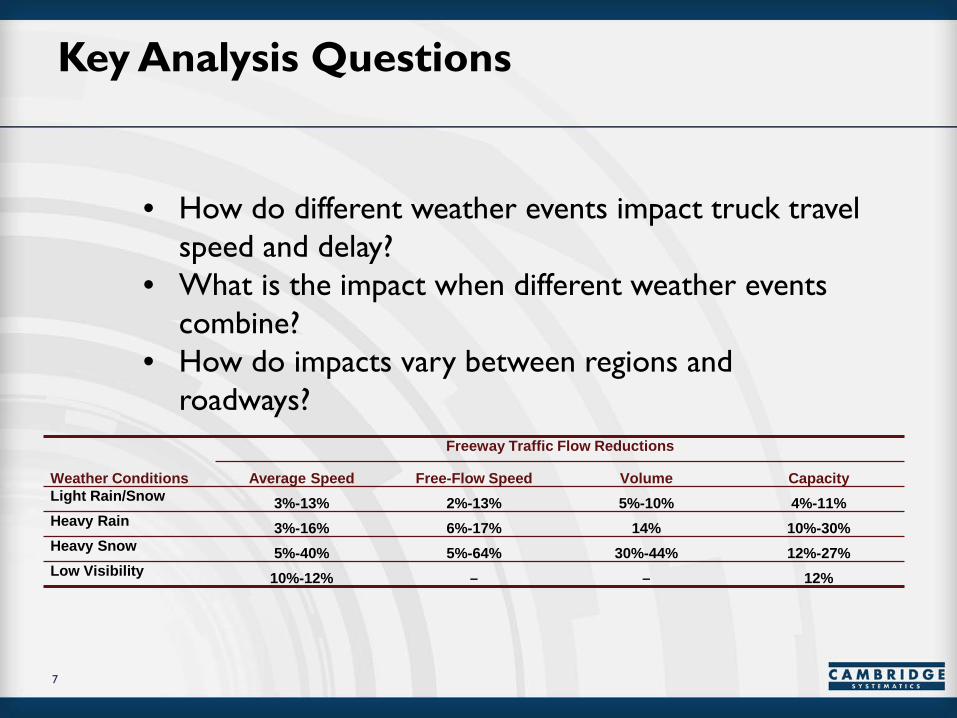
Weather Conditions
Freeway Traffic Flow Reductions
Average Speed Free-Flow Speed Volume Capacity Light Rain/ Snow 3%-13% 2%-13% 5%-10% 4%-11% Heavy Rain 3%-16% 6%-17% 14% 10%-30% Heavy Snow 5%-40% 5%-64% 30%-44% 12%-27% Low Visibility 10%-12% – – 12%
7
• How do different weather events impact truck travel speed and delay?
• What is the impact when different weather events combine?
• How do impacts vary between regions and roadways?
Scope of Work Areas of improvement to previous methodology
» Truck speed data on additional roads beyond NHS
» More detailed freight O/D and trip length data
» Distinguish between impacts of “regular” weather events and “major” events
» Comparison of truck speed data to other highway speed data (Advanced Traffic Management Systems)
» Greater detail in weather data • Surface condition
• Increased temporal detail (hourly at minimum)
• Increased geographic detail (closer to truck routes)
8
Scope of Work Selection of case study locations
» Key trucking corridors
» Major access route to ports or key industrial/warehouse areas
» Different types of terrain
» Variety of climatic conditions
» Vulnerability to major weather events
» Detailed reliable roadway performance data available
» Data available to advance knowledge of freight OD’s, load content and supply chain
» Availability of detailed weather data
9

Scope of Work
10

Scope of Work » Sample of relationships to be derived from weather and
roadway data
11
Percentage of Capacity In Use <0.21 0.21-0.40
0.41-0.70
0.71-0.79
0.80-0.95 >0.95
Standard 100% 100% 100% 100% 100% 100% Fog 73% 70% 67% 63% 60% 56% High Wind 93% 92% 91% 89% 88% 87% Very High Wind 87% 86% 85% 83% 82% 80% High Wind and Light Snow 84% 81% 78% 76% 72% 69% High Wind and Moderate Snow 75% 70% 65% 59% 53% 47% Very High Wind and Moderate Snow
69% 64% 59% 53% 47% 40%

Scope of Work Key Issues
» Comparability of different regions
• Driving habits
• Different types of freight content and movement patterns
» Use of gridded weather data
• Potentially provides more detail but processing can be resource intensive
• Assess tradeoffs
» Adequate sample to isolate weather events (account for incidents, construction, etc.)
12
Schedule
13
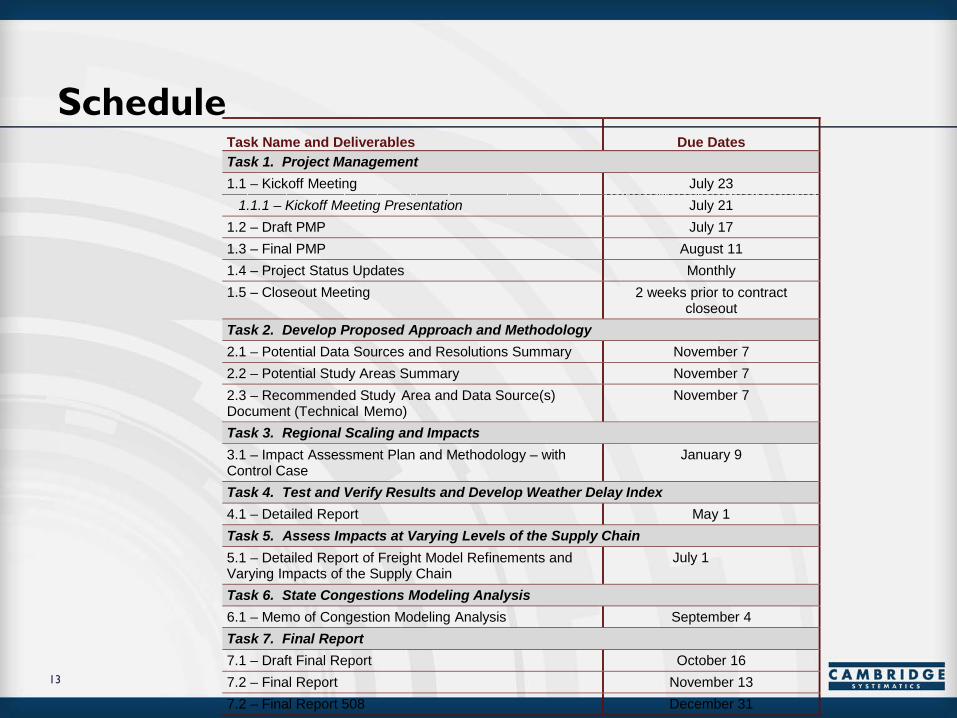
Task Name and Deliverables Due Dates Task 1. Project Management 1.1 – Kickoff Meeting July 23 1.1.1 – Kickoff Meeting Presentation July 21 1.2 – Draft PMP July 17 1.3 – Final PMP August 11 1.4 – Project Status Updates Monthly 1.5 – Closeout Meeting 2 weeks prior to contract
closeout Task 2. Develop Proposed Approach and Methodology 2.1 – Potential Data Sources and Resolutions Summary November 7 2.2 – Potential Study Areas Summary November 7 2.3 – Recommended Study Area and Data Source(s) Document (Technical Memo)
November 7
Task 3. Regional Scaling and Impacts 3.1 – Impact Assessment Plan and Methodology – with Control Case
January 9
Task 4. Test and Verify Results and Develop Weather Delay Index 4.1 – Detailed Report May 1 Task 5. Assess Impacts at Varying Levels of the Supply Chain 5.1 – Detailed Report of Freight Model Refinements and Varying Impacts of the Supply Chain
July 1
Task 6. State Congestions Modeling Analysis 6.1 – Memo of Congestion Modeling Analysis September 4 Task 7. Final Report 7.1 – Draft Final Report October 16 7.2 – Final Report November 13 7.2 – Final Report 508 December 31
Help? Interested in having your area as a case study?
Data on surface weather conditions?
» Variety of conditions?
» Precipitation type?
» Precipitation intensity?
» High temporal frequency?
Weather data and traffic data integrated through ATMS?
Major generator of truck traffic?
14
Contact Paul Pisano, FHWA Contract Manager
» 202-366-1301
Dan Krechmer, Consultant Project Manager
» 617-234-0492
15

Questions/Discussion
16