regional analysis for the caribbean by emma … · iv acknowledgments thanks are due to my thesis...
TRANSCRIPT

GENETIC ANALYSIS, MOVEMENT, AND NESTING PATTERNS OF THE GREEN
SEA TURTLE (CHELONIA MYDAS) IN ST. CROIX, VIRGIN ISLANDS (USA): A
REGIONAL ANALYSIS FOR THE CARIBBEAN
by
EMMA ANN SCHULTZ
A Thesis Submitted to the Graduate Faculty
in Partial Fulfillment of the Requirements
for the Degree of
Master of Science in Marine Sciences
Savannah State University
April 2016


iii
DEDICATION
This thesis is dedicated to my parents, Terry and Julie Schultz, who have done so
much for me over the years and who continue to motivate and support me every day.
Without their help I would be nowhere near the person I am today. Thank you for
everything mom and dad!

iv
ACKNOWLEDGMENTS
Thanks are due to my thesis committee members Dr. Dionne Hoskins, my
advisor; Dr. Mary Carla Curran; and Kemit-Amon Lewis. Dr. Peter Dutton and Erin
LaCasella are thanked for their work on the genetic analyses. Valuable knowledge was
gained from Mike Ardent, Marco García-Cruz, Dr. Kristen Hart, Erin Levesque, Dr. Erin
Seney, Dr. Brian Shamblin, and Dr. Kelly Stewart to help with the success of this project.
Amanda Burdick, Richard Gideon, Ashley Graham, Alexandra Gulick, Michael
Patton, Clayton Pollock, Jennifer Richards, Mark Richards, Nick Sarracco, and Victor
Sprowls are all acknowledged for their assistance on the beach.
A special thank you to Cameron Brinton, Dr. Tara Cox, and Dr. Christopher Hintz
for assistance with software. Chelsea Parrish, Coral Thompson, and Jessica Thompson
are thanked for their constant motivation during our weekly writing sessions.
This material is based upon work supported by the National Oceanic and
Atmospheric Administration, Educational Partnership Program, U.S. Department of
Commerce, under Agreement No. #NA11SEC481002. This research is done in
collaboration with The Nature Conservancy under the US Virgin Islands Division of Fish
and Wildlife Endangered Species Research Permit STX034-14.

v
ABSTRACT
The green sea turtle Chelonia mydas is listed as endangered by the IUCN Red List
of 2004. The Endangered Species Act now classifies the green turtle species into 11
distinct population segments (DPSs) with most segments being classified as threatened
and only three (Mediterranean, Central West Pacific, and Central South Pacific) being
listed as endangered. More information needs to be obtained about the foraging, nesting,
and movement behaviors of the different green turtle rookeries worldwide to implement
the best management practices. The main purpose of this study was to track internesting
and post-nesting movements, categorize the benthic habitat types utilized during these
periods, identify the dominant genetic haplotype, and provide summary statistics of
female green sea turtles nesting on the East End beaches, including the beaches within
Jack, Isaac, and East End Bays, of St. Croix, US Virgin Islands.
Seven Wildlife Computers™
SPOT-352A platform transmitter terminals (PTTs)
were attached to female green sea turtles on the East End beaches of St. Croix in August
and October 2015. The females were tracked using the Satellite Tracking and Analysis
Tool (STAT) on seaturtle.org and movement patterns were mapped. Kernel density
estimation (KDE) was utilized to calculate 50% core use and 95% activity areas during
their internesting and post-nesting periods. Minimum convex polygons (MCPs) were
created when KDE could not be completed. Habitat utilization was identified in the core
use areas and MCPs. Tissue biopsies were collected from 60 nesting female green turtles
on the East End beaches from 2012-2015. The ~820-bp mtDNA control region was
sequenced to identify the haplotypes present within this rookery. Summary statistics were
calculated for nesting data collected on the East End beaches from 2003-2015 to identify

vi
some of the life history characteristics of the green turtle rookery on the East End
beaches. Recommendations were provided for better ways to conduct long-term nesting
surveys with uniformity, so that population estimation models can be applied.
Female green turtles were tracked between 16-241 d (mean=160.9±10.6) for a
total of 1,126 PTT days transmitted before analyses were conducted. Kernel density
estimation and a MCP could not be created when less than ten detections of the highest
location class were received. Three females were residents of the waters around St. Croix,
remaining within the same areas during both their internesting and post-nesting periods.
Three females were classified as migrants as two transitioned to the waters near St. Kitts
and Nevis during their post-nesting periods and one moved to the waters to the northwest
of Vieques. The haplotypes identified on the East End beaches of St. Croix were
CmA3.1, CmA5.1, and CmA5.2. The haplotype CmA5.1 was most common (91.4%,
n=58). The average number of green sea turtle nests was 263.9±53.5 between 2003 and
2015. The mean clutch size was 107.9±3.4 eggs with an average hatching success of
86.7%±2.0%. Nesting survey effort varied greatly over the survey period, which limited
the power of the data collected.
The major finding of this study was that there are resident and migrant green
turtles on the East End beaches of St. Croix. The dominant haplotype on the East End
beaches was identified as CmA5.1. While a population estimation was not able to be
calculated from the nesting beach monitoring data, significant knowledge was gained
about the large rookery present on East End beaches, which will allow conservation
managers to evaluate other ways to protect this population. Future researchers should
utilize additional satellite transmitters equipped with depth recorders to monitor dive

vii
profiles of both male and female green turtles throughout the Caribbean. Additional
genetic analyses should be conducted on the East End beach rookery to adequately
determine if there is significant enough genetic differentiation to classify it as a separate
management unit (MU) from the Buck Island rookery. The nest monitoring program on
the East End beaches should continue with a focus of collecting data on the total number
of nesting females, clutch size, and hatching success. Continued collaborative research
involving satellite telemetry, genetic analyses, and nest monitoring is vital for protecting
this threatened and endangered species.

viii
TABLE OF CONTENTS
DEDICATION ................................................................................................................................. iii
ACKNOWLEDGMENTS ............................................................................................................... iv
ABSTRACT ...................................................................................................................................... v
Chapter 1: Using satellite telemetry to describe the internesting and post-nesting
movement patterns and habitat utilization of female green sea turtles, Chelonia
mydas, from the East End beaches of St. Croix, USVI ..................................................................... 1
INTRODUCTION .................................................................................................................... 2
MATERIALS AND METHODS ............................................................................................ 12
RESULTS ............................................................................................................................... 16
DISCUSSION ......................................................................................................................... 21
LITERATURE CITED ........................................................................................................... 33
Chapter 2: Genetic stock structure analysis of female green sea turtles, Chelonia
mydas, nesting on the East End beaches of St. Croix, USVI: a regional analysis ........................ 108
INTRODUCTION ................................................................................................................ 109
MATERIALS AND METHODS .......................................................................................... 112
RESULTS ............................................................................................................................. 113
DISCUSSION ....................................................................................................................... 113
Chapter 3: Summary statistics of green sea turtle, Chelonia mydas, nesting data
from the East End beaches of St. Croix, USVI and recommendations for long-
term sea turtle nesting data collection and management .............................................................. 127
INTRODUCTION ................................................................................................................ 128
MATERIALS AND METHODS .......................................................................................... 134
RESULTS ............................................................................................................................. 135
DISCUSSION ....................................................................................................................... 136
LITERATURE CITED ......................................................................................................... 141
APPENDIX A. Satellite Attachment Data Sheet .......................................................................... 149
APPENDIX B. The female green turtle, Chelonia mydas, Savannah (#146259)
after PTT attachment on August 1, 2015 ...................................................................................... 150
APPENDIX C. The female green turtle, Chelonia mydas, Samantha (#146260)
after PTT attachment on August 4, 2015 ...................................................................................... 151

ix
APPENDIX D. The female green turtle, Chelonia mydas, Dionne (#146261)
after PTT attachment on August 4, 2015. Note: Red light is from headlamps
used on beach at night ................................................................................................................... 152
APPENDIX E. The female green turtle, Chelonia mydas, Victoria (#146262)
after PTT attachment on August 5, 2015 ...................................................................................... 153
APPENDIX F. The female green turtle, Chelonia mydas, Annette (#146263)
after PTT attachment on October 22, 2015 ................................................................................... 154
APPENDIX G. The female green turtle, Chelonia mydas, Cheryl (#146264)
after PTT attachment on October 23, 2015 ................................................................................... 155
APPENDIX H. The female green turtle, Chelonia mydas, Emily (#153482) after
PTT attachment on October 23, 2015 ........................................................................................... 156
APPENDIX I. Adjustable wooden corral utilized in this study to restrain green
sea turtles, Chelonia mydas, during the satellite transmitter attachment process ......................... 157
APPENDIX J. Attachment of the PTT to the carapace of s green sea turtle,
Chelonia mydas, with the use of a mixed 2-part epoxy (SuperBondTM
) ...................................... 158
APPENDIX K. The female green turtle, Chelonia mydas, Victoria (#146262)
entering water after completion of the PTT attachment process .................................................. 159
APPENDIX L. Minimum convex polygon (MCP) for the internesting period
movements of the female green turtle, Chelonia mydas, Savannah (#146259).
Green star represents tagging location .......................................................................................... 160
APPENDIX M. Map of habitat utilization of the female green turtle, Chelonia
mydas, Savannah (#146259) during her internesting period (39 d) including an
outline of her 50% core use (red) and 95% activity areas (yellow) .............................................. 161
APPENDIX N. Minimum convex polygon (MCP) for the post-nesting period
movements of the female green turtle, Chelonia mydas, Savannah (#146259) ............................ 162
APPENDIX O. Map of habitat utilization of the female green turtle, Chelonia
mydas, Savannah (#146259) during her post-nesting period (187 d) including an
outline of her 50% core use (red) and 95% activity areas (yellow) .............................................. 163
APPENDIX P. Minimum convex polygon (MCP) for the internesting period
movements of the female green turtle, Chelonia mydas, Dionne (#146261).
Green star represents tagging location .......................................................................................... 164

x
APPENDIX Q. Map of habitat utilization of the female green turtle, Chelonia
mydas, Dionne (#146261) during her internesting period (65 d) including an
outline of her 50% core use (red) and 95% activity areas (yellow) .............................................. 165
APPENDIX R. Minimum convex polygon (MCP) for the post-nesting period
movements of the female green turtle, Chelonia mydas, Dionne (#146261).
Green star represents tagging location .......................................................................................... 166
APPENDIX S. Map of habitat utilization of the female green turtle, Chelonia
mydas, Dionne (#146261) during her post-nesting period (158 d) including an
outline of her 50% core use (red) and 95% activity areas (yellow) .............................................. 167
APPENDIX T. Minimum convex polygon (MCP) for the internesting period
movements of the female green turtle, Chelonia mydas, Victoria (#146262).
Green star represents tagging location .......................................................................................... 168
APPENDIX U. Map of habitat utilization of the female green turtle, Chelonia
mydas, Victoria (#146262) during her internesting period (58 d) including an
outline of her 50% core use (red) and 95% activity areas (yellow) .............................................. 169
APPENDIX V. Minimum convex polygon (MCP) for the post-nesting period
movements of the female green turtle, Chelonia mydas, Victoria (#146262) .............................. 170
APPENDIX W. Map of habitat utilization of the female green turtle, Chelonia
mydas, Victoria (#146262) during her post-nesting period (88 d) including an
outline of her 50% core use (red) and 95% activity areas (yellow) .............................................. 171
APPENDIX X. Minimum convex polygon (MCP) for the post-nesting period
movements of the female green turtle, Chelonia mydas, Cheryl (#146264) ................................ 172
APPENDIX Y. Table of PTT attachment durations for green sea turtles,
Chelonia mydas, tracked in published studies with deployment location, PTT
type, and epoxy utilized. * means that the same turtle was tracked again the next
nesting season ............................................................................................................................... 173

xi
LIST OF TABLES AND FIGURES
Chapter 1: Using satellite telemetry to describe the internesting and post-nesting
movement patterns and habitat utilization of female green sea turtles, Chelonia
mydas, from the East End beaches of St. Croix, USVI
Table 1.1. PTT, flipper tag, and PIT tag information for seven female green
sea turtles, Chelonia mydas, tagged on the East End beaches of St. Croix,
USVI. Deployment release information for each individual female turtle.
Carapace length (CCL) was measured notch to tip ................................................................ 40
Table 1.2. Turtle, tagging, and tracking data for seven female green turtles,
Chelonia mydas, satellite tracked from the East End beaches of St. Croix,
USVI in 2015 and 2016. * means that PTT was still transmitting when the
data were analyzed on 28 March, 2016. - means that there were not enough
high LCs (3, 2, and 1) to calculate .......................................................................................... 41
Table 1.3. PTT performance while attached to female green sea turtles,
Chelonia mydas, tracked from East End beaches of St. Croix, USVI
utilizing SuperBondTM
epoxy resin and fast curing agent. Location class
(LC) given with number of detections in each class (percentage of total
detections). * means that PTT was still transmitting when analyzes were
conducted on 28 March, 2016 ................................................................................................. 42
Table 1.4. Last inferred nest dates, length of internesting period, and length
of post-nesting period for green sea turtles, Chelonia mydas, satellite
tracked from the East End beaches, USVI. Samantha (#146260) stopped
transmitting after only 16 d and, therefore, was not tracked during her post-
nesting period. It was determined that Cheryl (#146264) laid her last nest
of the season on the East End beaches before the PTT was attached;
therefore, Cheryl (#146264) was not tracked during her internesting period.
* means that the PTT was still transmitting when the data were analyzed on
28 March, 2016 ....................................................................................................................... 43
Table 1.5. Inferred nest dates after PTT deployment. Displacement is the
straight-line distance between origin of track and nest location. * means no
nest was laid on the deployment date. ** means that it was a confirmed
nest (observed female nesting on beach after PTT attachment). - means that
value could not be calculated because there was no previous nesting data ............................ 44
Table 1.6. CCL (curved carapace length) and CCW (curved carapace
width) measurements and resident/migrant and neophyte/remigrant
classifications for each female green turtle, Chelonia mydas, tracked from
the East End beaches of St. Croix, USVI ............................................................................... 45

xii
Table 1.7. Dominant benthic habitat types identified for female green sea
turtles, Chelonia mydas, that were satellite tracked from the East End
beaches of St. Croix, USVI during both their internesting and post-nesting
periods. Benthic habitat type described as per the findings of Kendall et al.
(2001) and Shill et al. (2011). * means that the PTT was still transmitting
when the data were analyzed on 28 March, 2016. - means that there were
not enough high LCs (3, 2, and 1) to calculate ....................................................................... 46
Figure 1.1. Wider Caribbean Region map (source: ANCO Maritime
Activities Ltd) ......................................................................................................................... 47
Figure 1.2. Image utilized to describe seagrass from aerial photos and
ground truthing by Kendall et al. (2001) ................................................................................ 48
Figure 1.3. Image utilized to describe colonized pavement from aerial
photos and ground truthing by Kendall et al. (2001) .............................................................. 49
Figure 1.4. Image utilized to describe macroalgae from aerial photos and
ground truthing by Kendall et al. (2001) ................................................................................ 50
Figure 1.5. Image utilized to describe colonized pavement with sand
channels from aerial photos and ground truthing by Kendall et al. (2001) ............................ 51
Figure 1.6. Image utilized to describe sand from aerial photos and ground
truthing by Kendall et al. (2001) ............................................................................................. 52
Figure 1.7. Image utilized to describe dense seagrass from satellite images
and underwater transect videography by Schill et al. (2011) .................................................. 53
Figure 1.8. Image utilized to describe sparse seagrass from satellite images
and underwater transect videography by Schill et al. (2011) .................................................. 54
Figure 1.9. Image utilized to describe Acropora palmata from satellite
images and underwater transect videography by Schill et al. (2011) ..................................... 55
Figure 1.10. Map of the East End beaches within Jack, Isaac, and East End
Bays on St. Croix, USVI ......................................................................................................... 56
Figure 1.11. Diagram of suggested measurements for an adjustable corral
to restrain an adult green sea turtle while performing a transmitter
attachment. Slits in the front and back panels slide into those on the side
panels and allow for the corral to be easily adjusted based on the size of the
turtle ........................................................................................................................................ 57

xiii
Figure 1.12. Map of satellite transmitter attachment locations for all seven
female green sea turtles, Chelonia mydas, tracked from the East End
beaches of St. Croix, USVI ..................................................................................................... 58
Figure 1.13. Combined movement map of all seven satellite tracked female
green turtles, Chelonia mydas, from their nesting beach on the East End
beaches of St. Croix, USVI in August and October 2015 until 28 March
2016......................................................................................................................................... 59
Figure 1.14. Total movement map of the female green turtle, Chelonia
mydas, Samantha (#146260) after 16 d of satellite tracking from the East
End beaches of St. Croix, USVI. Green star represents tagging location and
pink triangle represents last detection location ....................................................................... 60
Figure 1.15. Total movement map of the female green turtle, Chelonia
mydas, Savannah (#146259) after 241 d of satellite tracking from the East
End beaches of St. Croix, USVI. Green star represents tagging location ............................... 61
Figure 1.16. Total movement map of the female green turtle, Chelonia
mydas, Dionne (#146261) after 237 d of satellite tracking from the East
End beaches of St. Croix, USVI. Green star represents tagging location ............................... 62
Figure 1.17. Total movement map of the female green turtle, Chelonia
mydas, Emily (#153482) after 157 d of satellite tracking from the East End
beaches of St. Croix, USVI. Green star represents tagging location ...................................... 63
Figure 1.18. Internesting movement map of the female green turtle,
Chelonia mydas, Savannah (#146259) after PTT attachment on the East
End beaches of St. Croix, USVI. Green star represents tagging location ............................... 64
Figure 1.19. Internesting movement map of the female green turtle,
Chelonia mydas, Dionne (#146261) after PTT attachment on the East End
beaches of St. Croix, USVI. Green star represents tagging location ...................................... 65
Figure 1.20. Map of 50% core use (red) and 95% activity areas (yellow) of
the female green turtle, Chelonia mydas, Savannah (#146259) during her
internesting period (39 d) ........................................................................................................ 66
Figure 1.21. Map of 50% core use (red) and 95% activity areas (yellow) of
the female green turtle, Chelonia mydas, Dionne (#146261) during her
internesting period (65d) ......................................................................................................... 67
Figure 1.22. Map of habitat utilization of the female green turtle, Chelonia
mydas, Savannah (#146259) during her internesting period (39 d) including

xiv
an outline of her 50% core use area (red). Pie chart shows percentages of
each habitat type with less prevalent habitat types displayed in dark purple ......................... 68
Figure 1.23. Map of habitat utilization of the female green turtle, Chelonia
mydas, Dionne (#146261) during her internesting period (65 d) including
an outline of her 50% core use area (red). Pie chart shows percentages of
each habitat type with less prevalent habitat types displayed in dark purple ......................... 69
Figure 1.24. Internesting movement map of the female green turtle,
Chelonia mydas, Emily (#153482) after PTT attachment on the East End
beaches of St. Croix, USVI. Green star represents tagging location ...................................... 70
Figure 1.25. Minimum convex polygon (MCP) for the internesting period
movements of the female green turtle, Chelonia mydas, Emily (#153482).
Green star represents tagging location .................................................................................... 71
Figure 1.26. Map of habitat utilization of the female green turtle, Chelonia
mydas, Emily (#153482) during her internesting period (24 d) including an
outline of her minimum convex polygon (MCP) for this period outlined in
black. Pie chart shows percentages of each habitat type with less prevalent
habitat types displayed in dark purple .................................................................................... 72
Figure 1.27. Movement map of the female green turtle, Chelonia mydas,
Savannah (#146259) during her transition period after her last inferred nest ........................ 73
Figure 1.28. Movement map of the female green turtle, Chelonia mydas,
Dionne (#146261) during her transition period after her last inferred nest ............................ 74
Figure 1.29. Movement map of the female green turtle, Chelonia mydas,
Emily (#153482) during her transition period after her last inferred nest .............................. 75
Figure 1.30. Post-nesting movement map of the female green turtle,
Chelonia mydas, Savannah (#146259) ................................................................................... 76
Figure 1.31. Post-nesting movement map of the female green turtle,
Chelonia mydas, Dionne (#146261) ....................................................................................... 77
Figure 1.32. Post-nesting movement map of the female green turtle,
Chelonia mydas, Emily (#153482) ......................................................................................... 78
Figure 1.33. Map of 50% core use (red) and 95% activity areas (yellow) of
the female green turtle, Chelonia mydas, Savannah (#146259) during her
post-nesting period (187 d) ..................................................................................................... 79

xv
Figure 1.34. Map of 50% core use (red) and 95% activity areas (yellow) of
the female green turtle, Chelonia mydas, Dionne (#146261) during her
post-nesting period (158 d) ..................................................................................................... 80
Figure 1.35. Map of habitat utilization of the female green turtle, Chelonia
mydas, Savannah (#146259) during her post-nesting period (187 d)
including an outline of her 50% core use area (red). Pie chart shows
percentages of each habitat type ............................................................................................. 81
Figure 1.36. Map of habitat utilization of the female green turtle, Chelonia
mydas, Dionne (#146261) during her post-nesting period (158 d) including
an outline of her 50% core use area (red). Pie chart shows percentages of
each habitat type ..................................................................................................................... 82
Figure 1.37. Internesting movement map of the female green turtle,
Chelonia mydas, Victoria (#146262) after PTT attachment on the East End
beaches of St. Croix, USVI. Green star represents tagging location ...................................... 83
Figure 1.38. Total movement map of the female green turtle, Chelonia
mydas, Victoria (#146262) after 159 d of satellite tracking from the East
End beaches of St. Croix, USVI. Green star represents tagging location and
pink triangle represents last detection location ....................................................................... 84
Figure 1.39. Movement map of the female green turtle, Chelonia mydas,
Victoria (#146262) during her transition period after her last inferred nest ........................... 85
Figure 1.40. Map of 50% core use (red) and 95% activity areas (yellow) of
the female green turtle, Chelonia mydas, Victoria (#146262) during her
internesting period (58 d) ........................................................................................................ 86
Figure 1.41. Map of habitat utilization of the female green turtle, Chelonia
mydas, Victoria (#146262) during her internesting period (58 d) including
an outline of her 50% core use area (red). Pie chart shows percentages of
each habitat type with less prevalent habitat types displayed in dark purple ......................... 87
Figure 1.42. Post-nesting movement map of the female green turtle,
Chelonia mydas, Victoria (#146262). Pink triangle represents last detection
location .................................................................................................................................... 88
Figure 1.43. Map of 50% core use (red) and 95% activity areas (yellow) of
the female green turtle, Chelonia mydas, Victoria (#146262) during her
post-nesting period (88 d) ....................................................................................................... 89
Figure 1.44. Map of habitat utilization of the female green turtle, Chelonia
mydas, Victoria (#146262) during her post-nesting period (88 d) including

xvi
an outline of her 50% core use area (red). Pie chart shows percentages of
each habitat type with less prevalent habitat types displayed in dark purple ......................... 90
Figure 1.45. Total movement map of the female green turtle, Chelonia
mydas, Annette (#146263) after 158 d of satellite tracking from the East
End beaches of St. Croix, USVI. Green star represents tagging location ............................... 91
Figure 1.46. Internesting movement map of the female green turtle,
Chelonia mydas, Annette (#146263) after PTT attachment on the East End
beaches of St. Croix, USVI. Green star represents tagging location ...................................... 92
Figure 1.47. Minimum convex polygon (MCP) for the internesting period
movements of the female green turtle, Chelonia mydas, Annette
(#146263). Green star represents tagging location ................................................................. 93
Figure 1.48. Movement map of the female green turtle, Chelonia mydas,
Annette (#146263) during her transition period after her last inferred nest ........................... 94
Figure 1.49. Total movement map of the female green turtle, Chelonia
mydas, Cheryl (#146264) after 158 d of satellite tracking from the East End
beaches of St. Croix, USVI. Green star represents tagging location ...................................... 95
Figure 1.50. Movement map of the female green turtle, Chelonia mydas,
Cheryl (#146264) during her transition period after her last inferred nest.
Green star represents tagging location, which was also the location of her
last inferred nest ...................................................................................................................... 96
Figure 1.51. Post-nesting movement map of the female green turtle,
Chelonia mydas, Annette (#146263) ...................................................................................... 97
Figure 1.52. Post-nesting movement map of the female green turtle,
Chelonia mydas, Cheryl (#146264) ........................................................................................ 98
Figure 1.53. Minimum convex polygon (MCP) for the post-nesting period
movements of the female green turtle, Chelonia mydas, Annette (#146263) ........................ 99
Figure 1.54. Map of habitat utilization of the female green turtle, Chelonia
mydas, Annette (#146263) during her post-nesting period (123 d) including
an outline of her minimum convex polygon (MCP) for this period outlined
in black. Pie chart shows percentages of each habitat type with less
prevalent habitat types displayed in dark purple ................................................................... 100
Figure 1.55. Map of 50% core use (red) and 95% activity areas (yellow) of
the female green turtle, Chelonia mydas, Cheryl (#146264) during her
post-nesting period (145 d) ................................................................................................... 101

xvii
Figure 1.56. Map of habitat utilization of the female green turtle, Chelonia
mydas, Cheryl (#146264) during her post-nesting period (145 d) including
an outline of her 50% core use area (red). Pie chart shows percentages of
each habitat type ................................................................................................................... 102
Figure 1.57. Habitat utilization charts representing benthic habitat types
found within the core use areas (when >20 high LC points) or minimum
convex polygons (<20 high LC points) of female green sea turtles,
Chelonia mydas, during their internesting period after satellite tag
deployment on the East End beaches of St. Croix, USVI. Benthic habitat
type identified with data from Kendall et al. (2001) and Schill et al. (2011) ....................... 103
Figure 1.58. Habitat utilization charts representing benthic habitat types
found within the core use areas (when >20 high LC points) or minimum
convex polygons (<20 high LC points) of satellite-tracked female green sea
turtles, Chelonia mydas, during their post-nesting period after nesting on
the East End beaches of St. Croix, USVI. Benthic habitat type identified
with data from Kendall et al. (2001) and Schill et al. (2011) ............................................... 104
Figure 1.59. Benthic habitat mapping around the island of St. Croix
conducted by Kendall et al. (2001) ....................................................................................... 105
Figure 1.60. Benthic habitat mapping around the island of Vieques
conducted by Kendall et al. (2001) ....................................................................................... 106
Figure 1.61. Benthic habitat mapping around the islands of St. Kitts and
Nevis conducted by Schill et al. (2011) ................................................................................ 107
Chapter 2: Genetic stock structure analysis of female green sea turtles, Chelonia
mydas, nesting on the East End beaches of St. Croix, USVI: a regional analysis
Table 2.1. Haplotype frequencies of the green sea turtle, Chelonia mydas,
with ~800 bp fragment analyses of mtDNA from control region from
within the Wider Caribbean Region ..................................................................................... 122
Figure 2.1. Haplotype frequency distribution of green sea turtles, Chelonia
mydas, throughout the Caribbean region based on 490-bp control region
haplotypes (source: Shamblin et al., 2015b) ......................................................................... 123
Figure 2.2. Haplotype frequency distribution of green sea turtles, Chelonia
mydas, throughout the Caribbean region based on 490-bp control region
haplotypes (histograms), including mtDNA variations of the Cm-A5
haplotype (pie charts) (source: Shamblin et al., 2012c)........................................................ 124

xviii
Figure 2.3. Map identifying Buck Island and the East End beaches, which
are adjacent to East End, Isaac, and Jack Bay ...................................................................... 125
Figure 2.4. Map of green sea turtle, Chelonia mydas, distinct population
segments (DPSs): (1) North Atlantic, (2) Mediterranean, (3) South
Atlantic, (4) Southwest Indian, (5) North Indian, (6) East Indian-West
Pacific, (7) Central West Pacific, (8) Southwest Pacific, (9) Central South
Pacific, (10) Central North Pacific, (11) East Pacific. The Mediterranean,
Central West Pacific, and Central South Pacific are listed under the
Endangered Species Act as endangered and all other DPSs are listed as
threatened (source: 66 Federal Register 81, 2016) ............................................................... 126
Chapter 3: Summary statistics of green sea turtle, Chelonia mydas, nesting data
from the East End beaches of St. Croix, USVI and recommendations for long-
term sea turtle nesting data collection and management
Table 3.1. Summary statistics of the nesting beach data collected for the
green sea turtle, Chelonia mydas, on the East End beaches of St. Croix,
USVI from 2003-2015 .......................................................................................................... 144
Figure 3.1. Map of the East End beaches within Jack, Isaac, and East End
Bays on St. Croix, USVI ....................................................................................................... 145
Figure 3.2. Data sheet for collection of night-time monitoring data of
nesting female sea turtles on the East End beaches of St. Croix, USVI ............................... 146
Figure 3.3. Data sheet for collection of sea turtle nest excavation data on
the East End beaches of St. Croix, USVI.............................................................................. 147
Figure 3.4. Map of green sea turtle, Chelonia mydas, distinct population
segments (DPSs): (1) North Atlantic, (2) Mediterranean, (3) South
Atlantic, (4) Southwest Indian, (5) North Indian, (6) East Indian-West
Pacific, (7) Central West Pacific, (8) Southwest Pacific, (9) Central South
Pacific, (10) Central North Pacific, (11) East Pacific. The Mediterranean,
Central West Pacific, and Central South Pacific are listed under the
Endangered Species Act as endangered and all other DPSs are listed as
threatened (source: 66 Federal Register 81, 2016) ............................................................... 148

1
Chapter 1: Using satellite telemetry to describe the internesting and post-nesting
movement patterns and habitat utilization of female green sea turtles, Chelonia mydas,
from the East End beaches of St. Croix, USVI

2
INTRODUCTION
The green sea turtle, Chelonia mydas, is one of seven sea turtle species and lives
in tropical and subtropical waters worldwide (Broderick and Godley, 1999). It is listed as
threatened by the Endangered Species Act (1973) and endangered by the IUCN Red List
of Threatened Species (2004). Chelonia mydas has a long maturation period, reaching
sexual maturation between 20 and 50 y of age (Purnama et al., 2013). Although some
researchers have found that females can produce clutches as early as 15-19 y after being
released from the Cayman Turtle Farm (Bell et al., 2005). Frazer and Ehrhart (1985) used
the von Bertalanffy and logistic models to estimate the maturation age between 18-27 y
and 26-33 y, respectively. This long maturation time leaves these turtles vulnerable to
several threats in the water at all life stages. Green turtle populations are also in danger
because their nesting and foraging habitats are disappearing. Poaching and invasive
species are other major concerns for conservation managers working to increase sea turtle
populations around the world. It is estimated that only one in 1000 hatchlings survive to
adulthood (TNC, 2011).
Once sea turtles reach the age of sexual maturation they return to the waters near
where they were hatched to breed and nest, a phenomenon known as natal homing (Carr,
1967). Signals from the magnetic fields surrounding the Earth are believed to work in
conjunction with other homing mechanisms to allow these animals to find their way back
to near the same beach where they were born (Benhamou et al., 2011). Female green sea
turtles are believed to use circular search patterns along with wind and current patterns to
locate these beaches (Åkesson et al., 2003). They continue to return to these same waters
to breed every few years. Male and female green turtles breed every one to four years

3
depending on their location (Carr, 1964; Åkesson et al., 2003; Wright et al., 2012). The
number of years between nesting seasons is referred to as the remigration interval
(Alvarado and Murphy, 1999).
The internesting period is the time period between the first and last clutch laid by
a female in a single nesting season (Sato et al., 1998). The number of days between the
laying of one clutch and the laying of the next successive clutch is referred to as the
internesting interval (Sato et al., 1998). The average green sea turtle internesting interval
was 12.6±2.9 d (n=38) in July on Huyong Island, Thailand (Yasuda et al., 2006). The
mean interval on Melbourne Beach, Florida was 12.9±1.59 d (n=165) (Johnson and
Ehrhart, 1996). During the internesting period, female green turtles remained relatively
close to their nesting beaches of Poilão, Guinea-Bissau (Godley et al., 2010); Rekawa
Sanctuary, coast of Sri Lanka (Richardson et al., 2013); and Ascension Island (Hays et
al., 1999). About 80% (n=7) of females spent their internesting period within an 80 km
range of their nesting beach on Poilão, Guinea-Bissau (Godley et al., 2010). Females on
Ascension Island had internesting ranges of approximately 0.7-2.4 km2 (Witt et al., 2010)
and spent significantly more time submerged during their internesting period than during
migration (Hays et al., 1999). The average dive was 22.1 min during internesting periods
and only 7.3 min during migration (Hays et al., 1999). This finding indicated that green
turtle females primarily rest and do not move very long distances during their internesting
period (Hays et al., 1999). It is hypothesized that female green sea turtles travel to
foraging grounds in other areas after they have completed nesting because food is
typically not abundant near the breeding and nesting sites (Hays et al., 2002c; Read et al.,
2014). The remigration and internesting intervals of nesting female sea turtles have been
4
well studied using mark and recapture studies on important turtle nesting beaches
(Yasuda et al., 2006; Wright et al., 2012).
Historically, flipper and PIT (passive integrated transponder) tags have been the
most widely utilized tools to study the movement patterns of sea turtles. Long-term
movement patterns of numerous individuals and the establishment of population
estimates have been made possible with the use of flipper tags (Read et al., 2014). One
potential disadvantage of flipper tags is that their short serial numbers are replicated;
therefore, it is vital to ensure that sea turtle researchers on nearby beaches do not utilize
the same series (Balazs, 1999). PIT tags, however, each have unique 10-digit ID numbers
that are not duplicated by the manufacturers (Balazs, 1999). While PIT tags are unlikely
to be lost because they are inserted into the turtle, they often do not provide as much data
because a specialized scanner is needed to identify the ID number (Balazs, 1999). Flipper
tags are clamped on externally and can be recorded by anyone who sees the turtle, but
these tags have a much higher likelihood of detachment than PIT tags (Balazs, 1999). The
major disadvantage of both of these tags is that the turtle must be physically captured or
located on the beach after the initial tag attachment to confirm its actual location. This
greatly limits the amount of information that can be gained from these tags because
detecting locations in the open ocean is nearly impossible resulting in data generally only
being collected when the turtles are on land.
Satellite telemetry is a more modern method of tracking the movement patterns of
sea turtles and is becoming more widely utilized. The type of platform transmitter
terminal (PTT) used can vary, but common models include:
Sirtrack™
(Yasuda et al., 2006; Rees et al., 2013; Richardson et al., 2013)

5
Telonics™
(Yasuda et al., 2006; Godley et al., 2010)
Wildlife Computers™
(Hays et al., 2002b; Hart et al., 2015)
These PTTs can be programmed to send sorted data to satellites at specified time
intervals. Fastloc® technology is now able to find locations within milliseconds with
integrated GPS-like capabilities, making it more accurate than the Argos-based PTTs
(Witt et al., 2010; Weber et al., 2013). However, the Fastloc transmitters are
approximately three times as expensive as typical Argos transmitters. This additional cost
can significantly reduce the sampling size if investigators have budget constraints. There
are also additional costs for transmitting satellite data for both the Argos-based and
Fastloc PTTs (Maxwell et al., 2011). Argos-based PTTs are the best tool for collecting
the largest amount of sea turtle satellite movement data when project funding is limited.
Most investigators retrieve sea turtle tracking data using the Argos system and
analyze it using the Satellite Tracking and Analysis Tool (STAT) on seaturtle.org
(Godley et al., 2010; Rees et al., 2013; Richardson et al., 2013) along with the software
program R and ArcGIS® 10.2 (ESRI, 2013) (Scott et al., 2012; Hart et al., 2014). Data
can be retrieved directly from Argos through use of their Telnet network; however, only
the last nine days of data are downloadable (Coyne and Godley, 2005). STAT is a web-
based system that automatically downloads the data from the Telnet network and
converts it to Generic Mapping Tools (GMT) grid format (Coyne and Godley, 2005).
Editing options available on STAT allow users to filter data for maximum speed
(calculated based on the distance between two consecutive points), Argos location class,
and turning angle (Coyne and Godley, 2005). According to the Argos User’s Manual
(2015) the location classes are ranked 3>2>1>0>A>B. The most accurate classes are 3 (<

6
250 m), 2 (250-500 m), and 1 (500-1500 m) (Hays et al., 1999 and Argos User’s Manual,
2015). Class 0 has an estimated error of < 1500 m and location classes A and B have
unknown accuracy levels (Hays et al., 1999 and Argos User’s Manual, 2015). Hoenner et
al. (2012) found the 68th percentile spatial errors of location classes 0, A, and B to be
4.15, 10.19, and 9.24 km, respectively. The finalized, edited data from STAT can be
downloaded in comma separated values (CSV) standard file format (Coyne and Godley,
2005). Mapping of the data can either be accomplished through the use of the Maptool on
seaturtle.org or with other mapping software (Coyne and Godley, 2005). All maps
created on seaturtle.org can be shared publicly or kept private (Coyne and Godley, 2005).
The goal of seaturtle.org and STAT is to further the collaboration of researchers utilizing
satellite telemetry to conduct their work (Coyne and Godley, 2005).
The biggest limitation of PTTs is that they can gather much more data than the
capacity of the bandwidth needed to transfer the data (Hatase et al., 2006). Only 256 bits
per message can be transmitted with the Argos system (Hays et al., 2007). Environmental
conditions such as cloud coverage or waves can also block signal (Shillinger et al., 2012).
PTTs can only send a successful signal when they are within range of satellites (Patterson
and Hartmann, 2011). The PTTs are typically within the visibility range of a satellite for
only about ten minutes during each pass and the number of satellite passes per day can
vary with the location of the PTT (Argos User’s Manual, 2015). A PTT can also only
send transmission signals when the antenna is above the surface of the water. The salt-
water switch enables the PTT to register when it is in a “dry” state and able to send a
signal (Wildlife Computers™
, pers. comm.) If the salt-water switch malfunctions, then the
PTT may continuously register a “wet” state and consequently, will never attempt to send
7
a signal, or in contrast will continuously register a “dry” state and will persistently
attempt to send a transmission, which will severely limit the battery life (Hays et al.,
2007). Typically, highly accurate locations are retrieved only when six or more signals
are sent to the same satellite within a single pass (Ballorain et al., 2013). In an attempt to
alleviate these issues, PTTs send the same signal multiple times (Patterson and Hartmann,
2011). Wildlife Computers™
(pers. comm.) recommends having the PTTs transmitting
constantly when tracking sea turtles because of the diving behavior and short surface
intervals of the turtles. Battery life also limits the length of time over which data can be
collected (Patterson and Hartmann, 2011).
The adhesion process for PTTs requires several steps to ensure secure attachment.
The PTTs are typically attached to the highest part of the carapace with marine-grade
epoxy after any bio-fouling is removed (Hazel et al., 2013; Richardson et al., 2013). The
epoxy is often smoothed to create a streamlined shape and to reduce the amount of
frictional drag and/or the risk of entanglement (Hays et al., 2003). Loss of PTTs is one of
the major drawbacks to using telemetry (Godley et al., 2010). PTTs can be lost and stop
sending signals a few hours after the turtle is released (Godley et al., 2003). Scute
shedding is thought to be one of the causes of PTT loss (Hazel et al., 2013). Wire and
screws can be used to attach the PTTs by drilling into the shell of the turtle; however,
ethical considerations regarding the value of the data collected versus the possible harm
to the animal should be considered when utilizing this approach (Hazel et al., 2013). Salt-
water switch failure and broken antennae are other issues associated with PTTs (Hays et
al., 2007). A broken antenna may decrease the effectiveness of the signal sent by the PTT
and result in an increase in incomplete messages (Hays et al., 2007). Godley et al. (2002)

8
suggest that attaching the PTT so that the antenna is facing the posterior end of the turtle
gives it more structural protection if the antenna becomes bent. Use of anti-foulant paint
around the switch is suggested as a method of decreasing the likelihood of salt-water
switch malfunction; however, the paint cannot be directly applied to the switch (Hays et
al., 2007). Ensuring proper adhesion of the PTTs is difficult, but vital for obtaining the
most data from each PTT.
Satellite telemetry has allowed the in-water movements of sea turtles to be
tracked, which has precipitated the discovery of novel life history characteristics of sea
turtles from certain nesting beaches, especially in the wider Caribbean (Figure 1.1). The
Wider Caribbean Region is defined as the marine environment of the Caribbean Sea, the
Gulf of Mexico, and sections of the Atlantic Ocean south of 30° N latitude and within
200 nmi (370.4 km) of the Atlantic coasts of the states mentioned in article 25 of the
UNEP (1983). The Wider Caribbean Region extends from as far north as Florida to as far
south and east as French Guyana on the North Coast of South America. Green turtles in
the Caribbean do not always make long-distance migrations from their nesting to
foraging grounds as shown by Esteban et al. (2015). Two of the three female greens
tracked from Zeelandia Beach, St. Eustatius remained within five and 47.3 km of their
release site after being tracked for a total of 42 and 237 d, respectively (Esteban et al.,
2015). This is believed to be the first documented case of green sea turtles in the
Caribbean not migrating more than 50 km from their nesting grounds to forage (Esteban
et al., 2015). One of the turtles tracked by Esteban et al. (2015) migrated to foraging
grounds near El Macao, Dominican Republic, 606 km straight-line distance from her
tagging location. All seven female green turtles tracked from their nesting beach in the
9
Cayman Islands migrated to foraging grounds ranging from 520-856 km straight-line
distance from their nesting beach while being tracked for 67-281 d (Blumenthal et al.,
2006). While there appears to be some dissimilarity in the movement patterns of female
green turtles tracked in previous studies, all have remained within the Wider Caribbean
Region for the duration of their tracking period. Not many satellite telemetry studies have
been conducted on green turtles nesting in the eastern Caribbean and there is a need for
more data regarding the movement patterns of both female and male greens once they
leave the waters near the nesting beaches.
Satellite telemetry has helped scientists identify long-distance movement patterns
of many sea turtle species. Identifying other analysis methods for Argos-based satellite
tracking data has allowed researchers to gain more knowledge about the green turtle
population than just the movement of individual turtles. One such analysis tool is kernel
density estimation (KDE), which identifies areas of higher concentrations within larger
utilized areas and is helpful when analyzing home range data (Worton, 1989). Home
range or activity area is represented by 95% kernel density estimation (KDE) and core
use area is denoted by 50% KDE (Schofield et al., 2010; Rees et al., 2013; Hart et al.,
2014). Minimum convex polygons (MCPs), or the smallest polygons created from all
points of movements of an animal, can also be used to estimate the size of the activity
area of an animal when KDE cannot be performed on the data (Broderick et al., 2007;
Hart et al., 2014).
Identifying where green turtles are moving during their internesting period and
after the nesting season will give conservation managers information that can help them
prioritize which environments should be protected in addition to the nesting beaches.

10
Determining the benthic habitats types in the core use or MCP areas of the satellite
tracked green turtles will allow for identification of common habitat types being utilized
by individuals of the green turtle population. Marine environments utilized by turtles
during their internesting periods provide protection and possibly a food source between
clutch laying (Hart et al., 2010). Benthic habitat mapping of the area utilized during the
internesting period can provide insight to the types of benthic habitat types that are
typically found in such areas (Hart et al., 2010). Locations of other ideal foraging habitats
for green turtles may also be able to be identified using benthic habitat mapping.
Benthic habitat mapping was performed in 1999 for the waters around the US
Virgin Islands and Puerto Rico utilizing visual analysis of aerial photos with the Habitat
Digitizer in ArcView 3.1 (Kendall et al., 2001). Ground truthing revealed that this
method was 93.6% accurate at detecting all habitat types and 100% accurate at detecting
submerged vegetation (Kendall et al., 2001). The definitions of the habitat types were:
Seagrass classified as any area with 10% or more coverage of Thalassia
testudinum, Syringodium filiforme, Halodule wrightii, or Halophila baillonis
(Figure 1.2).
Macroalgae classified as any habitat with 10% or greater cover by red, green, or
brown macroalgae (Figure 1.3).
Colonized pavement classified as flat rock covered by hard coral, macroalgae, or
other sessile invertebrates (Figure 1.4).
Colonized pavement with sand channels classified as colonized pavement with
alternating sand sections that are perpendicular to the shore (Figure 1.5).

11
Sandy areas classified as coarse sediment typical of high wave energy areas
(Figure 1.6) (Kendall et al., 2001).
Benthic habitat mapping was also conducted near St. Kitts and Nevis in 2010
(Schill et al., 2011). Imagery from the IKONOS and QuickBird satellites, as well as
transects with an underwater video camera were used in conjunction to produce the
habitat maps for these areas (Schill et al., 2011). The definitions of the habitat types were:
Dense seagrass defined as greater than 50% coverage by Thalassia testudinum
and Syringodium filiforme (Figure 1.7).
Sparse seagrass defined as sand areas with less than 50% seagrass cover (Figure
1.8).
Acropora palmata stumps defined as vast fields of mostly dead Acropora palmata
coral (Figure 1.9) (Schill et al., 2011).
The number of nesting green sea turtles on the End East beaches of St. Croix,
USVI, including the beaches within Jack, Isaac, and East End Bays (Figure 1.10) has
increased greatly over the last few decades (Mackay, 2011). This increase in rookery size
coupled with the lack of knowledge about the internesting and post-nesting movement
behaviors of females from these nesting beaches provided justification for this study. The
null hypotheses for this study were that the tracked females would remain within the
Wider Caribbean Region (as shown in Figure 1.1) and that the majority of the dominant
benthic habitat type would not differ in either the internesting or post-nesting periods.

12
MATERIALS AND METHODS
Researchers patrolled the East End beaches during August and October 2015
starting at approximately 20:00 in search of nesting female green turtles. Flipper tags
were applied to the right front and rear left flipper of each untagged female located on the
beach. A PIT (passive integrated transponder) tag was inserted into the left shoulder if the
female was still in a trance-like state during the egg-laying process. A PIT tag was not
inserted if the female was not located during the nest laying process. Triangulation of the
nest location was performed and a wooden popsicle stick labeled with the date and flipper
tag number of the female was placed in the nest if the nest chamber was still visible. The
curved carapace width (CCW) and length (CCL), mating scars, and locations of any
epibionts were recorded for each female following the nesting beach monitoring protocol
of The Nature Conservancy (TNC). Only when the females had concluded nesting or had
completed their false crawl and were heading back towards the water were they guided
into a wooden corral (Figure 1.11). The second carapace scute of each turtle was
scrubbed with 80-grit wet/dry sandpaper in multiple directions while saltwater was
poured over the carapace. Ninety percent alcohol was poured over the attachment area
and then wiped with paper towels until completely dry following the procedures by Hays
et al. (2001) and Hart et al. (2012) to remove any substances that would prevent proper
adhesion. Approximately 25 g of the SuperBondTM
epoxy resin and 25 g of the
SuperBondTM
fast curing agent were vigorously mixed for three min. Electrical tape was
used to cover the wet/dry sensors of the PTT during the attachment process to prevent
accidental application of epoxy onto these sensors. Epoxy was applied to both the
carapace and the underside of the PTT before the PTT was pressed down onto the

13
carapace with the antennae facing towards the rear of the animal as recommended by
Godley et al. (2002). The remaining epoxy was concentrated around the sides of the PTT
to create a more hydrodynamic shape as per Hays et al. (2003). Once the epoxy was dry
and hardened enough so that a fingernail could not dent it (approximately one h), the
wooden corral was removed and the female was released. Time and all tag information
were recorded for each turtle (Table 1.1).
Seven Wildlife Computers™
SPOT-352A platform transmitter terminals (PTTs)
were attached to green sea turtle females (see Appendix B-H) on the East End beaches of
St. Croix, USVI, including the beaches within Jack, Isaac, and East End Bays (Figure
1.12). The PTTs constantly transmitted for 16-241 d, depending on the date of attachment
and PTT signal termination. Five of the transmitters continued to transmit after data were
collected for analyses for this study. Attaching the PTTs throughout the nesting season
allowed for females to be tagged at different stages of nesting. The intention was to get a
haphazard sample of the females nesting on the East End beaches. The time between
attachments also allowed the attachment procedure to be reevaluation if signals from
PTTs were lost before attachment on other females, as happened to Samantha (#146260)
only 16 d after attachment. Rates available through the Joint Tariff Agreement were
utilized to minimize the cost of satellite data transmission. The SPOT-352A PTTs were
equipped with salt-water switches to conserve battery power, allowing the PTTs to shut
off while the turtles were below the surface of the water (SPOT6 Users Guide, 2015).
The PTTs were tested on land prior to attachment to ensure proper function, location
orientation, and correct data delivery, as recommended by Argos and Wildlife
Computers™
(pers. comm.).

14
The satellite data were collected using the Argos system with Kalman filtering.
This filtering uses an algorithm that provides more accurate location class estimations
than the previous least-squares location processing method utilized by Argos (Lopez et
al., 2014). The Kalman filtering algorithm is now the default Argos data processing
method and is likely to become the standard for satellite telemetry data analyses (Silva et
al., 2014). The Satellite Tracking and Analysis Tool (STAT) on www.seaturtle.org was
used to filter the location data (Coyne and Godley, 2005). Locations representing speeds
of more than five kph, locations on land, and locations very spatially different (greater
than 120 km) from the last valid location were removed following Godley et al. (2003),
Hart et al. (2010), and Revuelta et al. (2015). Maps of the tracks of each of the turtles
were available for the public to view on www.seaturtle.org following each attachment.
More intensive filtering, sorting, and mapping of the telemetry data was conducted using
Microsoft Excel, MATLAB R2015B, Geospatial Modeling Environment (GME) 0.7.4,
and ArcGIS® 10.2 (ESRI, 2013). The best location, according to location class (ranked
3>2>1>0>A>B), from each day was selected as representative of the general location of
each turtle on that day for mapping purposes following recommendations of Witt et al.
(2010) and Richardson et al. (2013). When all of the location classes for a given day were
the same, the first location from that day was selected for mapping purposes to maintain
consistency. Locations that were obviously on land were removed, excluded from the
analysis, and the next best location for that day was utilized following Esteban et al.
(2015).
The movements of the tracked female turtles were divided into internesting,
transition, and post-nesting periods and mapped accordingly using ArcGIS® 10.2 (ESRI,

15
2013). The internesting period was defined by the transmission of the highest location
classes (3, 2, and 1), the apparent position of these locations near land, and the
coincidence of the time interval between these transmissions with a reasonable
internesting period (less than 14 d) per the methods from Tucker (2010), Maxwell et al.
(2011), and Revuelta et al. (2015). The transition period was defined as 14 d directly
following the last inferred nesting event. The post-nesting period began directly after the
transition period ended and lasted for the remainder of the tracking duration. Satellite
telemetry data utilized for the analyses in this study were collected until 28 March 2016.
It should be noted that five PTTs continued to transmit after this date.
Kernel density estimation (KDE) was performed for both the internesting and
post-nesting period utilizing the highest LCs (3, 2, and 1) following Rees et al. (2013).
KDE was only calculated when there were >20 daily locations following Shillinger et al.
(2010), Hoenner et al. (2012), and Hart et al. (2013). The 50% KDE represented the core
use area and the 95% KDE describes the activity area for each turtle as defined by
Schofield et al. (2010). The area within both the 50% core use and 95% activity areas was
calculated for each female (Table 1.2). Minimum convex polygons (MCP) were created
for turtles with 10-20 locations of LCs 3, 2, and 1 following Hart et al. (2014).
Benthic habitat maps obtained from Kendall et al. (2001) and Schill et al. (2011)
were used to identify the major habitat type utilized during the internesting and post-
nesting periods of these females. It should be noted that dense seagrass and sparse
seagrass are individually classified by Schill et al. (2011), whereas the presence of 10%
of more seagrass species is simply described as seagrass by Kendall et al. (2001). The
dominant habitat type utilized for each turtle was determined to be the benthic habitat

16
type that had the greatest percentage occupation within the core use areas or MCPs (if
KDE could not be calculated for reasons described above). Land was removed from core
use area during these analyses since the inclusion of land in the core use area of the
turtles was likely a result of Argos LC errors. When benthic habitat mapping data were
not available for the entire core use area or MCP, the habitat type for the unavailable
sections were identified as unknown.
Based on movement patterns, females were defined as resident or migrant turtles.
Resident females were identified as those that utilized the same areas during both their
internesting and post-nesting periods following methods of Richardson et al. (2013).
Migrant females were described as those that moved away from the waters that they
occupied during their internesting period.
RESULTS
A total of 1,126 PTT days were received from the seven satellite tagged female
green turtles in the current study. The female turtles were tracked between 16-241 d
(mean=160.9±10.6 d) for a total of 12,941 PTT location detections transmitted before
analyses were conducted (Table 1.3). Five of the PTTs continued transmitting after 28
March 2016 when the data were downloaded for analysis. All tracked turtles remained
within the Wider Caribbean Region for the entire tracking duration. A combined
movement map of all satellite-tracked turtles is displayed in Figure 1.13.
The PTT for Samantha (#146260) stopped transmitting after 16 d. Her movements
before the signal ceased are showed in Figure 1.14. Core use area, activity area, and MCP

17
were not calculated for Samantha (#146260) because she did not have enough high LC
detection locations before the PTT stopped transmitting.
Three of the tracked females, Savannah (#146259), Dionne (#146261), and Emily
(#153482) utilized the same areas around St. Croix during both their internesting and
post-nesting periods (Figure 1.13) and have all remained in the waters directly
surrounding St. Croix after being tracked for 241, 237, and 157 d, respectively (Figures
1.15-1.17). Savannah (#146259) and Dionne (#146261) moved back and forth between
the East End and southwest parts of the island during their internesting periods (Figures
1.18-1.19). The 50% core use area sizes of the internesting movements of Savannah
(#146259) and Dionne (#146261) were 11.5 and 9.7 km2
and their activity area sizes were
93.4 and 112 km2, respectively (Figures 1.20-1.21). The dominant benthic habitat types
within the internesting core use area of Savannah (#146259) and Dionne (#146261) were
colonized pavement and seagrass, respectively (Figures 1.22-1.23). Dionne appears to
have nested on the west end of St. Croix at Sandy Point National Wildlife Refuge during
this time. Emily (#153482) remained in the waters closer to the East End during her
internesting period (Figure 1.24) and had an internesting MCP size of 5.4 km2 (Figure
1.25) that was dominated by seagrass (Figure 1.26). Savannah (#146259) and Dionne
(#146261) no longer transmitted data indicative of nesting after 39 d and 65 d,
respectively, which indicated that their transition periods had begun (Table 1.4) (Figures
1.27-1.28). Emily returned to the same area she utilized during her internesting period,
just to the northeast of St. Croix, during her transition period (Figure 1.29). Savannah
(#146259) and Dionne (#146261) had post-nesting areas in the waters on the southwest
end of St. Croix (Figures 1.30-1.31), whereas Emily (#153482) stayed in the waters just

18
to the northeast of St. Croix (Figure 1.32). The 50% core use area sizes of the post-
nesting movements of Savannah (#146259) and Dionne (#146261) were 4.8 and 7.6 km2
and their activity area sizes were 20.3 and 20.5 km2, respectively (Figures 1.33-1.34).
The overwhelmingly dominant (86.1% and 96.9%, respectively) habitat type of the post-
nesting areas of Savannah (#146259) and Dionne (#146261) was seagrass (Figures 1.35-
1.36). Kernel density estimation and MCP analyses could not be conducted for the post-
nesting period of Emily due to an insufficient number of high LCs. All three of these
resident turtles remained in the same post-nesting areas until data were retrieved for
analysis after 187, 158, and 119 d, respectively.
One tracked female, Victoria (#146262), remained within the waters closer to the
East End beaches during her internesting period (Figure 1.37), but then transitioned
approximately 120 km straight-line distance to the northwest of St. Croix to what
appeared to be her foraging grounds near the waters on the northwest side of Vieques
(Figures 1.38-1.39). The 50% core use area size of the internesting movements of
Victoria (#146262) was 4.4 km2
and her activity area size was 19.2 km2 (Figure 1.40).
The dominant benthic habitat type of her internesting period was colonized pavement
(Figure 1.41). Victoria (#146262) remained in the waters near Vieques for 159 d until her
PTT stopped transmitting (Figure 1.42). The 50% core use area size of the post-nesting
movements of Victoria (#146262) was 5.6 km2
and her activity area size was 21 km2
(Figure 1.43). The predominant (98.3%) benthic habitat type of her post-nesting area was
seagrass (Figure 1.44).
Another female, Annette (#146263), was satellite tagged on the East End of St.
Croix, but did not lay a nest on the night of PTT attachment; however, it was assumed

19
that she nested on the East End beaches one day after PTT deployment. Annette then
moved throughout the waters to the East of St. Croix (Figure 1.45) and appears to have
nested on two different islands, including Antigua and St. Kitts, based on satellite
telemetry data (Table 1.5). The large movements made by Annette (#146263) during her
internesting period (Figure 1.46) resulted in her having a vastly larger internesting MCP
area than all of the other females tracked in this study (52,923.9 km2) (Figure 1.47).
Annette (#146263) traveled to the southeast and eventually circled around to the waters
around Nevis where she remained just over 200 km straight-line distance from her
tagging location (Figure 1.48). Cheryl (#146264) nested on St. Croix on the same night of
PTT attachment, but had no satellite transmissions indicative of nesting after that date.
She transitioned directly to the waters near Nevis after PTT deployment (Figure 1.49).
This may have been because Cheryl (#146264) was tagged later in the nesting season (23
October 2015). For this reason the movement patterns and benthic habitat utilization
during her internesting period could not be identified. Cheryl (#146264) traveled in a
direct route to the southeast approximately 200 km straight-line distance to the waters
surrounding Nevis (Figure 1.50). Annette (#146263) and Cheryl (#146264) both
remained near the waters surrounding Nevis during their post-nesting period having both
been tracked for a total of 158 d (Figures 1.51-1.52). Annette (#146263) had a post-
nesting MCP area of 1.5 km2
(Figure 1.53), which was predominately (57.0%) dense
seagrass (Figure 1.54). The 50% core use area and 95% activity area size of the post-
nesting movements of Cheryl (#146264) were 4.0 km2
and 14.5 km2, respectively (Figure
1.55). The main benthic habitat type within the post-nesting core use area was dominated

20
(68.7%) by sand (Figure 1.56). Both turtles continued to transmit after analyses were
conducted.
The three turtles (Dionne, Emily, and Savannah) that remained within the same
waters surrounding St. Croix during both their internesting and post-nesting periods were
identified as residents (Table 1.6). The three females (Annette, Cheryl, and Victoria) that
moved away from St. Croix during their post-nesting period were defined as migrants.
There was no statistically significant difference between resident and migrant females
and their carapace measurements (CCL and CCW) with p-values of 0.91 and 0.97,
respectively. Four neophytes were tagged in this study meaning the female was identified
and tagged for the first time with no signs of previous tagging, such as a flipper scar
(Table 1.6). Three remigrants were also tracked within this study meaning that these
females had been previously tagged with a flipper or PIT tag.
The average 50% core use size during the internesting period for female turtles
tracked in this study was 8.5±1.2 km2. The internesting core use area sizes of female
green satellite tracked from the East End beaches ranged from 4.4-11.5 km2. The size of
the 95% activity area during the internesting period ranged from 19.2-112 km2
with a
mean size of 74.9±16.4 km2. The internesting MCP size ranged from 5.4-52,923.9 km
2.
The two dominant habitat types utilized by these tracked females during their internesting
periods were seagrass and colonized pavement (Figure 1.57; Table 1.7).
The average 50% core use size during the post-nesting period for female turtles
tracked in this study was 5.5±0.5 km2. The post-nesting core use area sizes of female
green satellite tracked from the East End beaches ranged from 4.0-7.6 km2. The size of
the 95% activity area during the post-nesting period ranged from 14.5-21.0 km2 with a

21
mean of 19.1±1.0 km2. The post-nesting MCP size ranged from 1.5-9.3 km
2. The
majority (five out of six) of the dominant habitat type utilized during their post-nesting
periods was seagrass or dense seagrass, dependent on which benthic habitat descriptions
were utilized for analysis (Kendall et al., 1999; Schill et al., 2011) (Figure 1.58; Table
1.7).
DISCUSSION
The major finding of the current study was that there are resident and migrant
female green turtles within the nesting rookery on the East End beaches of St. Croix.
Some females remained in the waters directly surrounding St. Croix, whereas others
moved to foraging grounds in other parts of the Caribbean. One female tracked within
this study also nested on two beaches other than her original tagging location, providing
evidence against the natal homing hypothesis. The findings of this study supported the
hypothesis that tracked female green turtles remained within the Wider Caribbean
Region. The dominant benthic habitat types utilized during the internesting periods were
seagrass and colonized pavement, while seagrass was most dominantly utilized during the
post-nesting periods.
The movement patterns identified in this study differ from the widely believed
hypothesis that green turtles travel long distances between their nesting and foraging
grounds. The turtles tracked in the current study do not demonstrate vastly large (>250
km) movements after nesting as observed by female green sea turtles that have nested in
other parts of the world, such as on Ascension Island where turtles have been recorded as
traveling over 2,000 km to their foraging grounds off the coast of Brazil (Hays et al.,

22
2002c). Green turtle foraging grounds have not been identified around Ascension Island;
this is hypothesized as the reason turtles migrate so far from the nesting beach (Hays et
al., 2002c). The green sea turtles nesting on Ascension Island have low body mass during
their internesting period and gut content analyses provided evidence that they do not feed
during this period (Hays et al., 2002a). Whereas it appears that the resident turtles of St.
Croix may be foraging during their internesting periods as it was identified in this study
that they utilized the same areas during both their internesting and post-nesting (foraging)
periods. The benthic habitat analyses from the present study indicated that the resident
females were utilizing seagrass beds and areas covered with macroalgae (colonized
pavement) during their internesting periods (Figure 1.57). Use of PTTs with depth
recorders in future satellite telemetry studies from the East End beaches may help to
clarify this hypothesis by analyzing dive profiles of these animals during their
internesting periods. Resident females tracked during this study traveled no more than 28
km straight-line distance away from their nesting beach on the East End of St. Croix.
Similar results were found when Esteban et al. (2015) tracked two female green turtles
moving no greater than 50 km away from their nesting beach on St. Eustatius. However,
one green turtle tracked by Esteban et al. (2015) traveled 606 km straight-line distance
from her nesting beach and was identified as a migrant breeder. All three green turtles
tracked from their nesting beach on St. Eustatius settled in foraging grounds in St.
Eustatius, St. Kitts, and Dominican Republic with shallow (10-25 m) seagrass beds
(Esteban et al., 2015). Behavioral plasticity may exist in the movement patterns of female
green sea turtles after the nesting season. This hypothesis is further supported by satellite
telemetry studies of female green turtles nesting on the island of Poilão, Guinea-Bissau

23
and identification of movements of over 1,000 km from their nesting to foraging grounds.
However, some turtles remained within the Bijagos archipelago and were believed to
have local residency in that area (Godley et al., 2010).
Three main behavior patterns described for green sea turtles released from Ceará,
Brazil were: residency with high site-fidelity, medium-range movements (<100 km), and
long-range movements (>100 km) (Godley et al., 2003). Three of the turtles (Dionne,
Emily, and Savannah) tracked in the current study would be classified by the above
described characteristics as having residency with high site fidelity, whereas the other
three (Annette, Cheryl, and Victoria) would be described as displaying long-range
movements. Female green turtles satellite tracked from their nesting beach in the Rekawa
Sanctuary in Sri Lanka also demonstrated similar types of movement patterns to those
observed in the present study (Richardson et al., 2013). Seven of the ten females moved
to foraging sites over 300 km away from their nesting beach in Sri Lanka, whereas the
other three utilized the same areas during both their internesting and post-nesting periods
(Richardson et al., 2013). The turtles that remained within the same waters for foraging
as they utilized during their internesting period were referred to as resident breeders
(Richardson et al., 2013). Some female green turtles nesting on the East End beaches of
St. Croix appear to forage in areas of seagrass beds near their nesting beach after the
nesting season; whereas, others travel long distances (up to 250 km straight-line distance)
possibly in search of other food sources. The majority of the dominant benthic habitat
type utilized during the post-nesting period was seagrass or dense seagrass. It is likely
that some turtles remained in the waters directly surrounding St. Croix as food resources
are plentiful in the waters to the south and northeast of St. Croix (Figure 1.59). The areas

24
to the northwest of St. Croix are generally characterized by a short shelf (approximately
500 m) followed by a steep wall face. Green sea turtles typically do not utilize these areas
as seagrass beds are not predominant there (Lewis, pers. comm.). Seagrass beds are,
however, prevalent in the waters surrounding the island of Vieques (Figure 1.60). The
waters surrounding Nevis also have large areas of seagrass beds and algae covered areas
(Figure 1.61). The habitat availability of seagrass beds in certain areas may be the reason
for the observed movement patterns of the tracked female green turtles within this study.
The seagrass habitats surrounding St. Croix likely are not large enough to sustain the
entire East End beach rookery, resulting in migration of some females to foraging
grounds in other parts of the Caribbean.
It is hypothesized that female greens that do not migrate far from their nesting
grounds to forage may have shorter remigration intervals (time between successive
nesting seasons) because these females may not expend as much energy transitioning to
their foraging grounds (Esteban et al., 2015). However, a female green sea turtle satellite
tagged in the Cayman Islands was documented nesting in two consecutive years after
moving to her foraging grounds in Guatemala, 855 km away (Blumenthal et al., 2006),
indicating that some females may still make long migrations between nesting and
foraging grounds and continue to have short remigration intervals. Turtles tagged in this
study may be able to provide data to test this hypothesis in the future dependent upon
PTT attachment, battery life, and movement patterns of each of the females.
One female tracked within this study nested on two beaches other than her
original tagging location, providing evidence against the natal homing hypothesis.
Annette (#146263) nested on St. Croix, Antigua, and St. Kitts before transitioning to her

25
foraging grounds near Nevis (Table 1.5). Evidence against the natal homing hypothesis
within the Caribbean region also was documented by Esteban et al. (2015). Green turtles
tracked from St. Eustatius were identified nesting on other islands up to 21.8 km away
from their tagging location (Esteban et al., 2015). The close proximity of islands within
the Caribbean may be a possible explanation for this behavior and gives support against
the natal homing hypothesis within the Caribbean. The mean internesting interval for
female green turtles tracked in the current study was 10.3±0.09 d. This average is
consistent with female green turtles on St. Eustatius with internesting intervals ranging
from 9-13 d (Esteban et al., 2015) and the mean interval on Huyong Island, Thailand
being 12.6±2.9d (n=38) (Yasuda et al., 2006).
While there is evidence against the natal homing hypothesis, green turtles have
shown high fidelity to their foraging grounds (Balazs, 1976; Broderick et al., 2007).
Locations referred to as post-nesting in this current study may be labeled as foraging
grounds following the classification used by Stokes et al. (2015), which identified
foraging sites as fixed areas where satellite tracked turtles remained for greater than 27 d.
All turtles in the current study demonstrated site fidelity and remained within the same
foraging grounds that they initially traveled to for a range of 88-187 d (Table 1.4). The
tracked females that nested on the East End beaches of St. Croix did not travel only to
other areas throughout the Caribbean to forage, but some also remained in the waters
directly surrounding St. Croix during the non-breeding and non-nesting seasons. This
information is critical to conservation managers as it demonstrates the necessity to not
only protect known sea turtle nesting beaches, but also conserve areas that are likely

26
foraging grounds. Since sea turtles show high fidelity to foraging grounds these areas can
be identified a key habitats imperative to sea turtle conservation (Broderick et al., 2007).
The female green turtles tracked in the current study had relatively the same sized
core and activity areas of female green sea turtle in previous studies; however the extent
of these areas may largely be variable based on habitat availability in different parts of
the world. The mean sizes of the internesting core and activity areas within this current
study were 8.5 and 74.9 km2, respectively. A female nesting on Qaru Island, Kuwait had
an internesting core use area of 3.8 km2 (Rees et al., 2013). Hypothetically, green turtles
do not forage during the internesting period (Hays et al., 2002a). Therefore, their
movement during this time may not be limited by the size of the seagrass beds, whereas it
likely restricts their movement during foraging. This provides evidence for why the mean
sizes of the post-nesting core and activity areas (5.5 and 19.1 km2, respectively) were
smaller than those of the internesting core and activity areas (8.5 and 74.9 km2,
respectively) for the females tracked within this current study (Table 1.2). Three female
greens that were satellite tracked by Rees et al. (2013) from Kuwait had a post-nesting
core use and activity area smaller than 15 km2
and 80.0 km2, respectively. While the
activity area of the females tracked in this study from the East End beaches of St. Croix
were small in comparison to the 80.0 km2 area from the female tracked from Kuwait, this
may be a factor of the size of the foraging area (seagrass availability) within these
different areas. A male green turtle was tracked traveling 691.9 km in what was believed
to be his foraging ground in the East Pacific (Hart et al., 2015). Such a large foraging area
was hypothesized to exist due to the lower food densities present in that region of the
Pacific (Hart et al., 2015). However, such a large foraging area when compared to that of

27
females may also be indicative of sex-based differences in habitat utilization or food
preference, but more satellite telemetry studies tracking male green turtles are needed to
test these hypotheses.
Green sea turtles typically forage on Thalassia testudinum as well as some other
species of seagrass and algae (Bjorndal, 1997). The majority of the dominant benthic
habitat type identified during the post-nesting period of turtles tracked in the current
study was seagrass. Godley et al. (2003) suggests that home range size may vary based
on the main diet component of green turtles, with those having more algae-dominant diets
having larger home ranges. The waters surrounding St. Croix, Nevis, and Vieques are
more predominately covered with seagrass beds in areas that the tracked turtles utilized;
therefore, this may be the reason that the turtles in this current study had slightly smaller
home ranges than green turtles tracked in other parts of the world. The current study
reveals a need for additional benthic habitat mapping throughout the Caribbean to
identify critical habitat utilization areas, such as areas of large seagrass beds or large
amounts of macroalgae. Protection of these foraging grounds is necessary as these areas
are utilized by the turtles for the majority of their adult lives. Current sea turtle
conservation efforts are mainly focused on monitoring sea turtle nesting habitats;
however, vital marine environments also are crucial for protecting this species.
Identification of dominant habitat type becomes more critical when long-term site
fidelity can be determined from specific animal movements. Successful long-term PTT
attachment is important so that the largest amount of data can be collected during each
satellite telemetry study. There is no explanation for why data stopped transmitting from
the PTT on Samantha (#146260) after only 16 d in this study. It was hypothesized that

28
sand caught between the epoxy and PTT during the attachment process may have resulted
in a weak attachment. Other possible causes of signal loss included broken antennae,
scute shedding, saltwater switch failure, or PTT malfunction (Hays et al., 2007; Hazel et
al., 2013). This early PTT detachment illustrated why all seven PTTs were not attached at
the same time in this study. Project managers wanted to evaluate and where necessary,
improve the attachment process before deploying all transmitters to minimize equipment
loss.
Sea turtle researchers have utilized switching state-space modeling (SSM) to
explicitly determine the start and end of internesting and foraging periods when analyzing
satellite telemetry data (Jonsen et al., 2005; Hart et al., 2014). State-space modeling
simulates the movements of each individual turtle utilizing errors specified by the Argos
location classes with Markov Chain Monte Carlo (MCMC) in WinBUGS using the
software program R (Jonsen et al., 2005; Hart et al., 2014). Switch state-space modeling
could be utilized to support the classification of the internesting and post-nesting periods
in the present study; however, because some turtles remained in the same regions during
their internesting and post-nesting periods there may be an issue distinguishing these
areas from one another as SSM determines its classification based on distance. Use of
SSM may also be troublesome when females are utilizing nesting beaches that are
separated by more than a few km, as was seen in the movements of Annette (#146263) in
the present study (Figure 1.46). Utilization of SSM is also recommended by Maxwell et
al. (2011) in combination with typical Argos data, when funding for Fastloc GPS
transmitters is not available. Fastloc transmitters that are not retrieved are still limited by
bandwidth for the amount of data that they are able to send over the Argos system

29
(Maxwell et al., 2011). Argos-based locations with improved data filtering techniques are
sufficient for interpreting large-scale movements of sea turtles (Witt et al., 2010). The
large power requirements and shorter lifespans of the Fastloc transmitters do not
currently make them any better than the Argos-based transmitters at tracking sea turtle
movements (Witt et al., 2010). However, the combination of new satellite telemetry
analysis methods as well as more accurate PTTs have allowed for the expansion of
knowledge of sea turtle movements.
The most vital step when conducting a satellite telemetry study is ensuring a
secure PTT attachment so that data can be collected for the entire lifespan of the PTT
battery and so that the PTT does not prematurely detach. It is recommended that future
researchers utilize an adjustable wooden corral as done in this current study when
attaching a PTT on the beach. It is important that the corral is configured so as to confine
each turtle as much as possible to avoid injury to the turtle and researchers, as well as
ensure a secure attachment of the PTT. When some turtles in this study were not confined
sufficiently in the corral, they were able to move their flippers, which resulted in the
throwing of sand making the PTT application process more difficult. The more the turtles
are able to move their flippers, the greater chance of personnel injury, as well. The
wooden corral utilized in this study was adjustable and could change from 1.22-1.83 m
on each side. A diagram with specific recommended dimensions for a wooden corral to
confine an adult green sea turtle is included in Figure 1.11. Specialized corral dimensions
should be utilized depending on the average adult size of the turtle species being
confined. It is also recommended to cut handles into each section of the corral for easier
handling while maneuvering the corral around the beach. Also, a confined turtle should

30
be given time (approximately five min) to settle down after it is captured before the
adhesion process begins. This will help prevent sand from being flung onto the
attachment site once the epoxy application begins. After the attachment process is
complete, it is vital to remove the corral carefully and allow the turtle to find its way back
to the water.
Different types of epoxies are recommended for use of transmitter attachment on
different sea turtle species due to the unique compositions of the carapaces. Examples of
other types of epoxies used are Sonic Weld™ (Ed Greene and Company; Sparta,
Tennessee) and Fast Foil™ (Power Fasteners, Inc.; New Rochelle, NY) for Caretta
caretta (Arendt et al., 2012); Foilfast (SFS Stadler, Cheltenham, UK) for Chelonia mydas
(Godley et al., 2003); and Sika Anchorfix 3 (Lyndhurst NJ, USA) for Lepidochelys
olivacea (Maxwell et al., 2011). It is vital to ensure that the epoxy utilized for attachment
does not heat up too much as this can harm the turtle and may change the natural
behavior of the turtle after release. The curing time is also an important aspect to keep in
mind, as it is best to confine the turtle for as little time as possible, while still ensuring a
secure attachment. The two-part epoxy (SuperBondTM
) used in this study had low heat
activation and only took an hour to set. The type of epoxy utilized, the specific
attachment protocols, and the type of PTT used can all impact the longevity of the PTT
transmission (see Appendix Y).
The length of the PTT duration directly coincides with the amount of information
that is gathered. This is very critical especially when small samples sizes are being
utilized, which is often the case in satellite telemetry studies. Of course the small study
size may limit the power of the findings, but when funding is limited, satellite tracking a

31
small number of individuals can still provide valuable insight on the movement patterns
of females from specific nesting beaches. More than 40 tracked turtles are needed to draw
conclusions about the movement patterns of turtles from a specific rookery (Shofield et
al., 2013). Future studies should involve the satellite tracking of more female greens from
East End beaches, as well as the satellite tracking of male greens from the mating
grounds in the waters around St. Croix. Identification of male movement patterns after
breeding would provide information about where and how these animals forage and if the
post-breeding movements of males is different than that of female greens. Other
researchers may utilize PTTs equipped with depth recorders to investigate diving
behavior of these animals as well. Additional, more up-to-date benthic habitat mapping
and ground truthing around St. Croix would also be helpful in identifying possible
foraging grounds of these animals. Future studies should also incorporate a greater
number of PTTs in order to enlarge the sample size and get a broader sense of many of
the foraging areas that females that nest on the East End beaches of St. Croix are
utilizing.
The use of seaturtle.org to map sea turtle movements all around the world and
view them in one place has helped raise awareness and funds for sea turtle research
worldwide. Individuals can “adopt a turtle” which helps to raise funds for the satellite
telemetry costs and also gives people a reason to care about these animals and the marine
environment that the turtles live in. Knowledge gained from satellite telemetry studies
can help conservation managers determine where areas of protection need to be created
for these animals. The coupling of satellite telemetry with other information (such as
benthic habitat mapping) will enable future researchers to identify specific marine

32
environments being utilized by the species that are being tracked. Novel findings, such as
the identification of different movement patterns of the green sea turtles, will help
conservation managers better understand the extent of habitat that these turtles are
utilizing. Protecting marine environments that are critical habitats for the green sea turtle
species can be difficult because sea turtles cross international boundaries and can make it
tough to manage one specific rookery. International cooperation will be required to help
reestablish the population of green sea turtles all around the world.

33
LITERATURE CITED
Åkesson, S., A.C. Broderick, F. Glen, B.J. Godley, P. Luschi, F. Papi, and G.C. Hays.
2003. Navigation by green turtles: which strategy do displaced adults use to find
Ascension Island? OIKOS 103:363-372.
Alvarado, J. and T.M. Murphy. 1999. Nesting periodicity and internesting behavior. In:
Eckert K.L., K.A. Bjorndal, F.A. Abreu-Grobois, and M. Donnelly. Research and
management techniques for the conservation of sea turtles. IUCN/SSC Marine
Turtle Specialist Group Publication 4:115-118.
Arendt, M.D., A.L. Segars, J.I. Byrd, J. Boynton, J.D. Whitaker, L. Parker, D.W. Owens,
G. Blanwillain, J.M. Quattro, and M.A. Roberts. 2012. Distributional patterns of
adult male loggerhead sea turtles (Caretta caretta) in the vicinity of Cape
Canaveral, Florida, USA during and after a major annual breeding aggregation.
Marine Biology 159:101-112.
Balazs, G.H. 1976. Green turtle migrations in the Hawaiian archipelago. Biological
Conservation 9:125-140.
Balazs, G.H. 1999. Factors to consider in the tagging of sea turtles. In: Eckert K.L., K.A.
Bjorndal, F.A. Abreu-Grobois, and M. Donnelly. Research and management
techniques for the conservation of sea turtles. IUCN/SSC Marine Turtle Specialist
Group Publication 4:101-109.
Ballorain, K., J. Bourjea, S. Ciccione, A. Kato, N. Hanuise, M. Enstipp, S. Fossete, and
J.Y. Georges. 2013. Seasonal diving behaviors and feeding rhythms of green
turtles at Mayotte Island. Marine Ecology Progress Series 483:289-302.
Bell, C.D.L., J. Parsons, T.J. Austin, A.C. Broderick, G. Ebanks-Petrie, and B.J. Godley.
2005. Some of them came home: the Cayman Turtle Farm headstarting project for
the green turtle Chelonia mydas. Oryx 39(2):137-148.
Benhamou, S., J. Sudre, J. Bourgea, S. Ciccione, A. DeSantis, and P. Luschi. 2011. The
role of geomagnetic cues in green turtle open sea navigation. PLoS ONE 6(10):
e26672.
Bjorndal, K.A. 1997. Foraging ecology and nutrition of sea turtles. In Lutz, P.L. and J.A.
Musick, (Eds). The Biology of Sea Turtles. Boca Raton, FL; CRC Press, p. 199-
232.
Blumenthal, J.M., J.L. Solomon, C.D. Bell, T.J. Austin, G. Ebanks-Petrie, M.S. Coyne,
A.C. Broderick, and B.J. Godley. 2006. Satellite tracking highlights the need for
international cooperation in marine turtle management. Endangered Species
Research 2:51-61.

34
Broderick, A.C., M.S. Coyne, W.J. Fuller, F. Glen, and B.J. Godley. 2007. Fidelity and
over-wintering of sea turtles. Biological Sciences 274(1617):1533-1538.
Broderick, A.C. and B.J. Godley. 1999. Effect of tagging marine turtles on nesting
behaviour and reproductive success. Animal Behaviour 58:587-591.
Carr, A. 1964. Migrations of the green turtle. BioScience 14(8):49-52.
Carr, A. F. 1967. So excellent a fishe: a natural history of sea turtles. Scribner, New
York, New York.
Coyne, M.S. and B.J. Godley. 2005. Satellite tracking and analysis tool (STAT): an
integrated system for archiving, analyzing and mapping animal tracking data.
Marine Ecology Progress Series 301:1-7.
Endangered Species Act of 1973. 16 USC Sec. 1531. Print.
Esteban, N., R.P. van Dam, E. Harrison, A. Herrera, and J. Berkel. 2015. Green and
hawksbill turtles in the Lesser Antilles demonstrate behavioural plasticity in inter-
nesting behaviour and post-nesting migration. Marine Biology 162:1153-1163.
Frazer, N.B. and L.M. Ehrhart. 1985. Preliminary growth models for green, Chelonia
mydas, and loggerhead, Caretta caretta, turtle in the wild. Copeia 1985(1):73-79.
Godley, B.J., C. Barbosa, M. Bruford, A.C. Broderick, P. Catry, M.S. Coyne, A. Formia,
G.C. Hays, and M.J. Witt. 2010. Unraveling the migratory connectivity in marine
turtles using multiple methods. Journal of Applied Ecology 47:769-778.
Godley, B.J., E.H.S.M. Lima, S. Åkesson, A.C. Broderick, F. Glen, M.H. Godfrey, P.
Luschi, and G.C. Hays. 2003. Movement patterns of green turtles in Brazilian
coastal waters described by satellite tracking and flipper tagging. Marine Ecology
Progress Series 253:279-288.
Godley, B.J., S. Richardson, A.C. Broderick, M.S. Coyne, F. Glen, and G.C. Hays. 2002.
Long-term satellite telemetry of the movements and habitat utilization by green
turtles in the Mediterranean. Ecography 25:352-362.
Hart, K.M., G.S. Blanco, M.S. Coyne, C. Delgado-Trejo, B.J. Godley, T.T. Jones, A.
Resendiz, J.A. Seminoff, M.J. Witt, and W.J. Nichols. 2015. Multinational
tagging efforts illustrate regional scale of distribution and threats for East Pacific
green turtles (Chelonia mydas agassizii). PLoS ONE 10(2):e0116225.
doi:10.1371/journal.pone.0116225.

35
Hart, K.M., M.M. Lamont, I. Fujisaki, A.D. Tucker, and R.R. Carthy. 2012. Common
coastal foraging areas for loggerheads in the Gulf of Mexico: Opportunities for
marine conservation. Biology Conservation 145:185-194.
Hart, K.M., M.M. Lamont, A.R. Sartain, and I. Fujisaki. 2014. Migration, foraging, and
residency patterns for Northern Gulf loggerheads: implications of local threats
and international movements. PLoS ONE 9(7):e103453.
doi:10.1371/journal.pone.0103453.
Hart, K.M., M.M. Lamont, A.R. Sartain, I. Fujisaki, and B.S. Stephens. 2013.
Movements and habitat-use of loggerhead sea turtles in the Northern Gulf of
Mexico during the reproductive period. PLoS ONE 8(7): e66921.
doi:10.1371/journal.pone.0066921.
Hart, K.M., D.G. Zawada, I. Fujisaki, and B.H. Lidz. 2010. Inter-nesting habitat-use
patterns of loggerhead sea turtles: enhancing satellite tracking with benthic
mapping. Aquatic Biology 11:77-90.
Hatase, H., K. Sato, M. Yamaguchi, K. Takahashi, and K. Tsukamoto. 2006. Individual
variation in feeding habitat use by adult female green sea turtles (Chelonia
mydas): are they obligatory neritic herbivores? Oecologia 149:52-64.
Hays, G.C., C.J.A. Bradshaw, M.C. James, P. Lovell, and D.W. Sims. 2007. Why do
Argos satellite tags deployed on marine animals stop transmitting? Journal of
Experimental Maine Biology and Ecology 349:52-60.
Hays, G.C., A.C. Broderick, F. Glen, and B.J. Godley. 2001. The movements and
submergence behaviour of male green turtles at Ascension Island. Marine Biology
139:395-399.
Hays, G.C., A.C. Broderick, F. Glen, and B.J. Godley. 2002a. Change in body mass
associated with long-term fasting in a marine reptile: the case of green turtles
(Chelonia mydas) at Ascension Island. Canadian Journal of Zoology 80:1299-
1302.
Hays, G.C., A.C. Broderick, F. Glen, B.J. Godley, J.D.R. Houghton, and J.D. Metcalfe.
2002b. Water temperature and internesting intervals for loggerhead (Caretta
caretta) and green (Chelonia mydas) sea turtles. Journal of Thermal Biology
27:429-432.
Hays, G.C., A.C. Broderick, B.J. Godley, P. Lovell, C. Martin, B.J. McConnell, and S.
Richardson. 2002c. Biphasal long-distance migration in green turtles. Animal
Behaviour 64:895-898.

36
Hays, G.C., A.C. Broderick, B.J. Godley, P. Luschi, and W.J. Nichols. 2003. Satellite
telemetry suggests high levels of fishing-induced mortality in marine turtles.
Marine Ecology Progress Series 262:305-309.
Hays, G.C., P. Luschi, F. Papi, C. del Seppia, and R. Marsh. 1999. Changes in behaviour
during the inter-nesting period and post-nesting migration for Ascension Island
green turtles. Marine Ecology Progress Series 189:263-273.
Hazel, J., M. Hamann, and I.R. Lawler. 2013. Home range of immature green turtles
tracked at an offshore tropical reef using automated passive acoustic technology.
Marine Biology 160:617-627.
Hoenner, X., S.D. Whiting, M.A. Hindell, and C.R. McMahon. 2012. Enhancing the use
of Argos satellite data for home range and long distance migration studies of
marine animals. PLoS ONE 7(7):e40713.
Johnson, S.A. and L.M. Ehrhart. 1996. Reproductive ecology of the Florida green turtle:
clutch frequency. Journal of Herpetology 30(3):407-410.
Jonsen, I.D., J.M. Flemming, and R.A. Myers. 2005. Robust state-space modeling of
animal movement data. Ecology 86(11):2874-2880.
Kendall, M.S., M.E. Monaco, K.R. Buja, J.D. Christensen, C.R. Kruer, M. Finkbeiner
and R.A. Warner. 2001. Methods Used to Map the Benthic Habitats of Puerto
Rico and the U.S. Virgin Islands. NOAA Technical Memorandum NOAA
NCCOS CCMA 152. Silver Spring, MD. 45 pp.
Lopez, R., J-P. Malardé, F. Royer, and P. Gaspar. 2014. Improving Argos doppler
location using multiple model Kalman filtering. IEEE Transactions on Geoscience
and Remote Sensing 52(8):4744-4755.
Mackay, A.L. 2011. 2009 and 2010 Sea Turtle Monitoring Program: The East End
Beaches (Jack’s, Isaac’s, and East End Bay) St. Croix, U.S. Virgin Islands. Final
Report to The Nature Conservancy.
Maxwell, S.M., G.A. Breed, B.A. Nickel, J. Makanga-Bahouna, E. Pemo-Makaya, R.J.
Parnell, A. Formia, S. Ngouessono, B.J. Godley, D.P. Costa, M.J. Witt, and M.S.
Coyne. 2011. Using satellite tracking to optimize protection of long-lived marine
species: olive ridley sea turtle conservation in Central Africa. PLoS ONE
6(5):e19905.
Patterson, T.A. and K. Hartmann. 2011. Designing satellite tagging studies: estimating
and optimizing data recovery. Fisheries Oceanography 20(6):449-461.

37
Purnama, D., N.P. Zamani, and A. Farajallah. 2013. Microsatellite DNA analysis on the
polyandry of green sea turtle Chelonia mydas. Journal of Biosciences 20(4):182-
186.
Read, T.C., L. Wantiez, J.M. Werry, R. Farman, G. Petro, and C.J. Limpus. 2014.
Migrations of green turtles (Chelonia mydas) between nesting and foraging
grounds across the coral sea. PLOS ONE 9(6):e100083.
Rees, A.F., A.A. Hafez, J.R. Lloyd, N. Papathansopoulou, and B.J. Godley. 2013. Green
turtles, Chelonia mydas, in Kuwait: nesting and movements. Chelonian
Conservation and Biology 12(1):157-163.
Revuelta, O., L. Hawkes, Y.M. Leon, B.J. Godley, J.A. Raga, and J. Tomas. 2015.
Evaluating the importance of marine protected areas for the conservation of
hawksbill turtles Eretmochelys imbricata nesting in the Dominican Republic.
Endangered Species Research 27:169-180.
Richardson, P.B., A.C. Broderick, M.S. Coyne, L. Ekanayake, T. Kapurusinghe, C.
Premakumara, S. Ranger, M.M. Saman, M.J. Witt, and B.J. Godley. 2013.
Satellite telemetry reveals behavioural plasticity in a green turtle population
nesting in Sri Lanka. Marine Biology 160:1415-1426.
Sato, K., Y. Matsuzawa, H. Tanaka, T. Bando, S. Minamkawa, W. Sakamoto, and Y.
Naito. 1998. Internesting intervals for loggerhead turtles, Caretta caretta, and
green turtles, Chelonia mydas, are affected by temperature. Canadian Journal of
Zoology 76(9):1651-1662.
Schill, S.R., J.E. Knowles, G. Rowlands, S. Margles, V. Agostini, and R. Blyther. 2011.
Coastal benthic habitat mapping to support marine resource planning and
management in St. Kitts and Nevis. Geography Compass 5(12):898-917.
Schofield, G., V.J. Hobson, M.K.S. Lilley, K.A. Katselidis, C.M. Bishop, P. Brown, and
G.C. Hays. 2010. Inter-annual variability in the home range of breeding turtles:
Implications for current and future conservation management. Biological
Conservation 143:722-730.
Seminoff, J.A. (Southwest Fisheries Science Center, U.S.). 2004. Chelonia mydas. The
IUCN Red List of Threatened Species 2004: e.T4615A11037468.
http://dx.doi.org/10.2305/IUCN.UK.2004.RLTS.T4615A11037468.en.
Downloaded on 02 December 2015.
Service Argos. 2015. Argos User's Manual. CLS America. URLhttp://www.argos-
system.org/manual.

38
Scott, R., D.J. Hodgson, M.J. Witt, M.S. Coyne, W. Adnyana, J.M. Clumenthal, A.C.
Broderick, A.F. Canbolat, P. Catry, S. Ciccione, E. Delcroiz, C. Hitipeuw, P.
Luschi, L. Pet-Soede, K. Pendoley, P.B. Richardson, A.F. Rees, and B.J. Godley.
2012. Global analysis of satellite tracking data shows that adult green turtles are
significantly aggregated in marine protected areas. Global Ecology and
Biogeography 21:1053-1061.
Shillinger, G.L., H. Bailey, S.J. Bograd, E.L. Hazen, M. Hamann, P. Gaspar, B.J. Godley,
R.P. Wilson, J.R. Spotila. 2012. Tagging through the stages: technical and
ecological challenges in observing life histories through biologging. Marine
Ecological Progress Series 457: 165-170.
Shillinger, G.L., A.M. Swithenbank, S.J. Bograd, H. Bailey, M.R. Castelton, B.P.
Wallace, J.R. Spotila, F.V. Paladino, R. Piedra, and B.A. Block. 2010.
Identification of high-use internesting habitats for eastern Pacific leatherback
turtles: role of the environment and implications for conservation. Endangered
Species Research 10:215–232.
Silva, M.A., I. Jonsen, D.J.F. Russell, R. Prieto, D. Thompson, and M.F. Baumgartner.
2014. Assessing the performance of Bayesian state-space models fit to Argos
satellite telemetry locations processed with Kalman filtering. PLoS ONE
9(3):e92277.
SPOT6 Users Guide, 2015. Wildlife Computers.
Stokes, K.L., A.C. Broderick, A.F. Canbolat, O. Candan, W.J. Fuller, F. Glen, Y. Levy,
A.F. Rees, G. Rilov, R.T. Snape, I. Stott, D. Tchernov, and B.J. Godley. 2015.
Migratory corridors and foraging hotspots: critical habitats identified for
Mediterranean green turtles. Diversity and Distributions 21(6):665-674.
The Nature Conservancy’s St. Croix sea turtle monitoring and protection plan. 2011.
Tucker, A.D. 2010. Nest site fidelity and clutch frequency of loggerhead turtles are better
elucidated by satellite telemetry than by nocturnal tagging efforts: Implications
for stock estimation. Journal of Experimental Marine Biology and Ecology
383:48-55.
UNEP. 1983. UNEP, Action Plan for the Caribbean Environment Programme, UNEP
Regional Seas Reports and Studies, No. 26.
U.S. Defense Mapping Agency. 2005. CARIB_WVS_GEO_WGS84.SHP. World Vector
Shoreline of the Caribbean Sea region: Open-File Report 2005-1071.U.S.
Geological Survey. Coastal and Marine Geology Program. Woods Hole Science
Center, Woods Hole, MA.

39
Weber, N., S.B. Weber, B.J. Godley, J. Ellick, M. Witt, and A.C. Broderick. 2013.
Telemetry as a tool for improving estimates of marine turtle abundance.
Biological Conservation 167:90-96.
Witt, M.J., S. Åkesson, A.C. Broderick, M.S. Coyne, J. Ellick, A. Formia, G.C. Hays, P.
Luschi, S. Stroud, and B.J. Godley. 2010. Assessing accuracy and utility of
satellite-tracking data using Argos-linked Fastloc-GPS. Animal Behaviour
80:571-581.
Worton, B.J. 1989. Kernel methods for estimating the utilization distribution in home-
range studies. Ecology 70(1):164-168.
Wright, L.I., W.J. Fuller, B.J. Godley, A. McGowan, T. Tregenza, and A.C. Broderick.
2012. Reconstruction of paternal genotypes over multiple breeding seasons
reveals male green turtles do not breed annually. Molecular Ecology 21:3625-
3635.
Yasuda, T., H. Tanaka, K. Kittiwattanawong, H. Mitamura, W. Klom-in, and N. Arai.
2006. Do female green turtles (Chelonia mydas) exhibit reproductive seasonality
in a year-round nesting rookery? Journal of Zoology 269:451-457.

40
Table 1.1. PTT, flipper tag, and PIT tag information for seven female green sea turtles, Chelonia mydas, tagged on the East
End beaches of St. Croix, USVI. Deployment release information for each individual female turtle. Carapace length (CCL)
was measured notch to tip.
Turtle
name
PTT
number
Carapace
length (cm)
PIT tag
number
RFF tag
number
LRF tag
number
PTT
deployment date
Time of
release
Deployment
location
Savannah #146259 115.5 AVID*076*321*559 LLC237 LLC134 8/1/2015 0026 St. Croix
Samantha #146260 118.5 AVID*076*299*058 LLC014 LLC015 8/4/2015 0005 St. Croix
Dionne #146261 105.4 None- no lay EEF314 EEF315 8/4/2015 2327 St. Croix
Victoria #146262 110.7 None- no lay LLC016 LLC017 8/5/2015 2310 St. Croix
Annette #146263 115.2 None- no lay LLC309 LLC308 10/22/2015 2219 St. Croix
Cheryl #146264 103.7 AVID*076*289*623 LLC406 LLC480 10/23/2015 0050 St. Croix
Emily #153482 110.3 AVID*076*285*088 LLC476 RRN953 10/23/2015 0215 St. Croix

41
Table 1.2. Turtle, tagging, and tracking data for seven female green turtles, Chelonia mydas, satellite tracked from the East
End beaches of St. Croix, USVI in 2015 and 2016. * means that PTT was still transmitting when the data were analyzed on 28
March, 2016. - means that there were not enough high LCs (3, 2, and 1) to calculate.
Turtle
name
PTT
number
Tagging
date
Tracking
period (d)
Overall
displacement
(km)
Final
detected
location
Size of
internesting
core
(km2)
Size of
internesting
activity
(km2)
Size of
post-nesting
core
(km2)
Size of
post-nesting
activity
(km2)
Size of
internesting
MCP size
(km2)
Size of
post-nesting
MCP size
(km2)
Savannah #146259 8/1/15 241* 23 St. Croix* 11.5 93.4 4.8 20.3 175.1 5.9
Samantha #146260 8/4/15 16 1 St. Croix - - - - - -
Dionne #146261 8/4/15 237* 28 St. Croix* 9.7 112 7.6 20.5 1,067.3 4.6
Victoria #146262 8/5/15 159 111 Vieques 4.4 19.2 5.6 21 6.6 9.3
Annette #146263 10/22/15 158* 215 Nevis* - - - - 52,923.9 1.5
Cheryl #146264 10/23/15 158* 219 Nevis* - - 4.0 14.5 - 6.2
Emily #153482 10/23/15 157* - St. Croix* - - - - 5.4 -
Mean size 8.5 74.9 5.5 19.1 10,835.7 5.5
SE 1.2 16.4 0.5 1.0 4,706.4 0.6

42
Table 1.3. PTT performance while attached to female green sea turtles, Chelonia mydas, tracked from East End beaches of St.
Croix, USVI utilizing SuperBondTM
epoxy resin and fast curing agent. Location class (LC) given with number of detections in
each class (percentage of total detections). * means that PTT was still transmitting when analyzes were conducted on 28
March, 2016.
Location Classes
Turtle
name
PTT
number
Tracking
duration (d) 3 2 1 0 A B
Total
detections
Savannah* #146259 241* 11 (0.34%) 19 (0.59%) 25 (0.78%) 10 (0.31%) 200 (6.24%) 2,941 (91.7%) 3206
Samantha #146260 16 1 (0.79%) 5 (3.94%) 4 (3.15%) 0 (0%) 11 (8.66%) 106 (83.5%) 127
Dionne* #146261 237* 26 (1.12%) 31 (1.34%) 25 (1.08%) 12 (0.52%) 271 (11.7%) 1,953 (84.3%) 2,318
Victoria #146262 159 82 (3.98%) 65 (3.15%) 39 (1.89%) 14 (0.68%) 308 (14.9%) 1,553 (75.4%) 2,061
Annette* #146263 158* 16 (0.99%) 23 (1.43%) 16 (0.99%) 11 (0.68%) 136 (8.45%) 1,408 (87.5%) 1,610
Cheryl* #146264 158* 32 (1.59%) 30 (1.49%) 22 (1.09%) 13 (0.64%) 178 (8.82%) 1,742 (86.4%) 2,017
Emily* #153482 157* 9 (0.56%) 8 (0.50%) 2 (0.12%) 3 (0.19%) 37 (2.31%) 1,543 (96.3%) 1,602
Totals
1,126 177 (1.37%) 181 (1.40%) 133 (1.03%) 63 (0.49%) 1,141 (8.82%) 11,246 (86.9%) 12,941

43
Table 1.4. Last inferred nest dates, length of internesting period, and length of post-nesting period for green sea turtles,
Chelonia mydas, satellite tracked from the East End beaches, USVI. Samantha (#146260) stopped transmitting after only 16 d
and, therefore, was not tracked during her post-nesting period. It was determined that Cheryl (#146264) laid her last nest of the
season on the East End beaches before the PTT was attached; therefore, Cheryl (#146264) was not tracked during her
internesting period. * means that the PTT was still transmitting when the data were analyzed on 28 March, 2016.
Turtle
name
PTT
number
Tag
deployment date
Last inferred
nest date
Length of tracked
internesting period (d)
Start date of
post-nesting period
Last
detection date
Length of tracked
post-nesting period (d)
Savannah #146259 8/1/2015 9/9/2015 39 9/23/2015 3/28/2016* 187*
Samantha #146260 8/4/2015 8/14/2015 10 - 8/20/2015 -
Dionne #146261 8/4/2015 10/8/2015 65 10/22/2015 3/28/2016* 158*
Victoria #146262 8/5/2015 10/2/2015 58 10/16/2015 1/12/2016 88
Annette #146263 10/22/2015 11/12/2015 21 11/26/2015 3/28/2016* 123*
Cheryl #146264 10/23/2015 No other nests - 11/4/2015 3/28/2016* 145*
Emily #153482 10/23/2015 11/16/2015 24 11/30/2015 3/28/2016* 119*

44
Table 1.5. Inferred nest dates after PTT deployment. Displacement is the straight-line
distance between origin of track and nest location. * means no nest was laid on the
deployment date. ** means that it was a confirmed nest (observed female nesting on
beach after PTT attachment). - means that value could not be calculated because there
was no previous nesting data.
Turtle
name
PTT
number
Tag
deployment date
Inferred nests
post-deployment
Internesting
interval (d)
Location
class
Nesting
location (country)
Displacement
(km)
Savannah #146259 8/1/2015
St. Croix
8/11/2015** 10 3 St. Croix 0.4
8/21/2015 10 2 St. Croix 2.4
9/1/2015 11 1 St. Croix 2.5
9/9/2015 8 3 St. Croix 0.4
Samantha #146260 8/4/2015
St. Croix
8/14/2015 10 2 St. Croix 0.6
Dionne #146261 8/4/2015*
St. Croix
8/7/2015 - 3 St. Croix 0.4
8/14/2015 7 3 St. Croix 17.6
8/23/2015 9 3 St. Croix 17.2
9/4/2015 12 2 St. Croix 0.9
9/14/2015 10 3 St. Croix 0.8
9/26/2015 12 3 St. Croix 0.8
10/8/2015 12 1 St. Croix 1.9
Victoria #146262 8/5/2015*
St. Croix
8/11/2015 - 3 St. Croix 0.3
8/17/2015** 6 3 St. Croix 0.8
8/26/2015 9 3 St. Croix 1.3
9/6/2015 11 3 St. Croix 0.5
9/19/2015 13 3 St. Croix 1.1
10/2/2015 13 3 St. Croix 0.2
Annette #146263 10/22/2015*
St. Croix
10/23/2015 - 3 St. Croix 0.8
11/1/2015 9 3 Antigua 303.1
11/12/2015 11 2 St. Kitts 185.6
Cheryl #146264 10/23/2015 No other nests - - St. Croix -
Emily #153482 10/23/2015*
St. Croix
10/24/2015** - 3 St. Croix 1.3
11/4/2015 11 2 St. Croix 0.6
11/16/2015 12 1 St. Croix 1.8
Mean 10.3
SE 0.09

45
Table 1.6. CCL (curved carapace length) and CCW (curved carapace width)
measurements and resident/migrant and neophyte/remigrant classifications for each
female green turtle, Chelonia mydas, tracked from the East End beaches of St. Croix,
USVI.
Turtle
name
PTT
number CCL CCW
Resident/
Migrant
Neophyte/
Remigrant
Savannah #146259 115.5 105.5 Resident Neophyte
Samantha #146260 118.5 104.4 - Neophyte
Dionne #146261 105.4 97.0 Resident Remigrant
Victoria #146262 110.7 103.0 Migrant Neophyte
Annette #146263 115.2 106.0 Migrant Neophyte
Cheryl #146264 103.7 94.0 Migrant Remigrant
Emily #153482 110.3 101.0 Resident Remigrant
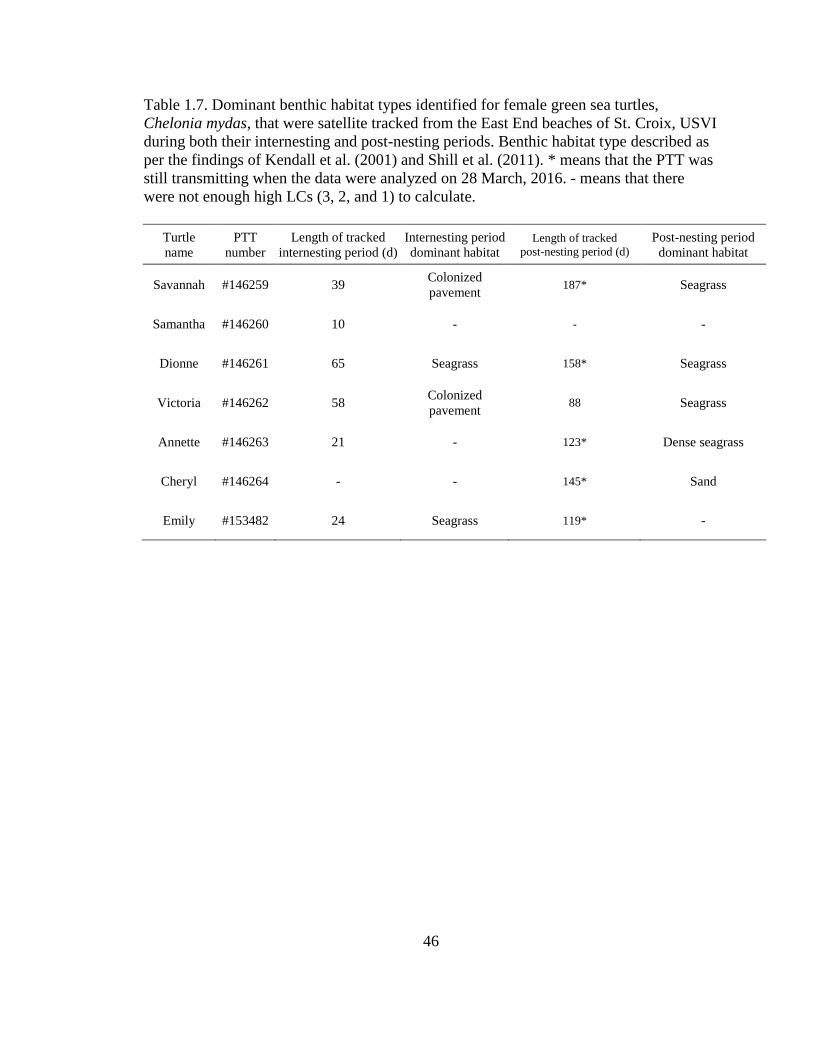
46
Table 1.7. Dominant benthic habitat types identified for female green sea turtles,
Chelonia mydas, that were satellite tracked from the East End beaches of St. Croix, USVI
during both their internesting and post-nesting periods. Benthic habitat type described as
per the findings of Kendall et al. (2001) and Shill et al. (2011). * means that the PTT was
still transmitting when the data were analyzed on 28 March, 2016. - means that there
were not enough high LCs (3, 2, and 1) to calculate.
Turtle
name
PTT
number
Length of tracked
internesting period (d)
Internesting period
dominant habitat Length of tracked
post-nesting period (d) Post-nesting period
dominant habitat
Savannah #146259 39 Colonized
pavement 187* Seagrass
Samantha #146260 10 - - -
Dionne #146261 65 Seagrass 158* Seagrass
Victoria #146262 58 Colonized
pavement 88 Seagrass
Annette #146263 21 - 123* Dense seagrass
Cheryl #146264 - - 145* Sand
Emily #153482 24 Seagrass 119* -

47
Figure 1.1. Wider Caribbean Region map (source: ANCO Maritime Activities Ltd).

48
Figure 1.2. Image utilized to describe seagrass from aerial photos and ground truthing by
Kendall et al. (2001).

49
Figure 1.3. Image utilized to describe colonized pavement from aerial photos and ground
truthing by Kendall et al. (2001).

50
Figure 1.4. Image utilized to describe macroalgae from aerial photos and ground truthing
by Kendall et al. (2001).

51
Figure 1.5. Image utilized to describe colonized pavement with sand channels from aerial
photos and ground truthing by Kendall et al. (2001).

52
Figure 1.6. Image utilized to describe sand from aerial photos and ground truthing by
Kendall et al. (2001).

53
Figure 1.7. Image utilized to describe dense seagrass from satellite images and
underwater transect videography by Schill et al. (2011).
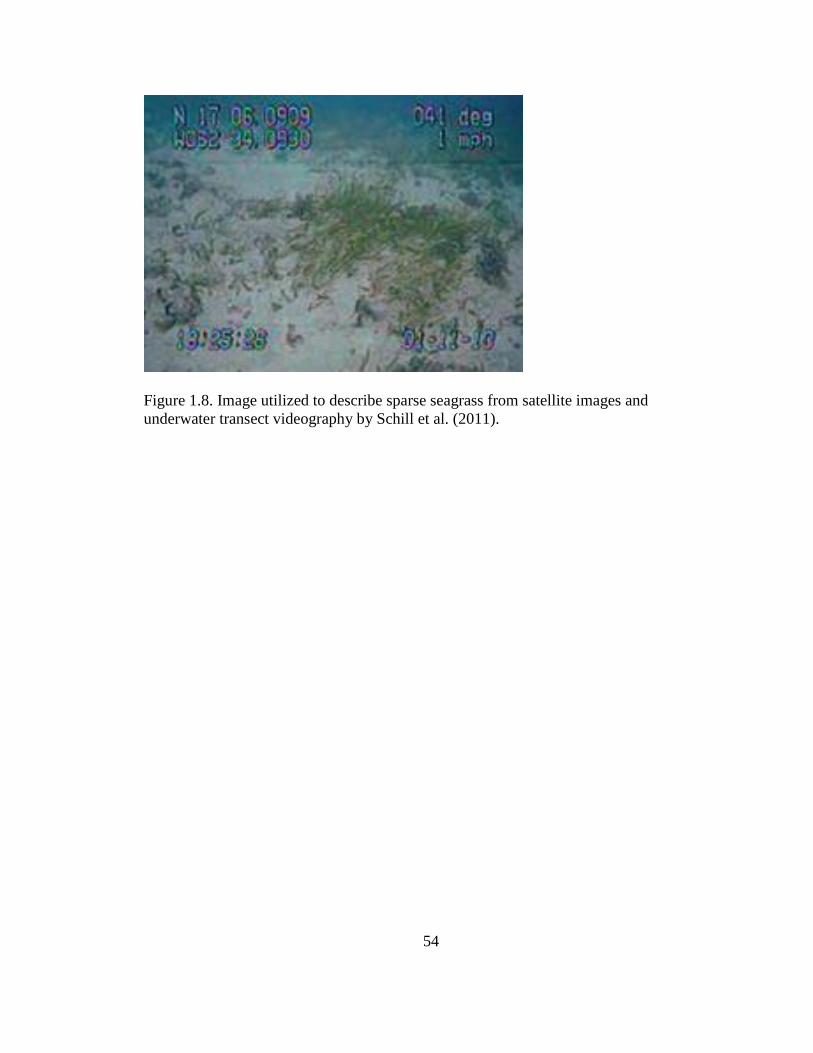
54
Figure 1.8. Image utilized to describe sparse seagrass from satellite images and
underwater transect videography by Schill et al. (2011).

55
Figure 1.9. Image utilized to describe Acropora palmata from satellite images and
underwater transect videography by Schill et al. (2011).
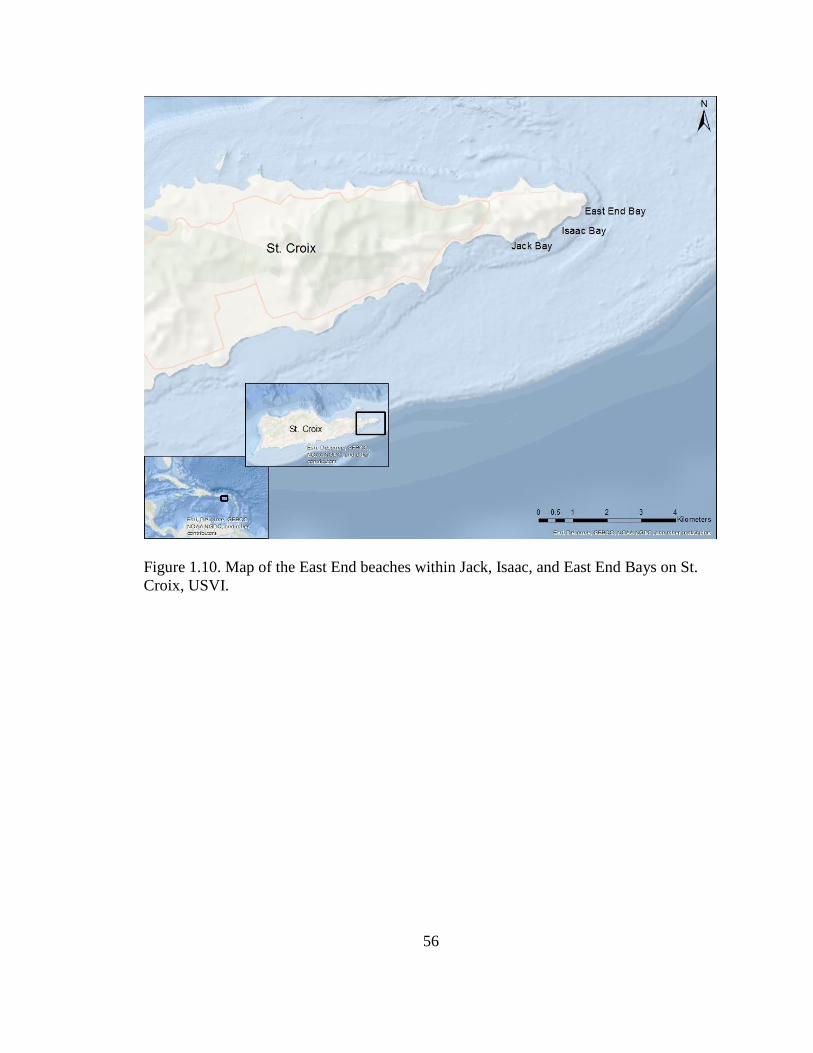
56
Figure 1.10. Map of the East End beaches within Jack, Isaac, and East End Bays on St.
Croix, USVI.

57
Figure 1.11. Diagram of suggested measurements for an adjustable corral to restrain an
adult green sea turtle while performing a transmitter attachment. Slits in the front and
back panels slide into those on the side panels and allow for the corral to be easily
adjusted based on the size of the turtle.

58
Figure 1.12. Map of satellite transmitter attachment locations for all seven female green
sea turtles, Chelonia mydas, tracked from the East End beaches of St. Croix, USVI.

59
Figure 1.13. Combined movement map of all seven satellite tracked female green turtles,
Chelonia mydas, from their nesting beach on the East End beaches of St. Croix, USVI in
August and October 2015 until 28 March 2016.

60
Figure 1.14. Total movement map of the female green turtle, Chelonia mydas, Samantha
(#146260) after 16 d of satellite tracking from the East End beaches of St. Croix, USVI.
Green star represents tagging location and pink triangle represents last detection location.

61
Figure 1.15. Total movement map of the female green turtle, Chelonia mydas, Savannah
(#146259) after 241 d of satellite tracking from the East End beaches of St. Croix, USVI.
Green star represents tagging location.

62
Figure 1.16. Total movement map of the female green turtle, Chelonia mydas, Dionne
(#146261) after 237 d of satellite tracking from the East End beaches of St. Croix, USVI.
Green star represents tagging location.

63
Figure 1.17. Total movement map of the female green turtle, Chelonia mydas, Emily
(#153482) after 157 d of satellite tracking from the East End beaches of St. Croix, USVI.
Green star represents tagging location.

64
Figure 1.18. Internesting movement map of the female green turtle, Chelonia mydas,
Savannah (#146259) after PTT attachment on the East End beaches of St. Croix, USVI.
Green star represents tagging location.
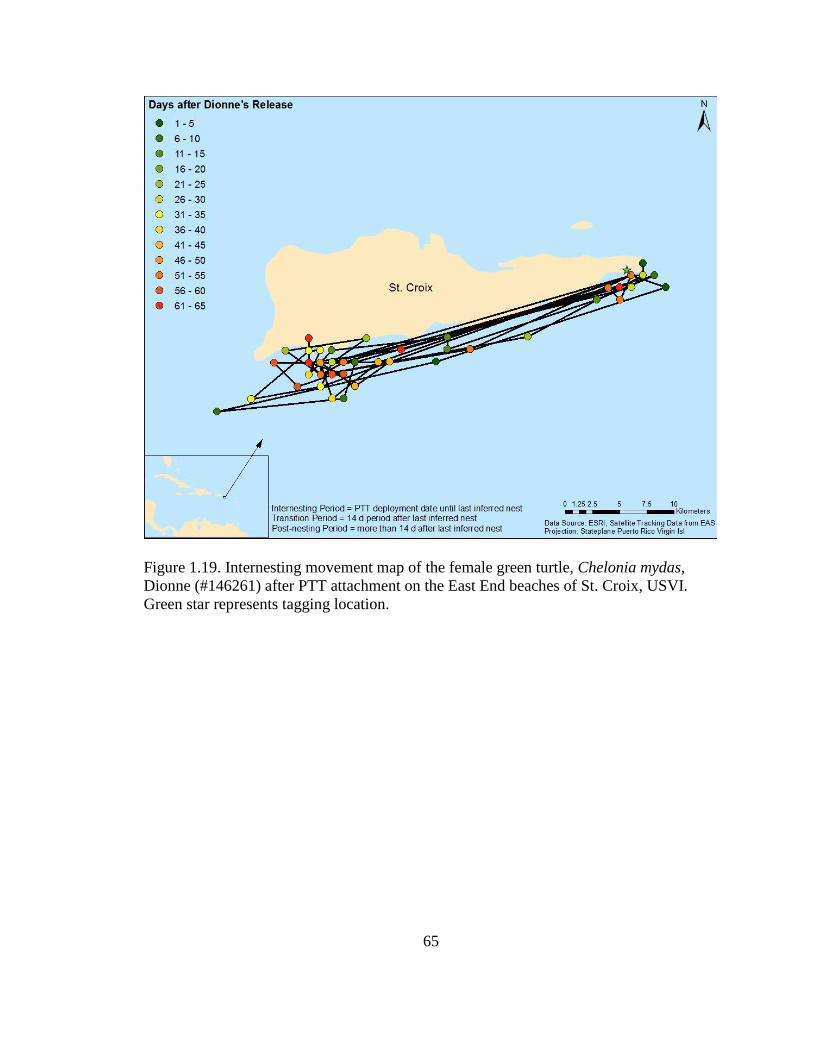
65
Figure 1.19. Internesting movement map of the female green turtle, Chelonia mydas,
Dionne (#146261) after PTT attachment on the East End beaches of St. Croix, USVI.
Green star represents tagging location.

66
Figure 1.20. Map of 50% core use (red) and 95% activity areas (yellow) of the female
green turtle, Chelonia mydas, Savannah (#146259) during her internesting period (39 d).

67
Figure 1.21. Map of 50% core use (red) and 95% activity areas (yellow) of the female
green turtle, Chelonia mydas, Dionne (#146261) during her internesting period (65d).

68
Figure 1.22. Map of habitat utilization of the female green turtle, Chelonia mydas,
Savannah (#146259) during her internesting period (39 d) including an outline of her
50% core use area (red). Pie chart shows percentages of each habitat type with less
prevalent habitat types displayed in dark purple.

69
Figure 1.23. Map of habitat utilization of the female green turtle, Chelonia mydas,
Dionne (#146261) during her internesting period (65 d) including an outline of her 50%
core use area (red). Pie chart shows percentages of each habitat type with less prevalent
habitat types displayed in dark purple.

70
Figure 1.24. Internesting movement map of the female green turtle, Chelonia mydas,
Emily (#153482) after PTT attachment on the East End beaches of St. Croix, USVI.
Green star represents tagging location.

71
Figure 1.25. Minimum convex polygon (MCP) for the internesting period movements of
the female green turtle, Chelonia mydas, Emily (#153482). Green star represents tagging
location.

72
Figure 1.26. Map of habitat utilization of the female green turtle, Chelonia mydas, Emily
(#153482) during her internesting period (24 d) including an outline of her minimum
convex polygon (MCP) for this period outlined in black. Pie chart shows percentages of
each habitat type with less prevalent habitat types displayed in dark purple.

73
Figure 1.27. Movement map of the female green turtle, Chelonia mydas, Savannah
(#146259) during her transition period after her last inferred nest.

74
Figure 1.28. Movement map of the female green turtle, Chelonia mydas, Dionne
(#146261) during her transition period after her last inferred nest.

75
Figure 1.29. Movement map of the female green turtle, Chelonia mydas, Emily
(#153482) during her transition period after her last inferred nest.

76
Figure 1.30. Post-nesting movement map of the female green turtle, Chelonia mydas,
Savannah (#146259).

77
Figure 1.31. Post-nesting movement map of the female green turtle, Chelonia mydas,
Dionne (#146261).

78
Figure 1.32. Post-nesting movement map of the female green turtle, Chelonia mydas,
Emily (#153482).

79
Figure 1.33. Map of 50% core use (red) and 95% activity areas (yellow) of the female
green turtle, Chelonia mydas, Savannah (#146259) during her post-nesting period (187
d).

80
Figure 1.34. Map of 50% core use (red) and 95% activity areas (yellow) of the female
green turtle, Chelonia mydas, Dionne (#146261) during her post-nesting period (158 d).

81
Figure 1.35. Map of habitat utilization of the female green turtle, Chelonia mydas,
Savannah (#146259) during her post-nesting period (187 d) including an outline of her
50% core use area (red). Pie chart shows percentages of each habitat type.

82
Figure 1.36. Map of habitat utilization of the female green turtle, Chelonia mydas,
Dionne (#146261) during her post-nesting period (158 d) including an outline of her 50%
core use area (red). Pie chart shows percentages of each habitat type.

83
Figure 1.37. Internesting movement map of the female green turtle, Chelonia mydas,
Victoria (#146262) after PTT attachment on the East End beaches of St. Croix, USVI.
Green star represents tagging location.

84
Figure 1.38. Total movement map of the female green turtle, Chelonia mydas, Victoria
(#146262) after 159 d of satellite tracking from the East End beaches of St. Croix, USVI.
Green star represents tagging location and pink triangle represents last detection location.

85
Figure 1.39. Movement map of the female green turtle, Chelonia mydas, Victoria
(#146262) during her transition period after her last inferred nest.
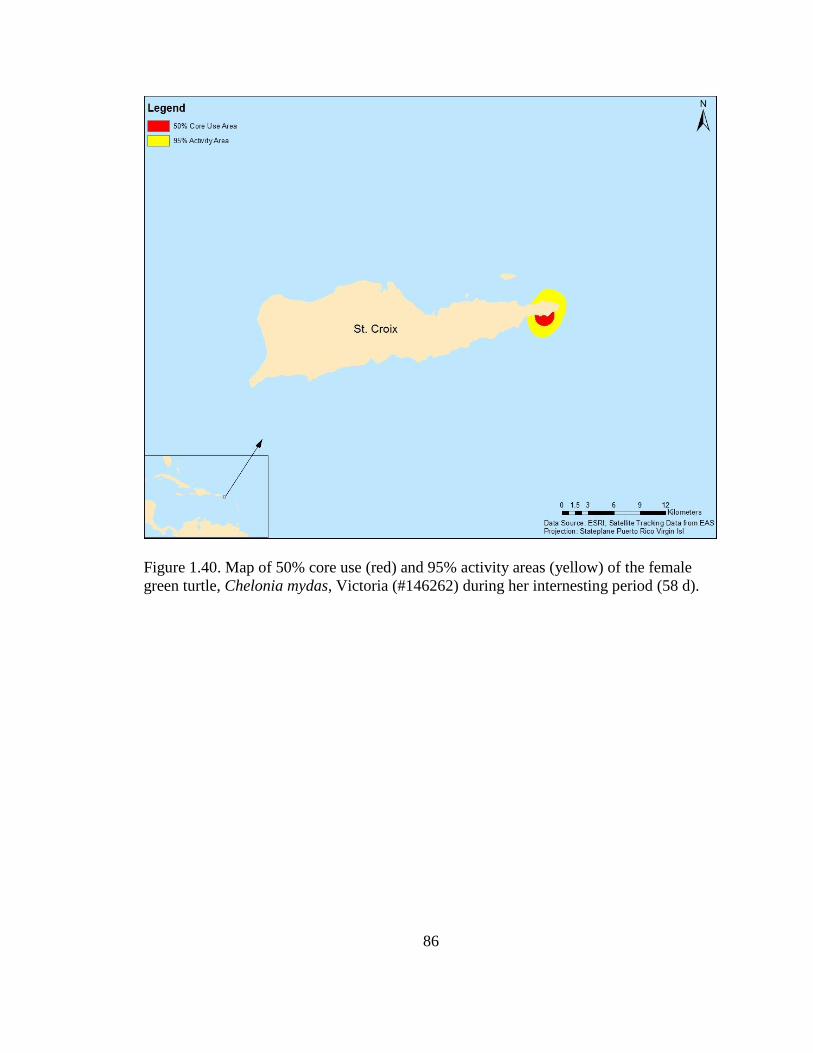
86
Figure 1.40. Map of 50% core use (red) and 95% activity areas (yellow) of the female
green turtle, Chelonia mydas, Victoria (#146262) during her internesting period (58 d).
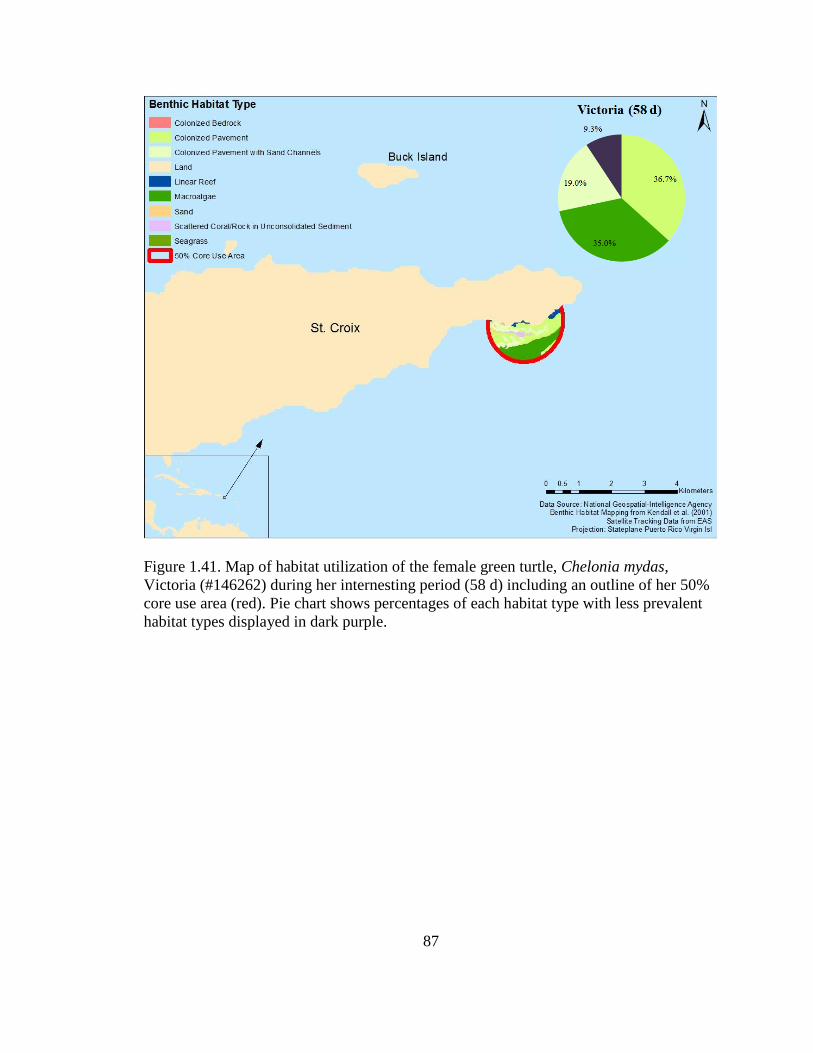
87
Figure 1.41. Map of habitat utilization of the female green turtle, Chelonia mydas,
Victoria (#146262) during her internesting period (58 d) including an outline of her 50%
core use area (red). Pie chart shows percentages of each habitat type with less prevalent
habitat types displayed in dark purple.

88
Figure 1.42. Post-nesting movement map of the female green turtle, Chelonia mydas,
Victoria (#146262). Pink triangle represents last detection location.

89
Figure 1.43. Map of 50% core use (red) and 95% activity areas (yellow) of the female
green turtle, Chelonia mydas, Victoria (#146262) during her post-nesting period (88 d).

90
Figure 1.44. Map of habitat utilization of the female green turtle, Chelonia mydas,
Victoria (#146262) during her post-nesting period (88 d) including an outline of her 50%
core use area (red). Pie chart shows percentages of each habitat type with less prevalent
habitat types displayed in dark purple.

91
Figure 1.45. Total movement map of the female green turtle, Chelonia mydas, Annette
(#146263) after 158 d of satellite tracking from the East End beaches of St. Croix, USVI.
Green star represents tagging location.
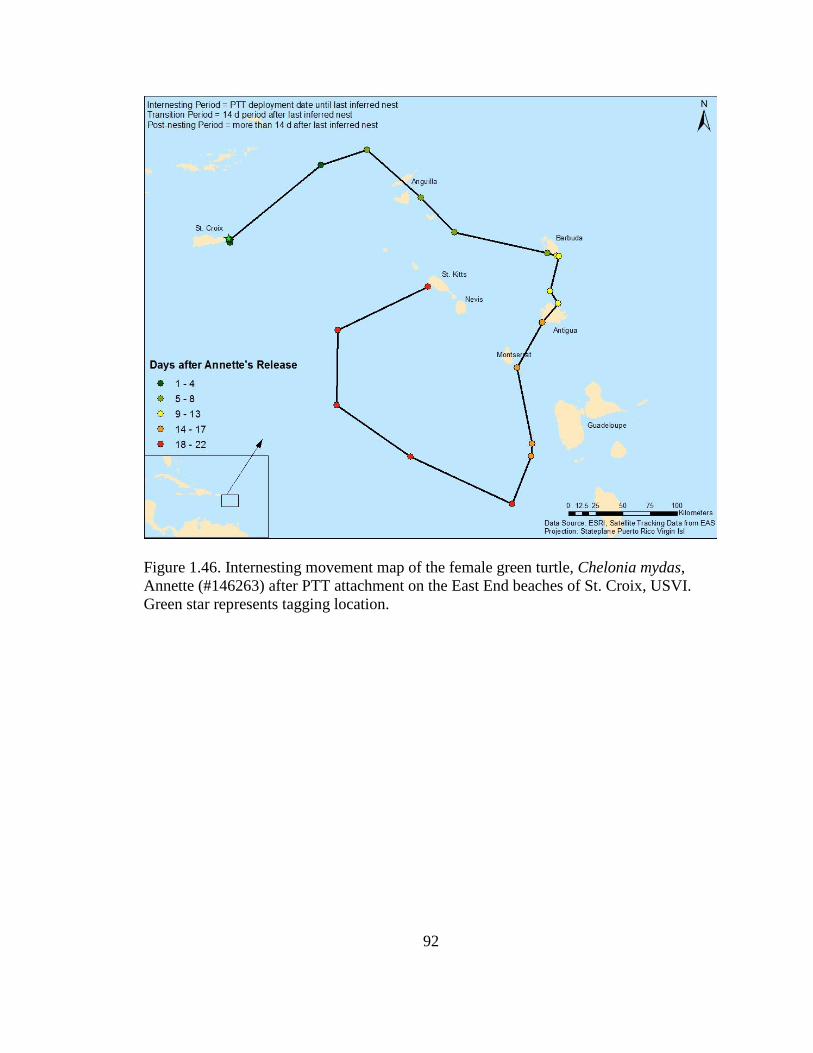
92
Figure 1.46. Internesting movement map of the female green turtle, Chelonia mydas,
Annette (#146263) after PTT attachment on the East End beaches of St. Croix, USVI.
Green star represents tagging location.

93
Figure 1.47. Minimum convex polygon (MCP) for the internesting period movements of
the female green turtle, Chelonia mydas, Annette (#146263). Green star represents
tagging location.

94
Figure 1.48. Movement map of the female green turtle, Chelonia mydas, Annette
(#146263) during her transition period after her last inferred nest.

95
Figure 1.49. Total movement map of the female green turtle, Chelonia mydas, Cheryl
(#146264) after 158 d of satellite tracking from the East End beaches of St. Croix, USVI.
Green star represents tagging location.

96
Figure 1.50. Movement map of the female green turtle, Chelonia mydas, Cheryl
(#146264) during her transition period after her last inferred nest. Green star represents
tagging location, which was also the location of her last inferred nest.

97
Figure 1.51. Post-nesting movement map of the female green turtle, Chelonia mydas,
Annette (#146263).

98
Figure 1.52. Post-nesting movement map of the female green turtle, Chelonia mydas,
Cheryl (#146264).

99
Figure 1.53. Minimum convex polygon (MCP) for the post-nesting period movements of
the female green turtle, Chelonia mydas, Annette (#146263).

100
Figure 1.54. Map of habitat utilization of the female green turtle, Chelonia mydas,
Annette (#146263) during her post-nesting period (123 d) including an outline of her
minimum convex polygon (MCP) for this period outlined in black. Pie chart shows
percentages of each habitat type with less prevalent habitat types displayed in dark
purple.

101
Figure 1.55. Map of 50% core use (red) and 95% activity areas (yellow) of the female
green turtle, Chelonia mydas, Cheryl (#146264) during her post-nesting period (145 d).

102
Figure 1.56. Map of habitat utilization of the female green turtle, Chelonia mydas, Cheryl
(#146264) during her post-nesting period (145 d) including an outline of her 50% core
use area (red). Pie chart shows percentages of each habitat type.

103
Figure 1.57. Habitat utilization charts representing benthic habitat types found within the core use areas (when >20 high LC points) or
minimum convex polygons (<20 high LC points) of female green sea turtles, Chelonia mydas, during their internesting period after
satellite tag deployment on the East End beaches of St. Croix, USVI. Benthic habitat type identified with data from Kendall et al.
(2001) and Schill et al. (2011).

104
Figure 1.58. Habitat utilization charts representing benthic habitat types found within the core use areas (when >20 high LC points) or
minimum convex polygons (<20 high LC points) of satellite-tracked female green sea turtles, Chelonia mydas, during their post-
nesting period after nesting on the East End beaches of St. Croix, USVI. Benthic habitat type identified with data from Kendall et al.
(2001) and Schill et al. (2011).

105
Figure 1.59. Benthic habitat mapping around the island of St. Croix conducted by
Kendall et al. (2001).

106
Figure 1.60. Benthic habitat mapping around the island of Vieques conducted by Kendall
et al. (2001).

107
Figure 1.61. Benthic habitat mapping around the islands of St. Kitts and Nevis conducted
by Schill et al. (2011).

108
Chapter 2: Genetic stock structure analysis of female green sea turtles, Chelonia mydas,
nesting on the East End beaches of St. Croix, USVI: a regional analysis

109
INTRODUCTION
The natal homing of sea turtles in which these animals return to nest on the beach
where they were hatched has been identified through the use of long-term flipper tag
studies (Carr, 1967). This homing indicates that sea turtle population genetics are
structured through female lineage (Bowen et al., 1992; Formia et al., 2007). Breeding site
fidelity makes mitochondrial DNA (mtDNA), which is maternally inherited, an excellent
tool for determining population structure in all sea turtle species (Bjorndal et al., 2006).
Mitochondrial DNA can be utilized to investigate genetic phylogeny on many different
sea turtles nesting beaches (Bowen et al., 1992; Formia et al., 2007). These different
nesting aggregations are referred to as rookeries (Bjorndal et al., 2006). Control region
sequencing has allowed for the identification of different haplotypes, specific genetic
mutations that are typically inherited together, which can be used to conduct stock
structure analyses. These analyses enable sea turtle conservation managers to identify
specific management units (MUs) that should be managed separately to maintain the
greatest genetic diversity within the population (Proietti et al., 2009).
Genetic analyses are being utilized to investigate the gene flow across populations
of green turtles throughout the Caribbean and the rest of the world. Tissue biopsies
(Bjorndal et al., 2006; Formia et al., 2006) or blood samples (Fitzsimmons, 1998;
Shamblin et al., 2012a) are utilized to conduct these analyses. Eighteen haplotypes and
two unique groups were identified within 147 females when the 510-bp control region of
mtDNA was analyzed for one Mediterranean and eight Atlantic populations of green
turtles (Encalada et al., 1996). The western Caribbean and Mediterranean groups shared
ten haplotypes in common and the eastern Caribbean, South Atlantic, and West Africa
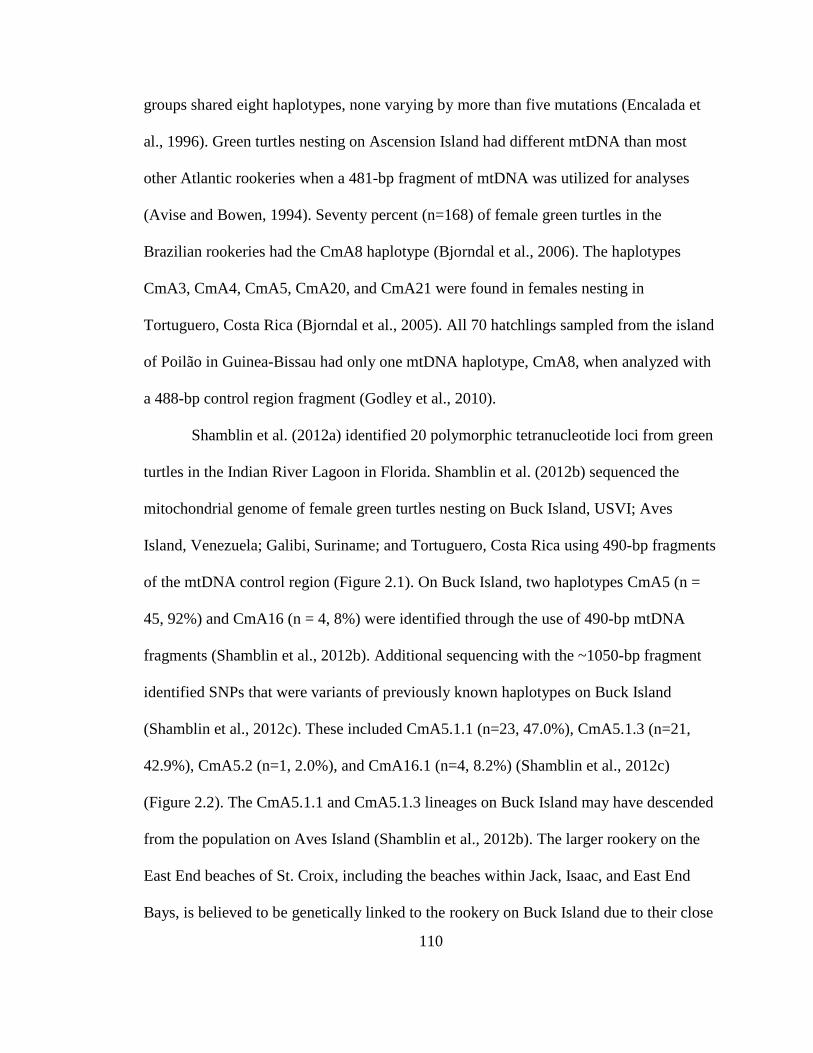
110
groups shared eight haplotypes, none varying by more than five mutations (Encalada et
al., 1996). Green turtles nesting on Ascension Island had different mtDNA than most
other Atlantic rookeries when a 481-bp fragment of mtDNA was utilized for analyses
(Avise and Bowen, 1994). Seventy percent (n=168) of female green turtles in the
Brazilian rookeries had the CmA8 haplotype (Bjorndal et al., 2006). The haplotypes
CmA3, CmA4, CmA5, CmA20, and CmA21 were found in females nesting in
Tortuguero, Costa Rica (Bjorndal et al., 2005). All 70 hatchlings sampled from the island
of Poilão in Guinea-Bissau had only one mtDNA haplotype, CmA8, when analyzed with
a 488-bp control region fragment (Godley et al., 2010).
Shamblin et al. (2012a) identified 20 polymorphic tetranucleotide loci from green
turtles in the Indian River Lagoon in Florida. Shamblin et al. (2012b) sequenced the
mitochondrial genome of female green turtles nesting on Buck Island, USVI; Aves
Island, Venezuela; Galibi, Suriname; and Tortuguero, Costa Rica using 490-bp fragments
of the mtDNA control region (Figure 2.1). On Buck Island, two haplotypes CmA5 (n =
45, 92%) and CmA16 (n = 4, 8%) were identified through the use of 490-bp mtDNA
fragments (Shamblin et al., 2012b). Additional sequencing with the ~1050-bp fragment
identified SNPs that were variants of previously known haplotypes on Buck Island
(Shamblin et al., 2012c). These included CmA5.1.1 (n=23, 47.0%), CmA5.1.3 (n=21,
42.9%), CmA5.2 (n=1, 2.0%), and CmA16.1 (n=4, 8.2%) (Shamblin et al., 2012c)
(Figure 2.2). The CmA5.1.1 and CmA5.1.3 lineages on Buck Island may have descended
from the population on Aves Island (Shamblin et al., 2012b). The larger rookery on the
East End beaches of St. Croix, including the beaches within Jack, Isaac, and East End
Bays, is believed to be genetically linked to the rookery on Buck Island due to their close

111
proximity (Figure 2.3). This genetic linkage would indicate that these turtles are within
the same management unit (Shamblin et al., 2012b). This idea was proposed by Shamblin
et al. (2012b) and was investigated further in the present study. Being able to connect
smaller rookeries to larger ones through genetic analysis will allow for a better
understanding of the gene flow and relatedness of green turtles throughout the Caribbean
(Shamblin et al., 2012b).
The green sea turtle has been classified into 11 distinct population segments
(DPSs) under the Endangered Species Act (ESA) based on genetic analyses conducted all
over the world (Figure 2.4). The Mediterranean, Central West Pacific, and Central South
Pacific DPSs are listed as endangered and all other DPSs are listed as threatened. The US
Virgin Island green turtle rookeries are classified within the South Atlantic DPS and
therefore are listed as threatened (66 Federal Register 81, 2016). The division of the
DPSs was based on haplotype distribution as well as known life history characteristics of
breeding populations from around the world. Only a few genetic studies have been
conducted to investigate the haplotypes of the green sea turtles nesting within this region
of the Caribbean; therefore, further research is needed to better delineate the North and
South Atlantic DPSs. The natal homing of these animals limits the amount of gene flow
from rookery to rookery (Schroeder, 2008) and highlights the importance of the
conservation of as many rookeries as possible to keep genetic variation within this
species (Avise and Bowen, 1994). The purpose of this study was to identify the dominant
haplotype present within the nesting female population on the East End beaches of St.
Croix, USVI and identify which DPS classification is appropriate for this rookery.

112
MATERIALS AND METHODS
A total of 60 skin biopsy samples were collected from nesting female green sea
turtles during the 2012-2015 nesting seasons by The Nature Conservancy (TNC) on the
East End beaches of St. Croix. A 6-mm biopsy punch was utilized for collection during
the egg-laying process and skin samples were stored in vials in a saline solution as
described by Dutton and Balazs (1995). Each female turtle was identified with flipper or
PIT tags to ensure that the same female was not sampled more than once. Samples were
sent to the NOAA Southwest Fisheries Science Center Marine Mammal and Turtle
Molecular Research Sample Collection (La Jolla, CA, USA) for analysis. DNA was
isolated utilizing a Corbett CAS-1200 extraction robot (Corbett Robotics, San Francisco,
CA; Dutton et al., 2008). An ~820-bp fragment was amplified at the 5’ end of the control
region of the mitochondrial genome using the primers LCM15382
(GCTTAACCCTAAAGCATTGG) and H950 g with polymerase chain reaction (PCR)
procedures (Abreu-Grobois et al., 2006; Dutton et al., 2007). The 25 μL PCR reaction
was comprised of 18 μL purified H20, 2.5 μL of 10x Mg buffer, 1.5 μL DNTPs, 1 μL (20-
50 ng) of template DNA, 0.75 μL of each primer, and 0.5 μL of Taq polymerase. The
PCR was performed as follows: initial DNA denaturation at 94°C for two min, followed
by 36 cycles of (1) DNA denaturation at 94°C for 50 sec, (2) annealing of primers at
52°C for 50 sec, and (3) extension of primers at 72°C for one min, and (4) extension of
primers at 72°C for five min. In order to detect for contamination, negative controls were
included in each PCR. The products were purified and sequenced utilizing procedures
similar to Dutton et al. (2014). Haplotypes were identified and classified based on the
publications on the Archie Carr Center for Sea Turtle Research website

113
(http://accstr.ufl.edu/resources/mtdna-sequences/). Analysis of molecular variance
(AMOVA) was conducted utilizing both Fst and ϕst measures in Arlequin v 3.5.1.2
(Excoffier and Lischer, 2010) using 10,000 permutations to test for population structure.
The Fst and exact test were used to calculate significance in genetic variation between the
East End beaches and Buck Island rookeries.
RESULTS
The haplotypes identified on the East End beaches of St. Croix were CmA3.1,
CmA5.1, and CmA5.2. The haplotype CmA5.1 was most common (n=53, 91.4%) and
CmA3.1 (n=4, 6.9%) was the second most common. Only 58 out of the 60 tissue samples
were analyzed as one was incorrectly collected from a hawksbill and another was a
pseudoreplicate obtained from a female that had previously been sampled. Comparison of
haplotypes that have been identified utilizing the ~800 bp mtDNA control region
fragment within other Caribbean and Atlantic green sea turtle rookeries are listed in
Table 2.1. The Fst results indicated that there was no significant difference between the
genetic variability of the Buck Island and East End beach rookeries; however, the exact
tests results did reveal a significant difference between the two rookeries.
DISCUSSION
The major findings of this study were that the dominant haplotype on the East
End beaches is CmA5.1 and the classification of this rookery into the South Atlantic DPS
was correct. There was not complete evidence that the Buck Island and East End beach
rookeries should be classified as two separate management units (MUs) because there

114
were differences in the Fst and exact test results. Both the East End beaches and Buck
Island nesting populations were both dominated by the CmA5.1 haplotype indicating that
both of these rookeries were correctly classified into the South DPS. Mitochondrial DNA
genetic analyses allow for conservation managers to identify and recognize certain
rookeries that are more impacted by threats not on or near the nesting beach (Formia et
al., 2006). It has been suggested that regional analyses of population threats be conducted
to identify MUs in greatest need of conservation (Godfrey and Godley, 2008). Different
temporal breeding between the northern and southern hemispheres likely limits genetic
intersecting; however, there is year-round breeding in some rookeries (Naro-Maciel et al.,
2014).
Even though the CmA3.1 haplotype was present in the East End beach rookery, it
was relatively rare and did not provide enough evidence against the classification of the
East End beaches rookery within the South Atlantic DPS. However, it is worth
mentioning that the CmA3 haplotype is dominant in the Northwestern Caribbean.
Analyses of additional tissue samples could identify the overall distribution of the
CmA3.1 haplotype within the East End beach rookery. The amount of genetic variability
within the East End beach rookery could then be more accurately compared to the
variability within the Buck Island rookery. Maintaining genetic diversity within the green
sea turtle population is vital for the conservation of this species. The marginal results of
significance based on the Fst and exact test results of genetic variability indicated that
further analyses need to be conducted to conclusively state if two separate MUs exist in
this region. The exact test is more sensitive, so there was some indication of
differentiation between these rookeries, but it should be investigated further, with

115
additional samples from the East End beaches. The presence of the CmA3 haplotype at
the East End beaches, but not within the Buck Island population indicated that there was
some genetic differentiation between these rookeries. If additional analyses are able to
identify these rookeries as separate MUs, this would be a significant finding as Buck
Island and the East End beaches are separated by less than ten km and would be the first
reported distinct MUs that are separated by such a small distance.
Sequencing outside of the 817-bp control region has found single nucleotide
polymorphisms (SNPs) that allowed for the differentiation of the CmA5.1 haplotype into
CmA5.1.1, CmA5.1.2, and CmA5.1.3 (Shamblin et al., 2012b). The haplotype CmA3.1
only represented 7% of the samples (n=67) analyzed at Aves Island utilizing the 817-bp
control region (Shamblin et al., 2012b). Utilizing pairwise FST values when comparing the
817-bp control regions, significant differentiation was identified between the rookery at
Tortuguero and those at Buck Island, Aves Island, and Galibi (Shamblin et al., 2012b).
Shamblin et al. (2012b) recommended investigating these same CmA5.1 SNPs for
genetic comparison to the greens nesting on the East End beaches of St. Croix. Utilizing
SNPs to further delineate mtDNA haplotypes identified in other parts of the Caribbean
would be the best way to visualize the connectivity of these populations (Shamblin et al.,
2012b). Continued analysis of the tissue samples from the East End beaches rookery
utilizing genetic struck analysis could identify whether the green turtle rookery on Buck
Island should be classified as separate MUs.
Genetically different rookeries must be managed independently due to the
maternal-basis for genetic diversity (Bowen et al., 1992). The distance between the
nesting beaches plays a role, but does not appear to be the determining factor for

116
rookeries being classified as separate MUs. Rookeries in the Rocas Atoll and Fernando
de Noronha (off the coast of Brazil) were found to be genetically different with the
mtDNA sequencing of the 817-bp control region even though these rookeries are only
150 km apart (Shamblin et al., 2015a). Introduction of novel haplotypes to nesting
beaches are not likely because of the natal homing behavior of female sea turtles (Bowen
et al., 1992). In the Caribbean there may be more “leakage” (females utilizing other
nesting beaches) than first thought by Bowen et al. (1992) due to the close proximity of
the islands as noted by Esteban et al. (2015) and Schultz (unpublished data). Bjorndal et
al. (2005) also mentioned these natal homing “mistakes,” but explains that genetic
analyses have shown that these occurrences are rare. Genetics studies, in combination
with traditional tagging (flipper and PIT tags) and satellite telemetry, will allow for
conservation managers to understand the true movements and behaviors of turtles from
specific rookeries. Genetic analyses will allow managers to identify which rookeries have
lower genetic diversity and are therefore in need of greater conservation efforts.
The results of this study help to clarify the distinct population segment (DPS)
boundaries for the green sea turtle population within the eastern Caribbean region. The
US Virgin Islands green turtle rookeries have been classified into the South Atlantic DPS
(66 Federal Register 81, 2016), but there have been relatively few genetic studies
conducted within the Caribbean near the dividing line between the North and South
Atlantic DPSs. It is vital to clarify this haplotype boundary to identify the genetic
variability within this region and to ensure that the green turtles nesting on St. Croix are
managed with other nesting populations of similar haplotypes. Rookeries of similar

117
genetic structure should be managed together to ensure that conservation measures are
distributed to all areas of genetic diversity.
Future work should utilize mitogenomic markers to separate out specific
haplotypes; since the Buck Island CmA5.1 haplotype breaks down into two variants with
additional mitogenomic markers. Conducting this analysis on the females nesting on the
East End beaches may provide more insight into the complexity of these rookeries.
Shamblin et al. (2012b) hypothesized that the CmA5.1.1 and CmA5.1.3 haplotypes
originated from the Aves Island rookery. The spread of genetic diversity is believed to be
a result of the erosion of Aves Island and the lack of proximity of other islands to this
nesting beach (Shamblin et al., 2012b). The closest islands to Aves Island are in the
Lesser Antilles, 175 km away (Shamblin et al., 2012b).
The identification of the dominant haplotype (CmA5.1) within the East End
beaches rookery is just the first step for completing a genetic stock analysis for this
rookery. Use of SNPs to further differentiate the CmA5.1 haplotype will help determine
if there is great enough genetic variability within these rookeries to definitively classify
them as two separate MUs. Identification of differences in genetic variability within such
a small geographic region would provide evidence that there may be more genetic
variability within the green turtle population than understood from current research and
that more studies need to be conducted to identify if this is occurring within other
rookeries around the world. Analyzes of additional samples from the East End beach
rookery will identify if there is enough genetic variation between this and the Buck Island
rookery to classify them as separate MUs. Further genetic analyses should also include
the truncation of the control region to ~400 bp to allow for better comparison of other

118
green turtle genetic analyses throughout the Caribbean. This study is the first step to
better understanding the genetic variability present within the green turtle rookeries in St.
Croix and additional analyses are needed to fully identify the diversity present in this
region.

119
LITERATURE CITED
Abreu-Grobois, F.A., J.A. Horrocks, A. Formia, P.H. Dutton, R. LeRoux, and X. Velez-
Zuazo. 2006. New mtDNA D-loop primers which work for a variety of marine
turtle species may increase the resolution of mixed stock analysis. Pg. 179 in
Frick, M., A. Panagopoulous, A.F. Rees, K. Williams, eds. Proceedings of the 26th
annual symposium on sea turtle biology, Book of Abstracts. ISTS, Island of Crete,
Greece.
Avise, J.C. and B.W. Bowen. 1994. Investigating sea turtle migration using DNA
markers. Current Opinion in Genetics and Development 4:882-886.
Bjorndal, K.A., A.B. Bolten, L. Moreira, C. Bellini, and M.A. Marcovaldi. 2006.
Population structure and diversity of Brazilian green turtle rookeries based on
mitochondrial DNA sequences. Chelonian Conservation and Biology 5(2):262-
268.
Bjorndal, K.A., A.B. Bolten, and S. Troëng. 2005. Population structure and genetic
diversity in green turtles nesting at Tortuguero, Costa Rica, based on
mitochondrial DNA control region sequences. Marine Biology 147:1449-1457.
Bowen, B.W., A.B. Meylan, J.P. Ross, C.J. Limpus, G.H. Balazs, and J.C. Avise. 1992.
Global population structure and natural history of the green turtle (Chelonia
mydas) in terms of matriarchal phylogeny. Evolution 46(4):865-881.
Carr, A. F. 1967. So excellent a fishe: a natural history of sea turtles. Scribner, New
York, New York.
Dutton, P.H. and G.H. Balazs. 1995. Simple biopsy technique for sampling skin for DNA
analysis of sea turtles. Marine Turtle Newsletter 69:9-10.
Dutton, P.H., C. Hitipeuw, M. Zein, S.R. Benson, and S.M. Al-Ghais. 2007. Status and
genetic structure of nesting populations of leatherback turtles (Dermochelys
coriacea) in the Western Pacific. Chelonian Conservation Biology 6:47-53.
Dutton, P.H., M.P. Jensen, A. Frey, E. LaCasella, G.H. Balazs, P. Zárate, O. Chassin-
Noria, A. L. Sarti-Martinez, and E. Velez. 2014. Population structure and
phylogeography reveal pathways of colonization by a migratory marine reptile
(Chelonia mydas) in the central and eastern Pacific. Ecology and Evolution
4(22):4317-31.
Encalada, S.E., P.N. Lahanas, K.A. Bjorndal, A.B. Bolten, M.M. Miyamoto, and B.W.
Bowens. 1996. Phylogeography and population structure of the Atlantic and
Mediterranean green turtle Chelonia mydas: a mitochondrial DNA control region
sequence assessment. Molecular Ecology 5:473-483.

120
“Endangered and threatened wildlife and plants; final rule to list eleven distinct
population segments of the green sea turtle (Chelonia mydas) as endangered or
threatened and revision of current listings under the Endangered Species Act;
final rule,” 81 Federal Register 66 (6 April 2016), pp. 20057-20090.
Esteban, N., R.P. van Dam, E. Harrison, A. Herrera, and J. Berkel. 2015. Green and
hawksbill turtles in the Lesser Antilles demonstrate behavioural plasticity in inter-
nesting behaviour and post-nesting migration. Marine Biology 162:1153-1163.
Excoffier, L. and H.E. L. Lischer. 2010. Arlequin suite ver 3.5: A new series of programs
to perform population genetics analyses under Linux and Windows. Molecular
Ecology Resources 10:564-567.
Fitzsimmons, N.N. 1998. Single paternity of clutches and sperm storage in the
promiscuous green turtle (Chelonia mydas). Molecular Ecology 7:575-584.
Formia, A., A.C. Broderick, F. Glen, B.J. Godley, G.C. Hays, and M.W. Bruford. 2007.
Genetic composition of the Ascension Island green turtle rookery based on
mitochondrial DNA: implications for sampling and diversity. Endangered Species
Research 3:145-158.
Formia, A., B.J. Godley, J.F., Dontaine, and M.W. Bruford. 2006. Mitochondrial DNA
diversity and phylogeography of endangered green turtle (Chelonia mydas)
populations in Africa. Conservation Genetics 7:353-369.
Godley, B.J., C. Barbosa, M. Bruford, A.C. Broderick, P. Catry, M.S. Coyne, A. Formia,
G.C. Hays, and M.J. Witt. 2010. Unraveling the migratory connectivity in marine
turtles using multiple methods. Journal of Applied Ecology 47:769-778.
Madden, D., J. Ballestero, C. Calvo, R. Carlson, E. Christians, and E. Madden. 2008. Sea
turtle nesting as a process influencing a sandy beach ecosystem. Biotropica
40(6):758-765.
Naro-Maciel, E., B.N. Reid, S.E. Alter, G. Amato, K.A. Bjorndal, A.B. Bolten, M.
Martin, C.J. Nairn, B. Shamblin, and O. Pineda-Catalan. 2014. From refugia to
rookeries: phylogeography of Atlantic green turtles. Journal of Experimental
Marine Biology and Ecology 461:306-316.
Proietti, M.C., P. Lara-Ruiz, J.W. Reisser, L. da Silva Pinto, O.A. Dellagostin, and L.F.
Marins. 2009. Green turtles (Chelonia mydas) foraging at Arvoredo Island in
Southern Brazil: Genetic characterization and mixed stock analysis through
mtDNA control region haplotypes. Genetics and Molecular Biology 32(3):613-
618.

121
Schroeder, B. 2008. Case study: Petition to reclassify two “subpopulations” of the
loggerhead turtle (Caretta caretta) as distinct population segments. An article in
Conservation units of managed fish, threatened, or endangered species, and
marine mammals, NOAA Technical Memorandum NMFS-OPR-37, 100p.
Shamblin, B.M. D.A. Bagley, L.M. Ehrhart, N.A. Desjardin, R.E. Martin, K.M. Hart, E.
Naro-Maciel, K. Rusenko, J. C. Stiner, D. Sobel, C. Johnson, T.J. Wilmers, L.J.
Wright, C.J. Nairn. 2015b. Genetic structure of Florida green turtle rookeries as
indicated by mitochondrial DNA control region sequences. Conservation Genetics
16:673-685.
Shamblin, B.M., B.E. Berry, D.M. Lennon, D.A. Bagley, L.M. Ehrhart, and C.J. Nairn.
2012a. Tetranucleotide microsatellite loci from the endangered green turtle
(Chelonia mydas). Conservation Genetics Resources 4(3):783-785.
Shamblin, B.M., K.A. Bjorndal, A.B. Bolten, Z.M. Hillis-Starr, I. Lundgren, E. Naro-
Maciels, and C.J. Nairn. 2012b. Mitogenomic sequences better resolve stock
structure of southern Greater Caribbean green turtle rookeries. Molecular Ecology
21:2330-2340.
Shamblin, B.M., K.A. Bjorndal, A.B. Bolten, and C.J. Nairn. 2012c. Natal homing by an
adult male green turtle at Tortuguero, Costa Rica. Marine Turtle Newsletter
134:21-22.
Shamblin, B.M., P.H. Dutton, K.A. Bjorndal, A.B. Bolten, E. Naro-Maciel, A.J.B.
Santos, C. Bellini, C. Baptistotte, M.A. Marcovaldi, and C.J. Nairn. 2015a.
Deeper mitochondrial sequencing reveals cryptic diversity and structure in
Brazilian green turtle rookeries. Chelonian Conservation and Biology 14(2):167-
172.
The Nature Conservancy’s St. Croix sea turtle monitoring and protection plan. 2011.

122
Table 2.1. Haplotype frequencies of the green sea turtle, Chelonia mydas, with ~800 bp
fragment analyses of mtDNA from control region from within the Wider Caribbean
Region.
Haplotype East End beaches Buck Island Aves Island Galibi
CmA3.1 4 - 5 1
CmA5.1 53 44 48 55
CmA5.2 1 1 14 -
CmA6.1 - - - 2
CmA16.1 - 4 - -
Sample size 58 49 67 58
References Present study Shamblin et al. (2012b)
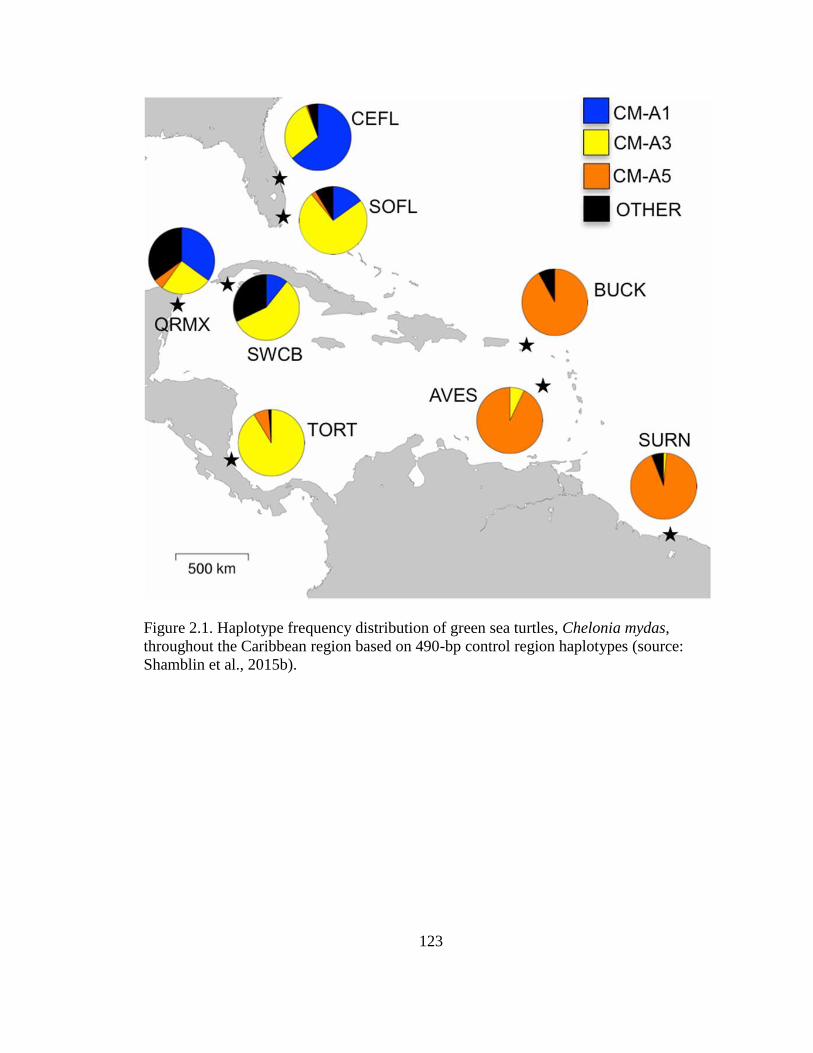
123
Figure 2.1. Haplotype frequency distribution of green sea turtles, Chelonia mydas,
throughout the Caribbean region based on 490-bp control region haplotypes (source:
Shamblin et al., 2015b).

124
Figure 2.2. Haplotype frequency distribution of green sea turtles, Chelonia mydas,
throughout the Caribbean region based on 490-bp control region haplotypes (histograms),
including mtDNA variations of the Cm-A5 haplotype (pie charts) (source: Shamblin et
al., 2012c).

125
Figure 2.3. Map identifying Buck Island and the East End beaches, which are adjacent to
East End, Isaac, and Jack Bay.

126
Figure 2.4. Map of green sea turtle, Chelonia mydas, distinct population segments
(DPSs): (1)North Atlantic, (2)Mediterranean, (3)South Atlantic, (4)Southwest Indian,
(5)North Indian, (6)East Indian-West Pacific, (7)Central West Pacific, (8)Southwest
Pacific, (9)Central South Pacific, (10)Central North Pacific, (11)East Pacific. The
Mediterranean, Central West Pacific, and Central South Pacific are listed under the
Endangered Species Act as endangered and all other DPSs are listed as threatened
(source: 66 Federal Register 81, 2016).

127
Chapter 3: Summary statistics of green sea turtle, Chelonia mydas, nesting data from the
East End beaches of St. Croix, USVI and recommendations for long-term sea turtle
nesting data collection and management

128
INTRODUCTION
The timing and length of the nesting season of green sea turtles, Chelonia mydas,
varies worldwide (Yasuda et al., 2006). Green turtles lay nests year round in some areas,
such as on Huyong Island, Thailand (Yasuda et al., 2006) and only during part of the year
in others. Green turtles nest in the British Virgin Islands throughout the year, but have a
primary nesting season between June and September with the largest peak in August
(McGowan et al., 2008). In the Cayman Islands, green turtles nest from July through
September with a peak in August (Aiken et al., 2001). At the largest green turtle rookery
in the Western Hemisphere, Tortuguero, Costa Rica, nesting occurs primarily between
June and November with a peak in August (Vander Zanden et al., 2012). Chelonia mydas
nests year round on the East End beaches of St. Croix, including the beaches within Jack,
Isaac, and East End Bays (Figure 3.1), but have a peak nesting period between July and
September (TNC, 2011).
Sea turtle fisheries worldwide have contributed to the decline in sea turtle
populations over the past few decades. Some legal sea turtle fisheries still exist in parts of
the world and have reduced the number of adult sea turtles (Bell et al., 2005; McGowan
et al., 2008). Up to 84 adult sea turtles can be legally captured each year in the turtle
fishery in the Cayman Islands (Bell et al., 2007). Green sea turtles were the only species
permitted for legal take in all of the 42 sea turtle fisheries investigated in a study by
Humber et al. (2014). An estimated 42,000 sea turtles are captured each year in these
legal sea turtle fisheries, with green turtles making up 80% of those catches (Humber et
al., 2014). Most of these legal fisheries are concentrated in the Caribbean and Indo-
Pacific region (Humber et al., 2014). Several illegal sea turtle fisheries also exist globally

129
(Humber et al., 2014). Sea turtle meat is considered a delicacy in some cultures, which is
why these international fisheries still exist. However, the overharvesting and illegal take
of green turtles may be contributing to their threatened and endangered status by creating
unsustainable populations (McGowan et al., 2008).
Human development of beaches and pollution are other major threats to the green
sea turtle population. Sea turtles have many threats as hatchlings and juveniles, but once
full grown their only predators are sharks and humans (McGowan et al., 2008). Threats
on the beach can limit the turtle population even before the hatchlings reach the water.
The tropical fire ant, Solenopsis geminata, has been found to be a major threat to
hatchlings as a single sting greatly decreases the chance of survival for a hatchling
(Wetterer et al., 2010). These ants are been prevalent on the beaches on the west end of
St. Croix, US Virgin Islands at Sandy Point National Wildlife Refuge (Wetterer et al.,
2010). High human presence and lack of beach isolation were found to be the major
negative influences reducing the number of green turtles nesting on a beach in Ras Al-
Hadd, Oman between 1998 and 2000 (AlKindi et al., 2006). Both natural and
anthropogenic threats have and continue to lead to the decline of sea turtle populations in
many areas of the world.
The presence of C. mydas is vital to maintaining healthy beach and marine
ecosystems. Eggshells and unhatched turtles provide nutrients to the vegetation, and
robust vegetation prevents beach erosion (TNC, 2011). The nutrients left on the beach
from sea turtle nesting provides great resources and habitats for small animals that live
there (Madden et al., 2008). High-density nesting areas in Tortuguero, Costa Rica had
significantly more nitrogen (248 kg/km) and phosphorus (14 kg/km) when compared to

130
areas of lower nest density (Vander Zanden et al., 2012). The green sea turtle is one of
the few animals that feed on seagrasses (TNC, 2011). The presence of these turtles is
vital for the survival of seagrasses, which need to be grazed upon to regenerate and grow
(TNC, 2011). Thalassia testudinum, or turtle grass as it is more commonly known,
provides vital habitat for at least 85 taxonomic groups in the Virgin Islands National
Park, St. John, USVI (Bologna et al., 2008). Animals utilize these seagrass beds as
breeding and nursery grounds (Bologna et al., 2008). Without the presence of sea turtles,
the grasses would be unlikely to regenerate effectively, which may lead to a decline in the
health of seagrass beds around the world. Chelonia mydas are essential parts of both the
marine and beach environments and should be protected as such. Sea turtles are
charismatic megafauna that are utilized by many to promote the restoration of the marine
environment (Blumenthal et al., 2006). The conservation of the ocean protects the habitat
of not only these turtles, but many other organisms as well. Sea turtle nesting beaches and
areas where these turtles reside in the open ocean contribute largely to ecotourism in
these areas. It is necessary to increase the threatened and endangered sea turtle
populations around the world to maintain both healthy ecosystems and economies.
Actual population estimates of sea turtles are difficult to obtain because these
animals spend the majority of their lives in the open ocean, with females typically only
returning to beaches to nest. The life-history traits of sea turtles as well as unknown
immature turtle survival rates make sea turtle population changes difficult to study. It has
been predicted that sea turtles can live up to 100 years and likely do not reach maturity
until between the ages of 18 and 33 (Frazer and Ehrhart, 1985). Night-time monitoring of
sea turtle nesting beaches, including tagging nesting females and excavating nests, helps

131
researchers collect data on these species. Since nesting behavior can differ dependent on
the species, location of the nesting beach, and each individual female, it is necessary to
conduct monitoring on many sea turtle nesting beaches all around the world to gather as
much data as possible for each individual species.
The number of eggs laid per nest (clutch size), number of nests laid by a single
female in a season (clutch frequency), and the nest depth vary with each female. The
clutch size ranged from 80 to 130 eggs on Huyong Island, Thailand (Gomuttapong et al.,
2013). On Alagadi Beach in northern Cyprus in 1998, the average clutch size was 109.4
(SD=24.4, n=29) (Glen et al., 2005). Females typically lay two to eight nests each season
(Weber et al., 2013), but average clutch frequencies range from four to seven clutches per
season on Huyong Island, Thailand (Yasuda et al., 2006) and average 5.9±0.2 clutches
per season on Ascension Island (Weber et al., 2013).
The incubation period and nest success rate can vary greatly from beach to beach.
The incubation period of green turtle hatchlings ranged from 43-60 d on Alagadi Beach,
Northern Cyprus (Broderick et al., 2000) to an average of 58 d on Huyong Island,
Thailand (Gomuttapong et al., 2013). The average hatching success rate was 28%
(SD=35, n=10) for green turtles in the Cayman Islands in 1998 (Aiken et al., 2001),
whereas on Alagadi Beach in northern Cyprus the hatching success rate was 94% (n=71)
(Broderick and Godley, 1999). Since sea turtle eggs are semipermeable, they can be
impacted by the characteristics of the sand surrounding them, including temperature,
grain size, and moisture level of the sand (Crain et al., 1995), all which can effect
hatching success (the fraction of eggs hatched within a single clutch) (Miller, 1999).
132
The sex of sea turtles is temperature dependent, particularly during the middle
third of the incubation period (Broderick et al., 2000; Godley et al., 2002). Higher
temperatures produce females and cooler temperatures produce males (Broderick et al.,
2000). Several studies have been conducted attempting to investigate the sex ratio of
hatchlings. This is a very difficult process because no external features differentiate
males from females at this young age, so sacrifice of the hatchling is typically the only
method of ensuring correct sexing (Broderick et al., 2000; Godley et al., 2002). While sex
ratios are difficult to determine, calculating population estimates using the number of
nesting females within a rookery is an acceptable method of determining an approximate
number of individuals within the population (Pfaller et al., 2013).
There have been a few studies conducted over the years investigating the overall
population trends of C. mydas. However, there were issues with data analysis due to
differences in survey effort and imperfect detection over the years (Bjorndal et al., 1999;
Pfaller et al., 2013). The population growth rates were 6.8%, 5.7%, 3.8%, 13.9%, and
4.9%, respectively, for six major rookeries worldwide including Ogasawara, Japan; East
Island, Hawaii; Heron Island, Australia; Archie Carr National Wildlife Refuge, FL, USA;
and Tortuguero, Costa Rica from 1973 until 2003 (Chaloupka et al., 2008). Raine Island,
Australia showed an increase in population size from 1973 through 1988 and then began
to decrease (Chaloupka et al., 2008). Recording and analysis of nest detection probability
is just as important as recording the nesting history during these long-term population
surveys. Pfaller et al. (2013) had statistically significant evidence of an increase in the
nesting population on Wassaw Island, GA until detection probability was added into the
analysis.

133
The Nature Conservancy (TNC) has implemented several conservation practices
on the East End beaches, including removing mongoose, documenting and tagging
nesting female turtles, and reducing poaching activities by increasing nighttime beach
presence. Poaching and the abundance of feral animals have been documented as the
largest threats to hatchling success on the East End beaches of St. Croix, USVI (Harvey,
2008). The Javan mongoose, Herpestes javanicus, will dig up the nests and eat the eggs
before hatching (Harvey, 2008). Traps have been put in place before the nesting season
each year since 1994 in an attempt to reduce the abundance of this invasive species
(Mackey, 2011). Since the establishment of the sea turtle monitoring program on the East
End beaches in 1994, TNC has been working to prevent human poaching of sea turtle
eggs for consumption (Harvey, 2008). The volunteers that monitor sea turtle nesting on
the East End beaches bury wooden popsicle sticks labeled with the tag number of the
mother and the nesting date to allow collection of nesting data, but not draw the attention
of poachers to the nests (Harvey, 2008). The abundance of poachers has seemed to almost
disappear thanks to nighttime presence of interns on the beach (Lewis, pers. comm.).
Long-term population studies are likely the only means to get an accurate
population estimate for any sea turtle species. Godfrey and Godley (2008) suggest that
regional analyses of population threats be conducted to identify which management units
(MUs) are in greatest need of conservation efforts. The conservation efforts being
implemented at the East End beaches of St. Croix, USVI have attempted to limit the
number of threats to the sea turtles on these beaches (TNC, 2011). This study will
provide summary statistics of the nesting population of green sea turtles on the East End

134
beaches of St. Croix, USVI and provide recommendations for collecting and analyzing
long-term nesting data.
MATERIALS AND METHODS
Green sea turtle nesting data were collected from 1994-2015 on Jack, Isaac, and
East End beaches of St. Croix, USVI. The Division of Fish and Wildlife of the USVI
Department of Planning and Natural Resources (DPNR), the West Indies Marine Animal
Research and Conservation Service (WIMARCS), US Fish and Wildlife Service
(USFWS), National Park Service (NPS), St. Croix Marine Turtle Conservation Project,
and The Nature Conservancy (TNC) have funded or been a part of various aspects of the
sea turtle nest monitoring project on the East End beaches of St. Croix over the past 21
years. One to three people monitored the East End beaches from approximately 2000 to
0300 five times a week from August until December 1994-2015. Data were collected on
the total number of nesting female green sea turtles each season, carapace sizes, clutch
size, and hatching success. Females were flipper tagged on the right front and left rear
flippers, as well as PIT tagged in the left shoulder if the female was found before or while
in a trance-like state during egg laying. A PIT tag was not inserted if the female was not
located during the nest laying process. Curved carapace width (CCW) and length (CCL)
were taken for each female. Triangulation of the nest was completed if the egg chamber
was visible. A popsicle stick labeled with the date of nesting and female flipper tag
information was placed in the nest if the egg chamber was still open. Hatched nests were
excavated when located. Clutch size and hatching success were recorded upon excavation
of the nests. Due to inconsistencies in data collection, population estimation modeling

135
could not be completed for this nesting data, particularly due to variability in nighttime
monitoring effort. Changes in the types of data collected from year to year resulted in
only partial sections of the data being summarized. Summary statistics were calculated
for the total number of nesting females, clutch size, and hatching success.
RESULTS
The data collected by TNC between 1994-2015 varied greatly in terms of the
consistency of effort. This consistency was dependent upon the source of funding,
personnel, amount of funding, and unforeseeable events, such as inclement weather. No
data were able to be obtained before 2003 and no data were collected for the 2011-
nesting season. However, there did appear to be an overall trend of an increase in the
number of nesting females over the entire duration of the monitoring project. The average
number of confirmed green turtle nests was 263.9±53.5 between 2003-2015. The largest
number of nests (612) was observed during the 2010 nesting season, but this may have
been a factor of the varying survey effort over the years. Table 3.1 provides a summary of
some of the nesting data that were collected on the East End beaches from 2003-2015.
The mean clutch size was 107.9±3.4 eggs with an average hatching success of
86.7%±2.0%. Figure 3.2 is a suggested data sheet for collection of sea turtle nesting data
on the East End beaches. Information collected from this data sheet would allow for
population modeling to be conducted after several years of data collection. In addition to
these data sheets, daily logs should be kept with how many total hours each beach was
monitored every night. Figure 3.3 is a suggested data sheet for collection of nest
excavation data.

136
DISCUSSION
The major findings of this study are that the East End beach rookery has
approximately 263.9±53.5 green turtle nests each season with a mean hatching success
rate of 86.7%±2.0%. The number of nesting females is relatively high for an area of
beach approximately only two km in total length. The average clutch size of 107.9±3.4
eggs is consistent with other green nesting populations around the world. Generally the
clutch size ranges from 80-130 eggs (Gomuttapong et al., 2013). The average hatching
success of 86.7%±2.0% is generally greater than other nesting populations. Green turtle
nests in the Galápagos had a mean hatching success of 46.0%±33.4% between the years
2004 and 2007 on a variety of different nesting beaches (Zárate et al., 2013). Average
hatching success rates have been shown to vary from 28%-94% depending on the nesting
beach location and season (Broderick and Godley, 1999; Aiken et al., 2001). The
temperature, grain size, and moisture of the sand surrounding the clutch can all impact
the hatching success of each individual nest (Crain et al., 1995). Therefore, it is difficult
to compare hatching success across differing beaches if these factors are not measured
and taken into consideration.
Long-term sea turtle nesting data are needed to understand the life history and
population dynamics of this long-lived species. It is essential to have a long-term data
analysis plan before establishing sea turtle nesting beach protocols. The amount of effort
must remain consistent throughout the entire duration of the project, just as the data
collection methods must remain the same for the data to be viable and well suited for
statistical modeling. A 39-year data set collected on loggerhead nesting on Wassaw
Island, GA, USA demonstrated the necessity of integrating detection probability into

137
models of long-term population trends (Pfaller et al., 2013). A significant positive
increase was observed for the number of nesting loggerheads on Wassaw Island, but after
incorporation of imperfect detection rates into the model, no significant change in
abundance was identified (Pfaller et al., 2013). Changes in monitoring effort or site
fidelity of nesting females could both explain trends observed in population estimate
data; therefore, it is vital that detection probability remain the same for the entirety of the
project (Pfaller et al., 2013). Accurate record keeping of the number of beach hours or
distance patrolled is necessary for the establishment of an accurate model with tight
confidence intervals. It is important to have similar start and end dates for monitoring
each season, so as not to have a possible confounding variable in the data. When
attempting to model a population and get an estimate of population size, it is best to
gather information about the total number of nesting females and get an estimate of the
total number of nests laid in each season, whereas it is less important to collect the
greatest amount of data about each specific female or nest. It is also vital to conduct
random nest inventories to calculate an average clutch size and hatching success for each
season. However, things such as grain size, temperature, predation, or other natural
events are variables that can all impact the hatching success (Crain et al., 1995).
The consistent application of flipper and PIT tags is the only way to visually
identify each individual nesting female and obtain a reliable count of the total number of
females nesting each season. Individual identification is also essential for calculating the
average nesting frequency of females nesting in the survey area. It is necessary to have
standard protocols with descriptive definitions for conducting nest excavations to get
accurate measures of clutch size and hatching success. Often paper data sheets are

138
utilized to record nesting data while on the beaches, but it is vital that this information be
digitized in a consistent format to allow for easy access, data manipulation, and analyses
in the future. Training, data recording, and data processing should all remain the same
throughout the entirety of the nesting beach monitoring project regardless of the project
coordinator. The Sea Turtle Nest Monitoring System on seaturtle.org allows nesting data
to be entered in a consistent format and statistics to be calculated for each season. Data
including the total number of nests, number of false crawls, clutch size, and hatching
success can all be entered into this online database on seaturtle.org.
The recommended data sheets in Figures 3.2 and 3.3 include the minimum
amount of data that should be collected during each nesting season on the East End
beaches to conduct population modeling after several years of data have been collected.
Beach monitoring should always be conducted with a minimum of three people (one
within each bay). If funding is limited for the project, duration of the beach monitoring,
not the number of individuals monitoring the beaches each night, should be shortened.
This will ensure that survey effort is not a confounding variable when creating the
population estimation model. The portion of each season (number of days) that is
monitored will then need to be taken into account when running the model. Tagging of
each individual female should be the most important goal of the monitoring program in
order to identify the total number of nesting females each season. The entire beach survey
area needs to be covered thoroughly and no nesting female should be missed on a given
night. These data will be vital when attempting to estimate the size of the rookery on the
East End beaches. Identification of each nesting female will also allow for the calculation
of average clutch frequency and remigration interval, which are also necessary for

139
modeling. Specific information about each individual female (such as carapace
measurements) is not vital for model creation and therefore should only be conducted
when additional funding allows for more personnel to be involved with the project.
Towards the end of the nesting season, focus should shift to collecting nest excavation
data utilizing the data sheet in Figure 3.3. Information should primarily be collected on
hatching success, clutch size, and predation rates. Hatching success data are necessary to
model how the population of the rookery will change over time and predation rates are
important for identifying the effect predation is having on the population.
Models created from long-term sea turtle nesting data can help managers establish
population estimates and identify whether their efforts are effective in increasing sea
turtle populations (Boulon and Frazer, 1990). The nesting green sea turtle population on
Ascension Island is on the rise (Weber et al., 2014). The average number of clutches per
year on Ascension Island increased from a mean of 3,752 nests between 1977-1982 to a
mean of 23,724 nests between 2010-2013 (Weber et al., 2014). Local population
estimates at specific nesting beaches allow different rookeries to be classified on scales of
endangerment, so that rank of importance can be established for protection (Boulon and
Frazer, 1990). The IUCN Red List, however, only classifies the overall green sea turtle
population as endangered and does not divide this global population into smaller
segments (Godfrey and Godley, 2008).
The green sea turtle, C. mydas, has been classified into 11 distinct population
segments (DPSs) under the Endangered Species Act (ESA) based on genetic analyses
conducted all over the world (Figure 3.4). The Mediterranean, Central West Pacific, and
Central South Pacific DPSs are listed as endangered and all other DPSs are listed as

140
threatened. The US Virgin Island green turtle rookeries are classified within the South
Atlantic DPS and therefore are listed as threatened (66 Federal Register 81, 2016).
Utilizing long-term nesting data is necessary to identify the number of individuals within
a specific rookery and determine if it is in need of additional conservation efforts.
Sea turtle nesting data collection is necessary to create population estimates for
individual rookeries, which can then be utilized to identify which populations are more
threatened and endangered. The consistency of nesting data collection, however, is just as
important because without consistency these population estimates are not likely to be
accurate. Sea turtles are generally only encountered on land, so tagging studies and
nesting data statistics are vital to collecting information about at least a little part of the
life history of these threatened and endangered animals. Nest monitoring data are very
valuable information, as this is generally the only time we usually encounter these
animals, so we need to gather as much data as possible. Continued nesting beach
monitoring on the East End beaches should utilize the data collection sheets in Figures
3.2 and 3.3 to focus primarily on accurately identifying the number of females nesting on
these beaches each season and hatching success. Digitalizing and statistical comparisons
of yearly data will allow for easier analyses after the data have been collected over
several years. Overall this current study provided evidence of a large green sea turtle
rookery on the East End beaches of St. Croix, USVI and identified key steps necessary to
implement population estimation modeling for this rookery in the future.

141
LITERATURE CITED
Aiken, J.J., B.J. Godley, A.C. Broderick, T. Austin, G. Ebanks-Petrie, and G.C. Hays.
2001. Two hundred years after a commercial marine turtle fishery: the current
status of marine turtles nesting in the Cayman Islands. Oryx 35(2):145-151.
AlKindi, A.Y.A., I.Y. Mahmoud, A.A. Al-Habsi, S.N. Al-Bahry, A.M. Al-Gheilani, and
C.S. Bakheit. 2006. The effect of physical and human factors on beach selection
by green turtles (Chelonia mydas) at Ras Al-Hadd Reserve, Oman. Chelonian
Conservation and Biology 5(2):289-294.
Bell, C.D.L., J. Parsons, T.J. Austin, A.C. Broderick, G. Ebanks-Petrie, and B.J. Godley.
2005. Some of them came home: the Cayman Turtle Farm headstarting project for
the green turtle Chelonia mydas. Oryx 39(2):137-148.
Bell, C.D., J.L. Solomon, J.M. Blementhal, T.J. Austin, G. Ebanks-Petrie, A.C.
Broderick, and B.J. Godley. 2007. Monitoring and conservation of critically
reduced marine turtle nesting populations: lessons from the Cayman Islands.
Animal Conservation 10:39-47.
Bjorndal, K.A., J. A. Wetherall, A.B. Bolten, and J.A. Mortimer. 1999. Twenty-six years
of green turtle nesting at Tortuguero, Costa Rica: an encouraging trend.
Conservation Biology 13(1):126-134.
Bologna, P.A.X., R. Papagian, S. Regetz, and C. Dale. 2008. Assessment of turtle grass
(Thalassia testudinum ex Banks Konig) community structure in a UNESCO
Biosphere Reserve. Journal of Experimental Marine Biology and Ecology
365:148-155.
Boulon, R.H. and N.B. Frazer. 1990. Growth of wild juvenile Caribbean green turtles,
Chelonia mydas. Journal of Herpetology 24(4):441-445.
Broderick, A.C. and B.J. Godley. 1999. Effect of tagging marine turtles on nesting
behaviour and reproductive success. Animal Behaviour 58:587-591.
Broderick, A.C., B.J. Godley, S. Reece, and J.R. Downie. 2000. Incubation periods and
sex ratios of green turtles: highly female biased hatchling production in the
eastern Mediterranean. Marine Ecology Progress Series 202:273-281.
Chaloupka, M., K.A. Bjorndal, G.H. Balazs, A.B. Bolten, L.M. Ehrhart, C.J. Limpus, H.
Suganuma, S. Troëng, and M. Yamaguchi. 2008. Encouraging outlook for
recovery of a once severely exploited marine megaherbivore. Global Ecology and
Biogeography 17:297-304.

142
Crain, D.A., A.B. Bolten, and K.A. Bjorndal. 1995. Effects of beach nourishment on sea
turtles: review and research initiatives. Restoration Ecology 3(2):95-104.
Frazer, N.B. and L.M. Ehrhart. 1985. Preliminary growth models for green, Chelonia
mydas, and loggerhead, Caretta caretta, turtle in the wild. Copeia 1985(1):73-79.
Glen, F., A.C. Broderick, B.J. Godley, and G.C. Hays. 2005. Patterns in the emergence of
green (Chelonia mydas) and loggerhead (Caretta caretta) turtle hatchlings from
their nests. Marine Biology 146:1039-1049.
Godfrey, M.H. and B.J. Godley. 2008. Seeing past the red: flawed IUCN global listings
for sea turtles. Endangered Species Research 6:155-159.
Godley, B.J., A.C. Broderick, F. Glen, and G.C. Hays. 2002. Temperature-dependent sex
determination of Ascension Island green turtles. Marine Ecology Progress Series
226:115-124.
Gomuttapong, S., W. Klom-In, J. Kitana, P. Pariyanonth, K. Thirakhupt, and N. Kitana.
2013. Green turtle, Chelonia mydas, nesting and temperature profile of the nesting
beach at Huyong Island, the Similan Islands in Andaman Sea. Natural Resources
4:357-361.
Harvey, A. 2008. Sea Turtle Monitoring Program: The East End Beaches (Jack’s, Isaac’s,
and East End Bay) St. Croix, U.S. Virgin Islands. Final Report to The Nature
Conservancy, February 2009.
Humber, F., B.J. Godley, and A.C. Broderick. 2014. So excellent a fishe: a global
overview of legal marine turtle fisheries. Diversity and Distributions 20:579-590.
Madden, D., J. Ballestero, C. Calvo, R. Carlson, E. Christians, and E. Madden. 2008. Sea
turtle nesting as a process influencing a sandy beach ecosystem. Biotropica
40(6):758-765.
McGowan, A., A.C. Broderick, G. Frett, S. Gore, M. Hastings, A. Pickering, D.
Wheatley, J. White, M.J. Witt, and B.J. Godley. 2008. Down but not out: marine
turtles of the British Virgin Islands. Animal Conservation 11:92-103.
Miller, J.D. 1999. Determining clutch size and hatch success. In Research and
Management Techniques for the Conservation of Sea Turtles (eds K.L. Eckert,
K.A. Bjorndal, F.A. Abreu-Grobois & M. Donnelly), pp. 124–129. IUCN/Species
Survival Commission Marine Turtle Specialist Group, Blanchard, USA.
Pfaller, J.B., K.A. Bjorndal, M. Chaloupka, K.L. Williams, M.G. Frick, A.B. Bolten.
2013. Accounting for imperfect detection is critical for inferring marine turtle
nesting population trends. PLoS ONE 8(4):e62326.
143
The Nature Conservancy’s St. Croix sea turtle monitoring and protection plan. 2011.
Vander Zanden, H.B., K.A. Bjorndal, P.W. Inglett, and A.B. Bolten. 2012. Marine-
derived nutrients from green turtle nests subsidize terrestrial beach ecosystems.
Biotropica 44(3):294-301.
Weber, N., S.B. Weber, B.J. Godley, J. Ellick, M. Witt, and A.C. Broderick. 2013.
Telemetry as a tool for improving estimates of marine turtle abundance.
Biological Conservation 167:90-96.
Weber, S.B., N. Weber, J. Ellick, A. Avery, R. Frauenstein, B.J. Godley, J. Sim, N.
Williams, and A.C. Broderick. 2014. Recovery of the South Atlantic’s largest
green turtle nesting population. Biodiversity and Conservation 23(12):3005-3018.
Wetterer, J.K. and C.D. Lombard. 2010. Fire ants (Hymenoptera: Formicidae) along an
important sea turtle nesting beach on St. Croix, USVI. Florida Entomologist
93(3):449-450.
Yasuda, T., H. Tanaka, K. Kittiwattanawong, H. Mitamura, W. Klom-in, and N. Arai.
2006. Do female green turtles (Chelonia mydas) exhibit reproductive seasonality
in a year-round nesting rookery? Journal of Zoology 269:451-457.
Zárate, P., K.A. Bjorndal, M. Parra, P.H. Dutton, J.A. Seminoff, and A.B. Bolten. 2013.
Hatching and emergence success in green turtle Chelonia mydas in the Galápagos
Islands. Aquatic Biology 19:217-229.

144
Table 3.1. Summary statistics of the nesting beach data collected for the green sea turtle,
Chelonia mydas, on the East End beaches of St. Croix, USVI from 2003-2015.
Nesting
season
Total number
of females
Confirmed
number of nests
Mean clutch
size
Mean hatching
success
2003 28 126 108.8 92.8
2004 64 236 117.4 89.7
2005 34 115 112.0 79.4
2006 108 392 109.1 85.7
2007 40 - 117.4 89.3
2008 139 - 112.3 83.2
2009 32 112 - -
2010 79 612 - -
2011 - - - -
2012 184 - - -
2013 156 307 94 -
2014 172 223 - -
2015 144 252 92 -
Mean 106.7 263.8 107.9 86.7
SE 21.2 53.5 3.4 2.0

145
Figure 3.1. Map of the East End beaches within Jack, Isaac, and East End Bays on St.
Croix, USVI.

146
Female Nesting Data Collection Sheet - East End beaches
Date:
Time:
Observer:
Species: Cm Ei
Beach: JB IB EEB
Tags:
PTT:
LFF:
RFF:
LRF:
RRF:
Tag Scars: Left Right
Front
Rear
Figure 3.2. Data sheet for collection of night-time monitoring data of nesting female sea
turtles on the East End beaches of St. Croix, USVI.

147
Nest Excavation Data Collection Sheet - East End beaches
Date:
Time:
Observer:
Species: Cm Ei
Beach: JB IB EEB
Nest Predated: Yes No
Predation Type (Circle):
Cat
Night Heron
Crab
Unknown
Dog
Other
Mongoose
Total # of eggs (Clutch size):
# Hatched:
# Dead:
Figure 3.3. Data sheet for collection of sea turtle nest excavation data on the East End
beaches of St. Croix, USVI.

148
Figure 3.4. Map of green sea turtle, Chelonia mydas, distinct population segments
(DPSs): (1)North Atlantic, (2)Mediterranean, (3)South Atlantic, (4)Southwest Indian,
(5)North Indian, (6)East Indian-West Pacific, (7)Central West Pacific, (8)Southwest
Pacific, (9)Central South Pacific, (10)Central North Pacific, (11)East Pacific. The
Mediterranean, Central West Pacific, and Central South Pacific are listed under the
Endangered Species Act as endangered and all other DPSs are listed as threatened
(source: 66 Federal Register 81, 2016).

149
APPENDIX A. Satellite Attachment Data Sheet
St. Croix Green Sea Turtle Field Work Data Sheet
Date: .
Attachment Start Time: .
Release Time: .
Release Latitude: .
Release Longitude: .
PIT Tag Number: .
RFF Tag Number: .
LFF Tag Number: .
Satellite Transmitter Number:
CCW: CCL: .
Photo Taken: Yes No
Tissue Biopsy Taken: Yes No
Comments:

150
APPENDIX B. The female green turtle, Chelonia mydas, Savannah (#146259) after PTT
attachment on August 1, 2015.

151
APPENDIX C. The female green turtle, Chelonia mydas, Samantha (#146260) after PTT
attachment on August 4, 2015.

152
APPENDIX D. The female green turtle, Chelonia mydas, Dionne (#146261) after PTT
attachment on August 4, 2015. Note: Red light is from headlamps used on beach at night.

153
APPENDIX E. The female green turtle, Chelonia mydas, Victoria (#146262) after PTT
attachment on August 5, 2015.

154
APPENDIX F. The female green turtle, Chelonia mydas, Annette (#146263) after PTT
attachment on October 22, 2015.

155
APPENDIX G. The female green turtle, Chelonia mydas, Cheryl (#146264) after PTT
attachment on October 23, 2015.

156
APPENDIX H. The female green turtle, Chelonia mydas, Emily (#153482) after PTT
attachment on October 23, 2015.

157
APPENDIX I. Adjustable wooden corral utilized in this study to restrain green sea
turtles, Chelonia mydas, during the satellite transmitter attachment process.

158
APPENDIX J. Attachment of the PTT to the carapace of s green sea turtle, Chelonia
mydas, with the use of a mixed 2-part epoxy (SuperBondTM
).

159
APPENDIX K. The female green turtle, Chelonia mydas, Victoria (#146262) entering
water after completion of the PTT attachment process.

160
APPENDIX L. Minimum convex polygon (MCP) for the internesting period movements
of the female green turtle, Chelonia mydas, Savannah (#146259). Green star represents
tagging location.

161
APPENDIX M. Map of habitat utilization of the female green turtle, Chelonia mydas,
Savannah (#146259) during her internesting period (39 d) including an outline of her
50% core use (red) and 95% activity areas (yellow).

162
APPENDIX N. Minimum convex polygon (MCP) for the post-nesting period movements
of the female green turtle, Chelonia mydas, Savannah (#146259).

163
APPENDIX O. Map of habitat utilization of the female green turtle, Chelonia mydas,
Savannah (#146259) during her post-nesting period (187 d) including an outline of her
50% core use (red) and 95% activity areas (yellow).

164
APPENDIX P. Minimum convex polygon (MCP) for the internesting period movements
of the female green turtle, Chelonia mydas, Dionne (#146261). Green star represents
tagging location.

165
APPENDIX Q. Map of habitat utilization of the female green turtle, Chelonia mydas,
Dionne (#146261) during her internesting period (65 d) including an outline of her 50%
core use (red) and 95% activity areas (yellow).

166
APPENDIX R. Minimum convex polygon (MCP) for the post-nesting period movements
of the female green turtle, Chelonia mydas, Dionne (#146261). Green star represents
tagging location.

167
APPENDIX S. Map of habitat utilization of the female green turtle, Chelonia mydas,
Dionne (#146261) during her post-nesting period (158 d) including an outline of her 50%
core use (red) and 95% activity areas (yellow).

168
APPENDIX T. Minimum convex polygon (MCP) for the internesting period movements
of the female green turtle, Chelonia mydas, Victoria (#146262). Green star represents
tagging location.

169
APPENDIX U. Map of habitat utilization of the female green turtle, Chelonia mydas,
Victoria (#146262) during her internesting period (58 d) including an outline of her 50%
core use (red) and 95% activity areas (yellow).

170
APPENDIX V. Minimum convex polygon (MCP) for the post-nesting period movements
of the female green turtle, Chelonia mydas, Victoria (#146262).

171
APPENDIX W. Map of habitat utilization of the female green turtle, Chelonia mydas,
Victoria (#146262) during her post-nesting period (88 d) including an outline of her 50%
core use (red) and 95% activity areas (yellow).

172
APPENDIX X. Minimum convex polygon (MCP) for the post-nesting period movements
of the female green turtle, Chelonia mydas, Cheryl (#146264).

173
APPENDIX Y. Table of PTT attachment durations for green sea turtles, Chelonia mydas, tracked in published studies with
deployment location, PTT type, and epoxy utilized. * means that the same turtle was tracked again the next nesting season.
Deployment duration (d) Date deployed PTT type Epoxy utilized Location Reference
42 September 20, 2005 Telonics ST-20 A-1010 Silicone Elastomer St. Eustatius
237 September 18, 2006 Telonics ST-20 A-1010 Silicone Elastomer St. Eustatius Esteban et al. (2015)
142 September 2, 2007 Telonics ST-20 A-1010 Silicone Elastomer St. Eustatius
136 July 27, 2003* Sirtrack KiwiSat 101 Foilfast Grand Cayman
67 August 29, 2004* Sirtrack KiwiSat 101 Foilfast Grand Cayman
281 August 22, 2003 Sirtrack KiwiSat 101 Foilfast Grand Cayman
144 August 19, 2004 Sirtrack KiwiSat 101 Foilfast Grand Cayman Blumenthal et al. (2006)
112 July 24, 2005 Sirtrack KiwiSat 101 Foilfast Grand Cayman
88 August 28, 2005 Sirtrack KiwiSat 101 Foilfast Grand Cayman
214 August 19, 2005 Sirtrack KiwiSat 101 Foilfast Grand Cayman
269 August 31, 2004 Sirtrack KiwiSat 101 Foilfast Cayman Brac
22 July 11, 2000 Telonics St-18 Foilfast Brazil
96 July 17, 2000 Telonics St-18 Foilfast Brazil
197 July 19, 2000 Telonics St-18 Foilfast Brazil
64 January 11, 2001 Telonics St-18 Foilfast Brazil Godley et al. (2003)
1 March 3, 2001 Telonics St-18 Foilfast Brazil
54 April 19, 2001 Telonics St-18 Foilfast Brazil
83 May 20, 2001 Telonics St-18 Foilfast Brazil
43 May 20, 2001 Telonics St-18 Foilfast Brazil
2 August 12, 2009 KiwiSat 101 Sika Anchorfix 3+ Kuwait
121 July 28, 2010 KiwiSat 101 Sika Anchorfix 3+ Kuwait Rees et al. (2013)
248 November 7, 2010 KiwiSat 101 Sika Anchorfix 3+ Kuwait