region i office combustion engineering … · l ct* 3-5 follow-up confirmatory radiological survey...
TRANSCRIPT

L
CT* 3-5
.
FOLLOW-UP CONFIRMATORY RADIOLOGICAL SURVEY
OF THE DRUM STORAGE AREA COMBUSTION ENGINEERING PROPERTY
W INDSOR, CONNECTICUT
M. R. LANDIS
Radiological Site Assessment Program Energy/Environment Systems Division
FINAL REPORT MAY 1989
Prepared by Oak Ridge Associated Universities
Prepared for U.S. Nuclear Regulatory Commission’s Region I O ffice
Supportedby Division of Industrial and Med ical Nuclear Safety

-.-
NOTICES The opinions expressed herein do not necessarily reflect the opinions of the sponsoring institutions of Oak Ridge Associated Universities.
This report was prepared as an account of work sponsored by the United States Government. Neither the United States Government nor the U.S. Department of Energy, nor any of their employees, makes any warranty, express or implied, or assumes any legal liability or responsibility for the accuracy, completeness, or usefulness of any information, apparatus, product, or process disclosed, or represents that its use would not infringe privately owned rights. Reference herein to any specific commercial product, process, or service by tradename, mark, manufacturer, or otherwise, does not necessarily constitute or imply its endorsement or recommendation, or favoring by the U.S. Government or any agency thereof. The views and opinions of authors expressed herein do not necessarily state or reflect those of the U.S. Government or any agency thereof.

ORAU 89/E-93
*
c
FOLLOW-UP CONFIRMATORY RADIOLOGICAL SURVEY
OF THE DRUM STORAGE AREA
COMBUSTION ENGINEERING PROPERTY WINDSOR, CONNECTICUT
Prepared by
M. R. Landis
Project Staff
J. D. Berger T. J. Sowell C. F. Weaver
Radiological Site Assessment Program Energy/Environment Systems Division
Oak Ridge Associated Universities Oak Ridge, TN 37831-0117
Prepared for
Division of Industrial and Medical Nuclear Safety U.S. Nuclear Regulatory Commission
Region I Office
Final Report
May 1989
This report is based on work performed under Interagency Agreement (NRC Fin. No. A-9076) between the U.S. Nuclear Regulatory Commission and the U.S. Department of Energy. Oak Ridge Associated Universities performs complementary work under contract number DE-AC05-760R00033 with the U.S. Department of Energy.
.-__ ----- ~-
TABLE OF CONTENTS
List of Figures .........................
List of Tables. .........................
Introduction. ..........................
Site Description ........................
Survey Procedures ........................
Results ............................
Discussion of Results ......................
Summary . . .
References .
Appendices
Appendix A:
Appendix B:
Appendix C:
. . . . -. * . . D . . -. e . . . . . . . . . . .
a . . . . . . . . . . . . . e e . . . . . . . . . .
Major Sampling and Analytical Equipment
Measurement and Analytical Procedures
Nuclear Regulatory Commission Guidelines for Residual Concentrations of Thorium and Uranium Wastes in Soil
i
Page
ii
iii
1
1
2
3
5
6
21

LIST OF FIGURES
Page
-r FIGURE 1: Map of Hartford Area Showing the Location of the Combustion Engineering Property . . . . . . . . . . . . 7
FIGURE 2: Plot Plan of the Combustion Engineering Property Showing the Location of the Drum Storage Area . . 0 . . 8
FIGURE 3: Map of Hartford Area Showing the Locations of Background Measurements and Baseline Samples . . . . . 9
FIGURE 4: Grid System Established on the Drum Storage Area . . . . . . . . . . . . . . . . . . . . . . . . . 10
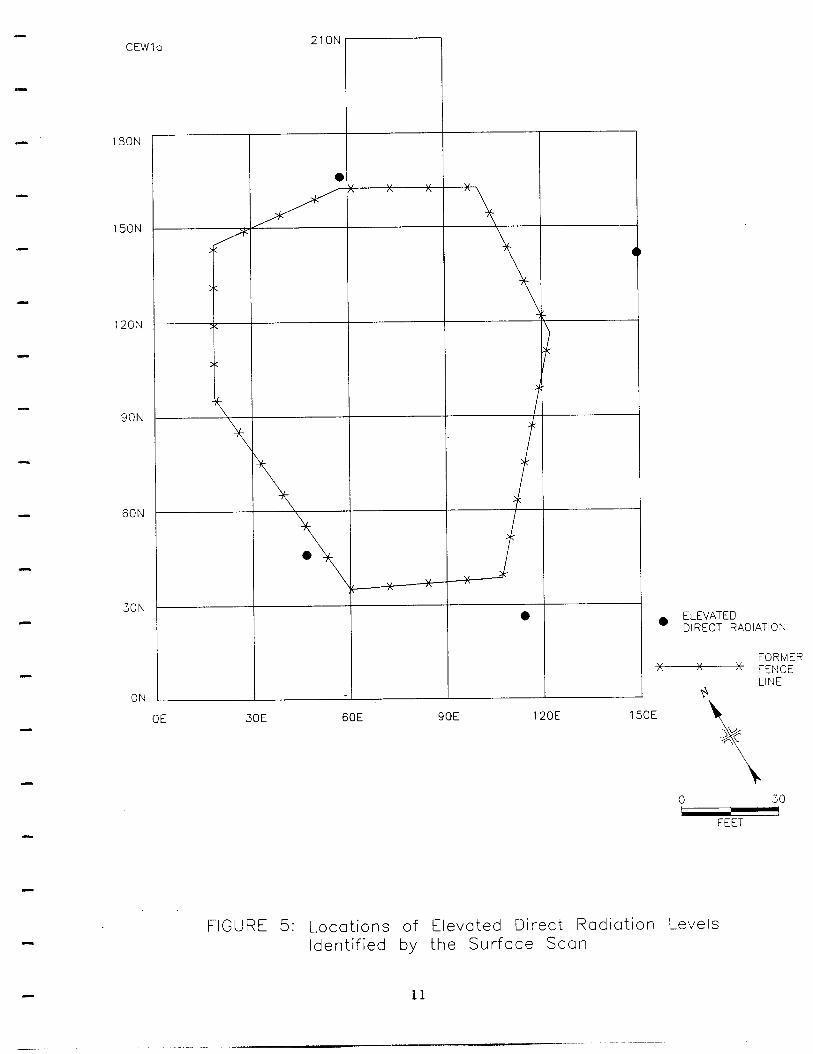
FIGURE 5: Locations of Elevated Direct Radiation Levels Identified by the Surface Scan . . . . . . . 0 . . . . 11
L
Y
ii

LIST OF TABLES
Page
/I
c
L
TABLE 1: Background Direct Radiation Levels . . a . . . e . . . . 12
TABLE 2: Radionuclide Concentrations in Baseline Soil Samples......... e . . . . . -. 0 . . . . . . . 13
TABLE 3: Direct Radiation Levels Measured at Grid Line Intersections . . . . . . . . . . . . . . . . . . . . . 14
TABLE 4: Direct Radiation Levels at Locations Identified by Surface Scans . . . . . . . . . . . . . . . . . . . . 16
TABLE 5: Radionuclide Concentrations in Composite Surface Soil Samples from Grid Blocks . . . . . . . . . . . . . . . . 17
TABLE 6: Radionuclide Concentrations in Surface Soil Samples from Locations of Elevated Direct Radiation. . . . . . . 19
TABLE 7: Results of Isotopic Uranium and Thorium Analyses of Selected Samples a . 0 0 . . . . . . . . . . . . . . . . 20
iii ..- _-.. -

C
FOLLOW-UP CONFIRMATORY RADIOLOGICAL SURVEY
OF THE DRUM STORAGE AREA
COMBUSTION ENGINEERING PROPERTY WINDSOR, CONNECTICUT
INTRODUCTION
Combustion Engineering decontaminated and decommissioned a former
high-enrichment uranium facility at their Windsor, Connecticut, site
approximately 25 years ago. Some of the waste from decontamination operations
was burned and the ash placed in drums for disposal; however, subsequent
surveys identified some areas of residual soil contamination. Combustion
Engineering performed cleanup of this area and packed and shipped residual ash
to the Barnwell Radioactive Waste Disposal site. Soil samples collected after
cleanup identified surface uranium contamination at some locations of the drum
storage area still exceeding Nuclear Regulatory Commission (NRC) guidelines.
An additional 5 to 7 cm of soil was removed from these areas. At the request
of the NRC the Radiological Site Assessment Program of Oak Ridge Associated
Universities (ORw conducted a confirmatory survey of the site in October of
1984.l The results of that survey indicated that several areas had residual
enriched uranium and thorium surface soil contamination in excess of the
guidelines established for unrestricted use.
In June of 1986 an additional 15 to 30 cm of soil was removed from the
surface of this area by the licensee. ORAU at the request of NRC Region I
conducted a follow-up confirmatory survey to evaluate radiological conditions
relative to the guidelines established for unrestricted release.
SITE DESCRIPTION
The site encompasses an area of approximately 0.5 ha (75 ft X 75 ft) and is
located at 1000 Prospect Hill Road, Windsor, Connecticut which is 13 kilometers
north of Hartford and within 5 kilometers of Bradley International Airport
(Figure 1). The site is adjacent to an active low-enriched uranium fuel
fabrication plant and a naval reactor training center. A plot plan of the
___ ~. ~-.
*I
C
Combustion Engineering Property, showing the location of the drum storage area
is shown in Figure 2.
SURVEY PROCEDURES
At the request of the Nuclear Regulatory Commission, a confirmatory survey
of the burn and drum storage area of the Combustion Engineering site was
performed by the Radiological Site Assessment Program on March 28, 1989. This
section describes the survey objectives and the procedures followed.
Objectives
The objectives of the ORAU survey were to confirm the radiological data
developed by Combustion Engineering and to determ ine the nature and extent of
residual radioactive material present in this area. Radiological information
collected included:
1. direct radiation levels,
2. locations of elevated surface radiation,
3. concentrations of radionuclides in surface soil, and
4. baseline radionuclide concentrations in the surrounding area.
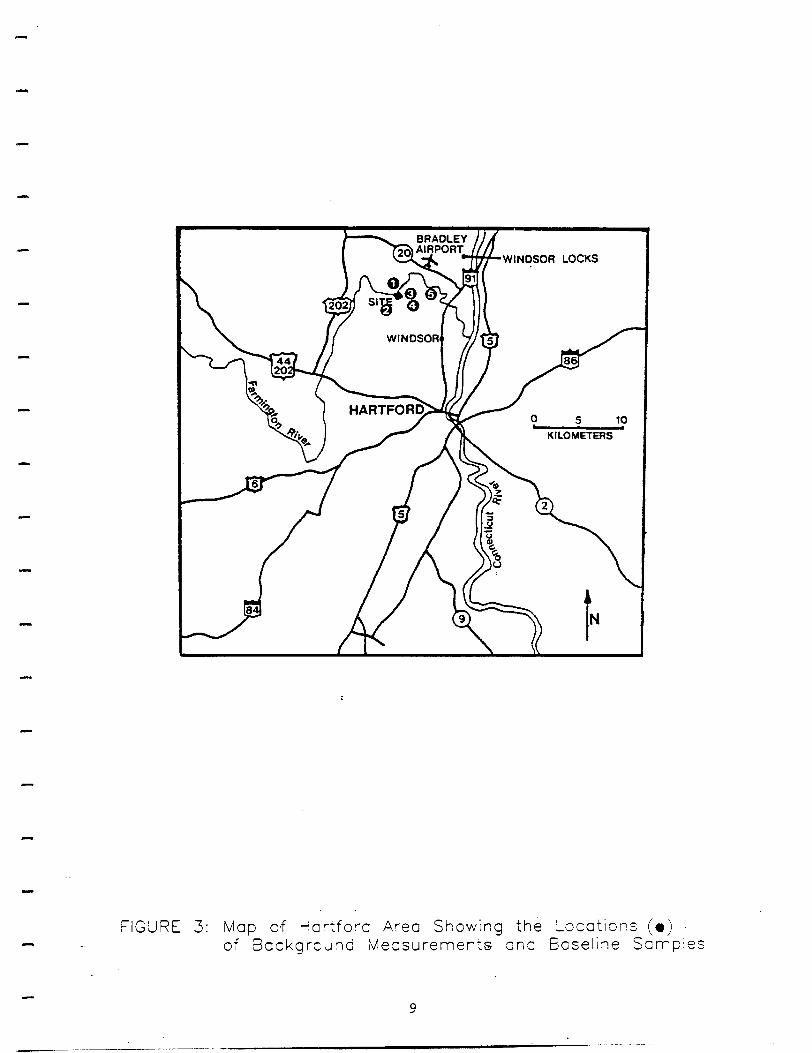
Background and Baseline Samples
Radiation measurements and soil samples were obtained at five locations off
of the Combustion Engineering property, to establish background radiation levels
and baseline radionuclide concentrations. The locations of the baseline samples
and background radiation levels are shown on Figure 3.
Gridding
A 30 foot grid pattern, established as part of the licensee's cleanup and
survey activities, was used for ORAU survey reference. This grid system is
shown on Figure 4.
2
__-- --.__ II ._ "

L
Surface Measurements and Sampling
,-
C
h
1. Portable ratemeters (audible) attached to NaI(T1) gamma scintillation
detectors were used for the walkover surface scan. The walkover
surface scan was conducted at l-2 m intervals over all areas of the
site. Locations of elevated contact radiation were noted.
2. Gamma exposure rate measurements were made at the surface and at 1 m
above the surface at grid line intersections and at locations of
elevated radiation levels identified by the surface scan.
Measurements were performed using portable gamma NaI(T1) scintillation
survey meters. Conversion of these measurements to exposure rates in
m icroroentgens per hour (pR/h) was in accordance with cross
calibration with a pressurized ionization chamber.
3. Surface (O-15 cm) composites of soil, taken from the center and four
points equidistant between the center and the grid block corners, were
collected from each grid block. Samples were also taken from areas of
elevated contact radiation, identified by the walkover scan.
Sample Analysis and Interpretation of Results
I
C
Soil samples were analyzed by gamma spectrometry. Radionuclides of primary
interest were U-235, U-238, Th-232, and Th-228; however, spectra were reviewed
for other gamma emitters. Selected samples were analyzed for isotopic uranium
and thorium . Additional information concerning measurement and analytical
equipment and procedures are described in Appendices A and B.
Survey findings were compared with NRC guidelines for residual thorium and
uranium contamination in soil.
RESULTS
Background Levels and Baseline Concentrations
Background radiation levels and baseline radionuclide concentrations in
soil, determ ined for five locations in the vicinity of the Combustion
3
--- .- .”

Engineering site are presented in Tables 1 and 2. Exposure rates at the
surface and 1 m above the surface ranged from 9 to 10 uR/h. Concentrations of
radionuclides in soil were : U-235, <0.2 pCi/g; U-238, ~0.7 to 1.8 pCi/g;
Th-232, 0.5 to 0.8 pCi/g and Th-228, 0.7 to 0.9 pCi/g. These values are within
the ranges that typically occur in the environment.
Direct Radiation Levels
Gross g-a scanning identified four locations of elevated contact
radiation levels in small isolated areas on the site (Figure 5). There was no
evidence of significant or widespread contamination. Gamma exposure rates
measured at grid line intersections ranged from 8 - 11 pR/h and 8 - 15 pR/h at
1 m and contact respectively (Table 3). Exposure rates measured at locations
identified by the surface scan initially. ranged from 13 - 15 pR/h at 1 m and
23 - 26 pR/h at contact (Table 4). Additional remediation reduced exposure
rates to 9 - 11 pR/h and 11 - 15 pR/h at 1 m and contact, respectively.
Radionuclide Concentrations in Soil
Radionuclide concentrations in composite surface soil samples from grid
blocks are presented in Table 5. Concentration ranges were: U-235, <0.2 to
0.8 pCi/g; U-238, <0.4 to 2.9 pCi/g; Th-232, <0.3 to 3.7 pCi/g; and Th-228, 0.6
to 4.2 pCi/g.
Table 6 lists the pre- and post-remediation concentrations of radionuclides
measured in soil samples from locations of elevated direct radiation.
Concentrations prior to remediation ranged to 12.8 pCi/g for U-238, 27.9 pCi/g
for Th-232, and 28.2 pCi/g for Th-228. Following remediations, the
radionuclide levels were significantly reduced. Concentrations of U-235 were
below detection limits (co.3 pCi/g); the highest U-238 concentration was
4.6 pCi/g, and the highest total thorium concentration was 14.6 pCi/g.
Alpha spectrometry for uranium and thorium was performed on three samples;
results are presented in Table 7. Based on the relative levels of the uranium
isotopes the contaminants at locations 45N, 45E and 165N, 57E appear to be
slightly enriched in U-235 with correspondingly higher levels of U-234 than
4
___.- -
* - I .

L
U-238. The uranium in the composite sample from grid block 120-150N, 30-60E is natural uranium at essentially baseline levels. The U-238 concentrations from
these analyses are the same as or slightly lower than those determ ined by gamma
spectrometry, suggesting that the contamination was unevenly distributed and
may 'have been due to small pieces of material, not readily homogenized by
conventional physical grinding methods. Concentrations of Th-228 and Th-232
were in good agreement with those determ ined from the gamma spectrometry
analyses. Samples from grid block 120-150N, 30-60E and 165N, 57E contained
elevated levels of Th-230. The highest level was 13.5 pCi/g in the sample from
165N, 57E, after further cleanup was performed. The source of the Th-230 is
unknown, review of gamma spectra did not indicate significant concentrations of
this radionuclide in any of the samples. No Ra-226 levels exceeding typical
baseline concentrations were noted.
DISCUSSION OF RESULTS
The soil guidelines applicable to the drum storage area are presented in
Appendix C. Under Option 1, for unrestricted release, the guideline
concentrations are 30 pCi/g for enriched uranium and 10 pCi/g for natural
thorium (Th-232 + Th-228). The exposure rate guideline at 1 m above the
surface is 10 pR/h above background or 20 pR/h total.
Following remediation, radionuclide concentrations were within guideline
levels, with one exception. The post-remediation sample from 45N, 45E had a
Th-232 + Th-228 concentration of 14.6 pCi/g (17.4 pCi/g based on alpha
spectrometry) which exceeds the 10 pCi/g guideline. The area of contamination
is small (less than 10 ft2) and isolated, The average Th-232 + Th-228
concentration throughout the grid block, based on the concentration in the
composite sample, is less than 2 pCi/g; therefore, averaging with the remainder
of the grid block results in a concentration which satisfies guidelines.
The highest exposure rate measured at the site, after completion of
remedial activities, was 15 pR/h; this is within the guideline level of
20 pR/h, total.
.--- ___--..
SUMMARY
I-
<-
On March 28, 1989, the Radiological Site Assessment Program of Oak Ridge
Associated Universities conducted a follow-up confirmatory radiological survey
of the drum storage area on the Combustion Engineering Property in Windsor,
Connecticut. The purpose of this survey was to evaluate the radiological
status relative to the NRC guidelines established for release for unrestricted
use. Initial measurements identified four isolated areas with elevated direct
radiation levels. Additional remediation was performed by the licensee and
follow-up evaluations indicated that the applicable guidelines had been
satisfied. Based on the final survey results, it is ORAU's opinion that the
drum storage area satisfies the criteria for release for unrestricted use.
/-
6

l -
-
--
FIG U R E 1 : M a p o f Har t ford A rea S h o w i n g th e L o c a tio n o f th e C o m b u s tio n Eng i nee r i n g Froper ty
7 -- ----

8
cE .- F’? & E: .- -e+ FL
00 EC 8
.g
aG
22
KILOMETERS
FIGURE 3: Map of Hartford Area Showing the Locations (0) _, of BackgrcJnd Measurements and GaseliTe Sampies
9
_-__---_-. ____~_-____-. -

CEWI 210N
r-l 180N
150N
120N
90N
60N
30N
ON
x
;I: \
x
FORMER - FENCE
LINE +.
OE 30E 60E 90E 120E 150E
FIGURE 4: Grid System Established on (he Drum Storage Area
10
I-
,-
C E W l a 2 1 0 N
1 8 0 N
1 5 0 N
1 2 0 N -
9 0 N -
6 0 N
r
3 0 N
I
\
0
, ” A
0 E L E V A T E D . D IRECT RADIAT ION
F O R M E R ) 7 ;E K K E
O N
O E 3 0 E 6 0 E 9 0 E 1 2 0 E 1 5 0 E \
FIG U R E 5 : L o c a tio n s o f E leva ted Direct R a d i a tio n Leve l s Id e n tifie d by th e S u r fa c e S c a n
1 1
_.._-. --

TABLE 1
BACKGROUND DIRECT RADIATION LEVELS COMBIJSTION ENGINEERING PROPERTY
WINDSOR. CONNECTIClJT
Locationa Gamma Exposure Rates
at 1 m above the Surface
( vR/h >
Gamma Exposures Rates at the Surface
CUR/h)
1 10 10
2
3 9 10
4 9 9
5 9 9
aRefer to Figure 3.
.
12

I I I 1 I I I I I I I I I I I I
TARLE 2
RADIONIJCLIDE CONCENTRATIONS IN RASELTNE SOIL SAMPLES COMBUSTION ENGINEERING PROPERTY
WINDSOR, CONNECTICUT
Radionuclide Concentrations (pCi/g) Locationa IJ-235 U-238 Th-232 Th-228
1 <0.2 <0.8 0.6 f 0.2b 0.9 f 0.1
2 (0.2 <n.7 0.5 + 0.1 0.7 4 0.1
3 <0.2 0.9 f 0.2 0.6 2 0.2 0.7 f n.l
4 <0.2 <cl.7 0.8 + 0.1 0.8 + 0.1
5 (0.2 1.8 f 0.5 0.5 2 0.1 0.9 + 0.1
aRefer to Figure 3. hUncertainties represent the 95% confidence levels, based only on counting
statistics: additional laboratory uncertainties of + 6 to 10% have not been propagated into these data.

TABLE 3
DIQECT RADIATION LEVELS MEASURED AT GRID LINE INTERSECTIONS COMRIJSTION ENGINEERING PROPERTY
WINDSOR, CONNECTICUT
Gamma Exposure Rates Gamma Exposure Rates Grid at 1 m ahove at the Surface
Locat iona the Surf ace (gR/h) N E ( uR/h >
0 0 10 10 0 30 8 8 0 60 8 9 0 90 9 9 0 120 10 11 n 150 in LO
30 0 9 9 30 30 9 9 30 60 9 9 30 90 9 11 30 120 10 12 30 150 9 9 60 0 8 9 60 30 8 9 60 60 10 10 60 90 10 15 60 120 9 9 60 150 9 in 90 0 9 in 90 30 9 15 90 60 9 9 90 90 10 11 90 120 in 12 90 150 9 in
120 n 10 9 120 30 11 11 120 60 9 in 120 90 9 9 120 120 10 10 120 150 10 in 150 n 9 10 150 30 11 11 150 60 10 11 150 90 in 11 150 i 20 9 9 150 150 10 12
14
.- - -.--...

TABLE 3 (Continued)
DIRECT RADIATION LEVELS MEASURED AT GRID LINE INTERSECTIONS COMRITSTION ENGINEERING PROPERTY
WINDSOR, CONNECTICIJT
Gamma Exposure Rates Gamma Exposure Rates Grid at 1 m ahove at the Surface
Locationa the Surface (!-R/h) N E CUR/h 1
180 0 10 in 180 30 in in 180 60 9 11 180 90 9 10 180 120 9 9 180 150 10 11 210 60 9 9 210 90 9 11
aRefer to Figwre 4
C
15
-------~. _____- -.
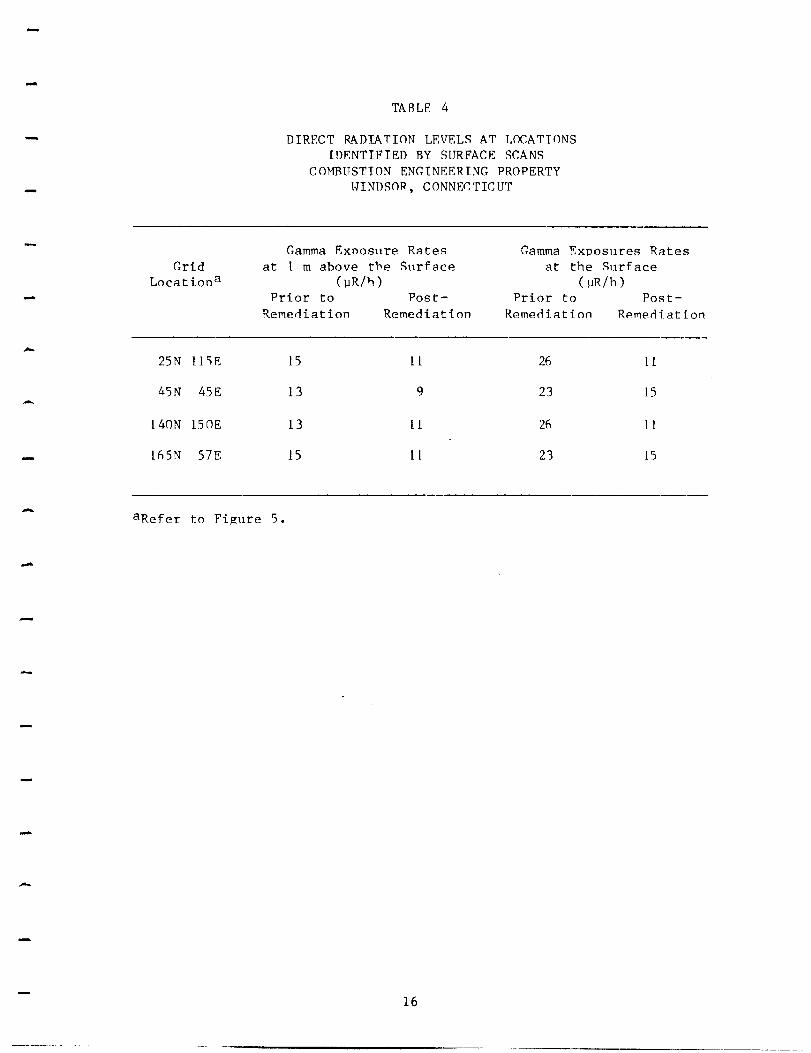
TABLE 4
DIRECT R4DIATION LEVELS AT LOCATIONS IDENTIFIED BY SURFACE SCANS
COMBUSTION ENGINEERING PROPERTY WINDSOR, CONNECTICUT
Gamma Exposure Rates Gamma Exposures Rates Grid at 1 m above the Surface at the Surface
Locationa (!JR/FI) (uR/h) Prior to Post- Prior to Post-
Remediation RemedlatIon Remediation Remediation
25N 115E 15 11 26 11
45N 45E 13 9 '3 15
140N 150E 13 11 26 11
165N 57E 15 11 23 15
aRefer to Figure 5.
16

mm
m*m
m
d d
d 6
d 0
+I +I
+I +,
+I +I
UJWW
~cn-J .
0 0
0 6
0 r-4
rnrn?-J~rn ooood +I
+I +I
+I +I
‘0 0,
cn LO
w d
0 0
-1 V-i
mm
mm
m
J d
0 d
d +I
+I +I
+I +I
cnmm
mw
odd&o
omm
mo
d d
0 d
0 +I
+I +I
+I +I
m
cn (0
cn 0)
r-4 0
n d
d
mm
mm
m
. I
0 0
d d
d +I
+I +I
+I +I
ru t--
c-4 *
0, =?
0; 4
d &
c .I- :‘ : < .r + c 1 : : : 4 .r 5 ? c .r B rx
t < / I
. n :
: <
: - I
!? 5 2 0 5 > i > : ;
: :
< > 1
G
:
1
Yrn
:: s
- .c-
“Z -0
0 .-
0
cij -J 4 N A . .
:: v ;t 5: N i :: ” 3
r-4 N
vi ,-4
cu 04
ddddJd
+I +I
+I +I
+I +I
U7wWm
m-+
. .
0 0
0 6
0 -4
s--t c-4
P-J tv
ddOd cl &
+I +I
+I +I
vmm
m0,
0 0
r+ d
01 r-l
m
v-4 v-4
. d
0 0
d d
+I +I
+l +I
+I 0
0-a in
?-( m
.
. ,-I
0 v-i
a+ 0
c-4 0,
Pi r
.+ (‘1
6 0
& 6
6
+I +I
+I +I
+I
cJ m
-
m
m
r/ 0
c> 0
0
mm
mr.l
0’ c) 0’ 0. m
+I
+I +I
+I t-
:9 I‘
c- :’
m
0; I :
d
iL t--
4 5
* F3 +
;i (I)
g fj
x5ng
LO
i&d;%
0 wz
1L. (3
..J 2
2 g
z %
cTr- .-4
yJ ”
+- z
& S,r-UO 0
t-’ 2
z -*
,^_ 0
z
2 E p
E 2
Y 9
::
n cufxi-3 LD 0
dd& d
d iI
+I +I
-2 +I
+I
mm
c-Swor- .
0 v-1
0 .-,
r+
WNm
um
. ooood +I
+I +I
+I +I
P-c-r-c-c. .
. 0
0 0
0 r-i
-3 cu
04 0
0 0
d d
* (\I
cu v!
Pi
0 0
0 0
0
+I +I
+I +I
+I r-
I;f L3
P- ,n
0 d
<< 0
t.4
‘omhic\lm
0
d 0
d G
+I
+I +I
+I +I
p-0)omo
v-4 A
,J A
,-;
* . +I
+I +I
+I 0 v
P-J (D
m
t!, d
0 d
7 -;
(u d
d CIlwhl dJd
+I “1
“f “f
+I nl
“i
vvvm9
00 v
v 01
s 8
d 0
m
d +I N
c-.l 0,
N
dddd m
vvvv c‘,
0 01
cv N
c-4 hl
0 d
d d
d +I
vvvvc-
_ d
hl P. c-4 C~. (v G
? ? ‘: v
WW
WU
JWW
“~~L%
~~ v-44
&i&G&&
P-J *~ulr.l
I r+
2 1 E
ggziF3iii m
*mcu*
r-i rl
LL L LL .L
LL “~~8~
ILi w
il, u
lli ~~R~~
1 d-(r(
LL& & i
A ‘2
m
co 0)
cv r-l
z z r-4 I
5 Cd r I
z 8
17
~.__l_l_ ..-.-_
__-

1 1 i 1 1 I f r 1 I I .I I
TA&E 5 (Continued)
RADIONUCLIDE CONCENTRAT-IONS IN COMPOSITE SURFACE SO!L SAMI'LES
FROM GRID BLOCKS
COMBUSTION ENGINEERING PROPERTY
WINDSOR. CONNECTICUT
Grid Block
Locationa J-235
Radionuclide Concentrations (pCi/g)
U-238 Th-232 Th-228
150N-180~ OE- 30E <0.2 co.5 i.3 + 0.2 1.5 f 0.3
30E- 60E <0.2 0.9 f 0.4 2.6 f 0.2 2.1 f 0.3
60E- 90E co.3 2.2 2 0.3 2.6 + 0.2 ' 2.7 f 0.3
9Ot.-120E co.2 0.9 + 0.4 1.7 + 0.3 1.8
I?!iE-15GE
f 0.3
co.3 i.9 + 0.3 2.5 + 0.2 2.4 f 0.3
i80N-210N 60E- 90E CO.3 0.1 + 0.3 1.5 2 0.2 I.5 2 0.3
aRefer to Figure 4. b: Jncertainties reoresent the 95% confidence levels, based only on counting statistics: adaitional laboratory uncertainties
of f 6 to 10% have not been proaagated into these data.

f
RADIONUCLIOE CONCENTRATIONS IN SURFACE SOIL SAMPLES
FROM LOCATIONS OF ELEVATE0 DIRECT RAOIATION
COMBUSTION ENGINEERING PROPERTY
WINDSOR. CONNECTICUT
Locationa
U-235
Radionuclide Concentrations (pCi/g)
U-238 Th-232 Th-228
25N 115E Prior Remediation to CO.7 11.7 t 1.4b 27.7 k 0.6 28.2 + 0.6
Post-Remediation co.2 1.2 + 0.4 2.5 f 0.2 2.1 f 0.3
45N 45E Prior Remediation to 0.7 2 0.6 12.a f 0.8 18.4 -+ 0.6 19.5 k 0.6
G Post-Remediation co.3 Cl.0 7.7 It 0.4 6.9 f 0.3
140N 150E Prior to Remediation CO.8 12.3 + 1.3 27.9 f: 0.8 26.7 0.6
Post-Remediation
2
co.2 1.3 t 0.4 1.9 + 0.2 2.4 i: 0.3
165N 57E Prior to Remediation <o. 5 5.9 f: i.0 14.1 + 0.5 14.7 0.3
Post-Remediation
r
co.3 4.6 f 0.4 5.1 i: 0.3 4.6 + 0.3
--
aRefer to Figure 5.
bUncertainties reoresent the 95% confidence levels. based onlv on counting statistics;
laboratory uncertainties of k 6 to
additional
10% halie not been propagated into these data.

4 m
c’
d
I I
k
+I Cl
Cl 0
0 C
. .
.
m
N Ls
d c’
0’ +I
Cl +I
L
r L
=; 2
ii 8 Eggs e&s $55,’
. v: cd w
t -
WE?
‘~Sc.2 d
- cr?z
c ‘s!JwcY ,%
si p&Z
E g3
ci e 5
8 ”
UJU ZP F
1
UT “0 ?I lx? 2: a! 5
4 d d +I Cl
Cl
hl m
C
. .
3 LT
;
I W
z
SC3 m
cv: aloal
; :“,5
p40 ,uAz
I bKaJ
‘d .r( .d
.C
“2 “0%
0
4 +
u uceucd
JcJYbl L,
b *d
m
aJaJu0. %
22L” W
D
cc c
cut
0 m
3 I E4 3
20 --
-----__. _
--.
REFERENCES
1. Confirmatory Radiological Survey of the Combustion Engineering Property, Windsor, Connecticut, A. D. Luck, March 1985.
h
L
21

.-
.-
APPENDIX A
MAJOR SAMPLING AND ANALYTICAL EQUIPMENT
--- - ----_-. ._ --

APPENDIX A
C
C
L
MAJOR SAMPLING AND ANALYTICAL EQUIPMENT
The display or description of a specific product is not to 'be construed as
an endorsement of that product or its manufacturer by the authors or their
employer.
A. Direct Radiation Measurements
Eberline PRM-6 Portable Ratemeter (Eberline, Santa Fe, NM)
Reuter-Stokes Pressurized Ionization Chamber Model RSS-111 (Reuter-Stokes, Cleveland, OH)
Victoreen Gamma Scintillation (NaI) Detector Model 489-55 (Victoreen, Inc., Cleveland, OH)
B. Laboratory Analyses
High-Purity Germanium Detector Model GMX-23195-S, 23% efficiency (EG&G ORTEC, Oak Ridge, TN)
Used in conjunction with: Lead Shield, G-16 (Gamma Products, Inc., Palos Hills, IL)
Multichannel Analyzer ND-66/ND-680 System - (Nuclear Data Inc., Schaumburg, IL)
Alpha Spectrometer Tennelec TC-256 (Tennelec Inc., Oak Ridge, TN)
A-l

C
L
Surface Barrier Detector Model CR-25-450-100 (EG&G ORTEC, Oak Right, TN)
Multichannel Analyzer Model ND-66 (Nuclear Data, Schaumburg, IL)
A-2
---- __--. ~. .-__ -. -
APPENDIX B
MJZASUREMENT AND ANALYTICAL PROCEDURES

a-
A P P E N D IX B
M E A S U R E M E N T A N D A N A L Y T ICAL P R O C E D U R E S
S u r fa ce Scans
W a lkover sur face scans o f o p e n l a nd a r eas w e r e p e r fo r m e d a t a p p r o x i m a tely
l -2 m intervals us i ng Ebe r l i ne M o d e l P R M - 6 p o r tab l e r a te m e ters with V icto r e e n
M o d e l 4 8 9 - 5 5 g a m m a scint i l lat ion d e tectors c on ta i n i ng 3 .2 cm x 3 .8 cm N a I(T1)
crystals. Re l a tive c o u n t r a tes w e r e m o n ito r e d us ing e a r p h o n e s a n d r a tes a b o v e
th e a m b ient b a c k g r o u n d levels w e r e n o te d .
Exposu r e R a te M e a s u r e m e n ts
M e a s u r e m e n ts o f g a m m a exposu re r a tes w e r e p e r fo r m e d us ing Ebe r l i ne P R M - 6
p o r tab l e r a te m e ters with a V icto r e e n M o d e l 4 8 9 - 5 5 g a m m a scint i l lat ion p r o b e
con ta i n i ng 3 .2 cm x 3 .8 cm N a I(T1) scint i l lat ion crystals. C o u n t r a tes w e r e
conve r ted to e xposu re r a tes ( pR /h ) by cross-ca l ibra t ing with a R e u te r -S tokes
M o d e l R S S - 1 1 1 p ressu r i zed ion iza t ion c h a m b e r .
S o il S a m p le Analys is
G a m m a S p e c t rometry
S o il a n d s e d i m e n t samples . w e r e d r i ed , m ixed, a n d a p o r tio n p l a ced in a
0 .5 lite r Mar ine l l i b e a k e r . T h e q u a n tity p l a ced in e a c h b e a k e r was chosen to
r e p r o d u c e th e ca l ib ra ted c o u n tin g g e o m e try a n d r a n g e d f rom 6 0 0 to 1 0 0 0 g o f
s amp l e . N e t w e i g h ts w e r e d e te r m i n e d a n d th e samp les c o u n te d us ing so l id sta te
g e r m a n i u m d e tectors c oup l ed to a Nuc lea r D a ta M o d e l N D - 6 8 0 pu l se h e i g h t
ana l yze r system. B a c k g r o u n d a n d C o m p to n str ipping, p e a k search, p e a k
i d en tifica tio n , a n d concen trat ion ca lcu la t ions w e r e p e r fo r m e d us ing th e
c o m p u te r capabi l i t ies i n h e r e n t in th e ana lyze r system. E n e r g y peaks u s e d fo r
d e te r m i n a tio n o f rad ionuc l i des o f conce rn w e r e :
U - 2 3 5 U - 2 3 8
0 .1 4 3 M e V 0 .0 9 4 M e V f rom T h - 2 3 4 o r 1 .0 0 1 M e V f rom P a - 2 3 4 m *
B- l .-
--

-
Th-232 0.911 MeV from AC-228* Th-228 0.583 MeV from Tl-208*
*Secular equilibrium was assumed.
Spectra were also reviewed for the presence of other radionuclides.
Alpha Spectroscopy
Aliquots of soil were acidified and evaporated to dryness. The residues
were then dissolved by pyrosulfate fusion and precipitated with barium sulfate.
The barium sulfate precipitates were redissolved and uranium and thorium were
separated by liquid - liquid extraction, precipitated with a cerium fluoride
carrier, and counted using surface barrier detectors (ORTEC), alpha
spectrometers (Tennelec), and an ND-66 Multichannel Analyzer (Nuclear Data).
Uncertainties and Detection Limits
The uncertainties associated with the analytical data presented in the
tables of this report, represent the 95% confidence levels for that data.
These uncertainties were calculated based on both the gross sample count levels
and the associated background count levels. When the net sample count was less
than the 95% statistical deviation of the background count, the sample
concentration was reported as less than the detection limits of the procedures.
Because of variations in background levels and Compton contributions from other
radionuclides in samples, the detection limits differ from sample to sample.
Additional uncertainties of + ‘6 to lo%, associated with sampling and laboratory
procedures, have not been propagated into the data presented in this report.
Calibration and Quality Assurance
Laboratory and field survey procedures are documented in manuals developed
specifically for the Oak Ridge Associated Universities' Radiological Site
Assessment Program.
-- B-2
C
With the exception of the measurements conducted with portable gamma
scintillation survey meters, instruments were calibrated with NBS-traceable
standards. The calibration procedures for the portable gamma instruments are
performed by comparison with an NBS caltbrated pressurized ionization chamber.
Quality control procedures on all instruments included daily background
and check-source measurements to confirm equipment operation within acceptable
statistIca fluctuations. The OBAU laboratory participates in the EPA and
DOE/EML Quality Assurance Programs.
B-3 I-

APPENDIX C
NUCLEAR REGULATORY COMMISSION GUIDELINES FOR RESIDUAL CONCENTRATIONS
OF THORIUM AND URANIUM WASTES IN SOIL

-
C
I
-
Guidelines For Residual Concentrations Of Thorium
And Uranium Wastes In Soil
On October 23, 1981, the Nuclear Regulatory Commission published in the Federal Register a notice of Branch Technical Position on "Disposal or Onsite
Storage of Thorium and Uranium Wastes from Past Operations." This document
establishes guidelines for concentrations of uranium and thorium in soil, that
will lim it maximum radiation received by the public under various conditions of
future land usage. These concentrations are as follows:
Maximum Concentrations (pCi/g)
Material for various options
la 2b 3c 4d
Natural Thorium (Th-232 + Th-228) with daughters present and in equilibrium 10 50 -- 500
Natural Uranium (U-238 + U-234) with daughters present and in equilibrium 10 -- 40 200
Depleted Uranium: Soluble Insoluble 35 100 -- 1,000
35 300 -- 3,000
Enriched Uranium: Soluble Insoluble 30 100 -- 1,000
30 250 -- 2,500
aBased on EPA cleanup standards which lim it radiation to 1 m rad/yr to lung and 3 m rad/yr to bone from ingestion and inhalation and 10 pR/'h above background from direct external exposure.
bBased on lim iting individual doses to 170 m rem /yr. CBased on lim iting equivalent exposure to 0.02 working level or less. dBased on lim iting individual doses to 500 m rem /yr and in case of
natural uranium, lim iting exposure to 0.02 working level or less.
.- C-l
----. - -._ -_--. ____ ~. .~

Option 1 concentrations permit unrestricted use of the property and is the
guideline applicable to surface soils. Options 2, 3, and 4 apply to buried
wastes and assume that intrusions into the burial sites may occur. Regardless
of the concentrations in the buried materials, surface soil must meet the
Option 1 concentrations guidelines.
c-2
_.. . . . .-_.- -~